Article

Optimization of the Concentrated Inspection Campaign Model to Strengthen Port State Control

1
Department of Marine Engineering, National Taiwan Ocean University, Keelung City 202301, Taiwan
2
Department of Merchant Marine, National Taiwan Ocean University, Keelung City 202301, Taiwan
*
Author to whom correspondence should be addressed.
J. Mar. Sci. Eng. 2023, 11(6), 1166; https://doi.org/10.3390/jmse11061166
Submission received: 5 May 2023 / Revised: 29 May 2023 / Accepted: 30 May 2023 / Published: 1 June 2023
(This article belongs to the Special Issue Risk Assessment and Management in Complex Marine Systems)

Abstract

:
The concentrated inspection campaign (CIC) is a derivative of the port state control (PSC) supplement, which is a fixed single series of deficiency inspections performed for three consecutive months at the end of each year. This study used grey relational analysis (GRA) and the technique for order preference by similarity to ideal solution (TOPSIS) to analyze the data of 71,376 deficiency records with 496 deficiency codes and 21 ship types in the Paris MoU for the last three years so as to improve the existing focus inspection pattern, which uses only the most accumulated number of deficiency series of the previous year’s PSC inspection. It also combines the three-sigma rule to find the inspection items most likely to be found as deficient by the port state control officer (PFSO) of the member country and creates a new rolling CIC scheme with deficiency inspection data for the last three years, which can filter out the significant deficiency codes with high numbers of deficiency inspections and use them as a modified CIC. It can not only solve the existing CIC’s lack of thoroughness, but also avoid the problems of missing important inspection codes, missing substandard ships, and failing to meet the inspection consensus. The new CIC inspection mechanism created in this paper can indeed identify potential substandard ships more effectively and fill the inspection gap of the existing port state control.

1. Introduction

The port state control (PSC) mechanism was created to control the impact of substandard ships on the safety of navigation and the marine ecosystem. Expanding from the initial regional MoU, there are now nine regional agreements on port state control worldwide: Paris MoU (Europe and the north Atlantic), Tokyo MoU (Asia and the Pacific), Acuerdo de Viña del Mar (Latin America), Caribbean MoU (Caribbean), Abuja MoU (West and Central Africa), Black Sea MoU (the Black Sea region), Mediterranean MoU (the Mediterranean), Indian Ocean MoU (the Indian Ocean), Riyadh MoU, and the only national PSC in the world: United States Coast Guard [1]. The most important task of PSC is to confirm the seaworthiness of the ship, but the main responsibility for the seaworthiness standard of the ship lies with the flag state, while the responsibility of the port state is to determine the substandard ships that do not have seaworthiness to maintain the safety of navigation and a clean marine environment.
In addition to the original PSC mechanism, the regional MoU inspection mechanism for inbound foreign ships also needs to measure the professionalism of PSCO and the differences in the criteria for determining deficiencies, so two auxiliary mechanisms have been extended: the concentrated inspection campaign (CIC) and the new inspection regime (NIR) [2,3]. The PSC inspection mechanism is a random sampling inspection of all deficiency codes. CIC is a fixed single series of inspection mechanism, from September 1 to November 30 of each year, which can increase the PSCO’s familiarity with the annual CIC inspection series and reduce the difference in judgment standards. The series with the highest number of deficiency statistics from last year is chosen as the inspected series announced in the present year; if the series of deficiencies happens in the port of a regional MoU member country in the following year, it will be more likely to be detained. For example, in 2022, the CIC priority inspection series will be the one with the highest number of PSC deficiencies in 2020 for that regional MoU. It will be announced among the regional MoU member countries in 2021, and the series will be concentrated in 2022. NIR is the result of the previous PSC inspection, together with general factors (ship type, flag state, performance of the authorized organization, and performance of the company’s ISM management) and historical factors (number of deficiencies and detentions), and is used to classify low-, standard-, and high-risk ships and to allow these inspected ships a time interval for the next sampling inspection. NIR (Paris MoU officially implemented the first NIR mechanism in the world on 1 January 2011) can also avoid unnecessary interference with low-risk ships and focus on high-risk ships, but it does not measure or adjust by the PSC deficiency codes, so it has a limited scope for blocking high-risk ships.
Although regional MoUs have the same basis for ship selection, the implementation is different, e.g., CIC was only jointly implemented globally in 2018, and there are few synchronization agreements between the regions to adjust for common deficiencies, e.g., Paris MoU implemented CIC in 2002, followed by Tokyo MoU, but only in 2015 did they decide to cooperate on CIC. NIR is not implemented in all MoUs, and the inspection interval between low-risk and high-risk ships varies greatly, from 1 to 24 months. It is clear from the above that although regional MoUs have the basis for global information integration, the information and implementation are not consistent.
Although PSC can find many substandard ships, there are still leakage situations, so CIC and NIR are needed to assist the inspection mechanism. However, NIR is for each ship that has been inspected by PSCO to set the next inspection schedule. If a ship is inspected with deficiencies, depending on the number of deficiencies, the reinspection period is shortened to 1 to 6 months, which can effectively improve the seaworthiness of the ship. In contrast, ships that are inspected without deficiencies are allowed 12 or even 24 months under the NIR system before they are inspected again by PSCO. This process makes it difficult to ensure that the ship has sufficient seaworthiness during the uninspected period, creating the risk of a hidden potential substandard ship. CIC is for all ships entering or leaving the port, regardless of whether the ship has been subject to PSCO inspection or NIR inspection at any time. For CIC, the ships selected between September and November each year are subject to the regional memorandum of all member countries from the previous year that showed the most PSC deficiency series. Therefore, if a ship has been previously set up as a long-period inspection type by NIR, the seaworthiness of the ship can be checked again by CIC, and it can be determined whether the ship becomes substandard.
The Paris MoU database is used because it was the first in the world to implement the PSC system and CIC measures, and now has the largest number of member countries and the largest number of countries that are repeat participants in other PSC MoUs. Recently, some scholars used GRA [4] and TOPSIS [5,6,7] to analyze port state control issues, but no one has used the three standard deviations (Section 2) to find important high-frequency PSC inspection deficiencies. Different from other literature (Section 2), the study used GRA and TOPSIS to analyze all PSC inspections for deficiency items rather than grouping all inspections within the same deficiency series into a single unit of analysis for deficiency category analysis, and the three standard deviations method was added in this paper to obtain important high commonality check deficiency items in different countries, regions, and PSCOs (Section 3 and Section 4). Therefore, the framework of this study focused on CIC inspections of PSC in the Paris MoU region, identified the inspection blind spots of the current single CIC implementation model, and used the rolling deficiency inspection data to additionally identify significant deficiency inspection details that have long been overlooked under the established CIC inspection mechanism (Section 4). Taking into account all of the currently defined inspection items, ship types, and additional inspection consensus factors, this paper attempts to establish a composite CIC inspection mechanism, rather than implementing the original model of a single series of deficiency codes that should be highlighted (Section 5), and tries to establish original new CIC deficiency code focus inspection measures, not only to ensure ship seaworthiness again, but also to prevent potential substandard ships, so as to more effectively implement the strength and tension of the PSC. Finally, in addition to summarizing the contributions of this study, further research proposals are proposed to strengthen the joint CIC implementation and cooperation among PSC MoUs worldwide (Section 6).

2. Literature Review

PSC originated from the Paris MoU, and its inspection mechanism and auxiliary enhancement measures have been emulated or referred to in other regional memorandums. As mentioned in the previous chapter, due to the rigor and credibility of the Paris MoU in performing PSC, this paper analyzes the PSC inspection deficiency database of the Paris MoU from 2018 to 2021. Before discussing how to optimize the PSC inspection measures, this paper first compiles the studies related to PSC issues from 2018 to 2022, and finds that most of the literature focuses on the selection of PSC inspected ships, the analysis of PSC detention, the correlation between PSC detention and deficiency codes, ship risk assessment, PSC inspection intervals, and ballast water management.

2.1. Selection of PSC Inspected Ships

It is important to select and inspect substandard ships effectively under the regular PSC inspection mechanism in port countries. In recent years, most of the PSC databases on this research topic have been based on Paris MoU, Tokyo MoU, and Hong Kong (ranked ninth in the world in terms of container port throughput and the hub port of maritime transportation in East Asia), using quantitative models to identify the key elements of the selection of substandard ships, generally improve the existing ship selection mechanism or in part, and enhance the identification capability of substandard ships.
  • Local improvement of the existing ship selection mechanism:
Yan, R. et al. [8] improved the ship selection mechanism with a low detention rate by using the balanced random forest (BRF) and deficiency data from 2016 to 2018 in Hong Kong. Gerrit Jan de Bruin et al. [9] used Paris MoU deficiency data from 2014 to 2018, and the existing ship selection mechanism was amended with a machine learning classifier to improve the fairness of the inspected ship selection.
2.
Improving identification of substandard ships:
Shuaian Wang et al. [10] identified substandard ships with a tree augmented naive Bayes classifier (TAN) using Hong Kong deficiency records of 250 ship inspections in 2017; Wang Y. et al. [11] used Tokyo MoU deficiency records from 2014 to 2018 to effectively predict inspected ships with Bayesian networks.
3.
Overall optimization of the ship selection model:
D. Dinis A.P. Teixeira and C. Guedes Soares [12] used Bayesian networks to optimize the ship selection model with the Paris MoU database; Ran Yan et al. [13] improved the accuracy of an existing substandard ship prediction model by incorporating Hong Kong’s flag state, RO, and company performance from 2016 to 2018 into the XGBoost model; Ran Yan and Shuaian Wang [14] improved the accuracy of an existing substandard ship prediction model by incorporating Hong Kong’s PSC inspection data from 2016 to 2018 into the XGBoost model. Ran Yan and Shuaian Wang [15] used the i-Forest model to develop a prediction model of substandard ships with a PSC inspection deficiency database for Hong Kong from 2015 to 2019.
4.
Identifying critical elements for the selection of substandard ships:
Gerrit Jan de Bruin et al. [9] used Paris MoU deficiency data from 2014 to 2018 to identify important deficiency elements of substandard ships in recent years with a machine learning classifier. Wu, Shubo et al. [16] used a dual quantization model using a feature selection scheme (FSS) and support vector machine (SVM) to give composite elements to PSCO for identifying ships that should be inspected. Junjie Fu et al. [17] used the Tokyo MoU PSC inspection deficiency database from 2014 to 2018, employing the dual quantization model of the optimized analytic hierarchy process (AHP) and the naive Bayes model to aid PSCO in identifying ships that should be inspected.

2.2. Analysis of the PSC Detention Ship Deficiency

Port entry ships selected using the PSC selection inspection mechanism and PSC deficiencies opened by PSCO must be corrected before they can leave the port. If the PSC inspection deficiencies cannot be rectified immediately or are considered serious, the ship will be detained in the port. As a result, the majority of research in this field focuses on improving the efficiency of PSC inspection and avoiding ship detention, the deficiency codes that cause ship detention, and the correlation between the deficiency codes that cause detention to improve the efficiency of ship detention.
  • To improve the efficiency of PSC inspection and avoid ship detention, Ran Yan et al. [13] used Smart Predict then Optimize (semi-SPO) to improve the efficiency of PSCO inspection and avoid ship detention with limited resources. Ran Yan et al. [18] used the association rule to find the correlation between deficiency codes in the PSC inspection of detained ships to improve the efficiency of PSCO inspection. Ke-Zhong Liu et al. [19] used the Paris MoU PSC database from 2017 to 2020 and built a Bayesian-based machine learning approach model that was developed to find more efficient ways to avoid ship detention from the ship owner’s standpoint.
  • Critical elements from PSC inspections of ship detention: Through traditional statistical analysis of Black Sea MoU deficiency records from 2012 to 2017, Şengül Şanlıer [20] identified 10 critical elements of PSC inspection of ship detention. Li-Xian Fan et al. [21] used Tokyo MoU deficiency records from 2000 to 2016 to first set 23 PSC inspection deficiency categories and parameters such as ship age, gross tonnage, and ship type, and then used Bayesian networks to explore the PSC inspection deficiency elements related to ship accidents. Ji-Hong Chen et al. [4] calculated the weight of the deficiency item factor for PSC ship detention using the entropy weighting method and GRA with the annual report of Tokyo MoU from 2008 to 2017. Chien-Chung Yuan et al. [22] cited the database of PSC inspection deficiency items and causes of ship detention in Keelung, Kaohsiung, and Hualien ports from 2015 to 2018 and analyzed 18 types of PSC inspection deficiency for ship detention using cause-and-effect analysis. Zhu, J. H. et al. [23] used inspection data from Paris MoU and Tokyo MoU to project the critical deficiency items that affect inspectors’ opening of ship detentions by using a cloud-based big data model with a subjective in-decision-maker’s rule of thumb.
  • The correlation between deficiencies in PSC inspection of ship detention: Ming-Cheng Tsou [24] used the Tokyo MoU PSC inspection database from 2000 to 2016 to find the correlation among deficiency codes and the combination of PSC inspection items with causal correlation using association rule mining techniques. Ran Yan et al. [18] identified the correlation between deficiency codes of detained ships using the association rule model. Ji-Hong Chen et al. [4] identified the correlation between deficiency items for PSC ship detention using the entropy weighting method and GRA with annual report data of Tokyo MoU from 2008 to 2017. Junjie Fu et al. [25] used the Tokyo MoU deficiency database from 2014 to 2018 to calculate the likelihood of simultaneous occurrence of different PSC deficiency codes through the data quality procedure enhanced apriori algorithm (DQCPEA) model and the correlation between items. Çelik, B. and Çakır E. [26] collated 12 deficiency types using data examined from 2018 to 2021 in the Black Sea MoU with entropy-based grey relation analysis and association rule mining (ARM) methods. Examining the frequency of detection of different deficiency types before and after COVID-19 demonstrates the close relationship between ISM and DoC (Document of Compliance) during an epidemic, and suggests a response plan for PSC during a pandemic.

2.3. The Correlation between Ship Types and Deficiency Codes for PSC Ship Detention

Yu-Li Chen et al. [27] used the Paris MoU deficiency database from 2014 to 2020, with correlation analysis of 6 ship types (general cargo, bulk carrier, container, chemical, roll-on/roll-off, and tanker) and 19 PSC inspection deficiency series. Wu-Hsun Chung et al. [28] analyzed the correlation between PSC inspection deficiencies in three ship types (general cargo, bulk carrier, and oil tanker), association of classification societies, and flag states from 2003 to 2013 in the PSC detention database of Keelung, Taichung, Kaohsiung, and Hualien ports only and identified PSC inspection deficiencies that helped PSCO enforce ship detention implementation.

2.4. Ship Risk Assessment

On the subject of increasing PSC’s ability to identify high-risk ships, some scholars are looking for ship risk indicators from historical databases or through the PSC’s auxiliary NIR inspection model to identify possible substandard ships and those that have been detained, thereby assisting the PSC in performing risk control actions on ships.
  • Ship Risk Assessment Indicators:
Zhisen Yang et al. [6] used a Bayesian network and TOPSIS methods to identify high-risk ship factors and construct a ship detention risk management model to assist PSCOs in controlling substandard ships and assist shipowners in reducing the risk of ship detention. Jose Manuel Prieto et al. [29] used the records of 17,880 inspections in the top 10 EU ports of Paris MoU from 2013 to 2018 to generate more than 600,000 datasets from X-STATIS as a ship risk indicator to determine the priority of PSC inspections and to measure the flag risk profile. QingYu et al. [30], also referring to Paris MoU’s PSC inspection database, used Bayesian networks and evidential reasoning methods to assess the dynamic and static risks of incoming ships and to identify key elements of hazardous conditions in the water to assist in risk prevention, mitigation measures, and local maritime traffic management. Ran Yan et al. [31] used tree augmented naive Bayes and BRF methods to combine the number of inspection deficiencies and the probability of being detained into a predictive combination model to evaluate and select high-risk ships for PSC inspection based on the number of ship deficiencies and ship detention rate data from Tokyo MoU.
2.
Improved NIR Inspection Mode:
PSC’s latest inspection method is NIR, which helps PSCO quickly select high-risk vessels for PSC inspection to prevent substandard ships from endangering navigation safety and marine ecosystems. First, Zhisen Yang et al. [32] examined the difference before and after the implementation of the NIR inspection system in Paris MoU by the Bayesian network model method using Paris MoU online public data, and found that the implementation of NIR could improve the PSC inspection mechanism. Yi Xiao et al. [33] mentioned that there are ten memos and three types of PSC inspection methods in the world and used the Malmquist production index (MPI) to bring the deficiency data of PSC inspection for the past 11 years from each memo into the DEA’s Super-Slacks-Based Measure (Super-SBM) to solve the PSC inspection effectiveness ranking of the 10 memos, and the new PSC NIR inspection method was found to be superior to other methods. Second, Jian-Hung Shen et al. [5] used mathematical models such as F-IPA, TOPSIS, and MCDM to identify inbound high-risk ships based on the deficiency data of Tokyo MoU inspections from 2014 to 2018 to improve the current NIR approach to ship risk assessment. In addition, Yi Xiao et al. [34] used 125,259 inspection deficiencies of Tokyo MoU from 2015 to 2017 and used binary logistic regression and multifactor decision-making analysis to determine that NIR can combine the age, ship type, flag state, and number of PSC inspection deficiencies of inbound ships. It is also known that if a ship is more than six years old and has more than five inspection deficiencies, it is more likely to be a substandard ship with a high risk.
From the aforementioned literature, the quantitative methods for evaluating ship risks include Bayesian networks, evidential reasoning, X-STATIS, tree augmented naive Bayes, BRF, binary logistic regression, multifactor decision-making analysis, TOPSIS, F-IPA, MCDM method, etc., to determine the selection criteria and indicators for high-risk ships, and some scholars have also studied the possible hazard scenarios of high-risk ships.

2.5. Other Literature on Exploring PSC

First, Jiayu Bai and Chenxing Wang [35] propose that regional PSC MoUs should include ships navigating in polar waters, especially ocean-going fishing ships operating in polar waters, to ensure the safety of navigation in polar regions and the compliance of ships with pollution prevention requirements. Helena Uki’c Boljat et al. [36] used the inspection records of PSC MoUs around the world from 2014 to 2018 to compare and analyze the deficiency records of PSC inspections of the MARPOL Convention and its six appendices through statistical chi-squared tests and correlation analysis. The data are used to determine the common deficiencies of the world fleet in the prevention of pollution from ships to suggest that the PSC MoU in each region strengthen the PSC inspection deficiency. Cakir, Erkan et al. [37], using USCG data on maritime incidents involving oil spills from 2002 to 2015, determined that ship type and incident type are key elements of oil pollution, so the PSC of inbound ships regarding MARPOL should be strengthened. Second, Mohd Tarmizi Osman et al. [38] used 8089 data points from Tokyo MoU in 2015–2019 to explore the correlation between the way PSC inspections are performed and the detection of deficiencies and detained ships in five major Malaysian ports using the apriori algorithm to improve Malaysian PSCO inspection methods. Because of the limited resources to perform PSC, to respond to the PSCO inspection methods for both scheduled and unscheduled ships in the ports, Ran Yan et al. [7] proposed performing two sets of PSC inspection methods based on the ship data and PSC inspection records of eight major ports in China (Dalian, Tianjin, Qingdao, Shanghai, Ningbo, Xiamen, Shenzhen, and Guangzhou) in 2018, with scheduled ships using the existing fixed PSC inspection method and the PSC inspection method being different for nonscheduled ships, which could effectively increase the PSC inspection rate. Esma Gül Emecen Kara [6] used the TOPSIS method to analyze the deficiency pattern of ships from more than 200 flag states worldwide with reference to the annual reports of nine regional PSC MoUs and the U.S. Executive PSC from 2017 to 2019, so that the flag state can be used first for the selection of priority ships for PSC inspection, but the relevance of the deficiency code to the flag state was not explored in the paper. Yi Xiao et al. [39] also explored the importance of selecting priority ships for inspection by using deficiency data from PSC inspection with game theory for the limited resources of PSC inspection. From the port state, flag state, and shipowner tripartite analysis, it was found that the use of the flag state in the deficiency situation to distinguish the inspected ships helped the port state quickly find substandard ships and perform the PSC inspection.
In addition, Lixian Fan et al. [40] used the deficiency data of Tokyo MoU inspection from 2000 to 2018, used a Bayesian network model to explore the deficiency items and ship accident risk to assess the ship safety level, and adjusted the ship risk assessment level to determine the optimal interval for each ship to be inspected. The optimal interval for each ship to be inspected was between 120 and 240 days. Lixian Fan et al. [41] collected Tokyo MoU deficiency data from 2000 to 2018, Paris MoU deficiency data from 1999 to 2018, and Indian MoU deficiency data from 2002 to 2018, and analyzed the Sulfur Emission Control Areas (SECAs) control measures using the DID Approach model, which can help to locate PSC inspection items and control ships’ deficiency items. Chien-Chung Yuan et al. [42], after considering the inspection methods of Tokyo MOU and Paris MoU and interviewing experts and scholars, used the AHP method to determine that the personal factors of PSCOs in Taiwan were the most influential in performing PSC inspections at ports in the region. Ran Yan et al. [43] analyzed the relationship between the local epidemic and PSC inspection status from PSC MoUs worldwide or regionally in 2020 by a regression analysis method and found that COVID-19 had an impact on PSC inspection. Efe Akyurek and Pelin Bolat [44], using Paris MoU deficiency data from 2015 to 2020, used comparative analysis, entropy-based grey, and relevance analysis to find how the COVID-19 outbreak affected the rate and number of deficiency inspections in Paris MoU. However, it was found that there was no significant change in the detention rate of deficient ships, which led PSCO to increase the emphasis on cabin cleanliness inspections. Efe Akyurek and Pelin Bolat [45] analyzed the number of Safety of Life at Sea (SOLAS) and Fire Safety Systems (FSS) ship detentions and the ship detention rate by AHP using PSC inspection deficiency data for 15 EU countries of Paris MoU from 2013 to 2019. The number of deficiencies and the rate of ship detention were combined with GIS to show the areas where ships are detained and the ports of arrival and departure, which will help the 15 countries strengthen the direction of PSC inspections for substandard ships. Öztürk, O.B. and Turna, I. [46] found, from the major inspection deficiencies of Paris MoU and USCG from 2015 to 2020 and 2016 to 2020, respectively, that radio deficiencies should be effectively improved by means of legislative requirements.
According to Section 2.1, Section 2.2 and Section 2.3, Section 2.4 and Section 2.5, there is no comprehensive PSC inspection method based on the PSC inspection series combined with the selection of deficiency inspection codes for high-risk ships in the collected literature, which provides a topic for PSCOs to perform CIC execution-focused inspections. Most of the literature on PSC inspection focuses on PSC selection mechanisms, NIR implementation modes, high-risk ships, ballast water management, PSC implementation focus directions, etc. The CIC system for auxiliary PSC inspection has not yet been explored and improved. Overall, the main comparisons between the relevant literature and this paper on the optimization of the CIC inspection mode are as follows:
  • Examine the effectiveness of current and historical CIC enforcement items in combating substandard ships.
From the referenced literature, we did not find any discussion on the effectiveness of CIC. In this paper, the deficiency codes selected by GRA, TOPSIS, and the three-sigma rules were compared with the historical data of CIC to determine whether they were different from each other. If they were not the same, the important PSC deficiency series or their items were not listed as the target of CIC at the corresponding time.
2.
PSC inspection items are numerous and multifaceted; PSCO professionalism and law enforcement awareness are not the same.
This paper used GRA and TOPSIS to solve the problem of the unfairness of different deficiency series for the same benchmark so that out of all PSC inspection series in the appropriate different benchmarks, using the most appropriate composite series of CIC inspection code combinations, PSCOs with corresponding expertise could be dispatched to carry out inspections or teach each other because the inspection content has been effectively limited, and the expertise of the personnel can facilitate the rapid exchange of the deficiency inspection skills or key, so that PSCOs in the conditions of limited human resources can more efficiently implement PSC inspection.
3.
The focus of CIC inspection is a single series, and the decision is made by using the largest number of deficiency data from the previous year’s PSC inspection, so the execution of the CIC inspection is not prompt. This research method can be built mathematically or with corresponding software, and the top three items with the highest number of deficiency records in each of the last three years can be entered into the rolling CIC inspection system to solve the problem of timeliness.
4.
The focus on the cumulative number of major deficiency items in PSC is concentrated into a single or a few deficiency series every year. It is easy for minor common deficiencies to pass detection if the composite CIC deficiency code check series is not used.
This paper uses GRA and TOPSIS to solve the unfair problem of the same benchmark and different deficiency series so that all PSC inspection series can be in the composite CIC inspection code combination, which is difficult and quickly detected by inspection.
From the above references, Zhu, J. H., Yang, Q., and Jiang, J. [23] applied the CRITIC (criteria interaction through the intercriteria correlation) method to try to determine the majority of PSCOs’ discretionary thinking in the decision to detain ships. However, the main deficiency code items for the inspection of ships detained by PSCOs in all member countries of Tokyo MoU in 2021 were not investigated, so this study will later introduce GRA, three standard deviations, to investigate this situation. Çelik, B. and Çakır E. [25], who investigated the changes in the relationship between pre- and post-epidemic deficiency series (during the epidemic, there were many inspections that were not easy to perform), the response plan was not mature, the actual number of effective inspections decreased significantly, and even physical inspections were cancelled and replaced by formal inspections. All of the deficiency codes contained in the 12 deficiency series were listed and analyzed. Öztürk, O.B. and Turna, I. [46] referenced four to five consecutive years of deficiency inspection records to confirm that although radio was not the most frequent deficiency item per year, it was the most frequent major deficiency item in the cumulative years of deficiency events. This research paper provides an opportunity to examine whether the use of rolling data for the last three consecutive years is better than the use of a single series of the highest frequency deficiency in the previous year in the existing CIC, and whether the use of consecutive years is worthwhile. To this end, the difference between this study and other research literature is that all ship types, deficiency codes, and the inspector consensus for consecutive years were included in the quantitative module (Table 1).
As shown in Table 1, this paper not only adopts the deficiency ship types (21 types) and PSC inspection deficiency codes (496 deficiency items have occurred) measured by many scholars to explore the mechanism of PSC inspection, but also incorporates the consensus factors of PSCO inspection, the first inspection blind spot of the existing CIC mechanism, and is the first PSC study to propose a rolling CIC inspection mechanism and a complex focus on deficiency inspection.

3. Methodology

The incoming foreign ships selected for CIC inspection are found to have PSC deficiencies that cannot be predicted in advance and have grey theory characteristics. In addition, PSCO has different criteria for identifying deficiencies for all PSC inspection series, so TOPSIS and the three-sigma rule will be used to discuss and analyze the situation.

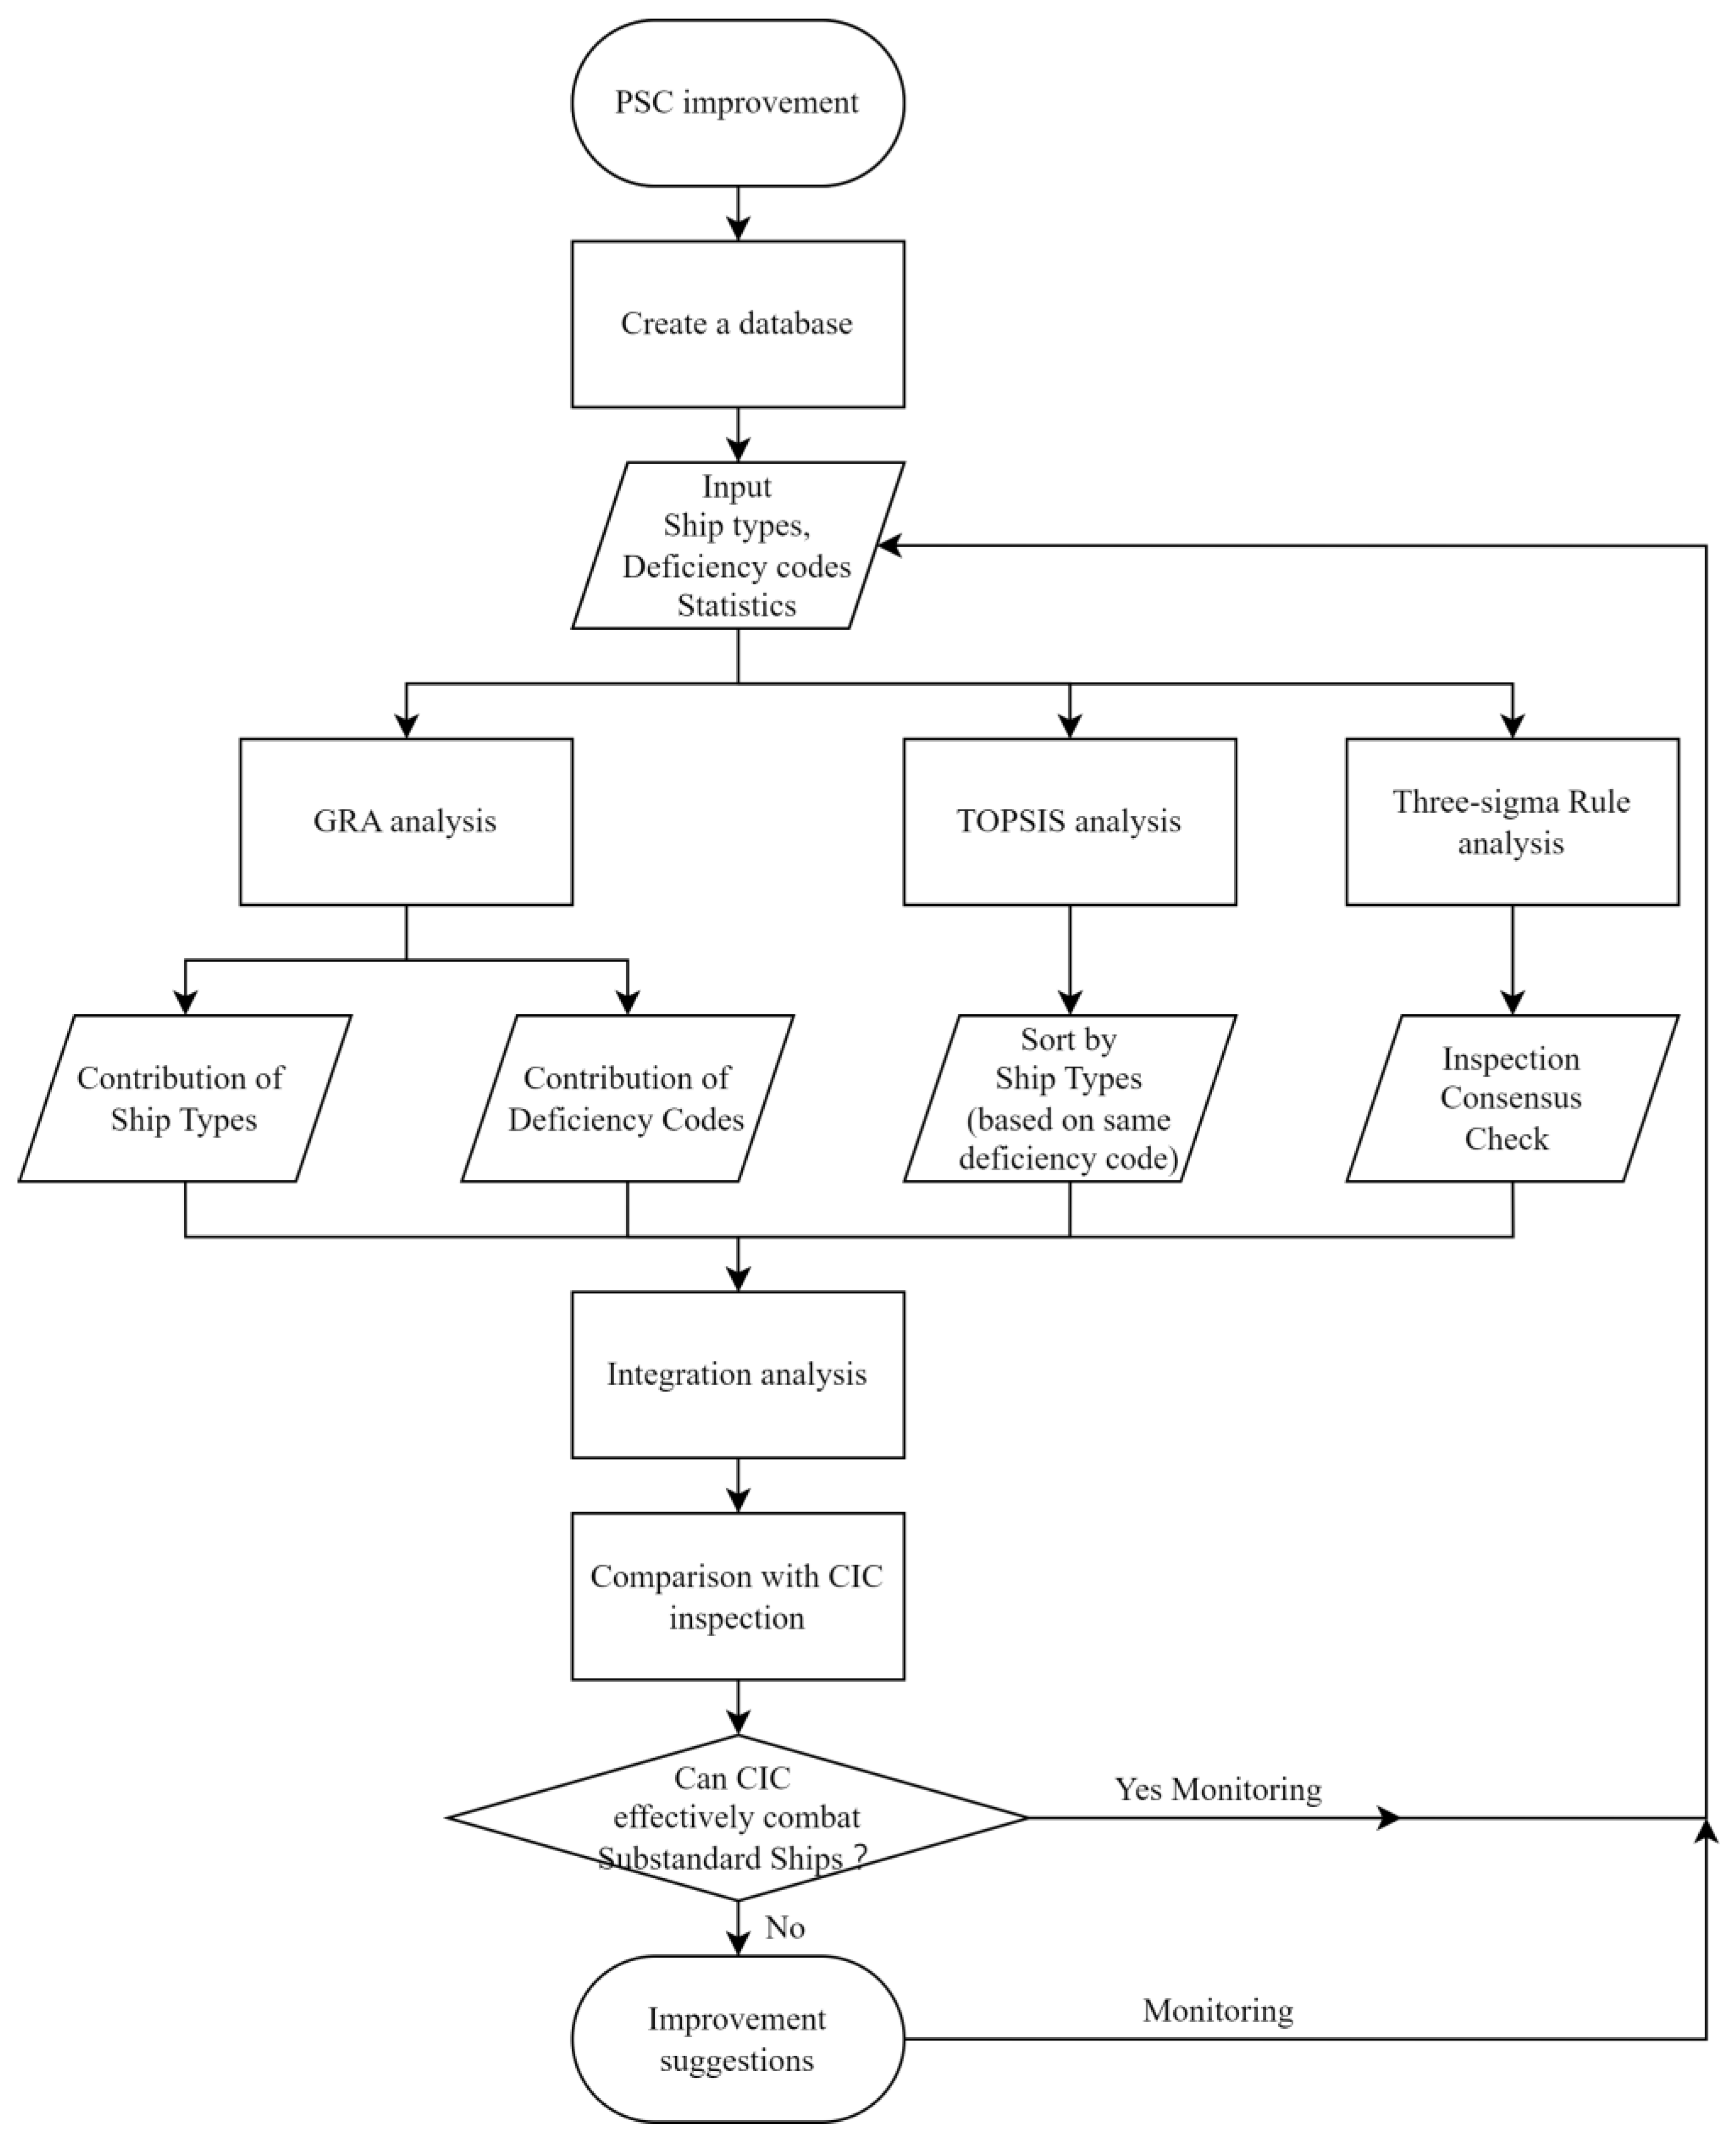
3.1. Study Overview (Figure 1)

This study was conducted by Paris MoU from 1 November 2018 to 31 October 2021 (36 months), resulting in a total of 71,376 PSC inspection deficiency records, of which the list of deficiency codes released in July 2021 was used due to the update and deactivation of deficiency codes, making the current valid records 70,746 records [2]. To understand the contribution of ship types and deficiency codes to deficiency records, we used GRA to analyze different ship types based on the deficiency codes and the occurrence rate of time and different deficiency codes based on the occurrence of time and ship types. In addition, TOPSIS is used to understand specific ship types, and the same deficiency code basis is used as a premise to obtain the priority inspection ranking of all ship types. The results of GRA and TOPSIS are supplemented with each other to arrive at the key inspection target, which is used as a basis to examine whether CIC’s inspection items can effectively improve substandard ships and provide PSCO with a new composite inspection series.
Finally, a three-sigma rule was used to analyze all deficiency series items opened by PSCOs of PSC MoU member countries, for which the inspection of deficiency items had a higher frequency of enforcement of the consensus situation. At the same time, we checked whether the easily opened deficiency items and the existing implementation of CIC inspection series of items were consistent to facilitate subsequent adjustments to improve the inspection measures into a composite CIC inspection measure.
Figure 1. Research flow chart.
Jmse 11 01166 g001

3.2. Grey Relational Analysis

Grey relational analysis (GRA) is a triple quantization module of grey system theory, which is a system science theory proposed by Ju-Lung Tang in 1982 [47] to analyze the degree of correlation between factors for known trace information. The main basic conditions for applying the three modules of grey system theory are as follows: the information input to the module can be irrelevant, the feasible solution is not unique, the full content of the information is not needed, and the analysis of some unknown information is allowed, i.e., GRA can manage both known and unknown information, and the data characteristics of this paper are in accordance with the characteristics of GRA.
GRA has six criteria principles [48], which are difference information principle, principle of solution nonuniqueness, analysis of available minimal information, acknowledgment of the principle, new information priority principle, and the principle of grey indestructibility. In the difference information principle, there is a difference in the PSC deficiency information, which represents its difference and correlation under different time periods, deficiency codes, ship types, and other factors. Principle of solution nonuniqueness, the systematic mechanism of PSC deficiency inspection, human judgment of PSCO, and other factors have the characteristic of nonuniqueness of information and bind uniform grey targets. For analysis of available minimal information, due to limited resources, PSC inspection is a random inspection mechanism, and the number of inspections will be significantly reduced due to unexpected events (e.g., COVID-19). GRA can perform calculations and analyze characteristics with small samples or minimal information. Acknowledgment of the principle and recognition for the implementation of the inspection mechanism is frequently based on statistical data in the PSC inspection database. For example, the common deficiency codes and types in the annual report will be listed by PSCO as a priority inspection. For the new information priority principle, under the requirement of the PSC policy to remain relevant, the deficiency codes and inspection items of PSC are constantly revised or added. Even if the cumulative information added by the revision is insufficient, the quantity module of GRA can still calculate and analyze this information first. The principle of grey indestructibility, PSC deficiency inspection mechanism factors have relative, temporary, and social cognitive change characteristics, and regardless of whether the code mechanism is ideal or part of the failure to provide absolute proof, it still has the ability to point out the risk. Therefore, as long as there is a part that does not meet the legal requirements, it is a PSC deficiency, and the PSC inspection results are in line with the principle of greyness.
Steps for calculating the grey correlation analysis:
Step 1: Determine the analysis sequence (need normalization process)
Reference sequence x 0 : System characteristic behavior sequence. This is the target sequence   x 0 , which is illustrated by two conditions in this study, the substandard ships that should be inspected with priority and the deficiency codes that should be inspected with priority. When the target sequence x 0 is a substandard ship, the comparison sequence x i is the ship type and the evaluation indicator i is the PSC codes. When the target sequence x 0 is a deficiency code, the comparison sequence x i is the inspection code type and the evaluation indicator i is the ship type.
x 0 = x 0 1 ,   x 0 2 ,   ,   x 0 k   ,   x 0 n
Comparison sequences x i : sequences of correlation factors, each information sequence contains n elements and satisfies the set X (At least three indicators and at least two sequences).
x i = x i 1 ,   x i 2 ,   ,   x i n ,   i = 1 ,   2 ,   ,   n
X = x i | x i = x i 1 ,     x i 2 ,   ,   x i k ,   x i n ,   n 3 ,   0 i m ,   m 2
Step 2: Calculate the absolute distance (difference series) Δ 0 i k .
The comparison sequence and the reference sequence are evaluated for the degree of compliance with the target. The larger the value of the difference series, the lower the degree of conformity of the comparison sequence x i to the reference sequence x 0 , and the lower the correlation between the final computational solution and the reference sequence x 0 . For example, if the target of the reference sequence x 0 is a substandard ship, the smaller the value of the calculated difference series, the more it conforms to the target of the reference sequence x 0 , and the ship type of the comparison sequence x i will be classified as the priority ship type for inspection.
Difference   series :   Δ 0 i k = x 0 k x i k
Maximum value for all difference series :   max   i max   k Δ 0 i k
Minimum value for all difference series :   min   i min   k Δ 0 i k
Step 3: Calculate the association coefficient γ
The degree of association value obtained for each comparison sequence x i   in each evaluation index. Distinguishing coefficient ξ and ξ 0 ,   1 .
r x 0 k ,    x i k = min   i min   k Δ 0 i k + ξ max   i max   k Δ 0 i k Δ 0 i k + ξ max   i max   k Δ 0 i k
Step 4: Calculate the correlation γ0i
The degree of relevance that is closest to the target or decision option for all grey evaluation indicators.
r 0 i = 1 n k = 1 n r x 0 k ,    x i k

3.3. Technique for Order Preference by Similarity to Ideal Solution

The technique for order preference by similarity to ideal solution (TOPSIS), first proposed by Hwang, C.L. and Yoon, K. [49], belongs to multicriteria decision analysis.
Step 1: Evaluation Matrix
In the D matrix, the evaluation object A is the ship type and the evaluation indicator E is the deficiency code, and the D matrix is used to solve which type of ship type is more likely to have PSC inspection deficiencies.
D = x i j m × n ,   i = 1 ,   2 ,   3 ,   ,   m ; j = 1 ,   2 ,   3 ,   ,   n
D = A 1 A m E 1 E n x 11 x 1 n x m 1 x m n  
Step 2: Regularization Evaluation Matrix
The numerical standardization does not change the distribution of data under each indicator of the original comparison series, and can eliminate the inconsistency between different attributes or samples, so that the standard deviation between different attributes in the same sample or the same attribute in different samples is reduced and scaled to the interval of [0, 1], which makes the computational data simple, consistent, stable, and operable in operation.
R = r i j m × n ,   i = 1 ,   2 ,   3 ,   ,   m ; j = 1 ,   2 ,   3 ,   ,   n
r i j = x i j i m x i j 2
R = r 11 r 1 n r m 1 r m n
Step 3: Weighted Regularization Evaluation Matrix
In general, PSC inspection is a random sampling inspection, without any bias is 1:1: … :1, so the weights ( w j ) are equal.
V = v i j m × n ,   i = 1 ,   2 ,   3 ,   ,   m ; j = 1 ,   2 ,   3 ,   ,   n
v i j = w j ·   r i j
V = w 1 r 11 w n r 1 n w 1 r m 1 w n r m n
Step 4: Positive and Negative Ideal Solutions
Obtain its affiliation in the same measured scale.
v + = max   i v i j | j B ,   min   i v i j | j C   |   i = 1 ,   2 , ,   m           = v 1 + ,   v 2 + ,   ,   v j + ,   , v n +    
v + = min   i v i j | j B ,   max   i v i j | j C   |   i = 1 ,   2 , ,   m           = v 1 ,   v 2 ,   ,   v j ,   , v n
Step 5: Distance of Positive and Negative Ideal Solutions
In the same measurement scale, a larger positive ideal solution distance s i + means farther away from the target, and a larger negative ideal solution distance s i means closer to the target.
s i + = j = 1 n v i j v i + 2 ,   i = 1 ,   2 ,   ,   m
s i = j = 1 n v i j v i 2 ,   i = 1 ,   2 ,   ,   m
Step 6: Relative Proximity
The larger the value of C i , the greater the connection target (as in the case of the substandard ships in this paper).
C i = s i s i + s i +   ,   0 C i 1 ,   i = 1 ,   2 ,   ,   m
Step 7: Sort (Values Ranking)
In this paper, we adopt the positive ideal solution approach, so the larger the value of C i in Equation (13) is, the more important the factor to the target or solution.

3.4. Three-Sigma Rule

Tchebysheff’s theorem can be applied to known or unknown disnormality data, while PSC inspections for deficiency records are disnormality data, for which a module of plus or minus three standard deviations (three-sigma rule) can be used in the preliminary analysis to measure approximately 100% of the data. Most of the overall data, 88.8%, are within plus or minus three standard deviations, which means that 11.2% of the overall data are beyond plus or minus three standard deviations.
σ = x x ¯ 2 n 1
σ : Standard deviation; x : Sample value; x ¯ : Sample value average; n : Number of sample values.
Standard deviation (SD) is a measure of the dispersion of the data mean, reflecting the degree of dispersion of a dataset, which can also be a measure of uncertainty. The larger the value of the standard deviation, the greater the degree of dispersion. The PSC inspection of deficiency items with more than plus or minus three standard deviations is a priority for PSCO to enhance the inspection, which is in line with the study to optimize the CIC inspection model (administrative and time management, six standard deviations).
If we examine the dataset of PSC deficiency records using plus or minus three standard deviations (SD), 269,797 out of every billion datasets can be considered as more likely to happen deficiency items; if we use the conditions of μ ± 4σ, μ ± 5σ, and μ ± 6σ, only 63,343, 574, and 2 out of every billion datasets can be considered as the more likely to happen deficiency items, respectively. Based on the aforementioned numerical logic of standard deviation and μ ± n × σ (where n = 3, 4, 5, 6), the larger the value of the PSC inspection items exceeding the μ ± 6σ range is, the more likely they are to occur and the greater the impact on the ship’s seaworthiness, and they are the PSC items that the PSCO must strengthen and prioritize. This simplified statistical logic, brought into the PSC inspection deficiency dataset, helps PSCO implement the CIC inspection mechanism. In addition, it is also possible to identify deficient items with a high degree of consensus based on different countries, regions, and law enforcement personnel.

4. Data Analysis

4.1. Information Collation

This study uses the Paris MoU, which, in addition to being the first to implement PSC and CIC, currently contains the largest number of member countries (27 member countries). Some countries will participate in more than one MoU, and Paris MoU is the one that covers the most multiple participating countries, such as Bulgaria, Canada, Romania, and the Russian Federation. It has the longest and most stable CIC implementation experience and has experience working with Tokyo MoU to implement CIC for the same series of deficiency items [2]. In addition, the deficiency database of Paris MoU has been used by a number of scholars in PSC studies (Yu, Q. et al. [30], Boljat, H. U. et al. [36], Liu, K. Z. et al. [19], Bruin, G. J. et al. [9], Akyurek, E. and P. Bolat [44], Dinis, D. et al. [12], Akyurek, E. and P. Bolat [45], Chen, Y. L. et al. [27]). So, using Paris MoU’s Key Performance Indicators (KPIs) as the source of data (Table 2), we compiled six categories, including time of occurrence, deficiency code, ship type, flag state, inspection agency, and inspection location, from 1 November 2018 to 31 October 2021 (36 months). Two different combinations of elements in each of the six categories were observed. This study first discusses the time of occurrence, ship type, and deficiency codes. Deficiency code and ship type original data (Table 2) will be brought into Section 4.2, Section 4.3 and Section 4.4 for the computational analysis and explanation, respectively. In this study, we measured the factors of technological upgrading and legal renewal of ship equipment, so we did not select long-term historical data, but used recent data for analysis.
From the database [2], a comparison chart of deficiency codes for each series was obtained. From the chart, we can see that if we compare the series, the series with the highest number of deficiency codes is 18000 (MLC2006, 11177) (Figure 2). If we discuss each series separately, we can see that in 01000 (Certifications and Documentation), 01314 (SOPEP, 915) is the most numerous (Figure A1); in 02000 (structural condition), 02108 (electrical installations seaworthiness, 570) is the most numerous (Figure A2); in 03000 (water/weathertight condition), with 03102 (freeboard marks, 582) the most (Figure A3); in 04000 (emergency systems), with 04103 (emergency, lighting batteries and switches, 840) the most (Figure 3); in 05000 (radio communication), with 05115 (radio log[diary] 321) the most (Figure A4); in 06000 (cargo operations including equipment), with 06105 (atmosphere testing instrument, 129) the most (Figure A5); in 07000 (Fire Safety), with 07105 (fire doors/openings in fire-resisting divisions, 1550) the most (Figure 4); in 08000 (alarms), with 08107 (machinery controls alarm, 239) the most (Figure A6); in 09000 (working and living conditions), with 09232 (cleanliness of engine room, 382) the most (Figure A7); in 10000 (safety of navigation), with 10116 (nautical publications, 828) the most (Figure A8); in 11000 (life-saving appliances), with 11117 (lifebuoys including provision and disposition, 722) the most (Figure A9); in 12000 (dangerous goods), with 12108 (personal protection, 52) the most (Figure A10); in 13000 (propulsion and auxiliary machinery), with 13102 (auxiliary engine, 728) the most (Figure A11); in 14000 (pollution prevention), with 14802 (ballast water record book, 479) the most (Figure A12); in 15000 (ISM), although there is only one deficiency code 15150, but there are many (Figure 5); in 16000 (ISPS), with 16105 (access control to ship, 530) the most (Figure A13); in 18000 (MLC 2006), with 18408 (electrical, 654) the most (Figure A14); in 99000 (others), with 99101 (other safety in general, 250) is the most frequent (Figure A15).
When there is a lot of data processing in a statistical chart that needs to be “compared”, a “tableau reference line” will be created. For example, the comparison of the data with the mean value or the comparison of the data with the target value. There are three ways to generate a tableau reference line for this type of statistical chart comparison: (1) generated by the average of all actual data in the chart; (2) generated by the custom target value; (3) generated by the average of all actual data in the EXCEL chart automatically generated by the upper limit value of the ruler gauge base axis y. As the CIC check mechanism is performed by using the maximum number of deficiency items in the last year, (3) is used to present the location of the high number of deficiency items more quickly. It is not only simpler and faster than (1), but also avoids (2) which is too subjective and lacks a basis for evaluation, i.e., this study adopts the average of the highest upper limit of the scale base axis y in the statistical chart.
The highest number is close to 12,000, and the tableau reference line of 6000 is used as the judgment standard. The 01000 series (certifications and documentation, 11096), 07000 series (fire safety, 9326), 10000 series (safety of navigation, 7534), 11000 series (life-saving appliances, 6174), and 18000 series (MLC2006, 11177) are the most common (Figure 2).
The highest number is close to 1000, and the tableau reference line of 500 is used as the judgment standard. Among the 04000 series, 04103 (emergency, lighting, batteries, and switches, 840), 04108 (muster list, 572) and 04114 (emergency source of power—emergency generator, 598) are the most common (Figure 3).
The highest number is close to 2000, taking the tableau reference line of 1000 as the judgment standard, 07000 series and 07105 (fire doors/openings in fire-resisting divisions, 1550) are the most (Figure 4).
The item of 15150 (ISM, 2170) is higher than other deficiency codes in the overall statistics (Figure 5).

4.2. GRA Analysis

The top-ranked contribution of ship types based on the time occurrence rate is the bulk carrier. The deficiency code and ship type original data (Table 2) are calculated by substituting the GRA mathematical formula in Section 3.2 with x i as the ship type and i m as the deficiency occurrence of month. The purpose of this GRA model is to determine the ship type that needs to be enhanced by sampling (Table 3).
The top-ranked contribution of ship types based on the occurrence rate of deficiency codes is general cargo/multipurpose. The deficiency code and ship type original data (Table 2) are calculated by substituting the GRA mathematical formula in Section 3.2 with x i as the ship type and i m as the deficiency code. The purpose of this GRA model is to determine the ship type that needs to be enhanced by sampling (Table 4).
The top-ranked contribution of deficiency codes based on the time occurrence rate is 15150 of 15000 series. The deficiency code and ship type original data (Table 2) are calculated by substituting the GRA mathematical formula in Section 3.2 with x i as the deficiency code and i m as the deficiency occurrence of month. The purpose of this GRA model is to determine the deficiency code that needs to be enhanced by sampling (Table 5).
The top-ranked contribution of deficiency codes based on the occurrence rate of ship types is 10105 of 10000 series. The deficiency code and ship type original data (Table 2) are calculated by substituting the GRA mathematical formula in Section 3.2 with x i as the deficiency code and i m as the ship type. The purpose of this GRA model is to determine the deficiency code that needs to be enhanced by sampling (Table 6).

4.3. TOPSIS Analysis

By calculating the performance of a single ship type for different deficiency codes and then ranking the ship types according to that performance, the deviation of different benchmarks (ship types) can be determined. The result shows that general cargo/multipurpose is the first in both positive and negative ideal solutions.
The Closeness of Each Experimental Combination to the Positive Ideal Solution.
The deficiency code and ship type original data (Table 2) are calculated by substituting the TOPSIS mathematical formula in Section 3.3 with the evaluation object A is the ship type and the evaluation indicator E is the deficiency code. The purpose of this TOPSIS model is to determine the ship type that needs to be enhanced by sampling (Table 7).
By comparing the results of the GRA analysis in Section 4.2 (Table 4 and Table 6) and TOPSIS analysis in Section 4.3 (Table 7), the results of this paper not only provide information on the implementation of CIC measures for certain major inspection deficiencies, but also allow for an analysis of the types of ships that are more likely to be selected for CIC measures: general cargo/multipurpose and bulk carrier.

4.4. Three-Sigma Rule Analysis

After using Table 2 and substituting the three-sigma rule mathematical formula in Section 3.4, we can obtain the 1σ to 6σ cutoff data profile (Table 8) and use Table 8 to sort out all the important deficiency items’ situation that exceed the 3σ threshold (Table 9). This result can provide PSCO with the items that should be prioritized for inspection when performing CIC.
The total number of deficiency codes in the last three years   x i , deficiency code type has occurred n = 496, x ¯ = x i n , i = 1, 2, 3, …, n .
Deficiency codes 15150 and 07105 have more than six standard deviations (Table 9). The deficiency codes with more than three standard deviations are cross-referenced with the top five ship types, and we can see that general cargo/multipurpose ranked first and bulk carrier ranked second in the deficiency code statistics.

5. Discussion

5.1. Deficiency Codes

Table 7 shows that in the PSC inspection series, 03000, 05000, 06000, 11000, 12000, 15000, 16000, and 99000 were never the target of CIC inspection from 2010 to 2023. The largest number of deficiency inspections was 18000 series (MLC2006, total 11177), but was only classified as an annual CIC inspection in 2016.
With the GRA analysis, the deficiency codes that fell above the mean of 0.97 were 10105 (magnetic compass, total 541) and 07110 (fire-fighting equipment and appliances, total 701). The above deficiencies fall under the 10000 and 07000 series, respectively, with the former being targeted for inspection only once in 2017 and the latter being targeted for annual CIC inspections in 2012 and 2023, respectively.
After the three-sigma rule analysis, the deficiency codes up to five and six standard deviations were 15150 (ISM, total 2170) and 07105 (fire doors/openings in fire-resisting divisions, total 1550), respectively. The above deficiencies are part of the 15000 and 07000 series, respectively; the former has never been an inspection target, while the latter was an annual inspection target for CIC in 2012 and 2023, respectively.
The 15150 series was found to have the highest number of deficiency codes of all, yet it had never been checked. The 18000 series and 10000 series were not included in the CIC annual inspection series again after at least five years; only the 07000 series was targeted for inspection in 2023 (Table 10). Therefore, it is difficult to effectively combat substandard ships with a single series as the target of inspection under the CIC mechanism.

5.2. Ship Types

According to the GRA analysis results of CIC’s annual inspection (Table 11), the top three mean values were general cargo/multipurpose, bulk carrier and container, based on the number of deficiency codes and the contribution based on the time occurrence rate.

5.3. Recommendations

The 03000, 11000, 15000, 16000, and 99000 were never CIC annual inspection targets, but the GRA deficiency codes based on ship types or time occurrence rate were all found in the top 50 (as each deficiency code in the series did not exceed 50). The highest series count of 18000 series (MLC 2006, total 11177) also appeared in the first 15 items.
The highest number of PSC deficiency code statistics of 15150 items (ISM, total 2170) and those screened by the three-sigma rule of 07105 items (fire doors/openings in fire-resisting divisions, total 1550) also appeared in the GRA deficiency code analysis (based on time occurrence rate).
Therefore, according to the current CIC annual implementation energy, the number of deficiency codes that should be inspected should be determined and combined into a series of CIC inspections for the current time. For example, using the ship type occurrence rate as the basis, the deficiency codes with an average value greater than 0.97 were 10105 items (magnetic compass, total 541) and 07110 items (fire-fighting equipment and appliances, total 701). Based on the occurrence rate of time, the deficiency codes with a mean value greater than 0.83 are 15150 items (ISM, total 2170), 11177 items (lifebuoys including provision and disposition, total 722), 07120 items (means of escape, total 569), and 07105 items (fire doors/openings in fire-resisting divisions, total 1550). The above deficiency codes can form the CIC’s focus inspection series in 2023, if necessary, and provide the measurement of enhanced inspection ship types, such as general merchant ships, bulk, container ships, etc. We can invite those familiar with the series 10000, 07000, 15000, and 11000 series of PSCO or experts to carry out this CIC implementation by special training and to review the implementation of the inspection consensus before and after the inspection to strengthen the PSC optimization CIC model.

6. Conclusions

Based on the results and analysis, the following conclusions can be drawn: (1) From the above analysis of GRA and the three-sigma rule, we can see that items 10105, 07110, 15150, 11177, 07120, and 07105 are the deficiency items for which CIC should strengthen sampling; 07000 series, 10000 series, 15000 series, and 18000 series are the deficiency items for which CIC should strengthen sampling. The 15150, 07105, and 04103 items are deficient items with a high consensus among inspectors. (2) From the results of GRA and TOPSIS analysis, it can be seen that CICs should strengthen the sampling of general cargo/multipurpose, bulk carriers, chemical tankers, and containers.
The existing CIC inspection mechanism is to use only one year of historical data to focus on a single series of PSC Code for inspection, and never announces the requirement to specify which major inspection deficiencies to inspect. In the case analysis of this study, the rolling data were used to learn the complex multi-item PSC Code series, and the existing announced 2023 CIC inspection items were 07000 series, which is verified to be one of the CIC inspection series in this model, and, at the same time, we know which major inspection deficiency items should be listed as inspection items simultaneously.
Therefore, the original design of this study uses a rolling inspection method for nearly three years to more effectively detect potential substandard ships. This important research result is not only applicable to Paris MoU’s CIC measures, but can also be implemented in other regions of PSC MoU’s CIC measures and can effectively strengthen the effectiveness of the global implementation of PSC’s fight against substandard ships.
For future research directions, the new rolling complex CIC inspection mechanism model proposed in this paper can be applied to other PSC MoUs in the future. It not only helps to identify the common inspection items and ship types that have been missed by PSC MoUs around the world for a long time, but also takes into account the weighting factors of regional scope and execution schedule to form a joint weighted CIC inspection model for each region. Specifically, this study presenting this method not only effectively addresses the blind spot of the existing CIC enforcement model, but also ensures the effectiveness of PSC enforcement and is in line with the future global trend of CIC cooperation among PSC MoUs.

Author Contributions

C.-Y.L. contributed to the conception of the work (writing, data collection, data interpretation), analyzed the data, and interpreted the results. C.-P.L. designed, drafted, and revised the work (study design, data collection). K.-M.H. contributed to the conception and design of the work (literature search, data collection). All authors have read and agreed to the published version of the manuscript.

Funding

This research received no external funding.

Institutional Review Board Statement

Not applicable.

Informed Consent Statement

Not applicable.

Data Availability Statement

Not applicable.

Conflicts of Interest

The authors declare no conflict of interest.

Abbreviations

CodesDefinition
01000Certificate and Documentation
02000Structural Conditions
03000Water/Weathertight conditions
04000Emergency Systems
05000Radio Communications
06000Cargo operations including equipment
07000Fire safety
08000Alarms
09000Working and Living Conditions (09100/09200)
10000Safety of Navigation
11000Life-saving appliances
12000Dangerous goods
13000Propulsion and auxiliary machinery
14000Pollution prevention
15000ISM
16000ISPS
180002006 MLC
99000Others

Appendix A

Figure A1. Comparison by deficiency code series 01000 (yellow line: tableau reference line).
Jmse 11 01166 g0a1
The highest number is close to 1000, and the tableau reference line of 500 is used as the judgment standard. Among the 01000 series (certifications and documentation), 01123 (continuous synopsis record, 606), 01220 (seafarers’ employment agreement, 766), 01308 (records of seafarers’ daily hours of work or rest, 589), and 01315 (oil record book, 915) are the most common.
Figure A2. Comparison by deficiency code series 02000 (yellow line: tableau reference line).
Jmse 11 01166 g0a2
The highest number is close to 600, and the tableau reference line of 300 is used as the judgment standard. Among the 02000 series (structural condition), 02105 (steering gear, 475), 02106 (hull damage impairing seaworthiness, 344), 02107 (ballast, fuel and other tanks, 375), 02108 (electrical installations in general, 570), and 02117 (decks—corrosion, 346) are the most common.
Figure A3. Comparison by deficiency code series 03000 (yellow line: tableau reference line).
Jmse 11 01166 g0a3
The highest number is close to 800, and the tableau reference line of 400 is used as the judgment standard. The 03000 series (water/weathertight condition), 03102 (freeboard marks, 582), 03103 (railing, gangway, walkway and means for safe passage, 458), and 03108 (ventilators, air pipes, casings, 559) are the most common.
Figure A4. Comparison by deficiency code series 05000 (yellow line: tableau reference line).
Jmse 11 01166 g0a4
The highest number is close to 400, and the tableau reference line 200 is used as the judgment standard. Among the 05000 series (radio communication), 05115 (radio log (diary), 321) is the most common.
Figure A5. Comparison by deficiency code series 06000 (yellow line: tableau reference line).
Jmse 11 01166 g0a5
The highest number is close to 150, and the tableau reference line 75 is used as the judgment standard. Among the 06000 series (cargo operations including equipment), 06101 (cargo securing manual, 83), and 06105 (atmosphere testing instrument, 129) are the most common.
Figure A6. Comparison by deficiency code series 08000 (yellow line: tableau reference line).
Jmse 11 01166 g0a6
The highest number is close to 300, and the tableau reference line 150 is used as the judgment standard. Among the 08000 series (alarms), 08107 (machinery controls alarm, 239) and 08108 (UMS-alarms, 151) are the most common.
Figure A7. Comparison by deficiency code series 09000 (yellow line: tableau reference line).
Jmse 11 01166 g0a7
The highest number is close to 500, and the tableau reference line 250 is used as the judgment standard. Among the 09000 series (working and living conditions), 09232 (lighting—working spaces, 382) is the most.
Figure A8. Comparison by deficiency code series 10000 (yellow line: tableau reference line).
Jmse 11 01166 g0a8
The highest number is close to 1000, and the tableau reference line 500 is used as the judgment standard. Among 10000 series (safety of navigation, 784), 10105 (magnetic compass, 541), 10109 (lights, shapes, sound-signals, 629), 10116 (nautical publications, 828), and 10127 (voyage or passage plan, 803) are the most common.
Figure A9. Comparison by deficiency code series 11000 (yellow line: tableau reference line).
Jmse 11 01166 g0a9
The highest number is close to 800, and the tableau reference line 400 is used as the judgment standard. Among the 11000 series (life-saving appliances), 11101 (lifeboats, 660), 11104 (rescue boats, 574), 11113 (launching arrangements for rescue boats, 409), 11177 (lifebuoys including provision and disposition, 722), and 11131 (on board training and instructions, 634) are the most common.
Figure A10. Comparison by deficiency code series 12000 (yellow line: tableau reference line).
Jmse 11 01166 g0a10
The highest number is close to 60, and the tableau reference line 30 is used as the judgment standard. Among 12000 series (dangerous goods), 12108 (personal protection, 52) is the most common.
Figure A11. Comparison by deficiency code series 13000 (yellow line: tableau reference line).
Jmse 11 01166 g0a11
The highest number is close to 800, and the tableau reference line 400 is used as the judgment standard. Among the 13000 series (propulsion and auxiliary machinery), 13101 (propulsion main engine, 699), 13102 (auxiliary engine, 728), 13103 (gauges, thermometers, etc., 497), and 13199 (other, machinery, 421) are the most common.
Figure A12. Comparison by deficiency code series 14000 (yellow line: tableau reference line).
Jmse 11 01166 g0a12
The highest number is close to 600, and the tableau reference line 300 is used as the judgment standard. Among the 14000 series (pollution prevention), 14104 (oil filtering equipment, 304), 14402 (sewage treatment plant, 372), 14402 (sewage treatment plant, 372), 14501 (garbage shipboard handling, 305), 14503 (garbage management plan, 439), and 14802 (ballast water record book, 479) are the most common.
Figure A13. Comparison by deficiency code series 16000 (yellow line: tableau reference line).
Jmse 11 01166 g0a13
The highest number is close to 600, and the tableau reference line 300 is used as the judgment standard. Among 16000 series (ISPS), 16105 (Access control to ship, 530) is the most common.
Figure A14. Comparison by deficiency code series 18000 (yellow line: tableau reference line).
Jmse 11 01166 g0a14
The highest number is close to 700, and the tableau reference line of 350 is used as the judgment standard. Among series 18000 (MLC, 2006), 18302 (sanitary facilities, 459),18312 (sanitary facilities, 464),18314 (provisions quantity, 358), 18324 (cold room, cold room cleanliness, cold room temperature, 536), 18407 (lighting (working spaces), 363), 18408 (electrical 654), 18414 (protection machines/parts, 431), 18416 (ropes and wires, 457), 18418 (winches and capstans, 362), 18420 (cleanliness of engine room, 580), 18425 (access/structural features (ship), 502) and 18499 (other—health protection, medical care, 351) are the most common.
Figure A15. Comparison by deficiency code series 99000 (yellow line: tableau reference line).
Jmse 11 01166 g0a15
The highest number is close to 300, and the tableau reference line 150 is used as the judgment standard. Among 99000 series (others), 99101 (other safety in general, 250) is the most common.

References

  1. IMO-Port-State-Control. Available online: https://www.imo.org/en/OurWork/MSAS/Pages/PortStateControl.aspx (accessed on 25 January 2023).
  2. Paris MoU. Available online: https://www.parismou.org/ (accessed on 25 January 2023).
  3. The Paris MoU New Inspection Regime. Available online: http://www.vanuatumaritimeships.com/Documents/NIR%20TOKYO-PARIS%20MOU.pdf (accessed on 25 January 2023).
  4. Chen, J.H.; Zhang, S.H.; Xu, L.; Wan, Z.; Fei, Y.J.; Zheng, T.X. Identification of key factors of ship detention under Port State Control. Mar. Policy 2019, 102, 21–27. [Google Scholar] [CrossRef]
  5. Shen, J.H.; Liu, C.P.; Chung, K.Y.; Chen, Y.W. Ship Deficiency Data of Port State Control to Identify Hidden Risk of Target Ship. J. Mar. Sci. Eng. 2021, 9, 1120. [Google Scholar] [CrossRef]
  6. Yang, Z.S.; Wan, C.P.; Yang, Z.L.; Yu, Q. Using Bayesian network-based TOPSIS to aid dynamic port state control detention risk control decision. Reliab. Eng. Syst. Saf. 2021, 213, 107784. [Google Scholar] [CrossRef]
  7. Kara, E.G.E. Determination of maritime safety performance of flag states based on the Port State Control inspections using TOPSIS. Mar. Policy 2022, 143, 105156. [Google Scholar] [CrossRef]
  8. Yan, R.; Wang, S.A.; Fagerholt, K.T.I. Coordinated approaches for Port State Control Inspection planning. Marit. Policy Manag. 2022, 49, 897–912. [Google Scholar] [CrossRef]
  9. Bruin, G.J.D.; Barata, A.P.; Herik, H.J.V.D.; Takes, F.W.; Veenman, C.J. Fair automated assessment of noncompliance in cargo ship networks. Epj Data Sci. 2022, 11, 13. [Google Scholar] [CrossRef]
  10. Wang, S.A.; Yan, R.; Qu, X.B. Development of a non-parametric classifier: Effective identification, algorithm, and applications in port state control for maritime transportation. Transp. Res. Part B-Methodol. 2019, 128, 129–157. [Google Scholar] [CrossRef]
  11. Wang, Y.H.; Zhang, F.; Yang, Z.S.; Yang, Z.L. Incorporation of deficiency data into the analysis of the dependency and interdependency among the risk factors influencing port state control inspection. Reliab. Eng. Syst. Saf. 2021, 206, 107277. [Google Scholar] [CrossRef]
  12. Dinis, D.; Teixeira, A.P.; Soares, C.G. Probabilistic approach for characterising the static risk of ships using Bayesian networks. Reliab. Eng. Syst. Saf. 2020, 203, 107073. [Google Scholar] [CrossRef]
  13. Yan, R.; Wang, S.A.; Fagerholt, K.T.I. A semi-”smart predict then optimize” (semi-SPO) method for efficient ship inspection. Transp. Res. Part B-Methodol. 2020, 142, 100–125. [Google Scholar] [CrossRef]
  14. Yan, R.; Wang, S.A.; Cao, J.N.; Sun, D.F. Shipping Domain Knowledge Informed Prediction and Optimization in Port State Control. Transp. Res. Part B-Methodol. 2021, 149, 52–78. [Google Scholar] [CrossRef]
  15. Yan, R.; Wang, S. Ship detention prediction using anomaly detection in port state control: Model and explanation. Electron. Res. Arch. 2022, 30, 3679–3691. [Google Scholar] [CrossRef]
  16. Wu, S.B.; Chen, X.Q.; Shi, C.J.; Fu, J.J.; Yan, Y.; Wang, S.Z. Ship detention prediction via feature selection scheme and support vector machine (SVM). Marit. Policy Manag. 2022, 49, 140–153. [Google Scholar] [CrossRef]
  17. Fu, J.J.; Chen, X.Q.; Wu, S.B.; Shi, C.J.; Zhao, J.S.; Xian, J.F. Ship Detention Situation Prediction via Optimized Analytic Hierarchy Process and Naive Bayes Model. Math. Probl. Eng. 2020, 2020, 8147310. [Google Scholar] [CrossRef]
  18. Yan, R.; Zhuge, D.; Wang, S.A. Development of Two Highly-Efficient and Innovative Inspection Schemes for PSC Inspection. Asia-Pac. J. Oper. Res. 2021, 38, 2040013. [Google Scholar] [CrossRef]
  19. Liu, K.Z.; Yu, Q.; Yang, Z.S.; Wang, C.P.; Yang, Z.L. BN-based port state control inspection for Paris MoU: New risk factors and probability training using big data. Reliab. Eng. Syst. Saf. 2022, 224, 108530. [Google Scholar] [CrossRef]
  20. Sanlier, S. Analysis of port state control inspection data: The Black Sea Region. Mar. Policy 2020, 112, 103757. [Google Scholar] [CrossRef]
  21. Fan, L.X.; Zhang, Z.M.; Yin, J.B.; Wang, X.Y. The efficiency improvement of port state control based on ship accident Bayesian networks. Proc. Inst. Mech. Eng. Part O-J. Risk Reliab. 2019, 233, 71–83. [Google Scholar] [CrossRef]
  22. Yuan, C.C.; Chung, W.H.; Cai, C.Q.; Sung, S.T. Application of Statistical Process Control on Port State Control. J. Mar. Sci. Eng. 2020, 8, 746. [Google Scholar] [CrossRef]
  23. Zhu, J.H.; Yang, Q.; Jiang, J. Identifying crucial deficiency categories influencing ship detention: A method of combining cloud model and prospect theory. Reliab. Eng. Syst. Saf. 2023, 230, 108949. [Google Scholar] [CrossRef]
  24. Tsou, M.C. Big data analysis of port state control ship detention database. J. Mar. Eng. Technol. 2019, 18, 113–121. [Google Scholar] [CrossRef]
  25. Fu, J.J.; Chen, X.Q.; Wu, S.B.; Shi, C.J.; Wu, H.F.; Xiong, P.W. Mining ship deficiency correlations from historical port state control (PSC) inspection data. PLoS ONE 2020, 15, e0229211. [Google Scholar] [CrossRef] [PubMed]
  26. Çelik, B.; Çakır, E. Differences in deficiency types causing ship detentions at the Black Sea Region during the COVID-19 pandemic and pre-pandemic. Mar. Policy 2023, 151, 105553. [Google Scholar] [CrossRef] [PubMed]
  27. Chen, Y.L.; Lou, N.Y.; Liu, G.L.; Luan, Y.; Jiang, H. Risk analysis of ship detention defects based on association rules. Mar. Policy 2022, 142, 105123. [Google Scholar] [CrossRef]
  28. Chung, W.H.; Kao, S.L.; Chang, C.M.; Yuan, C.C. Association rule learning to improve deficiency inspection in port state control. Marit. Policy Manag. 2020, 47, 332–351. [Google Scholar] [CrossRef]
  29. Prieto, J.M.; Amor, V.; Turias, I.; Almorza, D.; Piniella, F. Evaluation of Paris MoU Maritime Inspections Using a STATIS Approach. Mathematics 2021, 9, 2092. [Google Scholar] [CrossRef]
  30. Yu, Q.; Teixeira, A.P.; Liu, K.; Rong, H.; Soares, C.G. An integrated dynamic ship risk model based on Bayesian Networks and Evidential Reasoning. Reliab. Eng. Syst. Saf. 2021, 216, 107993. [Google Scholar] [CrossRef]
  31. Yan, R.; Wang, S.; Peng, C. Ship selection in port state control status and perspectives. Marit. Policy Manag. 2022, 49, 600–615. [Google Scholar] [CrossRef]
  32. Yang, Z.S.; Yang, Z.L.; Teixeira, Â.P. Comparative analysis of the impact of new inspection regime on port state control inspection. Transp. Policy 2020, 92, 65–80. [Google Scholar] [CrossRef]
  33. Xiao, Y.; Qi, G.Q.; Jin, M.J.; Yuen, K.F.; Chen, Z.; Li, K.X. Efficiency of Port State Control inspection regimes: A comparative study. Transp. Policy 2021, 106, 165–172. [Google Scholar] [CrossRef]
  34. Xiao, Y.; Wang, G.; Lin, K.C.; Qi, G.Q.; Li, K.X. The effectiveness of the New Inspection Regime for Port State Control: Application of the Tokyo MoU. Mar. Policy 2020, 115, 103857. [Google Scholar] [CrossRef]
  35. Bai, J.Y.; Wang, C.X. Enhancing Port State Control in Polar Waters. Ocean Dev. Int. Law 2019, 50, 299–319. [Google Scholar] [CrossRef]
  36. Boljat, H.U.; Slišković, M.; Jelaska, I.; Gudelj, A.; Mrčelić, G.J. Analysis of Pollution Related Deficiencies Identified through PSC Inspections for the Period 2014–2018. Sustainability 2020, 12, 5956. [Google Scholar] [CrossRef]
  37. Cakir, E.; Sevgili, C.; Fiskin, R. An analysis of severity of oil spill caused by ship accidents. Transp. Res. Part D-Transp. Environ. 2021, 90, 5956. [Google Scholar] [CrossRef]
  38. Osman, M.T.; Chen, Y.L.; Tian, L.; Syahrul, F.S. Association rule mining for identification of port state control patterns in Malaysian ports. Marit. Policy Manag. 2021, 48, 1082–1095. [Google Scholar] [CrossRef]
  39. Xiao, Y.; Wang, G.; Ge, Y.E.; Xu, Q.Y.; Li, K.X. Game model for a new inspection regime of port state control under different reward and punishment conditions. Transp. Res. Part E-Logist. Transp. Rev. 2021, 156, 102526. [Google Scholar] [CrossRef]
  40. Fan, L.X.; Zheng, L.; Luo, M.F. Effectiveness of port state control inspection using Bayesian network modeling. Marit. Policy Manag. 2022, 49, 261–278. [Google Scholar] [CrossRef]
  41. Fan, L.X.; Yu, Y.; Yin, J.B. Impact of Sulphur Emission Control Areas on port state control’s inspection outcome. Marit. Policy Manag. 2022, 1–16. [Google Scholar] [CrossRef]
  42. Yuan, C.C.; Chiu, R.H.; Cai, C.Q. Important Factors Influencing the Implementation of Independent Port State Control Regimes. J. Mar. Sci. Eng. 2020, 8, 641. [Google Scholar] [CrossRef]
  43. Yan, R.; Mo, H.Y.; Guo, X.M.; Yang, Y.; Wang, S.A. Is port state control influenced by the COVID-19? Evidence from inspection data. Transp. Policy 2022, 123, 82–103. [Google Scholar]
  44. Akyurek, E.; Bolat, P. Port state control at European Union under pandemic outbreak. Eur. Transp. Res. Rev. 2020, 12, 66. [Google Scholar] [CrossRef]
  45. Akyurek, E.; Bolat, P. Ranking port state control detention remarks: Professional Judgement and spatial overview. Eur. Transp. Res. Rev. 2021, 13, 24. [Google Scholar] [CrossRef]
  46. Öztürk, O.B.; Turna, I. Investigation of ship radio communication deficiencies in port state controls: Radio logbook records. Aust. J. Marit. Ocean. Aff. 2023, 15, 1–17. [Google Scholar] [CrossRef]
  47. Deng, J.L. Control problems of grey systems. Syst. Control Lett. 1982, 1, 288–294. [Google Scholar]
  48. Liu, S.F.; Xie, N.M. Gray System Theory and Its Application, 4th ed.; Science Publishers: Beijing China, 2008. [Google Scholar]
  49. Hwang, C.L.; Yoon, K. Multiple Attribute Decision Making: Methods and Applications, A State-of-the-Art Survey; Springer: New York, NY, USA, 1981. [Google Scholar]
Figure 2. Comparison by deficiency code series (yellow line: tableau reference line).
Jmse 11 01166 g002
Figure 3. Comparison by deficiency code series 04000 (yellow line: tableau reference line).
Jmse 11 01166 g003
Figure 4. Comparison by deficiency code series 07000 (yellow line: tableau reference line).
Jmse 11 01166 g004
Figure 5. Comparison by Deficiency Code Series 15000.
Jmse 11 01166 g005
Table 1. Differences between the study and other oriented studies.
Aspect from Section 2.1, Section 2.2 and Section 2.3, Section 2.4 and Section 2.5(1)(2)(3)(4)(5)(6)(7)
  • Local improvement of the existing ship selection mechanism
V V
2.
Improving identification of substandard ships
V V
3.
Overall optimization of the ship selection model
V V
4.
Identifying critical elements for the selection of substandard ships
V V
5.
Improve the efficiency of PSC inspection and avoid ship detention
V
6.
Critical elements from PSC inspections of ship detention
V V V
7.
The correlation between deficiencies in PSC inspection of ship detention
VV
8.
The correlation between ship types and deficiency codes for PSC ship detention
V V
9.
Monitoring and inspection of inbound ships with high risk of ballast water
10.
Regulatory policy mechanisms for ballast water management
11.
Ship risk assessment indicators
V
12.
Improved NIR inspection mode
V V V
13.
Other literature on exploring PSC
V V
14.
The Study
VVVVVV
Made by authors. Notes (A): Aspect 2.1 1. Local improvement of the existing ship selection mechanism. The main areas covered include (1) and (5). Notes (B): V represents the scope of the collected literature. Notes (C): (1) NIR Improvement; (2) CIC Improvement; (3) Ship Type Discussion; (4) Ship Type (21); (5) Deficiency Code Discussion; (6) Deficiency Code (496); (7) Officers’ Consideration.
Table 2. Deficiency code and ship type original data.
TypesSUM“15150”“07105”“01220”“01315”“18309”“14808”
Bulk carrier14,149419224149111 00
Chemical tanker47802181637952 00
General cargo/multipurpose25,816731451222343 10
NLS tanker864200 00
Offshore supply155038562539 00
Oil tanker3429103805331 00
Other314198734745 00
Container58732021504165 01
Gas carrier12169645251000
Ro-Ro cargo242679722837 00
Other special activities230250523365 00
Ro-Ro passenger ship21234654823 00
Heavy load17481222 00
Tug11387301827 00
High speed passenger craft28761320 00
Gas Carrier/NLS tanker591013200
Refrigerated cargo859181311300
Commercial yacht62862322 00
Special purpose ship46510251211 00
Passenger ship849293251700
Combination carrier261100 00
MAX25,81673145122234311
Made by authors.
Table 3. GRA deficiency code analysis (time occurrence rate) RANK (496).
RankTypesAverage
1Bulk carrier0.850689
2General cargo/multipurpose0.814549
3Container0.814208
4Oil tanker0.739657
5Chemical tanker0.738650
6Other0.735002
7Ro-Ro cargo0.722863
8Gas carrier0.691105
9Other special activities0.689822
10Tug0.646232
11Offshore supply0.64502
12Ro-Ro passenger ship0.618565
13Special purpose ship0.617200
14High speed passenger craft0.611880
15Refrigerated cargo0.608326
16Heavy load0.549147
17Passenger ship0.530023
18NLS tanker0.499083
19Commercial yacht0.492268
20Gas Carrier/NLS tanker0.475004
21Combination carrier0.438254
Made by authors.
Table 4. GRA ship type analysis (deficiency code occurrence rate) RANK (21).
RankTypesAverage
1General cargo/multipurpose0.976351
2Bulk carrier0.970472
3Container0.963004
4Other0.959814
5Ro-Ro cargo0.957068
6Oil tanker0.956462
7Chemical tanker0.951627
8Offshore supply0.941492
9Passenger ship0.935249
10Other special activities0.934935
11Special purpose ship0.933020
12Tug0.929730
13Gas carrier0.926156
14Ro-Ro passenger ship0.923778
15Heavy load0.916794
16Commercial yacht0.914732
17High speed passenger craft0.914360
18Refrigerated cargo0.913073
19NLS tanker0.908497
20Gas Carrier/NLS tanker0.897012
21Combination carrier0.896094
Made by authors.
Table 5. GRA deficiency code analysis (time occurrence rate) RANK (496).
RankCodesAverageRankCodesAverageRankCodesAverage
1“15150”0.88225921“18407”0.76081641“04109”0.733226
2“11117”0.83212522“11104”0.76008842“02117”0.728188
3“07120”0.82205823“07106”0.75477043“04114”0.727975
4“07105”0.82088024“10109”0.75393344“04102”0.727815
5“01315”0.80889925“01214”0.75328845“07124”0.727091
6“07115”0.80128426“18414”0.75326646“13103”0.726975
7“18408”0.79908527“18302”0.75280747“07109”0.726096
8“07199”0.79285528“07114”0.75278348“01307”0.725251
9“11108”0.79158229“01220”0.75164849“07116”0.725007
10“13101”0.79090030“01101”0.75154050“03105”0.723804
11“11113”0.78547031“14501”0.74765951“14802”0.723734
12“11101”0.78414832“01308”0.74580952“14499”0.723310
13“10111”0.78285333“01113”0.74567653“18319”0.723076
14“18416”0.77483834“07113”0.74526754“03102”0.717109
15“13102”0.76861035“02199”0.74198255“14801”0.714056
16“07110”0.76855436“10127”0.74180356“18318”0.713530
17“10104”0.76810737“01218”0.74016557“07101”0.711511
18“02108”0.76197238“01199”0.73890058“18499”0.711109
19“03103”0.76185839“18324”0.73868359“04103”0.710365
20“18313”0.76090140“16105”0.73481260“07122”0.709011
464“14103”0.433643475“14609”0.431514482“14799”0.428348
464“12103”0.433643476“14203”0.431411482“14303”0.428348
466“18307”0.433167477“14808”0.431264482“14809”0.428348
467“12112”0.432563478“09103”0.430424482“12110”0.428348
467“01134”0.432563478“01216”0.430424490“01110”0.427280
469“09135”0.432391480“09204”0.428927491“11133”0.425631
469“09211”0.432391481“14805”0.428367492“02124”0.424645
469“09225”0.432391482“09229”0.428348493“11114”0.424547
469“09114”0.432391482“09203”0.428348494“01109”0.422441
473“16104”0.431973482“09206”0.428348495“18323”0.418149
474“01114”0.431767482“09205”0.428348496“09128”0.416166
Made by authors.
Table 6. GRA deficiency code analysis (ship type occurrence rate) RANK (496).
RankCodesAverageRankCodesAverageRankCodesAverage
1“10105”0.97169621“03107”0.95932841“18318”0.954995
2“07110”0.97027722“04106”0.95863342“99101”0.954947
3“03102”0.96910923“07108”0.95849343“18408”0.954821
4“11110”0.96590924“07120”0.95817544“10133”0.954707
5“13103”0.96506725“11103”0.95779145“07115”0.954619
6“03103”0.96498326“02105”0.95770246“11112”0.954529
7“11131”0.96469427“04103”0.95718047“14119”0.954420
8“02199”0.96454528“11135”0.95710448“04102”0.954132
9“11124”0.96377029“02108”0.95693049“10106”0.954106
10“04114”0.96337030“14108”0.95686950“07103”0.953825
11“07113”0.96313031“16105”0.95664051“14801”0.953558
12“15150”0.96278332“10199”0.95656352“18202”0.953156
13“07106”0.96204333“10127”0.95644753“07122”0.952757
14“01308”0.96153534“11108”0.95633654“05106”0.952081
15“18401”0.96152335“07114”0.95606555“11132”0.951936
16“01310”0.96057336“04110”0.95604156“18412”0.951903
17“04108”0.96043737“01123”0.95560957“18304”0.951851
18“08107”0.96020338“13101”0.95555358“18414”0.951744
19“18420”0.96006939“02117”0.95544459“02107”0.951495
20“10109”0.95983540“10135”0.95501160“05199”0.951426
453“04122”0.825578472“08106”0.818593486“09106”0.804397
453“11114”0.825578473“01318”0.817575487“01222”0.803823
460“07102”0.825402474“12107”0.815656488“01118”0.800513
461“01134”0.823698475“14207”0.815409489“01127”0.798910
462“09217”0.82352476“12199”0.814502490“01304”0.798170
463“12102”0.822867477“01129”0.814380491“14603”0.797558
464“12103”0.822545478“01319”0.811815492“01128”0.796049
465“01133”0.821836479“01103”0.811040493“11111”0.795195
466“09103”0.821262480“01135”0.808900494“08110”0.784433
467“09124”0.821226481“01302”0.808434495“01204”0.780940
468“04104”0.820098482“09207”0.807725496“10102”0.775295
Made by authors.
Table 7. TOPSIS ship type inspection sequence.
Ship TypesThe Closeness of Each Experimental Combination to the Positive Ideal SolutionRank
General cargo/multipurpose0.6389371
Bulk carrier0.4678052
Chemical tanker0.2535513
Container0.2475544
Ro-Ro passenger ship0.2047975
Oil tanker0.1805086
Other0.1510597
Ro-Ro cargo0.1240898
Other special activities0.1205539
Offshore supply0.09775110
Passenger ship0.09551611
Gas carrier0.09124812
Refrigerated cargo0.07210313
Tug0.06984414
High speed passenger craft0.06713115
Special purpose ship0.05484316
Commercial yacht0.04800917
NLS tanker0.03225618
Heavy load0.01632819
Gas Carrier/NLS tanker0.01609820
Combination carrier0.00407021
Made by authors.
Table 8. Paris MoU six standard deviations.
(A)
Standard Deviation σ
(B)
Deficiency
Quantity
(C)
Overall Deficiency Percentage
(D)
Number of Deficiency Items Category
(E)
Number of Discrepancies per Month (Deficiencies)
(F)
Number of
PSC Total Deficiencies per Month
(G)
Awareness Differences
(H)
Executive Consensus
211.517249,65469.57%1105.87551379.27780.43%0.9957
423.034430,14042.23%4611.7510837.22221.40%0.9860
634.551614,27720.00%1617.6264396.58334.44%0.9556
846.068846356.49%323.5019128.750018.25%0.8175
1057.586037205.21%229.3774103.333328.43%0.7157
1269.103137205.21%235.2529103.333334.12%0.6588
Made by authors. Notes: (C) = (B)/71376; (E) = (A)/36; (F) = (B)/36; (G) = (E)/(F); (H) = 1 − (G).
Table 9. Cross-referenced deficiency codes greater than three standard deviations with the top five ship types.
Ship TypeGeneral Cargo/MultipurposeBulk CarrierContainerChemical TankerOil Tanker
PSC Code
(1) “15150”1 (731)2 (419)4 (202)3 (218)5 (103)
(2) “07105”1 (451)2 (224)4 (150)3 (163)5 (80)
(3) “04103”1 (274)2 (161)3 (73)4 (67)5 (66)
(4) “01315”1 (343)2 (111)3 (65)4 (52)5 (31)
(5) “10127”1 (318)2 (134)3 (58)4 (32)5 (31)
(6) “07106”1 (269)2 (125)3 (79)4 (47)5 (31)
(7) “13102”1 (224)2 (151)3 (74)5 (49)4 (50)
(8) “01220”1 (222)2 (149)5 (41)3 (79)4 (53)
(9) “11117”1 (314)2 (109)3 (60)4 (38)5 (20)
(10) “13101”1 (251)2 (122)4 (70)3 (74)5 (21)
(11) “11101”1 (207)2 (150)3 (64)4 (58)5 (54)
(12) “07110”1 (284)2 (122)4 (42)3 (47)5 (34)
(13) “10116”1 (276)2 (119)3 (53)5 (35)4 (40)
(14) “10111”1 (349)2 (77)3 (46)4 (23)5 (22)
(15) “07115”1 (214)2 (133)3 (58)4 (55)5 (41)
(16) “18408”1 (236)2 (99)3 (81)4 (54)5 (18)
Source: A Study on Improving CIC Implementation Using the PSC Deficiency Database (Chiu-Yu, Lai). Notes: PSC Code items (1) and (2) in the table can exceed 5σ and 6σ, item (3) can exceed 4σ, and the remaining items (4) to (16) can exceed 3σ only.
Table 10. Inspection Targets (2010~2023).
CodesRegulationsCIC Executive Year
01000SOLAS, MARPOL, Tonnage 69, LL, ILO NO.147, COLREG, STCW2018, 2022
02000SOLAS, MARPOL, LL, Tonnage 692010, 2011, 2018, 2021
03000SOLAS, LLNil
04000SOLAS, MARPOL2018, 2019
05000SOLAS (Ch.4)Nil
06000SOLSA, Tonnage 69Nil
07000SOLAS, FSS Code2012, 2023
08000SOLAS2019
09000SOLAS, ILO No.147, 2006 MLC2014, 2016
10000SOLAS (Ch.5), COLREG2017
11000SOLAS (Ch.3), LSA CodeNil
12000SOLAS (Ch.7), MARPOL, IMDG CodeNil
13000SOLAS2013
14000MARPOL2018
15000SOLAS (Ch.9), ISM CodeNil
16000SOLAS (Ch.11-2), ISPS CodeNil
180002006 MLC2016
99000SOLAS, MARPOLNil
Made by authors.
Table 11. Ranking comparison of GRA ship types on different bases.
RankType (Deficiencies Based)AverageTypes (Time Based)Average
1General cargo/multipurpose0.976351Bulk carrier0.850689
2Bulk carrier0.970472General cargo/multipurpose0.814549
3Container0.963004Container0.814208
4Other0.959814Oil tanker0.739657
5Ro-Ro cargo0.957068Chemical tanker0.738650
6Oil tanker0.956462Other0.735002
7Chemical tanker0.951627Ro-Ro cargo0.722863
8Offshore supply0.941492Gas carrier0.691105
9Passenger ship0.935249Other special activities0.689822
10Other special activities0.934935Tug0.646232
11Special purpose ship0.933020Offshore supply0.645026
12Tug0.929730Ro-Ro passenger ship0.618565
13Gas carrier0.926156Special purpose ship0.617200
14Ro-Ro passenger ship0.923778High speed passenger craft0.611884
15Heavy load0.916794Refrigerated cargo0.608326
16Commercial yacht0.914732Heavy load0.549147
17High speed passenger craft0.914360Passenger ship0.530023
18Refrigerated cargo0.913073NLS tanker0.499083
19NLS tanker0.908497Commercial yacht0.492268
20Gas Carrier/NLS tanker0.897012Gas Carrier/NLS tanker0.475004
21Combination carrier0.896094Combination carrier0.438254
Made by authors.
Disclaimer/Publisher’s Note: The statements, opinions and data contained in all publications are solely those of the individual author(s) and contributor(s) and not of MDPI and/or the editor(s). MDPI and/or the editor(s) disclaim responsibility for any injury to people or property resulting from any ideas, methods, instructions or products referred to in the content.

