Article

PMOT2023: A Large-Scale Multi-Object Tracking (MOT) Dataset with Application to Phytoplankton Observation

1
College of Computer Science and Technology, Ocean University of China, Qingdao 266400, China
2
School of Information and Control Engineering, Qingdao University of Technology, Qingdao 266520, China
3
Department of Science and Information Science, Qingdao Agricultural University, Qingdao 266109, China
*
Authors to whom correspondence should be addressed.
J. Mar. Sci. Eng. 2023, 11(6), 1141; https://doi.org/10.3390/jmse11061141
Submission received: 15 March 2023 / Revised: 21 April 2023 / Accepted: 15 May 2023 / Published: 29 May 2023
(This article belongs to the Section Marine Biology)

Abstract

:
Phytoplankton play a critical role in marine food webs and biogeochemical cycles, and their abundance must be monitored to prevent disasters and improve the marine environment. Although existing algorithms for automatic phytoplankton identification at the image level are available, there are currently no video-level algorithms. This lack of datasets is a significant obstacle to the development of video-level automatic identification algorithms for phytoplankton observations. Deep learning-based algorithms, in particular, require high-quality datasets to achieve optimal results. To address this issue, we propose the PMOT2023 (Phytoplankton Multi-Object Tracking), a multi-video tracking dataset based on 48,000 micrographs captured by in situ observation devices. The dataset comprises 21 classes of phytoplankton and can aid in the development of advanced video-level identification methods. Multi-object tracking algorithms can detect, classify, count, and estimate phytoplankton density. As a video-level automatic identification algorithm, multi-object tracking addresses trajectory tracking, concentration estimation, and other requirements in original phytoplankton observation, helping to prevent marine ecological disasters. Additionally, the PMOT2023 dataset will serve as a benchmark to evaluate the performance of future phytoplankton identification models and provide a foundation for further research on automatic phytoplankton identification algorithms.

1. Introduction

Phytoplankton are critical to the ocean ecology, as they serve as primary producers that initiate the marine food chain and significantly influence marine ecosystems and fisheries [1]. These microorganisms also participate in the biogeochemical cycles of biogenic elements such as carbon, nitrogen, and phosphorus. Their carbon sequestration process is an important marine carbon sink that regulates atmospheric CO 2 concentrations, affecting global climate. Spatial and temporal variations in phytoplankton community characteristics, such as species composition and cell abundance, provide essential data for studying phytoplankton activity. However, non-in situ observation methods are limited by time and financial constraints, providing only short-term and temporary access to this information, which hinders our understanding of phytoplankton processes at various spatial and temporal scales [2]. In contrast, in situ observations of phytoplankton provide long-term, continuous access to information on phytoplankton species composition and cell abundance, enabling researchers to understand the causes and effects of changes in phytoplankton populations [3,4,5,6,7].
Among the various in situ plankton observation methods, acoustic-based observation techniques, such as Acoustic Doppler Current Profilers, Multifrequency Hydroacoustic Probing System, and broadband sonar, have outstanding advantages in terms of observation frequency, spatial range, and long-term observation capabilities. However, these techniques have limitations in their ability to observe the detailed features of plankton, their discrimination ability of different species of plankton is poor, and their ability to provide accurate quantitative and positional information is limited. Consequently, the reliability of their observation results is insufficient [8]. Chlorophyll fluorometry is the most mature, diverse, and widely used in situ observation device for marine organisms for phytoplankton detection [9]. Direct image recording of plankton using underwater imaging systems provides more intuitive observation. The Video Plankton Recorder (VPR) is an underwater video microscope system that can capture images of plankton at micron and centimeter scales [10]. The Underwater Video Profiler (UVP) uses high-resolution cameras and a powerful illumination system to record videos of zooplankton and macrophytes as the profiler passes through the water column [11]. For in situ observation of full-grained phytoplankton, FlowCytobot [12], FlowCAM [13], CytoSense [14], CytoBuoy [15], and CytoSub [16] are capable of acquiring information on phytoplankton from micro to pico scales and provide an effective method for in situ observation. However, the traditional methods require manual analysis of observation data, including manual counting and identification, which is labor intensive.
In recent years, deep learning has emerged as a powerful tool for various image processing tasks, including image classification, object detection, segmentation, and tracking. Compared with traditional observation and analysis methods, deep learning can significantly reduce knowledge and labor costs for researchers. Multi-object tracking (MOT) is a crucial task in computer vision that involves automatically identifying and tracking multiple objects in a video sequence. This technology has been successfully applied in areas such as autonomous driving and pedestrian tracking. Recently, multi-object tracking methods such as DeepSORT [17] and BYTEtrack [18] have emerged, which have demonstrated the ability to accurately localize, classify, track, and count objects in a video stream. These algorithms have the potential to assist researchers in analyzing and measuring the concentration of phytoplankton in a given time period. Despite their potential, researchers have not yet applied these methods to phytoplankton observation. The main reason for this is the lack of available datasets that meet the training requirements of video-level automatic recognition algorithms. As in Figure 1, existing phytoplankton datasets such as WHOI-Plankton [19], Kaggle-Plankton [20], etc., suffer from low resolution, grayscale maps, and a lack of video-level annotations, which make it difficult to extract effective phytoplankton features and localize the objects within the images. Furthermore, the individual-level annotations currently available, such as those provided by PMID2019 [21], do not include video-level data.
In this work, we introduce PMOT2023, a synthetic dataset of high-resolution video frame sequences of phytoplankton that can be used to develop and evaluate video-level automatic identification methods. As in Figure 2, it labels the position of the object in the picture and represents it in the video as a track with the same ID. We collected phytoplankton samples from the nearshore waters of Jiaozhou Bay, Qingdao, Shandong, China, and classified each phytoplankton in all images. Using the density and frequency of phytoplankton occurrence in the ocean as a guide, we generated four videos with varying densities and sample movement trajectories that reflect actual observation scenarios. The dataset contains a total duration of 1920s and 48,000 frames of images, each labeled with detailed positioning information, category, and movement trajectory for each phytoplankton. PMOT2023 is a high-resolution synthetic multi-object tracking (MOT) dataset that can facilitate the investigation of video-level automatic identification methods for phytoplankton. Furthermore, PMOT2023 can also be used for other deep learning algorithms, including video object detection, single object tracking, image object detection, image classification, and more, with only minimal preprocessing. We evaluated the performance of different automatic video identification methods on PMOT2023 and experimentally tested the feasibility of using a multi-object tracking approach for phytoplankton counting and concentration estimation. This work lays the foundation for the development of standardized, high-quality datasets for video-level automatic recognition algorithms in phytoplankton observation.
The remainder of this paper is organized as follows: Section 2 describes multi-object tracking and the current status of its application in phytoplankton; Section 3 describes the construction process of the PMOT2023 dataset; Section 4 performs data analysis on PMOT2023 and compares it with other datasets; Section 5 shows the performance performance and visualization results of the multi-object tracking method on the PMOT2023 platform; Section 6 presents conclusions and future research perspectives.

2. Phytoplankton Visual Tracking

Multi-object tracking is the challenge of automatically identifying multiple objects in a video and representing them as a set of highly accurate trajectories. In phytoplankton microscopic observation, multi-object tracking methods can help researchers to observe more intuitively and facilitate quantitative operations, such as counting and calculating phytoplankton density. With the rapid development of object detection [22,23,24,25,26,27], the accuracy of multi-object tracking has been greatly improved. Currently, tracking by detection is the most effective paradigm for MOT tasks. Many multi-object tracking efforts are based on SORT [28] (Simple Online And Realtime Tracking), DeepSORT [17], and JDE [29]. IOU-Tracker [30] (Intersection over Union-Tracker) directly computes the overlap between the tracklet of the previous frame and the detection. SORT first uses a Kalman filter to predict the future position and then associates it with the detection boxes to achieve tracking. The method of SORT is also used in other multi-object tracking efforts. DeepSORT uses a ReID model to generate appearance features for the object. JDE (joint det and embedding) combines detection and appearance feature learning into one model, reducing computational effort. FairMOT [31] has achieved a balance of speed and accuracy. Recently, SORT-based methods have been revitalized due to the improvement of object detection accuracy. BYTEtrack [18] incorporates low score detection results into the association process and achieves good results using only IOU association. BoT-SORT [32] (Bag of Tricks-SORT) improves Kalman filtering, boosts the results using camera motion compensation (CMC) [33], and balances the extent of the role of IOU and ReID [34,35,36,37,38,39] in the correlation to conduct state-of-the-art work on multiple datasets at MOT. However, currently, it is difficult to apply relevant multi-object tracking methods to phytoplankton observations, and the most significant obstacle is the lack of high-quality datasets. Multi-object tracking is a field that has specialized datasets in various scenarios. However, most of these datasets are focused on pedestrian and vehicle tracking. PETS2009 [40] is a relatively early pedestrian dataset, while MOT15 [41], MOT17 [42], and MOT20 [43] are the most popular datasets in the field of multi-object tracking, but they are limited to pedestrians and vehicles only. There are alternative datasets proposed for specific tasks, such as WILDTRACK [44] for multi-camera tracking and Youtube-VIS [45] for both tracking and semantic segmentation data. For autonomous driving, there are also specialized datasets, including KITTI [46], BDD100K [47], Waymo [48], and KITTI360 [49]. Some of these datasets focus on more diverse object categories than humans and vehicles, and ImageNet-Vid [50] provides trajectory annotations for 30 object categories in over 1000 videos. TAO [51] contains 833 categories and can be used to study the performance of algorithms with long-tailed distributed datasets. However, these datasets are only domain specific and not well-suited for direct application to phytoplankton observations.
Several phytoplankton datasets have been created. WHOI-Plankton [19] is a large-scale dataset for plankton classification, containing over 3.4 million images of 70 categories labeled by experts. The images were collected over almost 8 years by the Imaging FlowCytobot (IFCB) at the Martha’s Vineyard Coastal Observatory (MVCO), but only have image-level annotations and are only suitable for classification tasks. Kaggle-Plankton [20] is a plankton classification dataset consisting of 30,336 low-resolution grayscale images from 121 different classes; it also only contains image-level annotations. Researchers at Xiamen University created an information retrieval database of algal cells morphology by collecting 704 images from different perspectives. These images contained 144 species of common Chinese phytoplankton, mainly diatoms (93 species) and methanogens (40 species), and were annotated with main characteristic parameters and ecological distribution information. They also created a digital microscopic image database of phytoplankton containing 3239 microscopic images of 241 species. The PMID2019 [21] dataset contains 10,819 microscopic images of phytoplankton from 24 different categories, each annotated with bounding boxes and category information for each object. To extend the dataset to in situ applications, the makers of PMID2019 also used Cycle-GAN [52] to implement domain migration between dead and live cell samples. Although PMID2019 can be used to train and evaluate object detection methods for phytoplankton, it does not annotate video sequences and the annotation only distinguishes different categories, not different individuals, which makes the evaluation of tracking methods impossible.
We have produced the PMOT2023 dataset for the training and evaluation of multi-object tracking algorithms for phytoplankton. We utilized SORT, deepSORT, Bytetrack, and other methods to conduct experiments on the PMOT2023 dataset. In the results section, the paper presents the test results of different methods on both the PMOT2023 dataset and other multi-object tracking datasets.

3. Procedure for Constructing PMOT2023

3.1. Phytoplankton Sampling

To produce a high-quality synthetic video phytoplankton dataset, we collected an abundant sample of phytoplankton microscopic images. Due to the influence of environmental factors such as temperature, salinity, light, nutrient salts, and zooplankton feeding, the phytoplankton species composition and cell abundance show significant spatial and temporal variations. To obtain more comprehensive and realistic data, we collected phytoplankton samples of 21 species at different times and seasons in the nearshore waters of Jiaozhou Bay, Shandong, China, over a 2-year period. These included Ceratium furca, ceratium fucus, ceratium trichoceros, chaetoceros curvisetus, coscinodiscus, curve thalassiosira, guinardia delicatulad, helicotheca, lauderia cleve, skeletonema, thalassionema nitzschioides, thalassiosira nordenskioldi, sanguinea, thalassiosira rotula, Protoperidinium, Eucampia zoodiacus, Guinardia striata, and so on. During the collection, we included four zooplankton in the dataset simultaneously according to the frequency of occurrence, cladocera, tintinnid, and two classes of copepoda. The species collected include the most frequent phytoplankton in the waters of Jiaozhou Bay, as well as four categories of the most frequent zooplankton totaling 21 categories, which can meet the daily automatic observation of the waters of Jiaozhou Bay. Limited by the sampling means, we have no way to cover all the categories. We used the phytoplankton in situ observation equipment developed in our laboratory to capture and collect microscopic images of phytoplankton samples, during which we collected different individuals of a variety of phytoplankton to simulate real phytoplankton in situ measurement scenarios and provide sufficient knowledge for the automatic phytoplankton identification algorithm. These microscopic images are characterized by high resolution, and we also collected sufficient different morphologies of phytoplankton movement in the current. We supplemented this by taking microscopic images of phytoplankton cultured in the laboratory to generate our original data.

3.2. Dataset Design and Production Process

Observing phytoplankton can help prevent disasters, such as oceanic red tides, and improve the marine environment. Although various automatic phytoplankton identification algorithms are available [53,54,55,56], most of them operate at the image level, and there is a lack of video-level phytoplankton identification algorithms. Deep learning-based automatic identification algorithms rely on high-quality datasets, and the PMOT2023 dataset is a multi-video tracking dataset based on micrographs captured by phytoplankton in situ observation devices, which can assist deep learning models in producing better results. The PMOT2023 dataset contains 12 videos and 48,000 micrographs, encompassing 21 classes of phytoplankton. The PMOT2023 dataset will provide a tool for evaluating the performance of advanced video-level phytoplankton automatic identification methods.
As shown in Figure 3, we first collected seawater samples at different times and seasons in the nearshore waters of Jiaozhou Bay, Shandong, China. We collected microscopic images of phytoplankton samples in seawater with the help of phytoplankton in situ observation devices. The device contains a coaxial lens, imaged with the Hivision MV-CH20-10UC, and uses a peristaltic pump to extract seawater for observation. We cropped and segmented the collected images to produce sample sets. In the process of producing video data, first, phytoplankton samples were randomly selected in the sample set and randomly rotated, randomly scaled, and motion blur was added; second, random motion trajectories were generated using spline curves (as explained in next section); finally, selected phytoplankton samples were mapped onto the background according to the motion trajectories to create video frame sequences and generate annotations.
Extremes in phytoplankton density in the ocean are often accompanied by ecological anomalies, such as red tides, also known as harmful algal blooms (HABs), which are a global marine ecological anomaly caused by an overgrowth or accumulation of phytoplankton in the water column, resulting in discoloration of seawater. When red tide occurs, the average density of phytoplankton can reach 102–106 cells/mL, and because phytoplankton often appear in clumps, the instantaneous density of phytoplankton passing through the field of view of the microscope head at a given moment during the observation can even reach 5–10 times the average density. We set 5 μ L/min and 3 μ L/min of water flow through the microscope head for the observation. We produce the PMOT2023 dataset to fully consider the real situation and simulate more challenging data that better represent the varying conditions observed in situ, rather than just extreme situations such as red tide. The algorithm can be trained with this dataset and thus perform greater stability and generalization. We have designed four video models.
Firstly, these four video models represent different water velocities, phytoplankton densities, trajectories, and degrees of motion blur. These differences are determined by the various parameters used in generating random trajectories, as described in Section 3.2. In situ observations of phytoplankton often involve varying conditions such as differing phytoplankton densities which can lead to obscuring situations. The trajectory and speed of phytoplankton under the microscope can also vary, and fast movement can cause motion blurring. Our aim was to create a dataset that adequately simulates the original observations; hence, we created four video models that represent different observation scenarios, which are described in the article. Our purpose in constructing this dataset is to assist in the study of multi-object tracking algorithms. Each video model presents unique challenges to automatic recognition algorithms, which helps in the training and evaluation of different methods. Additionally, this dataset can be used as a basis for selecting automatic recognition methods for different situations in practical applications.
  • DENSE-FAST: We designed a 8 min video; in the extreme case, we assumed a control water flow rate of 5 μ L/min flowing through the microscope head; the 8 min synthetic video contains 950 phytoplankton tracks; we set the video frame rate to 25; the whole video contains a many of categories switching and phytoplankton individual occlusion. The DENSE-FAST represents the most challenging situation for the automatic identification algorithm during in situ phytoplankton observation.
  • DENSE-SLOW: The 8 min video contains 405 phytoplankton trajectories, simulating a 3 μ L/min flow rate through the microscope head during the observation process. The phytoplankton in the video have a slower movement speed than DENSE-FAST.
  • SPARSE: The 8 min video contains 630 phytoplankton tracks, in which the phytoplankton also have a slower movement speed. It represents the general situation of phytoplankton occurrence during in situ observation of phytoplankton.
  • CHALLENGE: This video sequence is more challenging. Eight minutes of video contain 1160 phytoplankton tracks. The speed of movement of each individual has greater variability and is accompanied by a change in appearance and size. PMOT2023-CHALLENGE was designed to train and evaluate the stability and generalization of the automatic phytoplankton identification algorithm for the specific case of in situ phytoplankton observation.

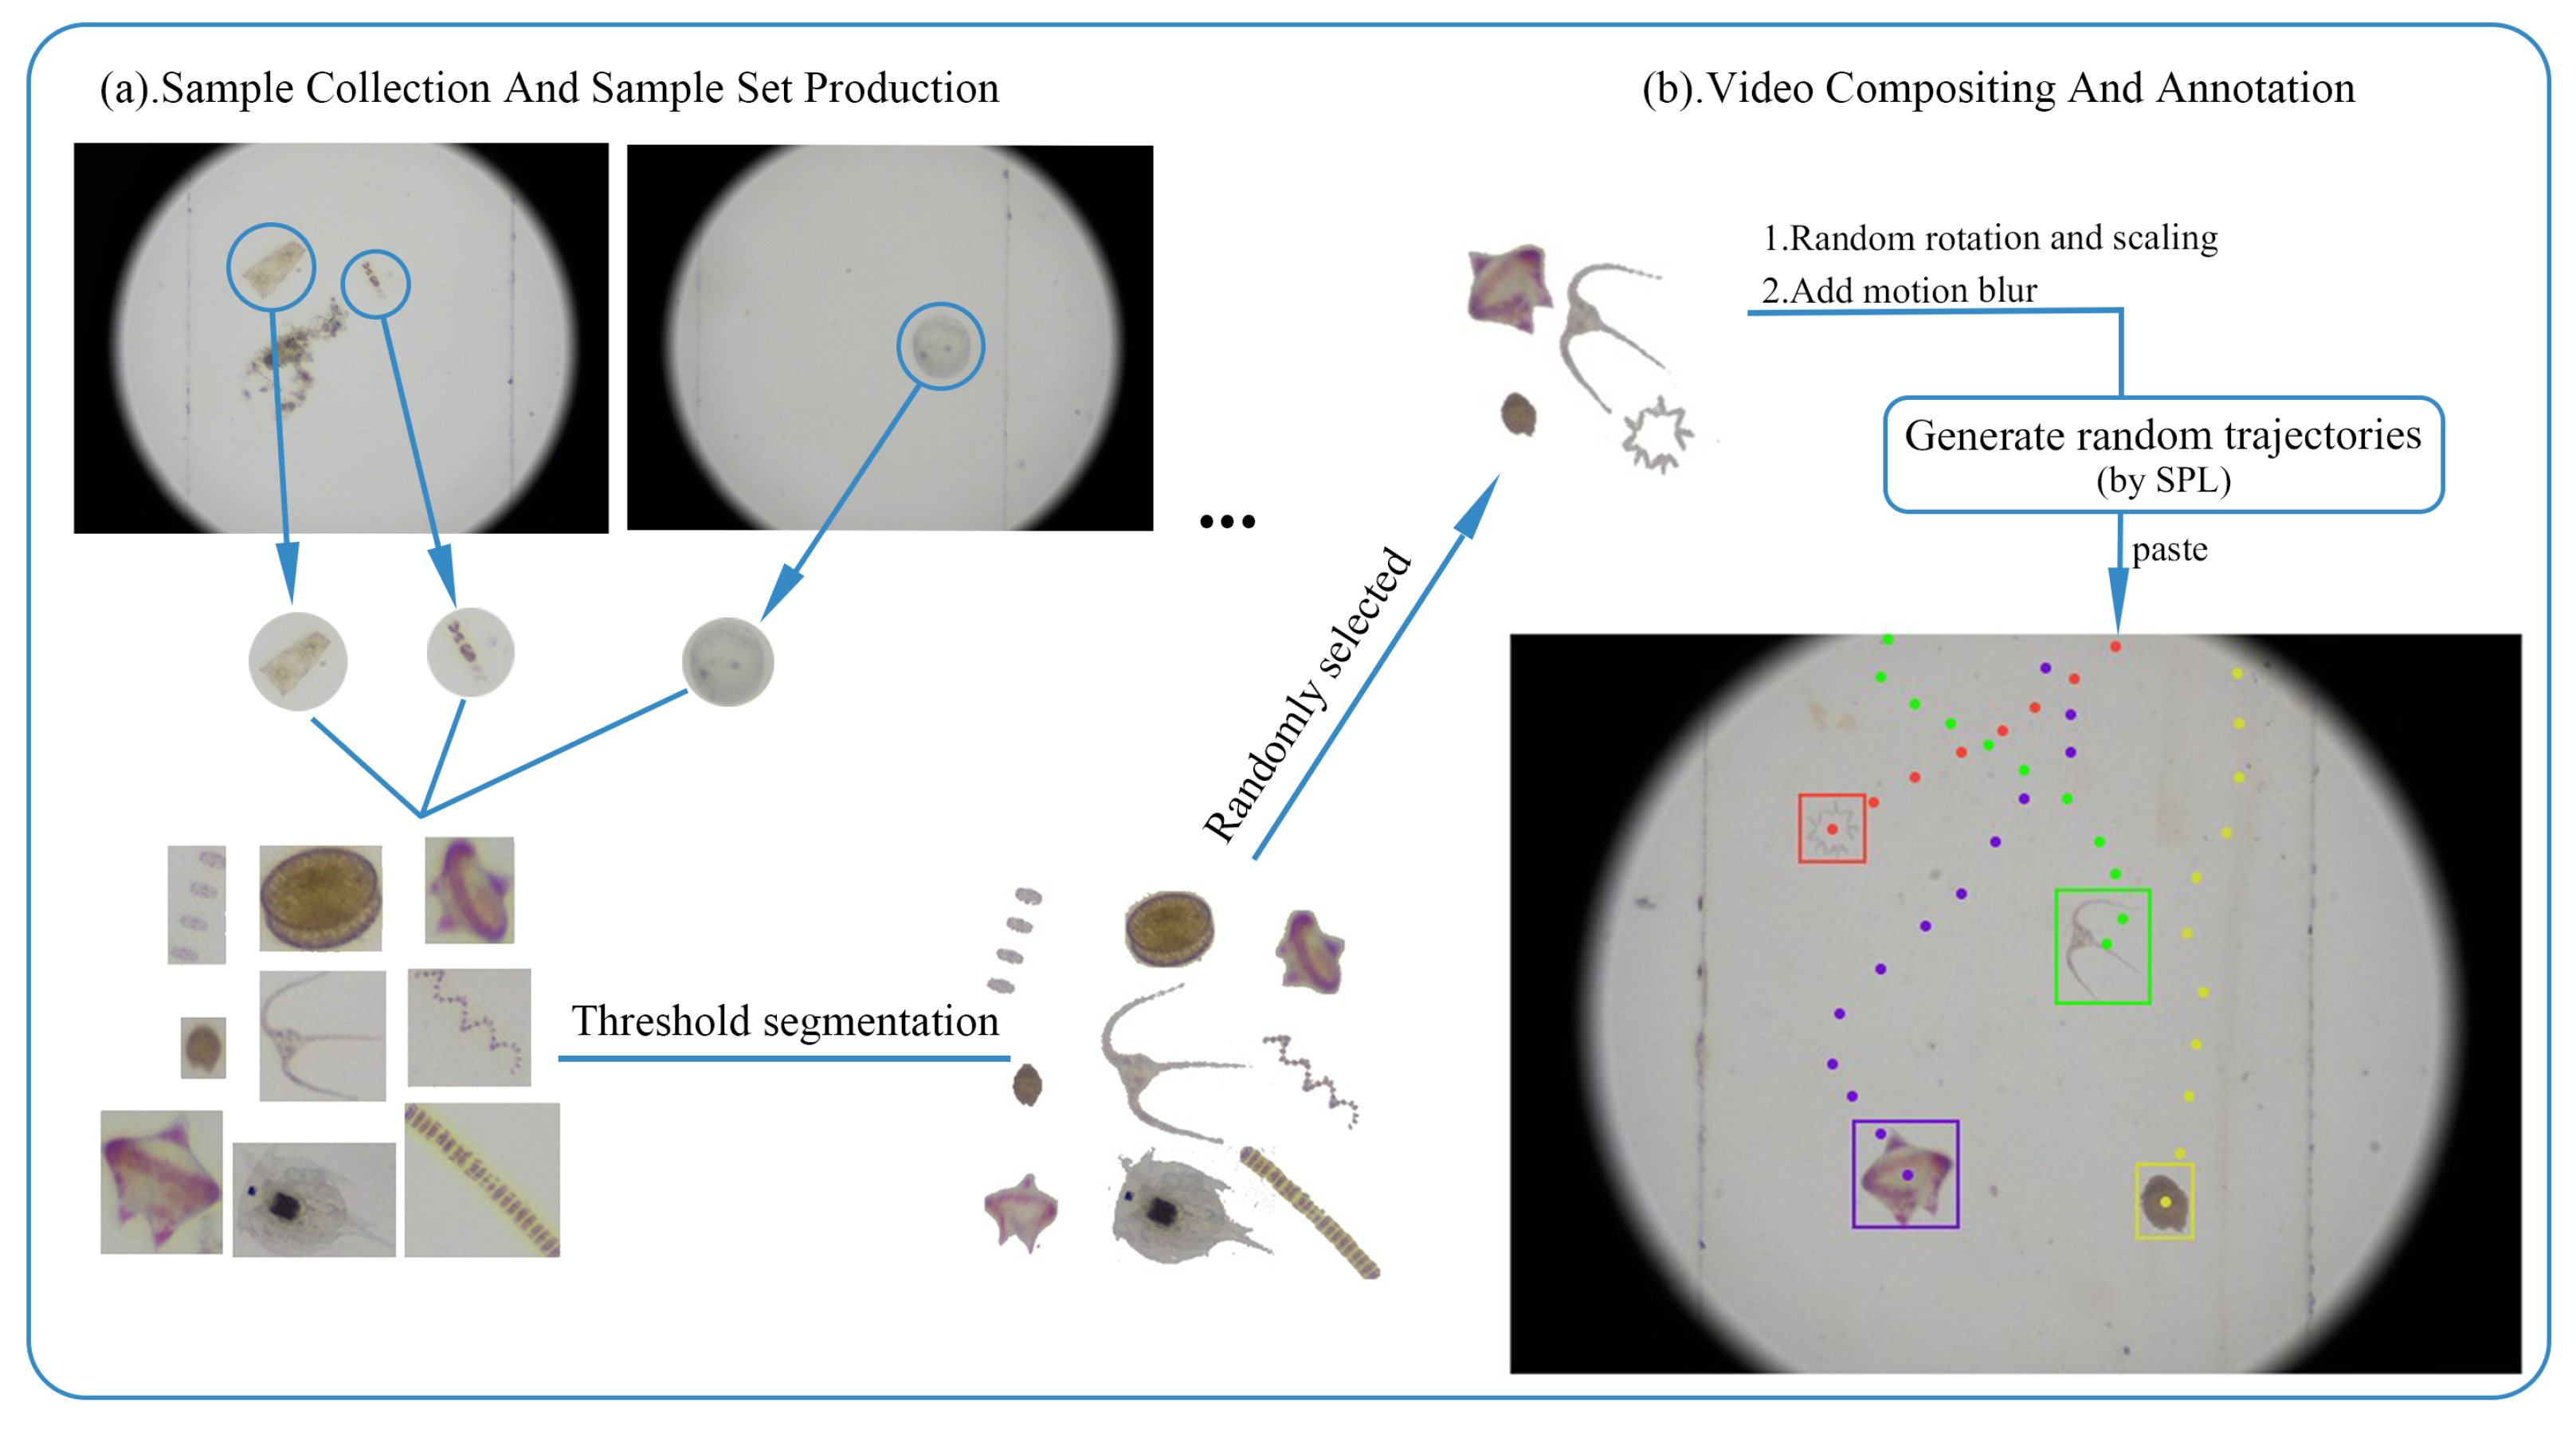
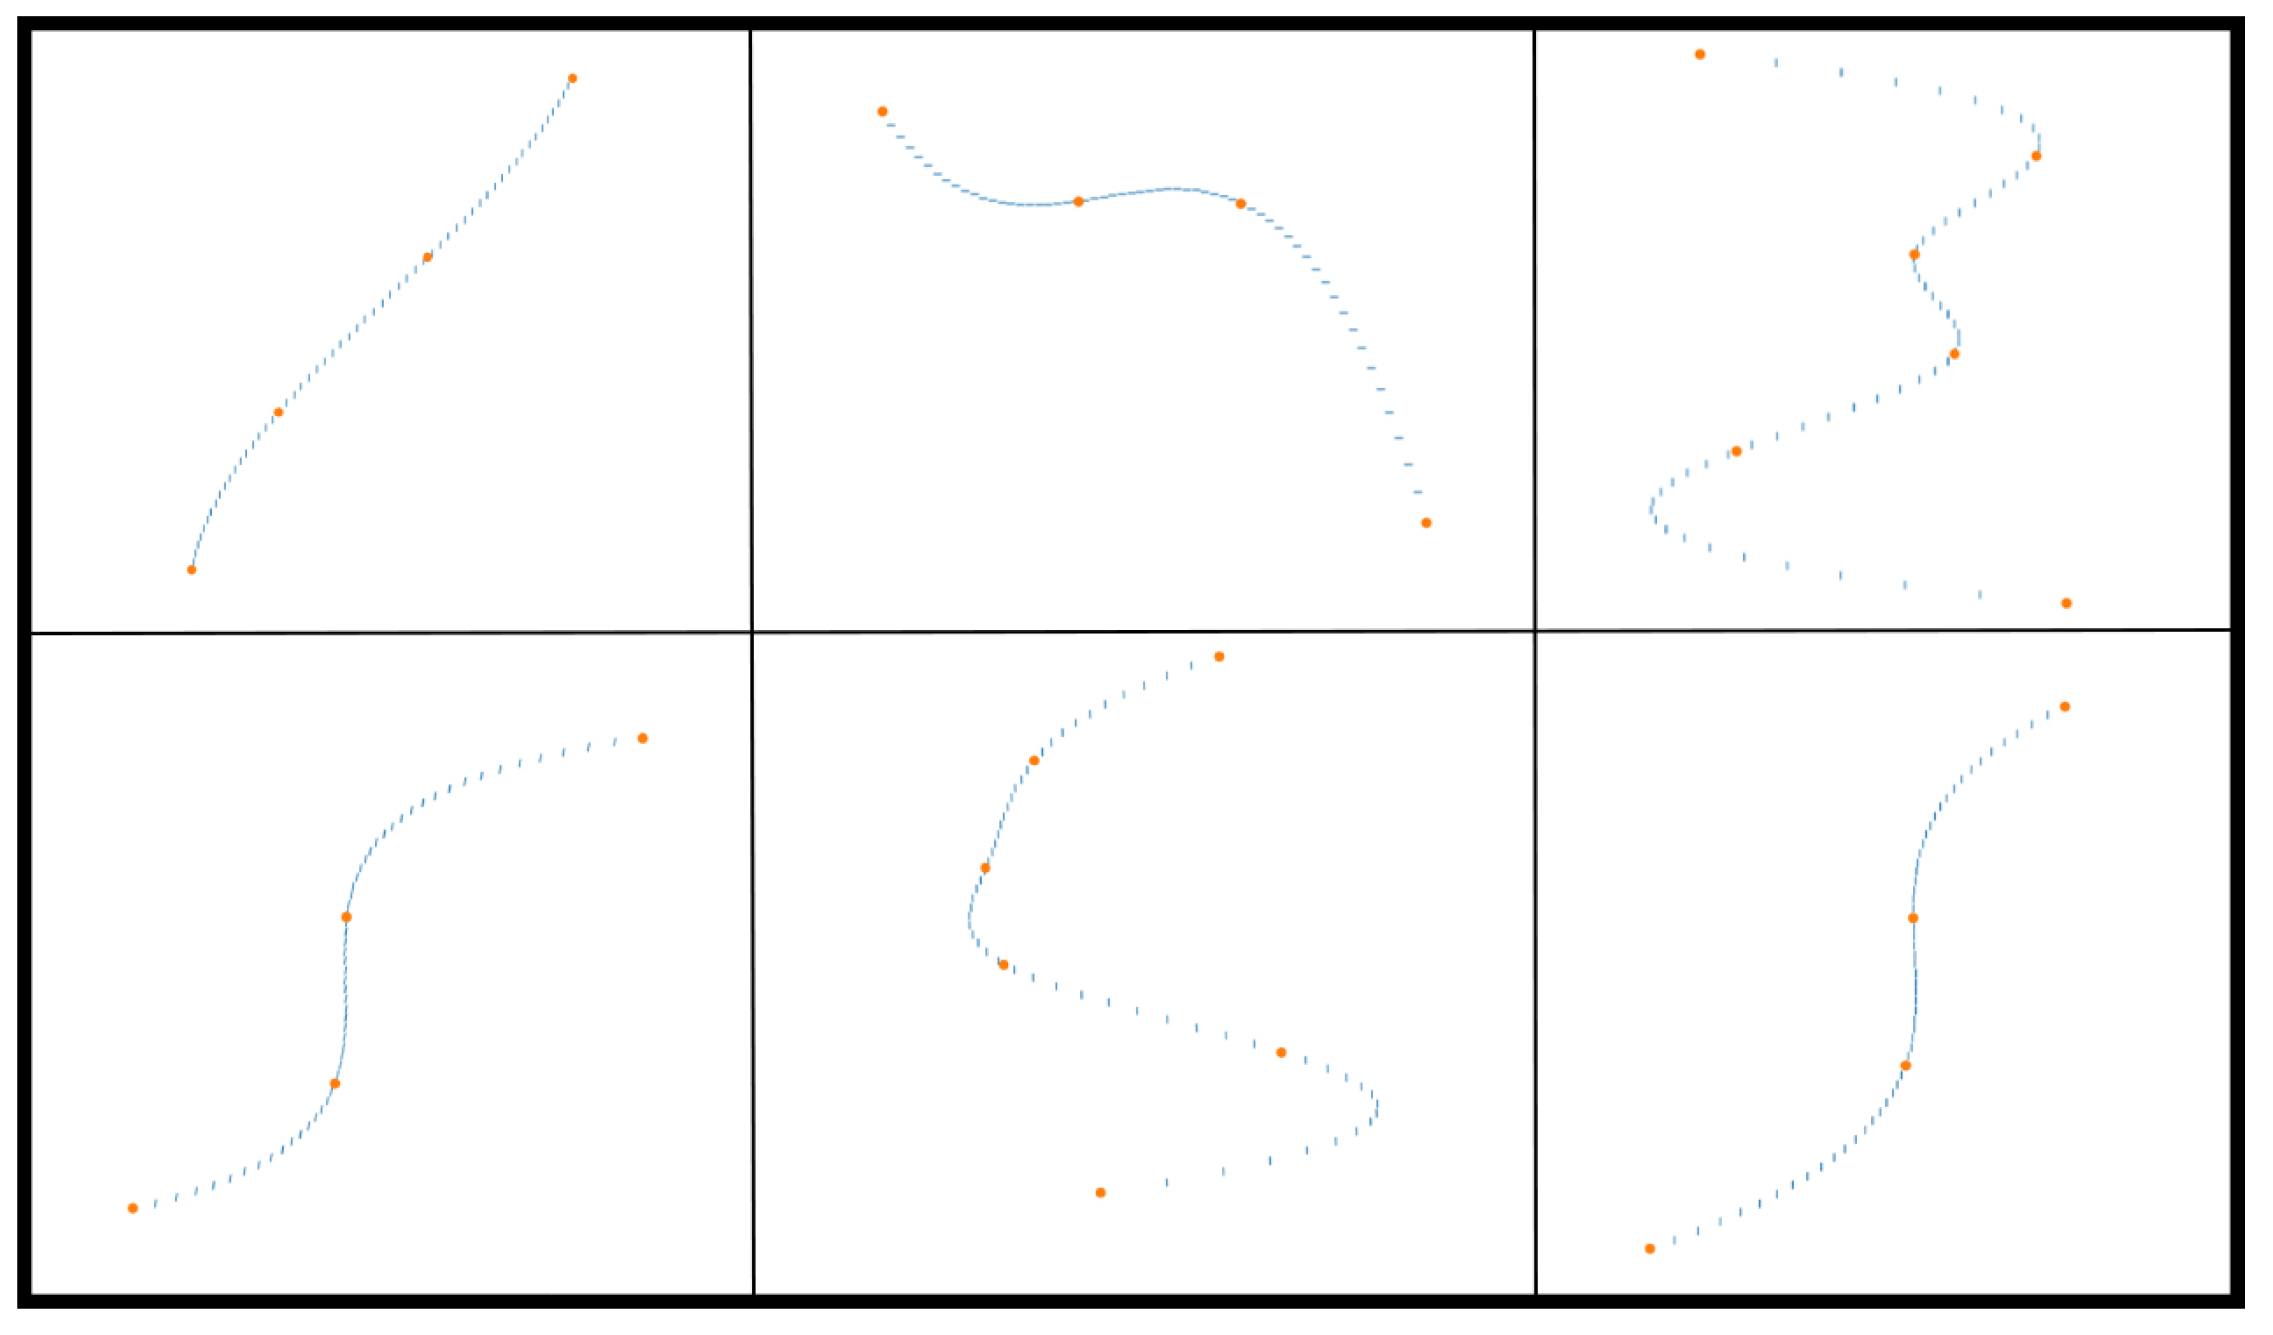
3.3. Video Data Production and Annotation Generation

Before making the PMOT2023 dataset, we first processed and expanded the collected sample sets. We cropped each sample set to the sample size, and then, made alternative samples by OTSU [57] threshold segmentation algorithm. We designed the program to synthesize the video, and in the process of synthesis, we ensured full randomness while considering the real situation. First, we ensured that each algal sample passing through the observation field was randomly selected and the composite video was randomly data-enhanced. These random data enhancements include random rotation and random scale resizing, which simulate the different poses of phytoplankton. Figure 4a shows the sample set images after threshold segmentation. These sample set images were used to produce the PMOT2023 dataset, as shown in Figure 4b.
In order to ensure the randomness of the phytoplankton motion trajectory in the synthetic video, we design a random function to simulate the real motion trajectory of the phytoplankton in the observation. We first select key points of the phytoplankton in the field of view every n-th frame and generate the trajectory curve by using the key points and the spline curve formula. Using X t , Y t to denote the horizontal position and vertical position of sample i at frame t, we calculate the position X t + n , Y t + n where this sample will appear in the image at frame t + n by the random function.
X t + n = X t + R a n d ( 1 , 1 ) × R a n d ( a , b ) + C x
Y t + n = Y t + R a n d ( c , d ) + C y
where R a n d is a function of randomly selected integers in a certain range. a and b are two constants that control the range of random left–right motion of the object in the field of view. In the process of making the dataset, a, b were set randomly, which can ensure the randomness of phytoplankton movement. Of course, we added some boundary rules at the same time. For instance, a and b, in order to control the phytoplankton movement, should not exceed the width of the video interface (4096 pixels). c, d are responsible for controlling the random range of vertical movement of the phytoplankton. During the production process, we give c and d values of −25 pixels and 25 pixels, respectively. R a n d ( 1 , 1 ) in Equation (1) controls the overall direction of the phytoplankton moving left and right in the video. C x and C y are constants, responsible for controlling the average motion pattern of the phytoplankton throughout the video. We default C x to 0 during the production of PMOT2023. C y is used to control the velocity of the phytoplankton movement in the vertical direction and is a positive value (water velocity from top to bottom). In the four video modes DENSE-FAST, DENSE-SLOW, SPARSE, CHALLENGE, we set different C y , which are n × 55 , n × 35 , n × 35 , and n × 65 . These parameters are convenient for quick setting when synthesizing new data.
After the above calculation, m key points are randomly selected and the horizontal and vertical coordinates are noted as [ x 0 , x 1 , x 2 x m ] and [ y 0 , y 1 , y 2 y m ] . These key points are used as control points to generate trajectories via B spline curves [58]. We assume that the current target stays in the field of view for f frames, and the final result is to calculate the position of the trajectory in each frame of the picture, denoted as [ X 0 , X 1 , X 2 X f ] and [ Y 0 , Y 1 , Y 2 Y f ] . Obviously, f < m .
[ X 0 , X 1 , X 2 X f ] , [ Y 0 , Y 1 , Y 2 Y f ] = B S p l i n e I n t e r ( [ x 0 , x 1 , x 2 x m ] , [ y 0 , y 1 , y 2 y m ] )
where B S p l i n e I n t e r is the B spline curve interpolation function (finds the B-spline representation of a 1-D curve). As in Figure 5, we finally obtain the position of the randomly generated object trajectory at each frame.
While synthesizing the videos, we recorded the position of the phytoplankton in the field of view and recorded the trajectory of the phytoplankton. With the help of this information, we wrote script programs to generate multi-object tracking annotations. Accurate annotation is essential for effective deep learning, and sufficient data for supervised learning are the basis for deep learning algorithms to exhibit good performance. We performed detailed annotation on each image frame. These annotations include the corner points of the bbox where the phytoplankton are located, and the category of the phytoplankton encompasses four different zooplankton categories. The same object has the same ID in all frames in which it appears in the video, forming a track. The PMOT2023 annotation also includes the visibility rate. When an object is occluded by another object or is occluded at the edge of the field of view, we calculate the percentage of the portion that is not visible, labeled with the visibility rate. In the process of training the detector, the researcher can use the occlusion factor to filter out objects with high occlusion rates when training the detector. Figure 6 shows the annotation details, where each object is tightly surrounded by an annotation box, and its category and occlusion factor are shown.

4. PMOT2023 Statistics and Analysis

4.1. Dataset Setup and Statistics

The PMOT2023 dataset contains a total of 1920 s of video, with a total of 48,000 consecutive high-resolution video frames. We divided these data into a training set, a validation set, and a test set. During the training process, the algorithm adjusts its parameters based on the patterns and features observed in the training data. The validation set is used in the training process to see if the model training is going in a bad direction and to indicate the training direction, but is not directly involved in the training. The test set is used in the testing process to evaluate the generalization ability of the final model. However, it cannot be used as a basis for algorithm-related choices such as tuning, selecting features, or other algorithmic decisions. PMOT2023 prepares a training set, validation set, and test set for the algorithm in the following proportions.
S e t t r a i n : S e t v a l : S e t t e s t = 15 : 3 : 2
To ensure the fairness of using the test set to evaluate the algorithm, we construct the test set with a different sample set from the validation set and the training set. This ensures that the knowledge in the two datasets is not confused and the test data are not leaked. Table 1 indicates the detailed data set settings of PMOT2023. We produced 12 videos in the PMOT2023 dataset, using four 360 s videos as the training set, four 72 s videos as the validation set, and four 48 s videos as the test set by default. The training set, test set and validation set keep the distribution of corresponding video patterns close in terms of length, number of bounding boxes, scenes, and motion diversity.
After capturing the video, we meticulously labeled each frame with the ID, location of the bbox, and phytoplankton category. We calculated the number of bboxes for each category in the PMOT2023 dataset. As we randomly selected samples when creating the video, the number of samples for each category in the PMOT2023 dataset is relatively balanced. This helps mitigate the loss caused by the long-tail distribution of data during the training of automatic identification algorithms. Previous phytoplankton datasets, such as PMID2019 (a phytoplankton microscopic image dataset), have shown highly unbalanced category data, with a ten-fold difference between the classes with the highest number of samples and those with the lowest number. The same problem was observed in our initially collected sample set. As shown in Figure 7, the number of categories in the PMOT2023 dataset is more balanced, and the original sample set collection data categories are not balanced. It is important to ensure the balance of PMOT2023 category data; unbalanced data can mislead the training of deep learning models and bias the models towards the overrepresented categories. Due to the unbalanced nature of the collected sample data, in the process of synthesizing the video data, we ensure that each category is sampled with the same probability to try to avoid the impact of unbalanced PMOT2023 data on model training.

4.2. Comparison of Existing Datasets

For deep learning, a dataset needs to have sufficient data volume to support both training and evaluation of the model. In the field of multi-object tracking, the MOT17 [42] and MOT20 [43] datasets are considered large-scale. In Table 2, we compare PMOT2023 to MOT17 and MOT20 in terms of data volume, including the number of video frame images, bounding boxes, tracks, and included categories. PMOT2023 has a greater number of images and categories compared to both datasets, while having a similar track count to MOT20. Additionally, we compare PMOT2023 to PMID2019, a large-scale target detection dataset for phytoplankton, in Table 3.
Phytoplankton are widely distributed in the ocean with a large number of categories. The accuracy of the automatic identification algorithm classification is a very important index in the process of in situ observation of phytoplankton. The multi-object tracking algorithm suited for in situ observation of phytoplankton should not only accurately locate the phytoplankton and represent the movement trajectory of phytoplankton, but also should accurately classify the phytoplankton. Therefore, the most important feature of the phytoplankton multi-object tracking dataset that distinguishes it from the pedestrian-vehicle multi-object tracking dataset is the number of categories. The commonly used multi-object tracking dataset MOT20 contains 13 categories that classify pedestrians and vehicles at fine granularity, such as people in cars, pedestrians, etc. PMOT2023 contains 21 categories of object, with up to 14 categories of object in a single frame. The videos in PMOT2023 have more category variations, and previous multi-object tracking methods rarely consider category information into the matching strategy of multi-object tracking. PMOT2023 can help researchers improve multi-object tracking methods under the challenge of videos with rich category variations.
PMOT2023 has some other differences compared to other datasets. As shown in Figure 8, PMOT2023 foreground and background are more difficult to distinguish due to the small color difference, which also presents a greater challenge for the detection branch in multi-object tracking of phytoplankton, Figure 8a exemplifies the challenge of PMOT2023. Figure 8b is the PMID2019 [21] phytoplankton object detection dataset, which has clearer appearance features for detection in comparison.
PMOT2023 contains sufficient information on phytoplankton localization and classification and requires only simple processing to be used as a object detection dataset. We counted the PMID2019 dataset as a phytoplankton object detection dataset and compared the number of bboxes, categories, and other information contained in the dataset. As shown in Table 3, compared with other object detection datasets, the PMOT2023 without data cleaning has sufficient data as a object detection dataset, and even after data cleaning, PMOT2023 can help researchers train excellent phytoplankton image level automatic recognition and object detection algorithm models.
Previous phytoplankton datasets have not been annotated at video level, and PMOT2023, as a dataset for video-level annotation of phytoplankton, facilitates the development of deep learning-based video-level automatic identification algorithms. Video-based phytoplankton auto-identification algorithms help researchers to obtain useful information from the large number of videos collected continuously and for long periods of time during in situ phytoplankton observations. The algorithm of real-time video automatic identification can help researchers to obtain dynamic information of phytoplankton instantly and continuously for studying seasonal changes of phytoplankton populations. At the same time, the real-time automatic identification algorithm helps researchers effectively predict the prevention of marine ecological disasters caused by phytoplankton blooms by monitoring the abundance and distribution of phytoplankton and predicting the occurrence of harmful algal blooms.

5. Result

5.1. MOT Evaluation Criteria

To evaluate the performance of a deep learning model in various tasks, quantitative metrics are required to enable a side-by-side comparison. Various evaluation metrics exist to assess the performance of multi-objective tracking algorithms. The confusion matrix is a common evaluation tool for supervised learning and is mainly used to compare classification results with actual measured values. False positives (FP) represent instances where the model incorrectly identifies a negative sample as positive, while true positives (TP), true negatives (TN), and false negatives (FN) are also commonly used indicators. In MOT, the most critical metrics include Multiple Object Tracking Accuracy (MOTA), which measures the performance of detecting objects and maintaining trajectories by considering the recall and accuracy of ID switching to detection frames. Equation (4) shows how MOTA is calculated, where F P t denotes the number of false detections (false positives) in frame t, F N t denotes the number of missed detections (false negatives), I D S W t denotes the number of ID Switches (where IDs are incorrectly reassigned to another target), and G T t denotes the number of true targets (ground truth). Identification F-Score (IDF1), which incorporates ID recall and accuracy into the calculation and places more emphasis on the accuracy of trajectory and detection frame association. Equation (5) shows how IDF1 is calculated, where N denotes the number of targets, w i denotes the intersection ratio of the i-th target, and w i ^ denotes the intersection ratio of the i-th target matched to.
M O T A = 1 t ( F P t + F N t + I D S W t ) t G T t
I D F 1 = 2 · i = 1 N w i i = 1 N w i + i = 1 N w i ^
A successful multi-object detection algorithm should achieve good results and balance across multiple evaluation metrics.

5.2. Comparison of Different Multi-Object Tracking Methods

Most of the current multi-object tracking follows the tracking by detection paradigm, which takes certain association strategies to associate the detection frames of different frames of the video to form trajectories after the detector output results. SORT, DeepSORT, BYTEtrack, BoT-SORT are excellent matching strategies, which we introduced in Section 2. DeepMOT [59] incorporates a differentiable Hungarian matching module that optimizes the tracker’s association output in a continuous, end-to-end manner, enabling efficient training and joint optimization of the feature extractor and the association module. StrongSort [60] upgrades and improves the classic tracker DeepSORT, including enhancements to detection, embedding, and association. Its authors also propose the appearance information-independent global linking model (AFLink) and the Gaussian smooth interpolation (GSI) method to compensate for missed detections. As shown in Table 4, we conducted some experiments to verify the performance of different association strategies on the PMOT2023 dataset, and the experiments mainly used MOTA, IDF1, and IDSW as evaluation metrics. We use Recall and IDRecall to denote the recall of bounding box and trajectory ID and Prcn to denote the accuracy of bounding box. Tracking by detection paradigm in multi-object tracking uses detectors to detect objects in each frame and then correlates these detections to form trajectories through tracking strategies to achieve multi-object tracking. For the sake of fair experiments, we kept the detector fixed and used the current state-of-the-art YOLOv7 object detection algorithm to obtain detection frame results. We also maintained the same parameters in the detector component to control variables and assess the performance of various association strategies.

5.3. Phytoplankton Counts and Density Estimates

Multi-object tracking methods perform counting functions while indicating different objects in the video as different trajectories. There is often a demand for counting the number of different phytoplankton species passing through the field of view during in situ observations. It is more efficient to adopt an algorithm for automatic identification than to collect data in situ and screen them manually in the laboratory. As in Table 5, we show the results of Bytetrack and DeepSORT counts, including the total number of phytoplankton and the total number of the three species, Ceratium furca, skeletonema, and helicotheca. During the experiment, the detector outputs the position of each object in the current detection frame, including the coordinates of the bounding box’s top-left and bottom-right corners, as well as the category of each object. The tracking process utilizes this information and generates the final tracking result by comparing it with the tracking results of past frames and comparing it with the predicted results. We use the Yolov7 object detection algorithm in conjunction with the tracking algorithm to produce trajectories from the detection results. We initially tallied the number of phytoplankton in the PMOT2023 test sets DENSE-FAST, DENSE-SLOW, and SPARSE, along with the count of each phytoplankton category marked as groundtruth. We then compared the tracking count results to ground truth with errors all within acceptable limits. We found that the counts of Bytetrack were more stable than DeepSORT. The Yolov7 was used as the detector during the experiment.
A more important indicator in phytoplankton in situ observations is the density of phytoplankton. We can estimate the density of phytoplankton from the flow of water and the count results of the tracking algorithm. This can help researchers monitor phytoplankton population changes and serve as an early warning of marine ecological disasters, etc. By the residence time of phytoplankton in the field of view, DENSE-FAST, DENSE-SLOW, and SPARSE in PMOT2023 represent the current velocity passing through the field of view at 5 μ L/min, 3 μ L/min, and 3 μ L/min, respectively. We calculated the density for all phytoplankton in the test set, as well as the densities of phytoplankton Ceratium furca, skeletonema, and helicotheca, labeled as ground truth.The results of Bytetrack density estimation are shown and compared with ground truth as in Table 6, with the unit of measurement being the number of phytoplankton per microliter.

5.4. Visualization Results

We have presented visualizations of the results of our multi-object tracking algorithm, providing an intuitive way to observe how this approach can be applied to identify and track phytoplankton. Figure 9 displays the multi-object tracking results, including the target class, ID, location, and historical tracks. Specifically, Figure 9a–d represent the four segments of the test set. We use different colors to indicate different individuals appearing in the video, with each ID representing a unique target. The ID in the visualization result represents the first phytoplankton appearing in the video, enabling the counting of phytoplankton. These count results, together with water velocity or flow data, can be used to calculate phytoplankton concentration over time.

6. Conclusions

In conclusion, this work presents the PMOT2023 dataset, specifically designed for a video-level automatic identification algorithm for phytoplankton. By collecting phytoplankton samples and simulating real situations, we produced 48,000 frames of video with detailed annotations, making it a valuable resource for other video-level and image-level deep learning algorithms. With only minimal preprocessing, the dataset can be utilized for various applications, such as video object detection, single object tracking, image object detection, and image classification.
Moreover, PMOT2023 enables the implementation of video-level automatic phytoplankton identification algorithms, including multi-object tracking, which can be utilized for phytoplankton detection, classification, counting, and density estimation. By evaluating different tracking methods applied to phytoplankton based on PMOT2023, we have demonstrated the effectiveness of our dataset in advancing the field of phytoplankton research. Finally, we have implemented phytoplankton counting and density estimation using multi-object tracking methods, and the results demonstrate the potential of our dataset in enabling more accurate and efficient monitoring of phytoplankton populations in aquatic environments. Overall, PMOT2023 has the potential to advance the study of phytoplankton populations and their impacts on aquatic ecosystems. Relevant codes and data will be organized in https://github.com/yjainqdc/PMOT2023 (accessed on 21 April 2023).

Author Contributions

Conceptualization, J.Y.; Methodology, Q.L. (Qingxuan Lv); Software, J.Y.; Investigation, Q.L. (Qingxuan Lv); Resources, J.D.; Data curation, H.Z. and Q.L. (Qiong Li); Writing—original draft, J.Y.; Writing—review and editing, Q.L. (Qingxuan Lv), Y.L. and J.D. All authors have read and agreed to the published version of the manuscript.

Funding

This research was funded by National Natural Science Foundation of China, U1706218.

Data Availability Statement

The data presented in this study are available upon request from the corresponding author.

Conflicts of Interest

The authors declare no conflict of interest.

References

  1. Charlson, R.J.; Lovelock, J.E.; Andreae, M.O.; Warren, S.G. Oceanic phytoplankton, atmospheric sulphur, cloud albedo and climate. Nature 1987, 326, 655–661. [Google Scholar] [CrossRef]
  2. Paul, J.; Scholin, C.; van den Engh, G.; Perry, M.J. In situ instrumentation. Oceanography 2007, 20, 70–78. [Google Scholar] [CrossRef]
  3. Stelmakh, L.; Kovrigina, N.; Gorbunova, T. Phytoplankton Seasonal Dynamics under Conditions of Climate Change and Anthropogenic Pollution in the Western Coastal Waters of the Black Sea (Sevastopol Region). J. Mar. Sci. Eng. 2023, 11, 569. [Google Scholar] [CrossRef]
  4. Zhang, M.; Jiang, R.; Zhang, J.; Li, K.; Zhang, J.; Shao, L.; He, W.; He, P. The Impact of IMTA on the Spatial and Temporal Distribution of the Surface Planktonic Bacteria Community in the Surrounding Sea Area of Xiasanhengshan Island of the East China Sea. J. Mar. Sci. Eng. 2023, 11, 476. [Google Scholar] [CrossRef]
  5. Park, K.W.; Oh, H.J.; Moon, S.Y.; Yoo, M.H.; Youn, S.H. Effects of Miniaturization of the Summer Phytoplankton Community on the Marine Ecosystem in the Northern East China Sea. J. Mar. Sci. Eng. 2022, 10, 315. [Google Scholar] [CrossRef]
  6. Wang, X.; Sun, J.; Yu, H. Distribution and Environmental Impact Factors of Phytoplankton in the Bay of Bengal during Autumn. Diversity 2022, 14, 361. [Google Scholar] [CrossRef]
  7. Baohong, C.; Kang, W.; Xu, D.; Hui, L. Long-term changes in red tide outbreaks in Xiamen Bay in China from 1986 to 2017. Estuar. Coast. Shelf Sci. 2021, 249, 107095. [Google Scholar] [CrossRef]
  8. Warren, J.; Stanton, T.; Benfield, M.; Wiebe, P.; Chu, D.; Sutor, M. In situ measurements of acoustic target strengths of gas-bearing siphonophores. ICES J. Mar. Sci. 2001, 58, 740–749. [Google Scholar] [CrossRef]
  9. Roesler, C.; Uitz, J.; Claustre, H.; Boss, E.; Xing, X.; Organelli, E.; Briggs, N.; Bricaud, A.; Schmechtig, C.; Poteau, A.; et al. Recommendations for obtaining unbiased chlorophyll estimates from in situ chlorophyll fluorometers: A global analysis of WET Labs ECO sensors. Limnol. Oceanogr. Methods 2017, 15, 572–585. [Google Scholar] [CrossRef]
  10. Sullivan-Silva, K.B.; Forbes, M.J. Behavioral study of zooplankton response to high-frequency acoustics. J. Acoust. Soc. Am. 1992, 92, 2423. [Google Scholar] [CrossRef]
  11. Picheral, M.; Grisoni, J.M.; Stemmann, L.; Gorsky, G. Underwater video profiler for the “in situ” study of suspended particulate matter. In Proceedings of the IEEE Oceanic Engineering Society, OCEANS’98, Conference Proceedings (Cat. No. 98CH36259). Nice, France, 28 September–1 October 1998; Volume 1, pp. 171–173. [Google Scholar]
  12. Olson, R.J.; Sosik, H.M. A submersible imaging-in-flow instrument to analyze nano-and microplankton: Imaging FlowCytobot. Limnol. Oceanogr. Methods 2007, 5, 195–203. [Google Scholar] [CrossRef]
  13. Poulton, N.J. FlowCam: Quantification and classification of phytoplankton by imaging flow cytometry. In Imaging Flow Cytometry; Springer: New York, NY, USA, 2016; pp. 237–247. [Google Scholar]
  14. Blok, R.D.; Debusschere, E.; Tyberghein, L.; Mortelmans, J.; Hernandez, F.; Deneudt, K.; Sabbe, K.; Vyverman, W. Phytoplankton dynamics in the Belgian coastal zone monitored with a Cytosense flowcytometer. In Book of Abstracts; Vliz: Oostende, Belgium, 2018. [Google Scholar]
  15. Dubelaar, G.; Gerritzen, P.L. CytoBuoy: A step forward towards using flow cytometry in operational oceanography. Sci. Mar. 2000, 64, 255–265. [Google Scholar] [CrossRef]
  16. de Blok Reinhoud, L.T.; Mortelmans, J.; Sabbe, K.; Vanhaecke, L.; Vyverman, W. Near real-time monitoring of coastal phytoplankton. In Book of Abstracts; Vliz: Oostende, Belgium, 2015. [Google Scholar]
  17. Wojke, N.; Bewley, A.; Paulus, D. Simple online and realtime tracking with a deep association metric. In Proceedings of the 2017 IEEE International Conference on Image Processing (ICIP), Beijing, China, 17–20 September 2017; pp. 3645–3649. [Google Scholar]
  18. Zhang, Y.; Sun, P.; Jiang, Y.; Yu, D.; Weng, F.; Yuan, Z.; Luo, P.; Liu, W.; Wang, X. Bytetrack: Multi-object tracking by associating every detection box. In Proceedings of the European Conference on Computer Vision, Glasgow, UK, 23–28 August 2022; pp. 1–21. [Google Scholar]
  19. Orenstein, E.C.; Beijbom, O.; Peacock, E.E.; Sosik, H.M. Whoi-plankton-a large scale fine grained visual recognition benchmark dataset for plankton classification. arXiv 2015, arXiv:1510.00745. [Google Scholar]
  20. Zheng, H.; Wang, R.; Yu, Z.; Wang, N.; Gu, Z.; Zheng, B. Automatic plankton image classification combining multiple view features via multiple kernel learning. BMC Bioinform. 2017, 18, 570. [Google Scholar] [CrossRef] [PubMed]
  21. Li, Q.; Sun, X.; Dong, J.; Song, S.; Zhang, T.; Liu, D.; Zhang, H.; Han, S. Developing a microscopic image dataset in support of intelligent phytoplankton detection using deep learning. ICES J. Mar. Sci. 2020, 77, 1427–1439. [Google Scholar] [CrossRef]
  22. Girshick, R. Fast r-cnn. In Proceedings of the IEEE International Conference on Computer Vision, Santiago, Chile, 7–13 December 2015; pp. 1440–1448. [Google Scholar]
  23. Ren, S.; He, K.; Girshick, R.; Sun, J. Faster r-cnn: Towards real-time object detection with region proposal networks. In Proceedings of the Advances in Neural Information Processing Systems, Montreal, QC, Canada, 7–12 December 2015; Volume 28. [Google Scholar]
  24. Redmon, J.; Divvala, S.; Girshick, R.; Farhadi, A. You only look once: Unified, real-time object detection. In Proceedings of the IEEE Conference on Computer Vision and Pattern Recognition, Las Vegas, NV, USA, 27–30 June 2016; pp. 779–788. [Google Scholar]
  25. Bochkovskiy, A.; Wang, C.Y.; Liao, H.Y.M. Yolov4: Optimal speed and accuracy of object detection. arXiv 2020, arXiv:2004.10934. [Google Scholar]
  26. Duan, K.; Bai, S.; Xie, L.; Qi, H.; Huang, Q.; Tian, Q. Centernet: Keypoint triplets for object detection. In Proceedings of the IEEE/CVF International Conference on Computer Vision, Seoul, Republic of Korea, 27 October–2 November 2019; pp. 6569–6578. [Google Scholar]
  27. Wang, C.Y.; Bochkovskiy, A.; Liao, H.Y.M. YOLOv7: Trainable bag-of-freebies sets new state-of-the-art for real-time object detectors. arXiv 2022, arXiv:2207.02696. [Google Scholar]
  28. Bewley, A.; Ge, Z.; Ott, L.; Ramos, F.; Upcroft, B. Simple online and realtime tracking. In Proceedings of the 2016 IEEE International Conference on Image Processing (ICIP), Phoenix, AZ, USA, 25–28 September 2016; pp. 3464–3468. [Google Scholar]
  29. Wang, Z.; Zheng, L.; Liu, Y.; Li, Y.; Wang, S. Towards real-time multi-object tracking. In Proceedings of the European Conference on Computer Vision, Glasgow, UK, 23–28 August 2020; pp. 107–122. [Google Scholar]
  30. Bochinski, E.; Eiselein, V.; Sikora, T. High-speed tracking-by-detection without using image information. In Proceedings of the 2017 14th IEEE International Conference on Advanced Video and Signal Based Surveillance (AVSS), Lecce, Italy, 29 August–1 September 2017; pp. 1–6. [Google Scholar]
  31. Zhang, Y.; Wang, C.; Wang, X.; Zeng, W.; Liu, W. Fairmot: On the fairness of detection and re-identification in multiple object tracking. Int. J. Comput. Vis. 2021, 129, 3069–3087. [Google Scholar] [CrossRef]
  32. Aharon, N.; Orfaig, R.; Bobrovsky, B.Z. BoT-SORT: Robust associations multi-pedestrian tracking. arXiv 2022, arXiv:2206.14651. [Google Scholar]
  33. Miksch, M.; Yang, B.; Zimmermann, K. Motion compensation for obstacle detection based on homography and odometric data with virtual camera perspectives. In Proceedings of the Intelligent Vehicles Symposium, La Jolla, CA, USA, 21–24 June 2010. [Google Scholar]
  34. Roy, S.; Paul, S.; Young, N.E.; Roy-Chowdhury, A.K. Exploiting Transitivity for Learning Person Re-identification Models on a Budget. In Proceedings of the 2018 IEEE/CVF Conference on Computer Vision and Pattern Recognition (CVPR), Salt Lake City, UT, USA, 18–22 June 2018. [Google Scholar]
  35. Zhou, J.; Bing, S.; Ying, W. Easy Identification from Better Constraints: Multi-shot Person Re-identification from Reference Constraints. In Proceedings of the 2018 IEEE/CVF Conference on Computer Vision and Pattern Recognition (CVPR), Salt Lake City, UT, USA, 18–22 June 2018. [Google Scholar]
  36. Munjal, B.; Amin, S.; Tombari, F.; Galasso, F. Query-Guided End-To-End Person Search. In Proceedings of the 2019 IEEE/CVF Conference on Computer Vision and Pattern Recognition (CVPR), Long Beach, CA, USA, 15–20 June 2019. [Google Scholar]
  37. Sun, X.; Zheng, L. Dissecting Person Re-identification from the Viewpoint of Viewpoint. In Proceedings of the IEEE/CVF Conference on Computer Vision and Pattern Recognition, Salt Lake City, UT, USA, 18–22 June 2018. [Google Scholar]
  38. Tang, Z.; Naphade, M.; Liu, M.Y.; Yang, X.; Birchfield, S.; Wang, S.; Kumar, R.; Anastasiu, D.; Hwang, J.N. CityFlow: A City-Scale Benchmark for Multi-Target Multi-Camera Vehicle Tracking and Re-Identification. In Proceedings of the IEEE/CVF Conference on Computer Vision and Pattern Recognition, Long Beach, CA, USA, 15–20 June 2019. [Google Scholar]
  39. Wang, Y.; Chen, Z.; Feng, W.; Gang, W. Person Re-identification with Cascaded Pairwise Convolutions. In Proceedings of the IEEE Conference on Computer Vision & Pattern Reconigtion, Salt Lake City, UT, USA, 18–22 June 2018. [Google Scholar]
  40. Ferryman, J.; Shahrokni, A. Pets2009: Dataset and challenge. In Proceedings of the 2009 Twelfth IEEE International Workshop on Performance Evaluation of Tracking and Surveillance, Snowbird, UT, USA, 7–12 December 2009; pp. 1–6. [Google Scholar]
  41. Leal-Taixé, L.; Milan, A.; Reid, I.; Roth, S.; Schindler, K. Motchallenge 2015: Towards a benchmark for multi-target tracking. arXiv 2015, arXiv:1504.01942. [Google Scholar]
  42. Milan, A.; Leal-Taixé, L.; Reid, I.; Roth, S.; Schindler, K. MOT16: A benchmark for multi-object tracking. arXiv 2016, arXiv:1603.00831. [Google Scholar]
  43. Dendorfer, P.; Rezatofighi, H.; Milan, A.; Shi, J.; Cremers, D.; Reid, I.; Roth, S.; Schindler, K.; Leal-Taixé, L. Mot20: A benchmark for multi object tracking in crowded scenes. arXiv 2020, arXiv:2003.09003. [Google Scholar]
  44. Chavdarova, T.; Baqué, P.; Bouquet, S.; Maksai, A.; Jose, C.; Bagautdinov, T.; Lettry, L.; Fua, P.; Van Gool, L.; Fleuret, F. Wildtrack: A multi-camera hd dataset for dense unscripted pedestrian detection. In Proceedings of the IEEE Conference on Computer Vision and Pattern Recognition, Salt Lake City, UT, USA, 18–22 June 2018; pp. 5030–5039. [Google Scholar]
  45. Yang, L.; Fan, Y.; Xu, N. Video instance segmentation. In Proceedings of the IEEE/CVF International Conference on Computer Vision, Seoul, Republic of Korea, 27 October–2 November 2019; pp. 5188–5197. [Google Scholar]
  46. Geiger, A.; Lenz, P.; Stiller, C.; Urtasun, R. Vision meets robotics: The kitti dataset. Int. J. Robot. Res. 2013, 32, 1231–1237. [Google Scholar] [CrossRef]
  47. Yu, F.; Chen, H.; Wang, X.; Xian, W.; Chen, Y.; Liu, F.; Madhavan, V.; Darrell, T. Bdd100k: A diverse driving dataset for heterogeneous multitask learning. In Proceedings of the IEEE/CVF Conference on Computer Vision and Pattern Recognition, Seattle, WA, USA, 13–19 June 2020; pp. 2636–2645. [Google Scholar]
  48. Sun, P.; Kretzschmar, H.; Dotiwalla, X.; Chouard, A.; Patnaik, V.; Tsui, P.; Guo, J.; Zhou, Y.; Chai, Y.; Caine, B.; et al. Scalability in perception for autonomous driving: Waymo open dataset. In Proceedings of the IEEE/CVF Conference on Computer Vision and Pattern Recognition, Seattle, WA, USA, 13–19 June 2020; pp. 2446–2454. [Google Scholar]
  49. Liao, Y.; Xie, J.; Geiger, A. KITTI-360: A novel dataset and benchmarks for urban scene understanding in 2d and 3d. IEEE Trans. Pattern Anal. Mach. Intell. 2022, 45, 3292–3310. [Google Scholar] [CrossRef]
  50. Russakovsky, O.; Deng, J.; Su, H.; Krause, J.; Satheesh, S.; Ma, S.; Huang, Z.; Karpathy, A.; Khosla, A.; Bernstein, M.; et al. Imagenet large scale visual recognition challenge. Int. J. Comput. Vis. 2015, 115, 211–252. [Google Scholar] [CrossRef]
  51. Dave, A.; Khurana, T.; Tokmakov, P.; Schmid, C.; Ramanan, D. Tao: A large-scale benchmark for tracking any object. In Proceedings of the European Conference on Computer Vision, Glasgow, UK, 23–28 August 2020; pp. 436–454. [Google Scholar]
  52. Zhu, J.Y.; Park, T.; Isola, P.; Efros, A.A. Unpaired Image-to-Image Translation using Cycle-Consistent Adversarial Networks. In Proceedings of the IEEE International Conference on Computer Vision (ICCV), Venice, Italy, 22–29 October 2017; pp. 2223–2232. [Google Scholar]
  53. Baek, S.S.; Jung, E.Y.; Pyo, J.C.; Pachepsky, Y.; Son, H.; Cho, K.H. Hierarchical deep learning model to simulate phytoplankton at phylum/class and genus levels and zooplankton at the genus level. Water Res. J. Int. Water Assoc. 2022, 218, 118494. [Google Scholar] [CrossRef]
  54. Gelzinis, A.; Verikas, A.; Vaiciukynas, E.; Bacauskiene, M. A novel technique to extract accurate cell contours applied for segmentation of phytoplankton images. Mach. Vis. Appl. 2015, 26, 305–315. [Google Scholar] [CrossRef]
  55. Rivas-Villar, D.; Rouco, J.; Carballeira, R.; Penedo, M.G.; Novo, J. Fully automatic detection and classification of phytoplankton specimens in digital microscopy images. Comput. Methods Programs Biomed. 2021, 200, 105923. [Google Scholar] [CrossRef]
  56. Verikas, A.; Gelzinis, A.; Bacauskiene, M.; Olenina, I.; Olenin, S.; Vaiciukynas, E. Phase congruency-based detection of circular objects applied to analysis of phytoplankton images. Pattern Recognit. J. Pattern Recognit. Soc. 2012, 45, 1659–1670. [Google Scholar] [CrossRef]
  57. Otsu, N. A threshold selection method from gray-level histograms. IEEE Trans. Syst. Man Cybern. 1979, 9, 62–66. [Google Scholar] [CrossRef]
  58. Unser, M.; Aldroubi, A. B-spline signal processing. I. Theory. IEEE Trans. Signal Process. 1993, 41, 821–833. [Google Scholar] [CrossRef]
  59. Xu, Y.; Ban, Y.; Alameda-Pineda, X.; Horaud, R. Deepmot: A differentiable framework for training multiple object trackers. arXiv 2019, arXiv:1906.06618. [Google Scholar]
  60. Du, Y.; Zhao, Z.; Song, Y.; Zhao, Y.; Su, F.; Gong, T.; Meng, H. Strongsort: Make deepsort great again. IEEE Trans. Multimed. 2023, 1–14. [Google Scholar] [CrossRef]
Figure 1. Most of the existing datasets, which are limited to individual-level studies, are used for the classification task, and PMID2019 does localization annotation of the cells in the image on top of the classification task.
Jmse 11 01141 g001
Figure 2. PMOT2023 annotates each track in the video frame sequence.Different numbers in the picture represent different ID numbers in a video.
Jmse 11 01141 g002
Figure 3. The overall process of PMOT2023 dataset production is illustrated, including sample collection, sample set production, and synthesis of video data.
Jmse 11 01141 g003
Figure 4. (a) four images from the produced PMOT2023 dataset, (b) sample images of different categories in the sample set.
Jmse 11 01141 g004
Figure 5. Randomly generated track examples. Contains 6 random trajectory examples. The orange points represent randomly selected key points and the blue points represent the position of the object in each image frame.
Jmse 11 01141 g005
Figure 6. Visualization of the labeled box of PMOT2023.
Jmse 11 01141 g006
Figure 7. The bar chart represents the number of samples per category in the training and validation sets after the PMOT2023 dataset was produced, and the line chart represents the number of samples per category in the sample set. Compared with the sample set, PMOT2023 has a more balanced data distribution of categories.
Jmse 11 01141 g007
Figure 8. (a) a frame from the DENSE_FAST video in PMOT2023, and (b) an image from the PMID2019 dataset.
Jmse 11 01141 g008
Figure 9. The multi-object tracking results for the PMOT2023 validation set are assigned IDs for each sample and represented as trajectories. We show the different samples as different colors and draw a part of the history trajectory for each sample in the picture.The (ad) in the figure are from the four subsets of PMOT2023: DENSE-FAST,DENSE-SLOW,SPARSE,CHALLENGE.
Jmse 11 01141 g009
Table 1. Dataset size of PMOT2023.
Set DENSE_FASTDENSE_SLOWSPARSECHALLENGE
DurationFramesTracksDurationFramesTracksDurationFramesTracksDurationFramesTracks
train_set360 s9000680360 s9000420360 s9000300360 s9000800
val_set72 s180014072 s18009072 s18006072 s1800160
test_set48 s120013048 s120012048 s120010048 s1200200
PMOT2023’s four video, DENSE-FAST, DENSE-SLOW, SPARSE, CHALLENGE, data volume statistics, where CHALLENGE has the most tracks.
Table 2. PMOT2023 compares the multi-object tracking datasets, MOT17 and MOT20.
DatasetMOT17 [42]MOT20 [43]PMOT2023 (Proposed)
Videos14812
Avg. tracks96432267
Total tracks134234563200
Avg. len. (s)35.466.8154
Total len. (s)4635351920
FPS302525
Total images11,23513,41048,000
resolution2k or <2k2k or <2k4K
number of classes121326
Table 3. Data volume comparison between PMOT2023 and PMID2019.
DatasetPMID2019 [21]PMOT2023 (Proposed)
lotal images11,08948,000
number of bbox13,865170,041
number of classes2421
Table 4. Results of PMOT2023. We bolded the best results to show.
MethodsMOTA↑IDF1↑IDSW↓Recall↑IDRecall↑Prcn↑
BYTEtrack [18]52.9867.8839.058.7055.9091.70
SORT [28]35.8045.43502.042.4538.1895.45
DeepSORT [17]43.6058.30112.352.4847.1884.33
BoT-SORT [32]44.6031.80174.537.4029.2091.45
DeepMot [59]36.1522.8227.551.2021.3071.03
StrongSORT [60]39.3353.88141.348.5640.4082.48
Table 5. Counting results of different tracking methods.
Test SetTotalCeratium furcaSkeletonemaHelicotheca
groundtruthDENSE-FAST130795
DENSE-SLOW120583
SPARSE1003410
yolov7 [27]DENSE-FAST141587
+Bytetrack [18]DENSE-SLOW116384
SPARSE933210
yolov7 [27]DENSE-FAST1534810
+DeepSORT [17]DENSE-SLOW142395
SPARSE1183210
Table 6. Results of density estimation for different tracking methods, in cells/ μ L.
Test SetTotalCeratium furcaSkeletonemaHelicotheca
groundtruthDENSE-FAST32.501.752.251.25
DENSE-SLOW50.002.083.331.25
SPARSE41.671.251.674.17
yolov7 [27]DENSEFAST35.251.252.001.75
+Bytetrack [18]DENSESLOW48.331.253.331.67
SPARSE38.751.250.834.17
yolov7 [27]DENSEFAST38.251.002.002.50
+DeepSORT [17]DENSESLOW59.171.253.752.08
SPARSE49.172.080.834.17
Disclaimer/Publisher’s Note: The statements, opinions and data contained in all publications are solely those of the individual author(s) and contributor(s) and not of MDPI and/or the editor(s). MDPI and/or the editor(s) disclaim responsibility for any injury to people or property resulting from any ideas, methods, instructions or products referred to in the content.

