Article

A Hardware-in-the-Loop Simulator to Optimize Autonomous Sailboat Performance in Real Ocean Conditions

by
Tanaka Akiyama
1,†,
Kostia Roncin
2,*,† and
Jean-Francois Bousquet
1,*,†
1
Electrical & Computer Engineering, Dalhousie University, Halifax, NS B3H 4R2, Canada
2
Centre de Recherche de l’École de l’Air, École de l’Air et de l’Espace, 13661 Salon-de-Provence, France
*
Authors to whom correspondence should be addressed.
These authors contributed equally to this work.
J. Mar. Sci. Eng. 2023, 11(6), 1104; https://doi.org/10.3390/jmse11061104
Submission received: 7 May 2023 / Revised: 18 May 2023 / Accepted: 20 May 2023 / Published: 23 May 2023
(This article belongs to the Special Issue Machine Learning and Modeling for Ship Design)

Abstract

:
In this work, a hardware-in-the-loop (HIL) simulator is designed to diagnose the behavior of an autonomous sailboat as it navigates between waypoints. At its core, the HIL simulator includes the sailboat pilot on an embedded system. The sensor data input to the embedded system is fed by a navigation simulator that takes into account the different forces on the sailboat due to the wind, waves and current conditions. The HIL simulator is then tested for a navigation route from sea trials published in 2014, and the behavior of the automated pilot is compared to its behavior when the vessel is driven by a crew. As demonstrated, the automated system can outperform the man-operated vessel. The tool is also used to diagnose weaknesses in the sailboat autopilot algorithm that can be improved in the future.

1. Introduction

The SeaLeon was a 2.4 m autonomous sailboat that crossed the Atlantic Ocean during the 2018 MicroTransat Challenge [1]. During the mission, a strange trajectory was observed off the Grand Banks. The sailboat deviated during several days from its planned path without any apparent reason before rectifying the trajectory. This led the team to believe that it suffered some electrical or mechanical failure. However, that was a false assumption; a model of the waves, currents and winds in the specific area associated with an accurate model of the boat behavior would have been able to predict this behavior.
As highlighted in [2], autonomous sailboats offer an interesting alternative as a surface vessel for different applications because they provide a safe, green, low-cost, and low-risk method for monitoring the ocean. Their deployment can enable sensor networks to collect marine data non-invasively for exploration and surveillance applications.
In the past, thorough testing at sea was required in the development of autonomous sailboat systems. In [1], a test procedure needed to validate each increment in the development of an autonomous sailboat was detailed to prepare the sailboat for a long-term mission in the ocean. In fact, through controlled tests in water basins, lakes, coves, or along the littoral, it is possible to assess the sailboats in specific environments. However, due to cost and time considerations, it is difficult to deploy the vessels over an extended period and in reaction to different events.
In this work, the motivation is to describe a realistic model of the sailboat’s behavior in the ocean. This model can also serve to develop and optimize a given pilot, as well as reducing the number of tests required in the development of the system.
To simulate a navigation algorithm, a model of the environmental conditions at sea is required. Since there are a variety of sailing conditions, huge datasets are required. As described in [3], artificial intelligence can feed navigation algorithms. For example, to control the Mayflower, an autonomous ship sponsored by IBM historical data was used and, through a high-performance computational method, a complete set of navigation scenarios for autonomous navigation was provided to guide the ship. Other examples of sailboat pilots that rely on machine learning are documented, e.g., [4].
Other works that simulate autonomous sailboats include the use of ROS-Gazebo to integrate the sensors [5]. In comparison, in this work, an environmental model is run in real time using Simulink, and the sailboat is included as a module that reacts to the different events. The sailboat module can be implemented in software and, as will be described, using hardware-in-the-loop (HIL).
In [6], Sauze and Neal presented for the first time an HIL simulation tool to develop autonomous sailboat control systems. The software simulator was built using Tracksail, an open-source sailing game. This is based on a highly simplistic physics model and makes no attempt to simulate the actions of waves, currents or tides.
Since then, a few other HIL simulators have been described to support the development of autonomous sailboat controllers. For example, in [7], an HIL simulation is used to validate the embedded system of the sailboat robot, Vaimos. In the simulation, the sea state is not emulated and wind is considered constant with white noise.
HIL simulators are applied to other robotic systems. In [8], an HIL simulation is used to reduce the duration required to tune navigation controllers for an unmanned aerial vehicle (UAV). In [9], an HIL simulator is used as a concept for faster prototyping of navigation- and communication-based control systems. In [10], an imitation modeling stand is used for creating and testing automated and automatic control systems, which integrates a control system model into a local computer network of a navigation simulator. It allows for the development and testing of functional modules for both manual control and automated control systems.
In this work, the goal is to model the behavior of an autonomous sailboat to reduce the testing time and to diagnose behavior in the presence of different sea conditions. First, functional simulation software that takes into consideration the sailboat’s peripherals is described. Second, an HIL simulation setup is developed to create a test environment that includes all factors that can affect the sailboat, including current-, wind- and wave-induced motion. Third, the HIL simulator reliability is validated using real data collected during a sea trial. For these conditions, the sailboat controller parameters are optimized.
The rest of this paper is organized as follows: In Section 2, a mechanical model of the vessel that is influenced by the environmental conditions is described. In Section 3, the real-time embedded system to enable the HIL is described. In Section 4, experiments are run to confirm the reliability of the HIL and to further optimize the vessel’s pilot. Finally, in Section 5, a conclusion is presented.

2. System Model

The HIL simulator includes a procedure to model the hydrodynamic and aerodynamic effects of the environment on the sailboat’s trajectory, which are described in Section 2.1. The low-complexity control algorithm developed in the SeaLeon in reaction to the different sensors is then described in Section 2.2. Finally, the modeling procedure to represent the environmental conditions is presented in Section 2.3.

2.1. Dynamics of the Sailboat

The sailboat modeling used in this study was presented in [11,12]. The test case was based on the model of an 8-meter long Bénéteau First Class 8. A 6-degree of freedom (6-DOF) dynamic simulator was programmed using MATLAB Simulink. This graphical programming environment allows to represent the sailboat behavior as a function of time using a modular structure that is shown in Figure 1. The steady hydrodynamics modeling on the hull and keel is based on the application of a design-of-experiments (DOE) method described in [13]. This module is fed with towing tank test results to give the six components of hydrodynamic force and moment with respect to five influencing factors: velocity, heel, pitch, drift and displacement. Quasi-steady modeling for an Archimedean sailboat is proven to provide an accurate representation of the performance [14,15,16,17,18].
Assessing the ability to control a sailboat in waves requires the identification of unsteady hydrodynamic coefficients for damping as well as the added mass of the hull in order to model the sailboat behavior in waves in a meaningful way [19,20,21]. Here, the coefficients were computed using the seakeeping open-source program Nemoh [22]. The Froude–Krylov excitation force of the waves is calculated by integrating the pressure on the hull. Additionally, for the motion computation, in this work, the memory effect due to waves is neglected to save computational time. This simplified method to model sailboat behavior in waves was previously validated with towing tank experiments and can be found in [20,21].
The steady-sail aerodynamic model is borrowed from the ORC documentation and its related studies [15,16,17,18]. The aerodynamic damping of sails was evaluated based on the Masuyama method [14]. The rudder hydrodynamics were computed using the modeling derived from wing theory described in [23]. It should be noted that the damping relative to the lifting surfaces (the keel, the rudder and the sails) is dominant in the sailboat dynamics computation.

2.2. Pilot

The piloting of the simulator in this study is performed using the navigation algorithm of the SeaLeon, an autonomous sailboat that participated in the MicroTransat challenge in 2018. The algorithm incorporates data from pre-programmed waypoints and various sensors to update the boat’s rudder angle. Each waypoint is assigned a threshold radius, and the algorithm marks it as complete after five consecutive global positioning system (GPS) readings fall within the radius.
As was detailed in [1], the course of the vessel is initially selected to be the bearing between the boat’s current position and the target waypoint. If the wind direction is directly against the course, the boat must tack back and forth to make forward progress, whereas if the wind is directly behind the boat’s course, it must jibe to maintain a broad reach point of the sail.
The navigation algorithm accounts for tacking and jibing by first computing the course towards the waypoint and then applying offsets based on the wind direction. If the course falls within the dead zone, which is defined to be ± 45  from the wind direction, the algorithm updates the course to allow close-hauled sailing on the edge of the dead zone closest to the direct course. Similarly, if the direct course requires running, an offset will be applied to let the boat sail at broad reach ( ± 10  from the wind direction). Once the final course is set, the algorithm outputs a sail position based on the wind direction, and the rudder control algorithm takes responsibility for maintaining that course by mapping the difference between the boat’s heading and the target course to a rudder setting. Although the SeaLeon navigation algorithm outputs both a sail position and a rudder position, only the rudder angle is used in this study. The sail is assumed to be at the optimal angle with respect to the wind.
The pilot algorithm generates at its output the rudder angle, which is utilized to control the motor to govern the orientation of the actual rudder on the SeaLeon. In the system model, the rudder angle is applied in the dynamic model of the sailboat. However, it should be noted that a model of the motor is not included.

2.3. Environmental Conditions

To ensure accurate simulation results, the simulator must effectively replicate the sailboat’s movement and behavior under various environmental conditions. In this section, we describe the process of replicating the environmental conditions, including true wind, waves, and sea currents. Additionally, we present the method of emulating the GPS, wind vane, and compass sensors in the model.
To facilitate the simulation, an array containing the sailboat’s position is recorded by a high-accuracy GPS during the sea trials at periodic time intervals. During the simulation, the boat’s position is interpolated as a function of time to match the time interval of the model, equal to 0.1 seconds. A record of the sailboat’s position as a function of time is used to obtain the values for true wind and the sea current at the boat’s location in time.
The pilot receives the sailboat’s position data from a GPS, the sailboat’s current heading from a compass, and the sailboat’s apparent wind from a wind vane. The sailboat’s position, heading, and apparent wind are computed directly in the dynamic model of the sailboat [11]. These values are updated at each time step of the Simulink model, which occurs every 0.1 s. The Simulink model contains subsystems for the GPS, compass, and wind vane. Each subsystem takes the data from the output of the dynamic model and converts them into a format that mimics that of the sensor that it is emulating.
The Simulink model uses a reference frame, where the y-axis points west, the x-axis points towards north, and the z-axis points away from the center of the earth (up). The reference frame of the pilot is north–east–down (NED), where the x-axis points towards north, the y-axis points towards east, and the z-axis points towards the center of the earth (down). Therefore, the values in the Simulink model must be converted to a NED reference frame before being sent to the pilot. The values for the boat’s position are converted using
( x , y , z ) N E D = ( x , y , z ) S I M .
To convert the heading and apparent wind angles to a NED reference frame, their values in the simulation reference frame are negated. Conversely, the rudder angle is converted from the NED reference frame to the simulation frame by negating the value in the NED reference frame.
The emulation of the GPS outputs the boat’s position. This is in the format of an NMEA-0183 recommended minimum sentence (RMS), which contains information about the sailboat’s position in the format of latitude, latitude direction, longitude, longitude direction, speed over ground, track over ground, date, and checksum. The boat’s position is converted to latitude and longitude values (lat, lon) using
lat = x S I M + v x , c u r · t S I M R ,
and
lon = y S I M + v y , c u r · t S I M R cos ( lat ) ,
where R is the distance from the center of the earth to the surface of the water (6,371,000 m), and  x S I M  and  y S I M  are the boat’s position in the Cartesian plane in the simulation frame of reference. Additionally,  v c u r r = v x , c u r + j v y , c u r  is the current velocity, and  t S I M  is the simulation time.
The emulation of the wind vane sensor outputs the apparent wind direction and apparent wind speed to the pilot. These values are formatted as an NMEA-0183 wind speed and angle (MWV) sentence.
The emulation of the compass outputs the boat’s attitude comprising the boat’s roll, pitch, and yaw. The pilot algorithm only uses the value for yaw (heading). These values are converted to binary to extract the most significant byte (MSB) and least significant byte (LSB) to send a sentence containing the heading MSB, heading LSB, pitch MSB, pitch LSB, roll MSB, and roll LSB.
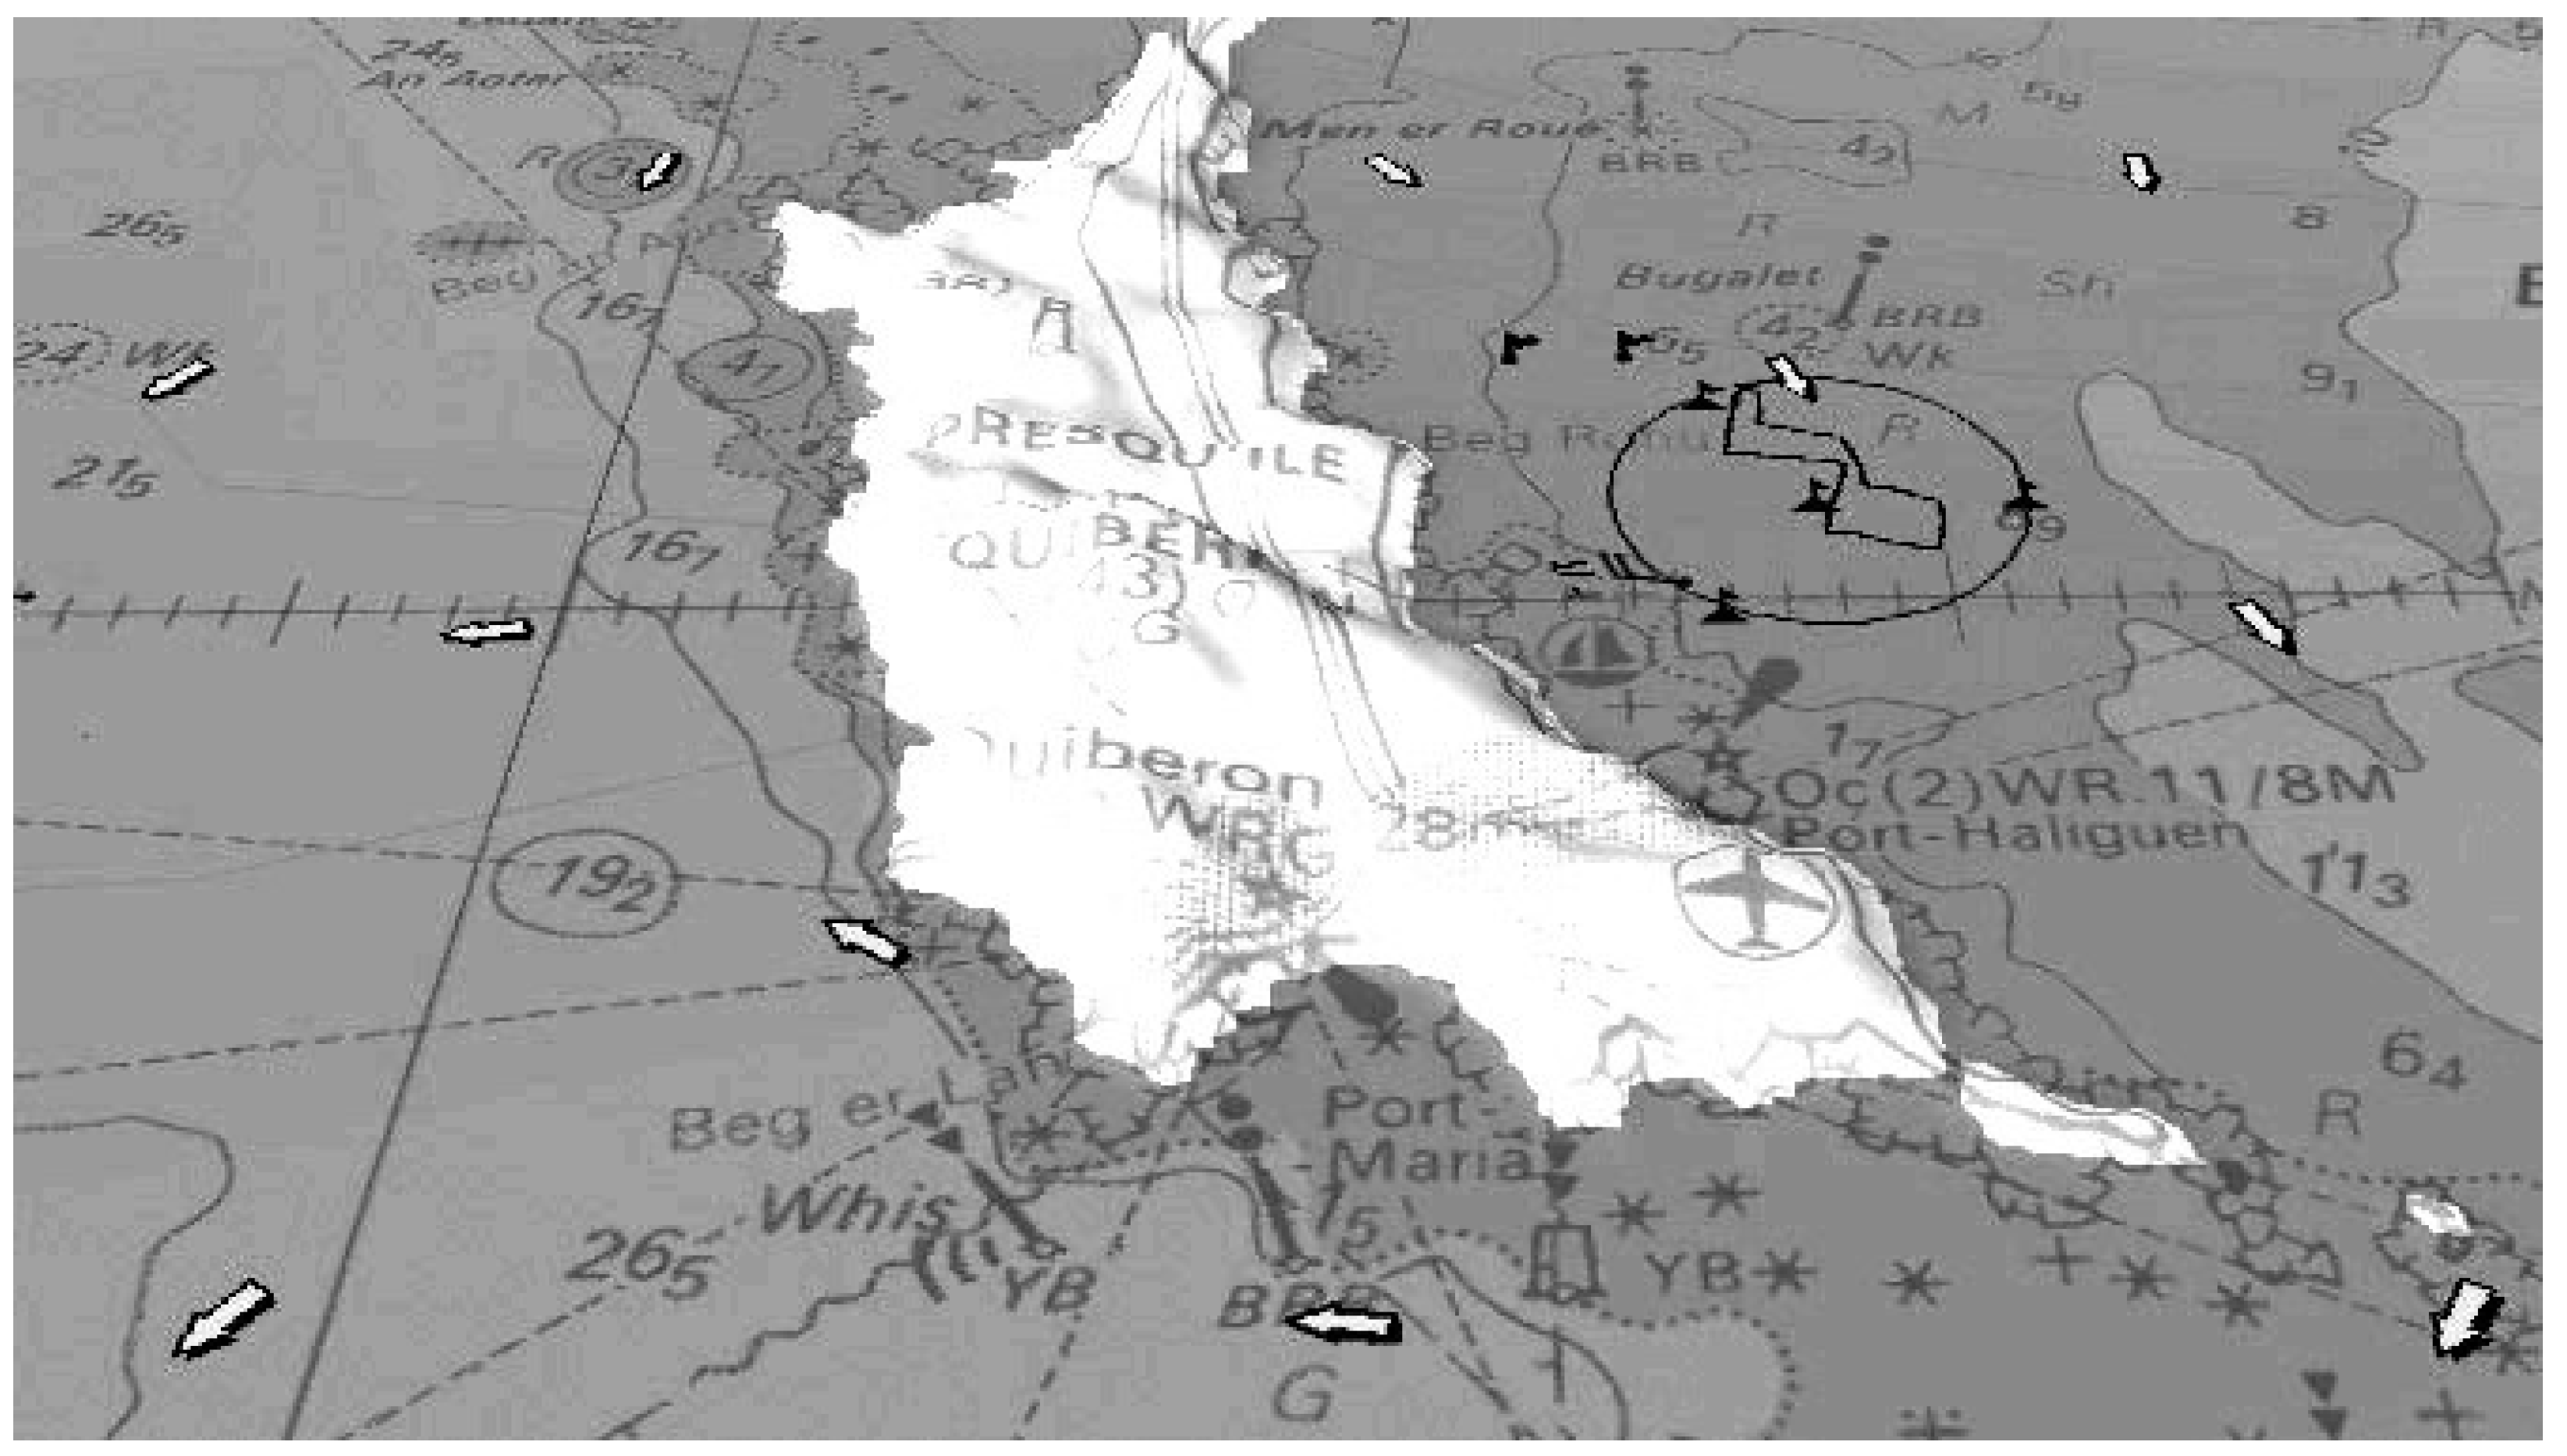
The test area chosen to assess the validity of the HIL and optimize the sailboat parameters is shown in Figure 2. The trajectory of the sailboat (black line) is represented in geographical coordinates over ground. The positions of the wind vanes are represented using the black triangles with flags in the navigation area (black circle). Three of the anemometers are located on the circle, while the fourth is in the center of the black circle delimiting the sailing area. The large white arrows represent the current direction.
For this study, the wind data were collected using the four wind sensors that were placed on fixed KL15 catamarans around the sailing area to create a mesh of the wind field that covered the entire area [24]. An array containing the value of the true wind as an interpolation in time and position of the boat during the sea trials was generated. Similarly, the current was taken from a database containing the value of the real current at a specific time and location [25]. The current at the sailboat’s position was taken as the weighted average of the two database points closest to the sailing area, where the weight depends on the current’s measurements location relative to the center of the circle delimiting the sailing area. Although there were no wave measurements during the sea trials, the wave height was adjusted to 0.3 m peak-to-trough with a period of 3.5 s in a simplistic Airy wave modeling to obtain a trajectory similar to that of the previously published validation of the simulator with these sea trials [24].
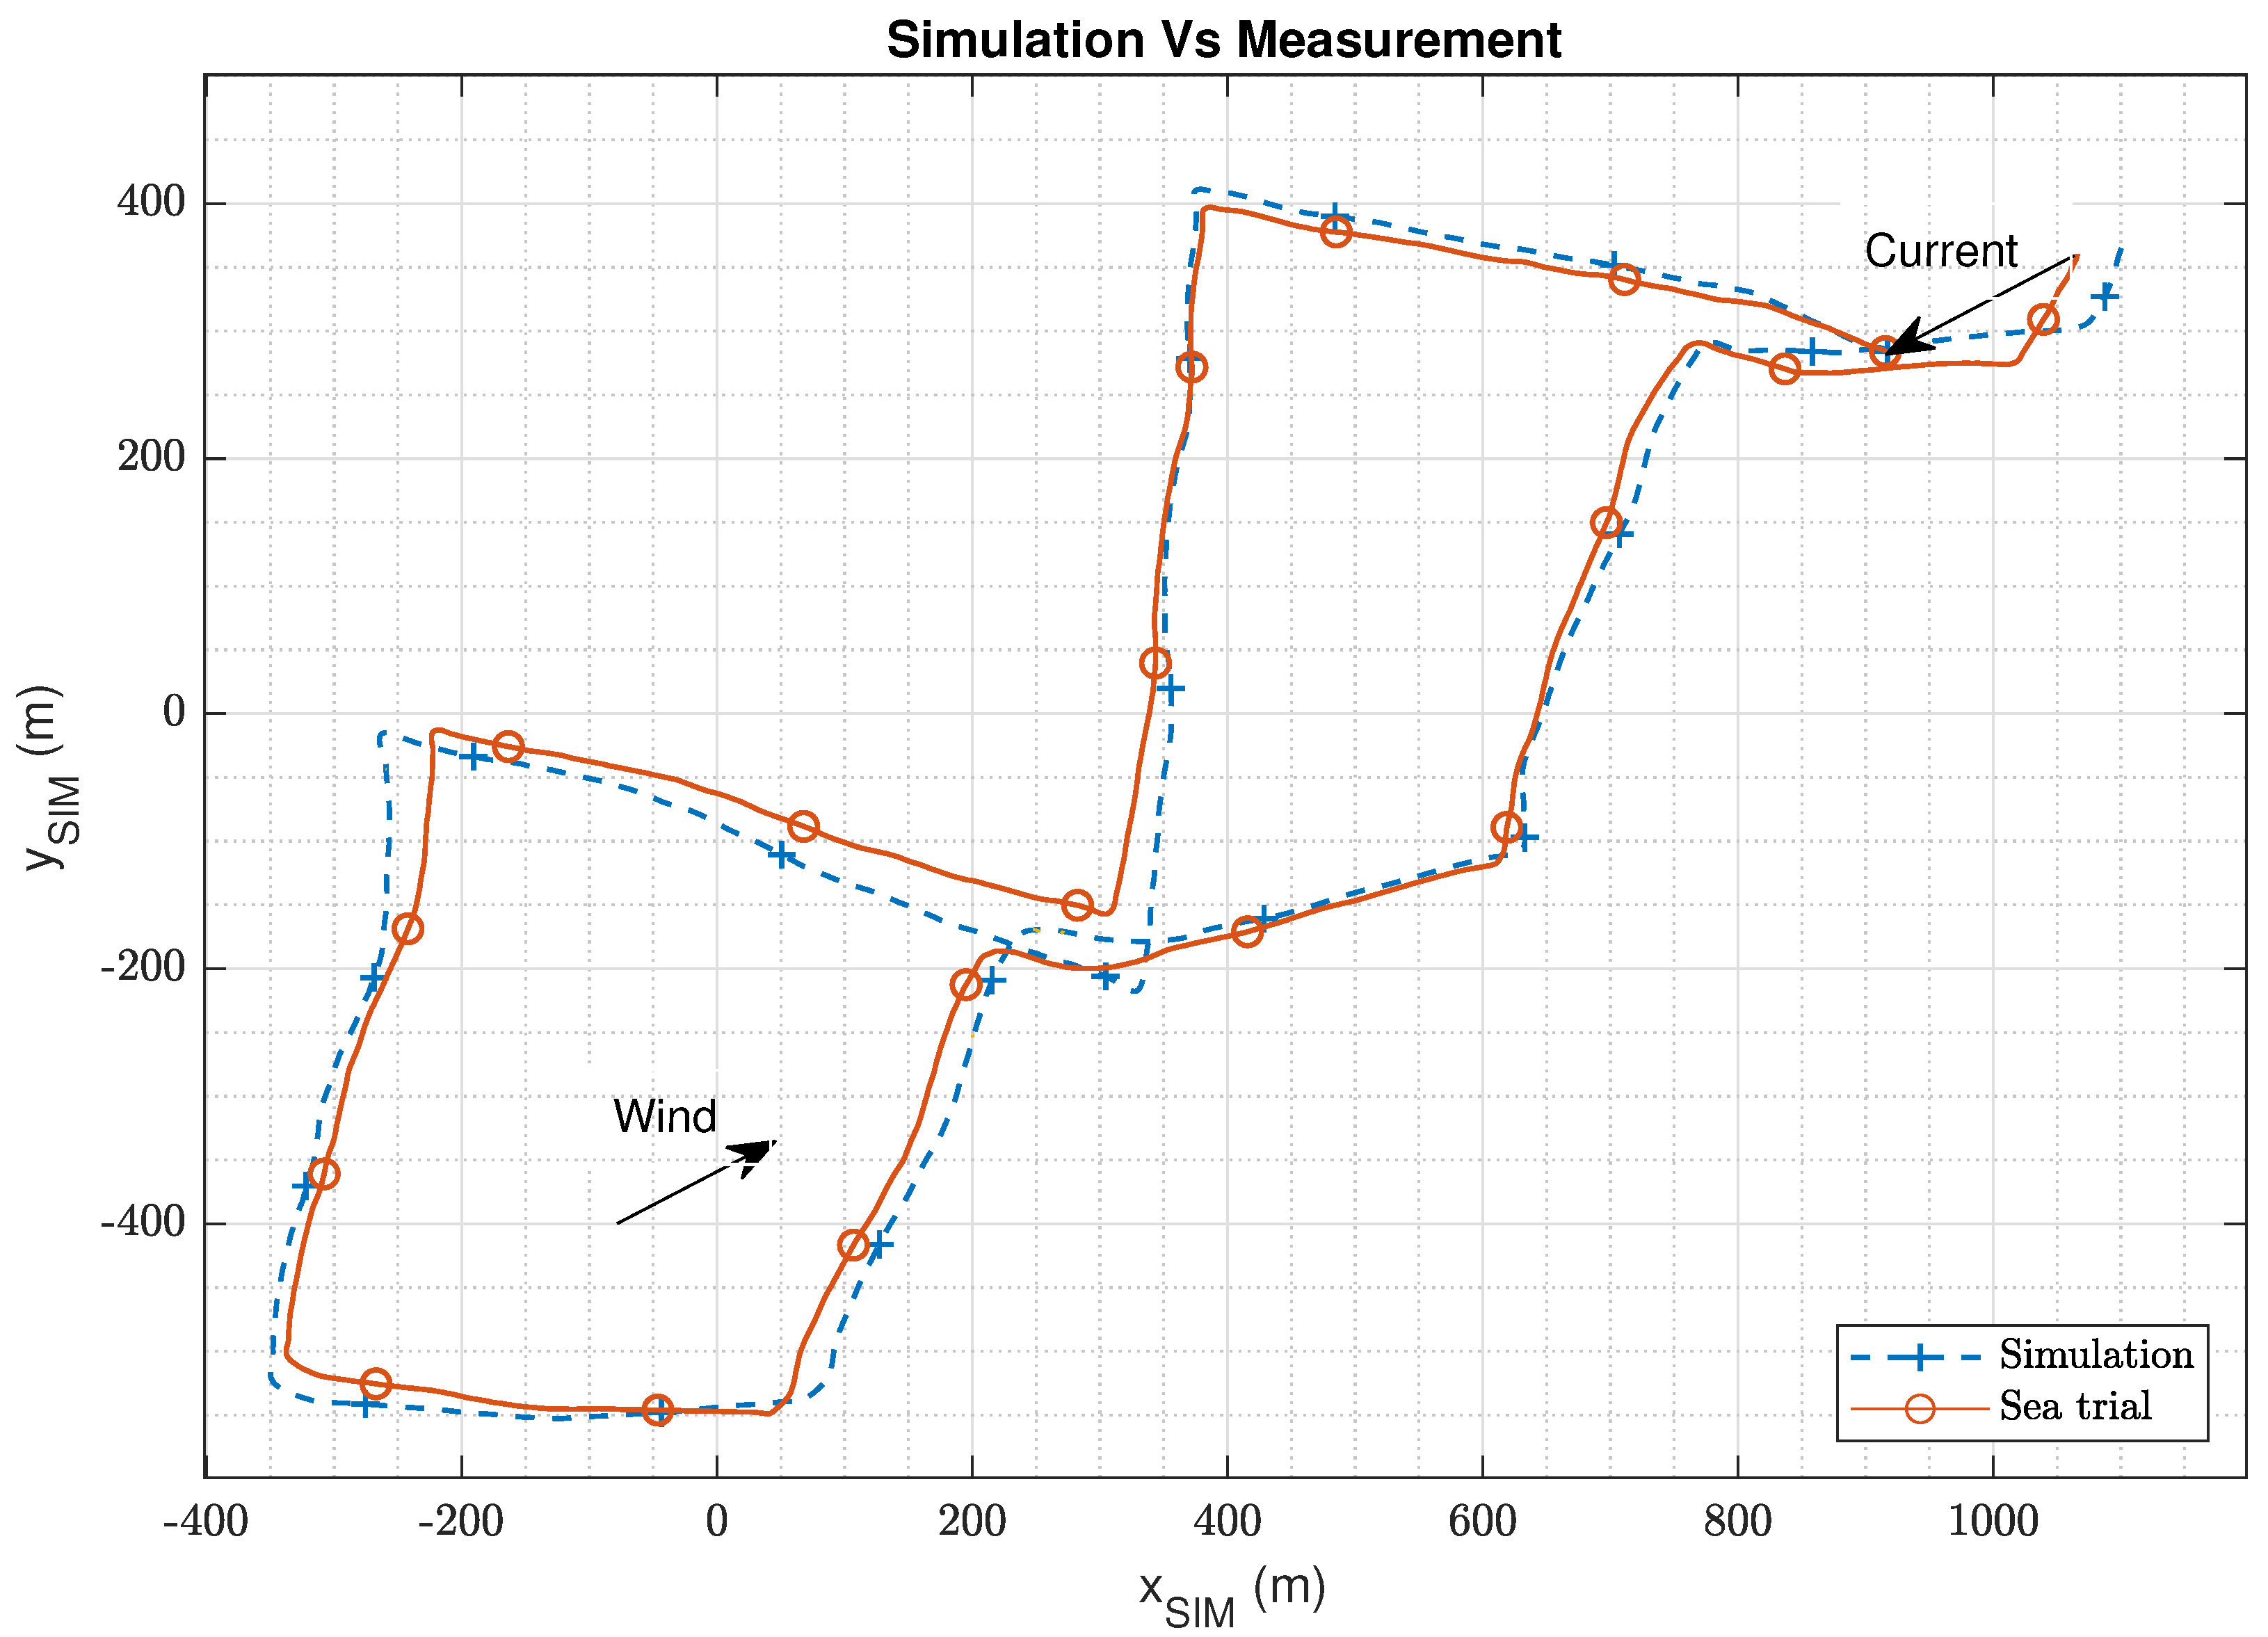
A comparison is shown in Figure 3 between the simulation and sea trials trajectory. The average wind is south–southeast at 150°, indicating that it is from the bottom left corner in Figure 3 with an angle of 30° with  x S I M  axis. Contrary to Figure 2, the last point of the sea test trajectory does not meet the starting point. This is due to the current, consistent with Figure 2. To make a fair comparison, the pilot of the simulator is trimmed to the apparent wind recorded onto the real sailboat. The distance between the final point and the starting point shows how the water surface drifted with the ground during the 1823 seconds of the test. The comparison between the two curves shows good agreement between the trials and simulation. A slight difference appears in the middle of the second tack, which corresponds to a change in the jib roller trim on the real boat. The advance taken by the simulated sailboat on the real one is kept until the upwind mark. This advantage increases further downwind. This may be due to the perfection of the simulated maneuver. As an example, the spinnaker is instantaneously set up once 80° in the apparent wind is crossed.

3. Time-Based HIL Simulator

In this section, an embedded system that implements the behavior sailboat pilot over time is described. First, in Section 3.1, the hardware that runs on the sailboat is presented; second, in Section 3.2, the method of integrating the hardware with the Simulink model is described.

3.1. The Embedded System

The embedded system was originally designed to control the SeaLeon, a small autonomous sailboat designed to participate in the Microtransat Challenge [1]. She set sail on 31 July 2018, off the coast of Cape Breton with the goal of completing an autonomous transatlantic voyage from America to Europe. The boat’s journey lasted 76 days before the last communication with her position was established on 14th October. She was later found near Castletownbere, County Cork, Ireland, on 21st February.
At its core, the embedded system relies on the SAMD20-J microcontroller from Microchip, which features a 32-bit ARM Cortex-MO processor. This microcontroller is chosen because it consumes a low amount of power, and it can provide as many as six serial communication interfaces (SERCOMs), which can be configured as UART, SPI, or I2C interfaces. It also supports commercial operating systems, such as FreeRTOS, and allows 32-bit floating point arithmetic.
The sailboat’s software is organized in a modular fashion, allowing local changes to be made to the serial drivers and communication protocols, as well as the pilot algorithm. The current embedded code is based on that of the SeaLeon, and its software structure is flexible such that it is easy to modify and customize for specific needs. The software has a hierarchical structure consisting of three layers: control, task, and input/output (i/o). The control layer manages the state of the sailboat and runs various tasks in periodic intervals, while the task layer contains high-level modules that manage the sailboat’s peripherals. Finally, the input/output layer handles low-level code for the microcontroller’s hardware interfaces. This layered architecture provides a streamlined interface for making changes and modifications to the sailboat’s software
The control layer of the sailboat manages its state and peripheral devices. It runs critical tasks and facilitates data exchange with the peripherals. A clock is used to manage periodic tasks by assigning a timestamp to each task. Tasks are initiated when the clock exceeds the timestamp, and the timestamp is incremented upon task completion. This setup provides flexibility in controlling the timing between tasks. Tasks interact with peripheral devices, which have safeguards to protect against failures, but faults are still possible. In case of an unresponsive task, a watchdog timer will force a software reset. This process is handled by the timer tick callback function, called each time the control timer overflows.
The task layer serves as a critical interface for the sailboat’s fundamental functions. By leveraging this layer, the control layer can seamlessly communicate with the sailboat’s peripherals, without necessitating direct interaction with low-level drivers. The tasks that are accomplished in this layer along with the period that they are executed with are shown in Table 1. These periods were specifically chosen based on the desired voyage of the SeaLeon across the Atlantic Ocean.

3.2. Hardware-in-the-Loop

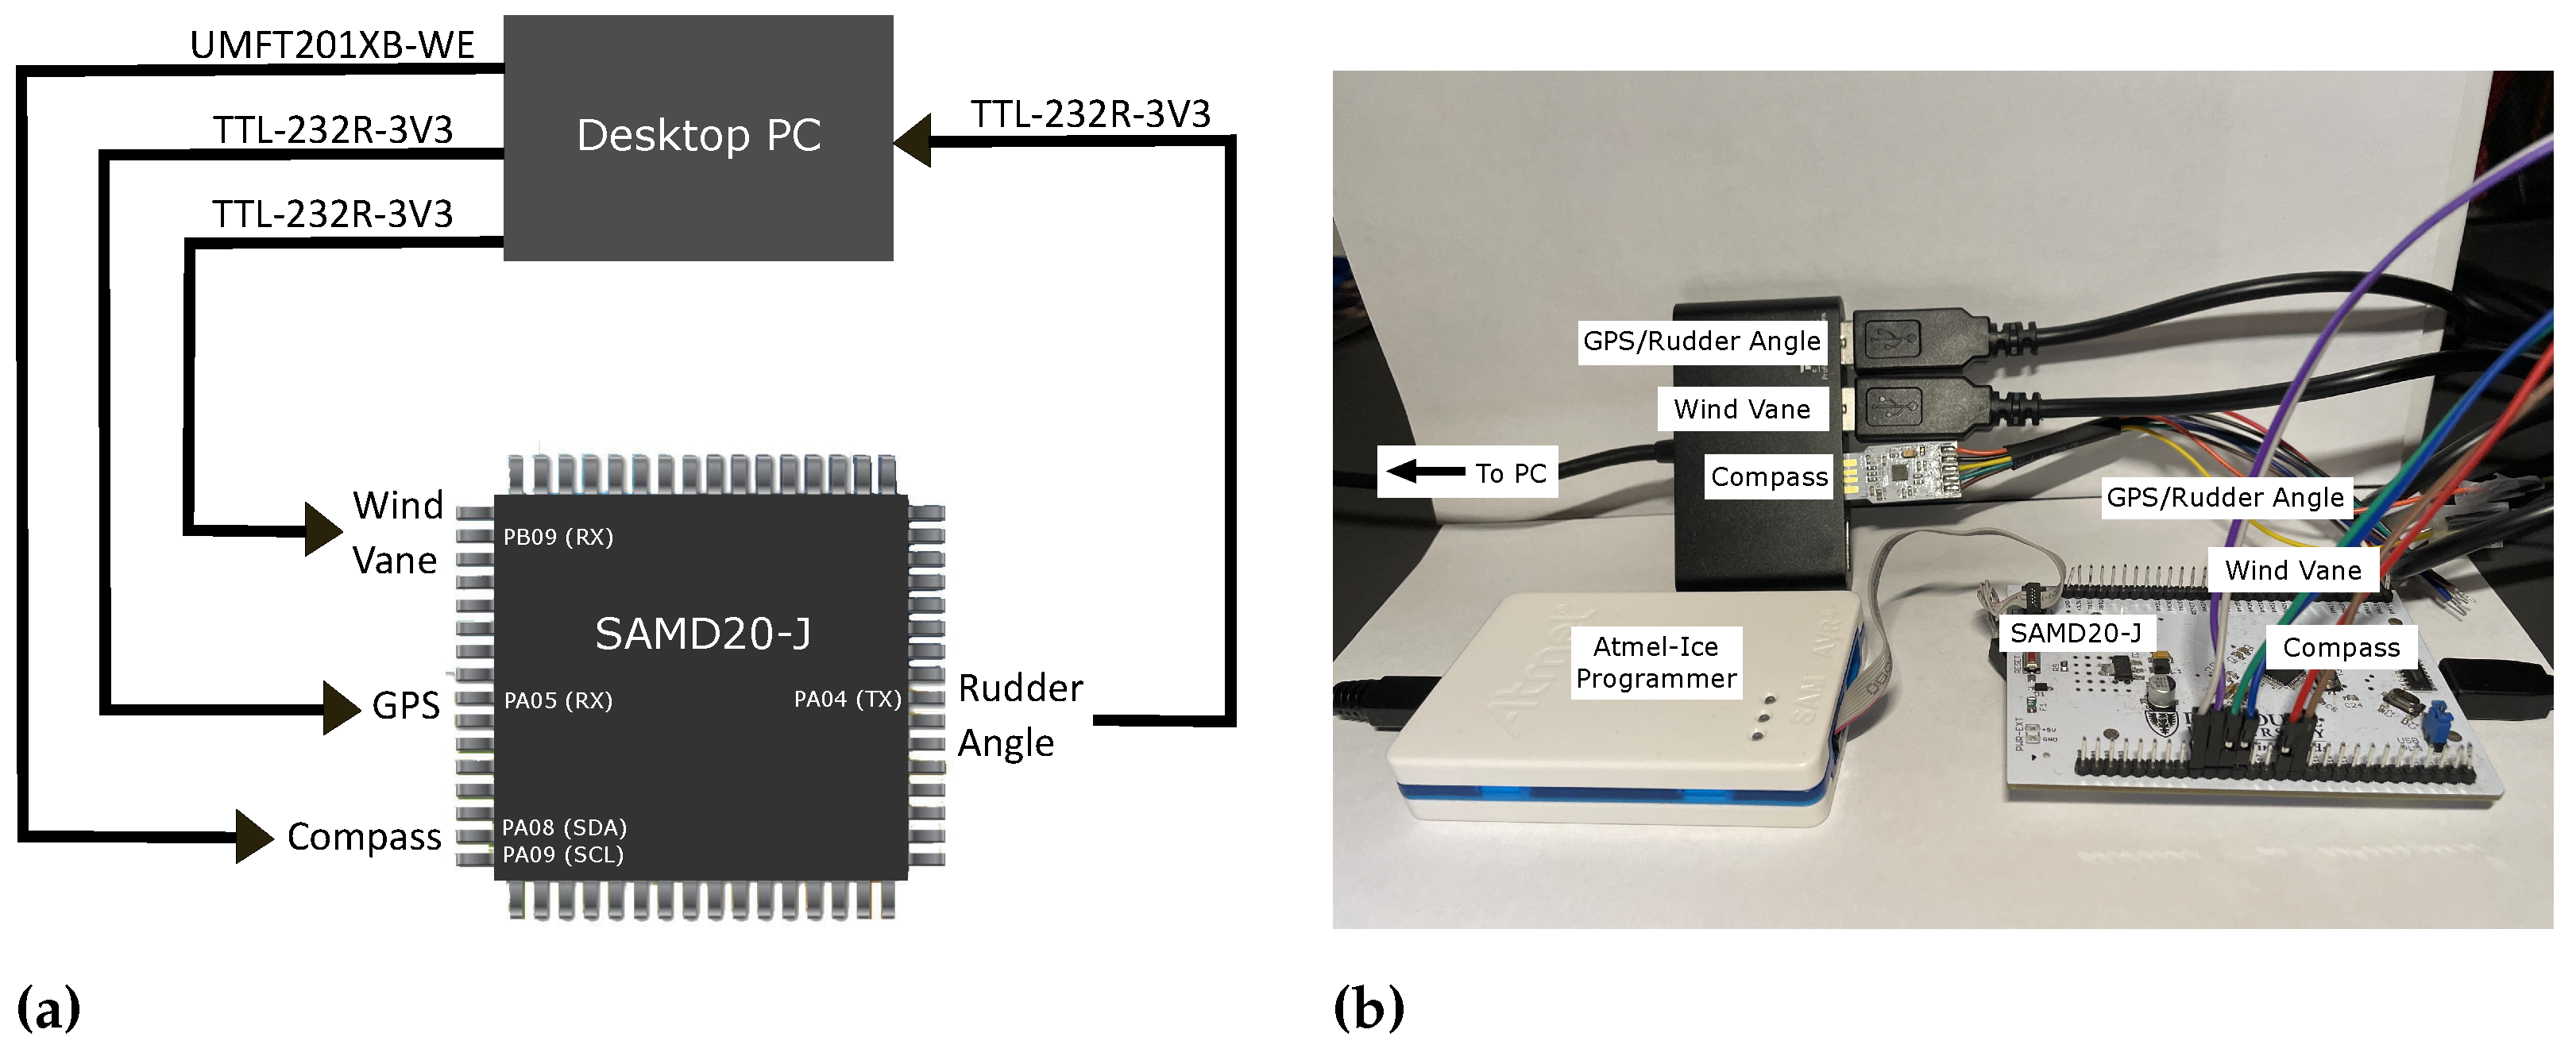
The HIL simulation architecture is shown in Figure 4. It includes the real-time embedded system running on the SAMD20-J microcontroller and a desktop PC running the dynamic model of the sailboat along with the environmental model in Simulink. The microcontroller receives sensor data from a wind vane, GPS, and compass. In the physical sailboat deployment, the SeaLeon used an LCJ Capteurs CV-7 wind sensor, an MTK3339 GPS, and an HMC6343 compass. Both the GPS and the wind sensor communicate with the microcontroller via the universal asynchronous receiver/transmitter (USART) protocol. The compass communicates with the microcontroller through the  I 2 C  protocol, where the microcontroller acts as the master and the compass acts as the slave. To send sensor data from the PC to the microcontroller interface, three USB-to-TTL serial-interface-converting cables are used to send data from each emulated sensor. The TTL-232R-3V3 cable uses a FT232RQ IC chip; two of these cables are used for sending wind vane and GPS sensor data to the USART interfaces on the microcontroller. The UMFT201XB-WE cable uses the FT201X FTDI chip and is used for sending compass data to the  I 2 C  interface on the microcontroller. Note that in the original embedded system mounted on the sailboat, the rudder is activated through a pulse width modulation (PWM) data converter. This connection cannot physically be used to transmit the value of the rudder angle to the computer, and as such, for the HIL, the rudder angle output by the navigation code is routed to the PC using the same serial interface that is used by the GPS sensor. There is no conflict between the signals since the GPS messages are received by the micro-controller, while the rudder angle is transmitted on the serial interface.
The emulators for the GPS and wind vane sensors are programmed to transmit data at a rate that corresponds with the frequency at which the microcontroller checks these sensors. The rudder angle is read at the same rate that the microcontroller is sending it. These rates are adjusted as required by the specific simulation being executed. On the other hand, for the compass, the data output is initiated only upon the receipt of a command from the microcontroller. To ensure synchronization with the microcontroller, the compass emulator is designed to wait for the command before transmitting data, resulting in a data-transmission rate that matches that of the microcontroller.

4. Optimization of Constants

In this section, a procedure is described to optimize the performance of the pilot. For this purpose, a 30-minute sea test described in [25] is used as a reference, in which two waypoints are defined. During the sea tests, the vessel was man operated, and a route was defined by the coach. The sailboat motion and trajectory were recorded, along with the currents and wind measurements. In comparison, the automated pilot is run with the HIL simulator using the environmental conditions and the Class 8 sailboat parameters. The trajectory used for this comparison comprises classical upwind and downwind legs.
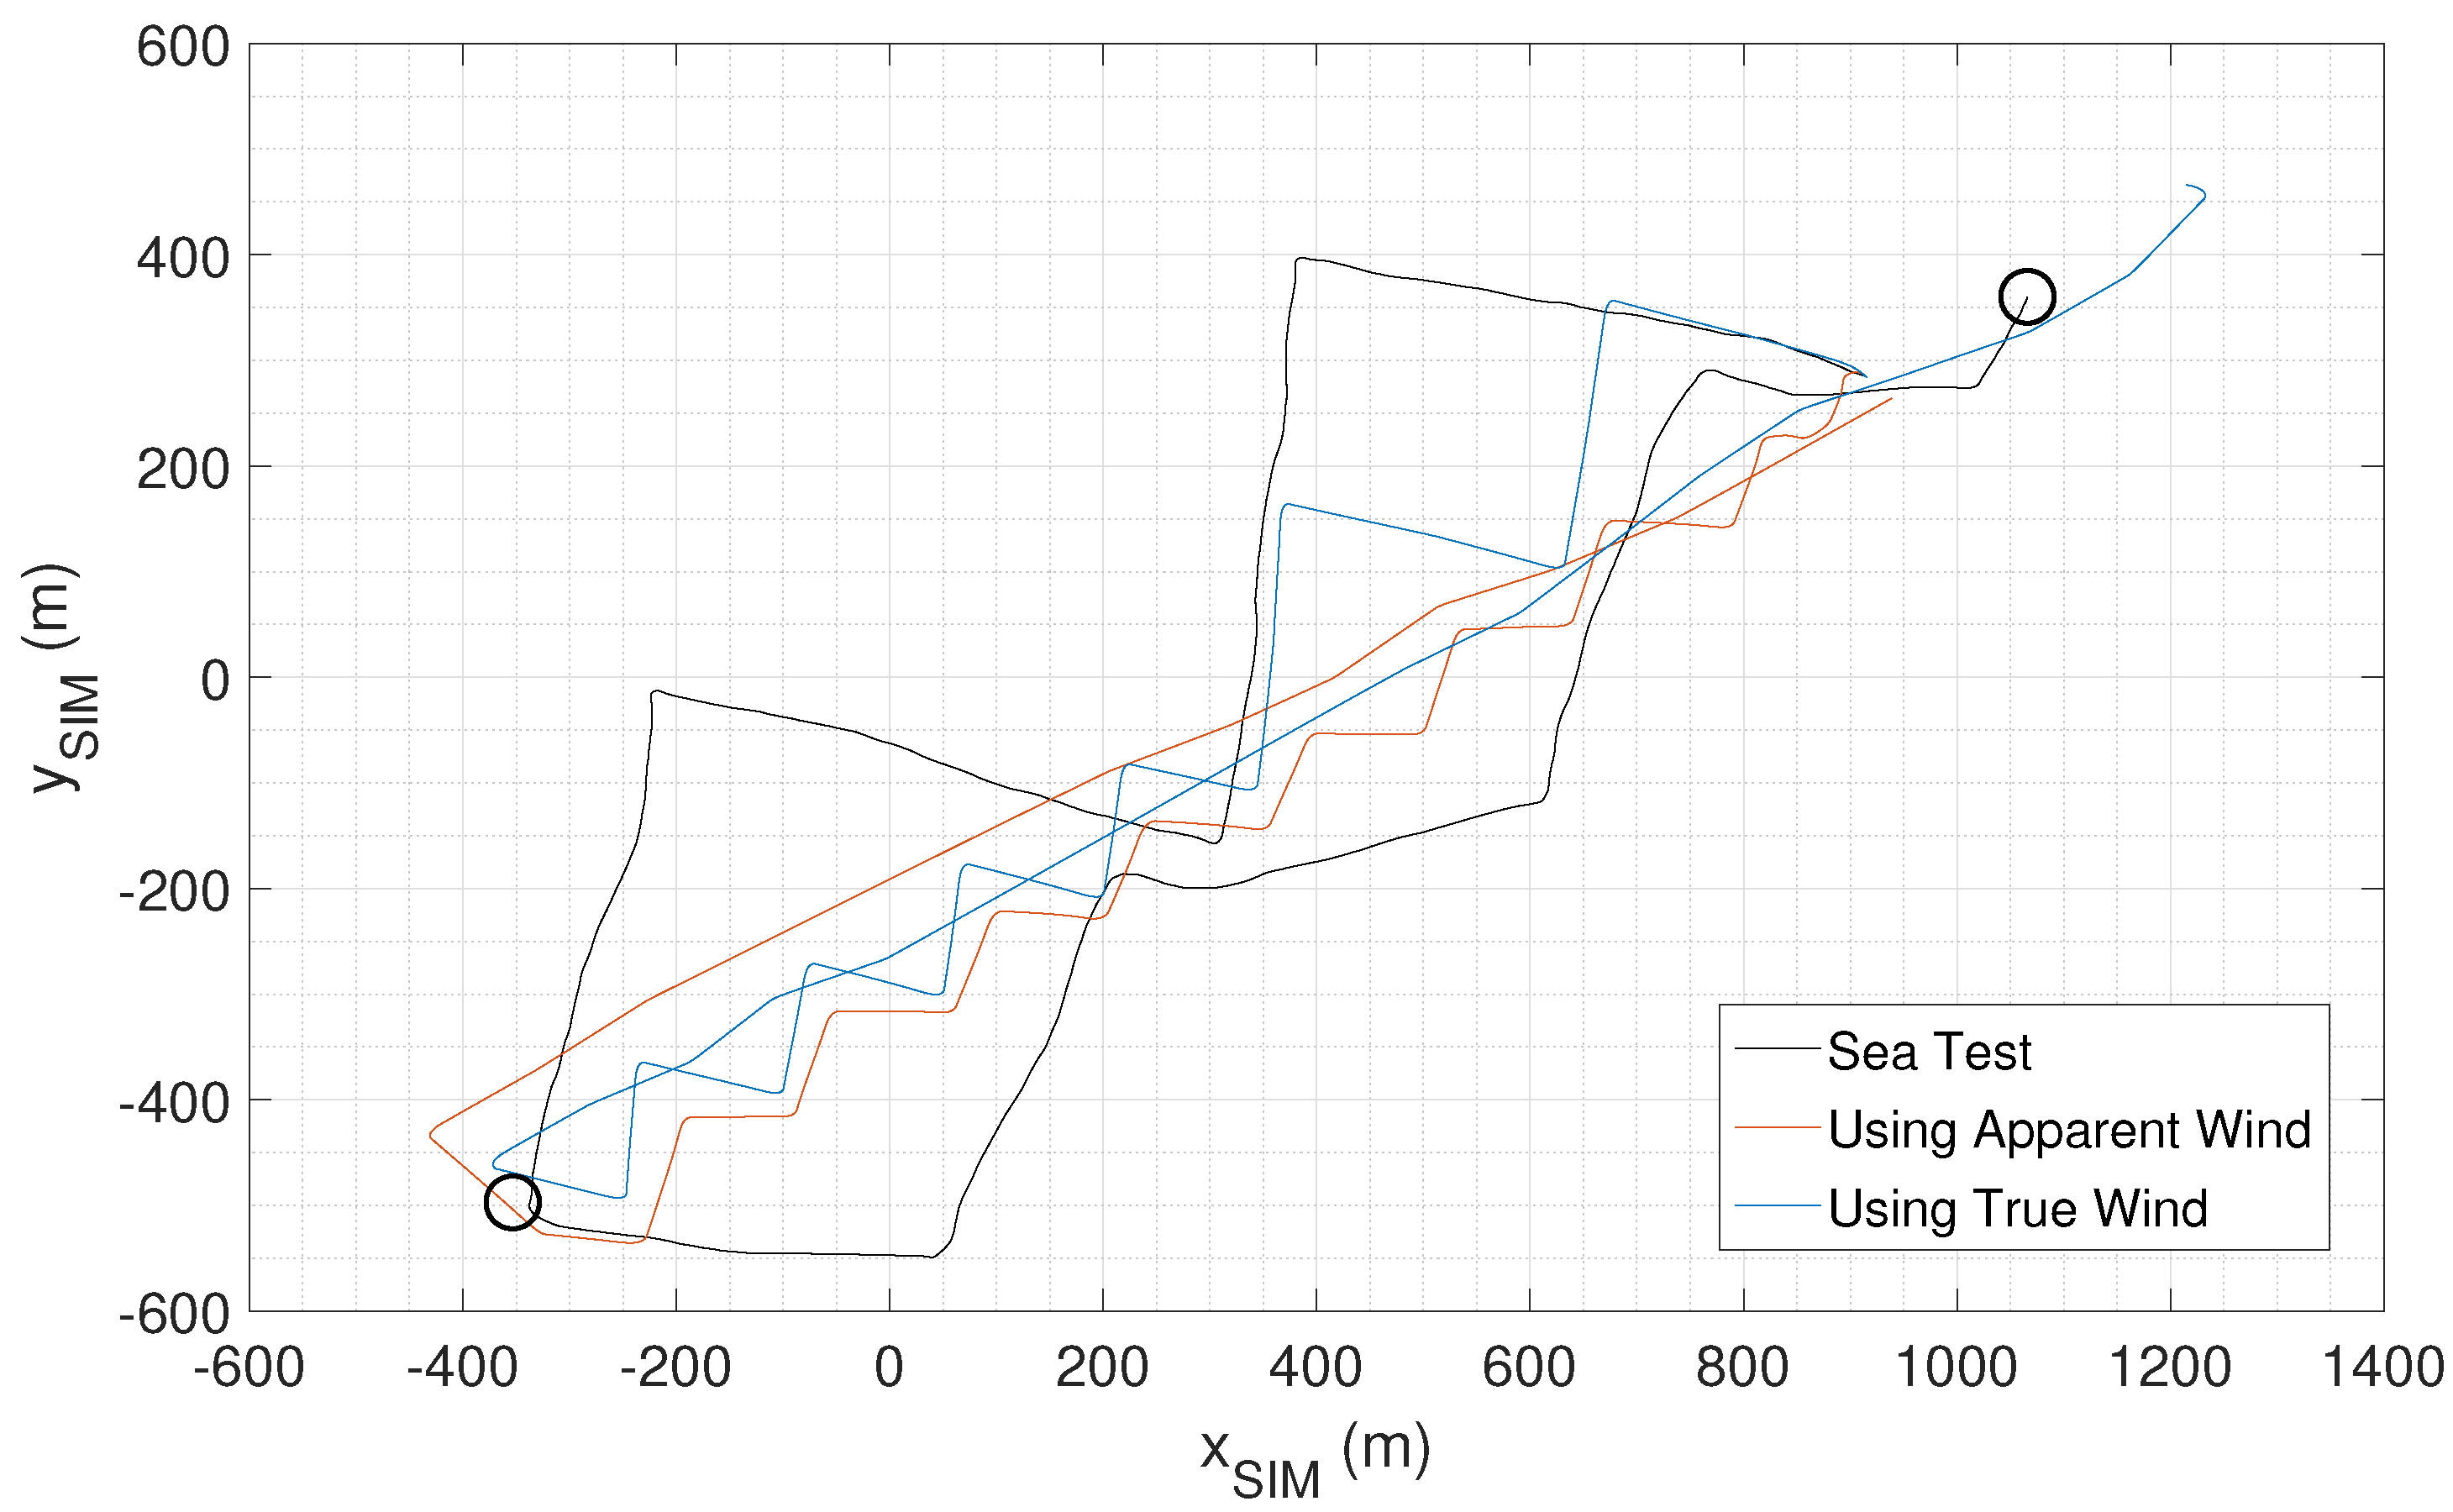
In this study, we first conduct two simulations utilizing the original refresh rates as specified in Table 1. In the first simulation, we utilize the apparent wind as input to the pilot, while in the second simulation, the performance using true wind is evaluated. The corresponding trajectories are then compared to the sea test results as presented in Figure 5. The two waypoints are indicated in the figure as circles with a 25-meter radius, which matches the validation radius. To maintain consistency with the sea test, both simulations are stopped at 1823.0 s, which is the time when the last waypoint was validated during the sea trials.
It can be noted that in practice, fewer maneuvers are typically preferable when the wind does not change. However, the HIL simulator used here assumes that the winds can vary during the mission. Furthermore, the vessel model described in Section 2.1 takes into consideration the different forces that can induce losses in speed during the maneuvers such that the estimated performance is realistic.
As illustrated in Figure 5, the utilization of true wind results in a significant improvement in performance. Specifically, when using apparent wind, the simulated boat is unable to reach the second waypoint within 1823.0 s. However, when using true wind, the boat simulation successfully validates the second waypoint and proceeds beyond it, which suggests that it reaches the waypoint well before 1823.0 s. Using this result, the following simulations are implemented using true wind.
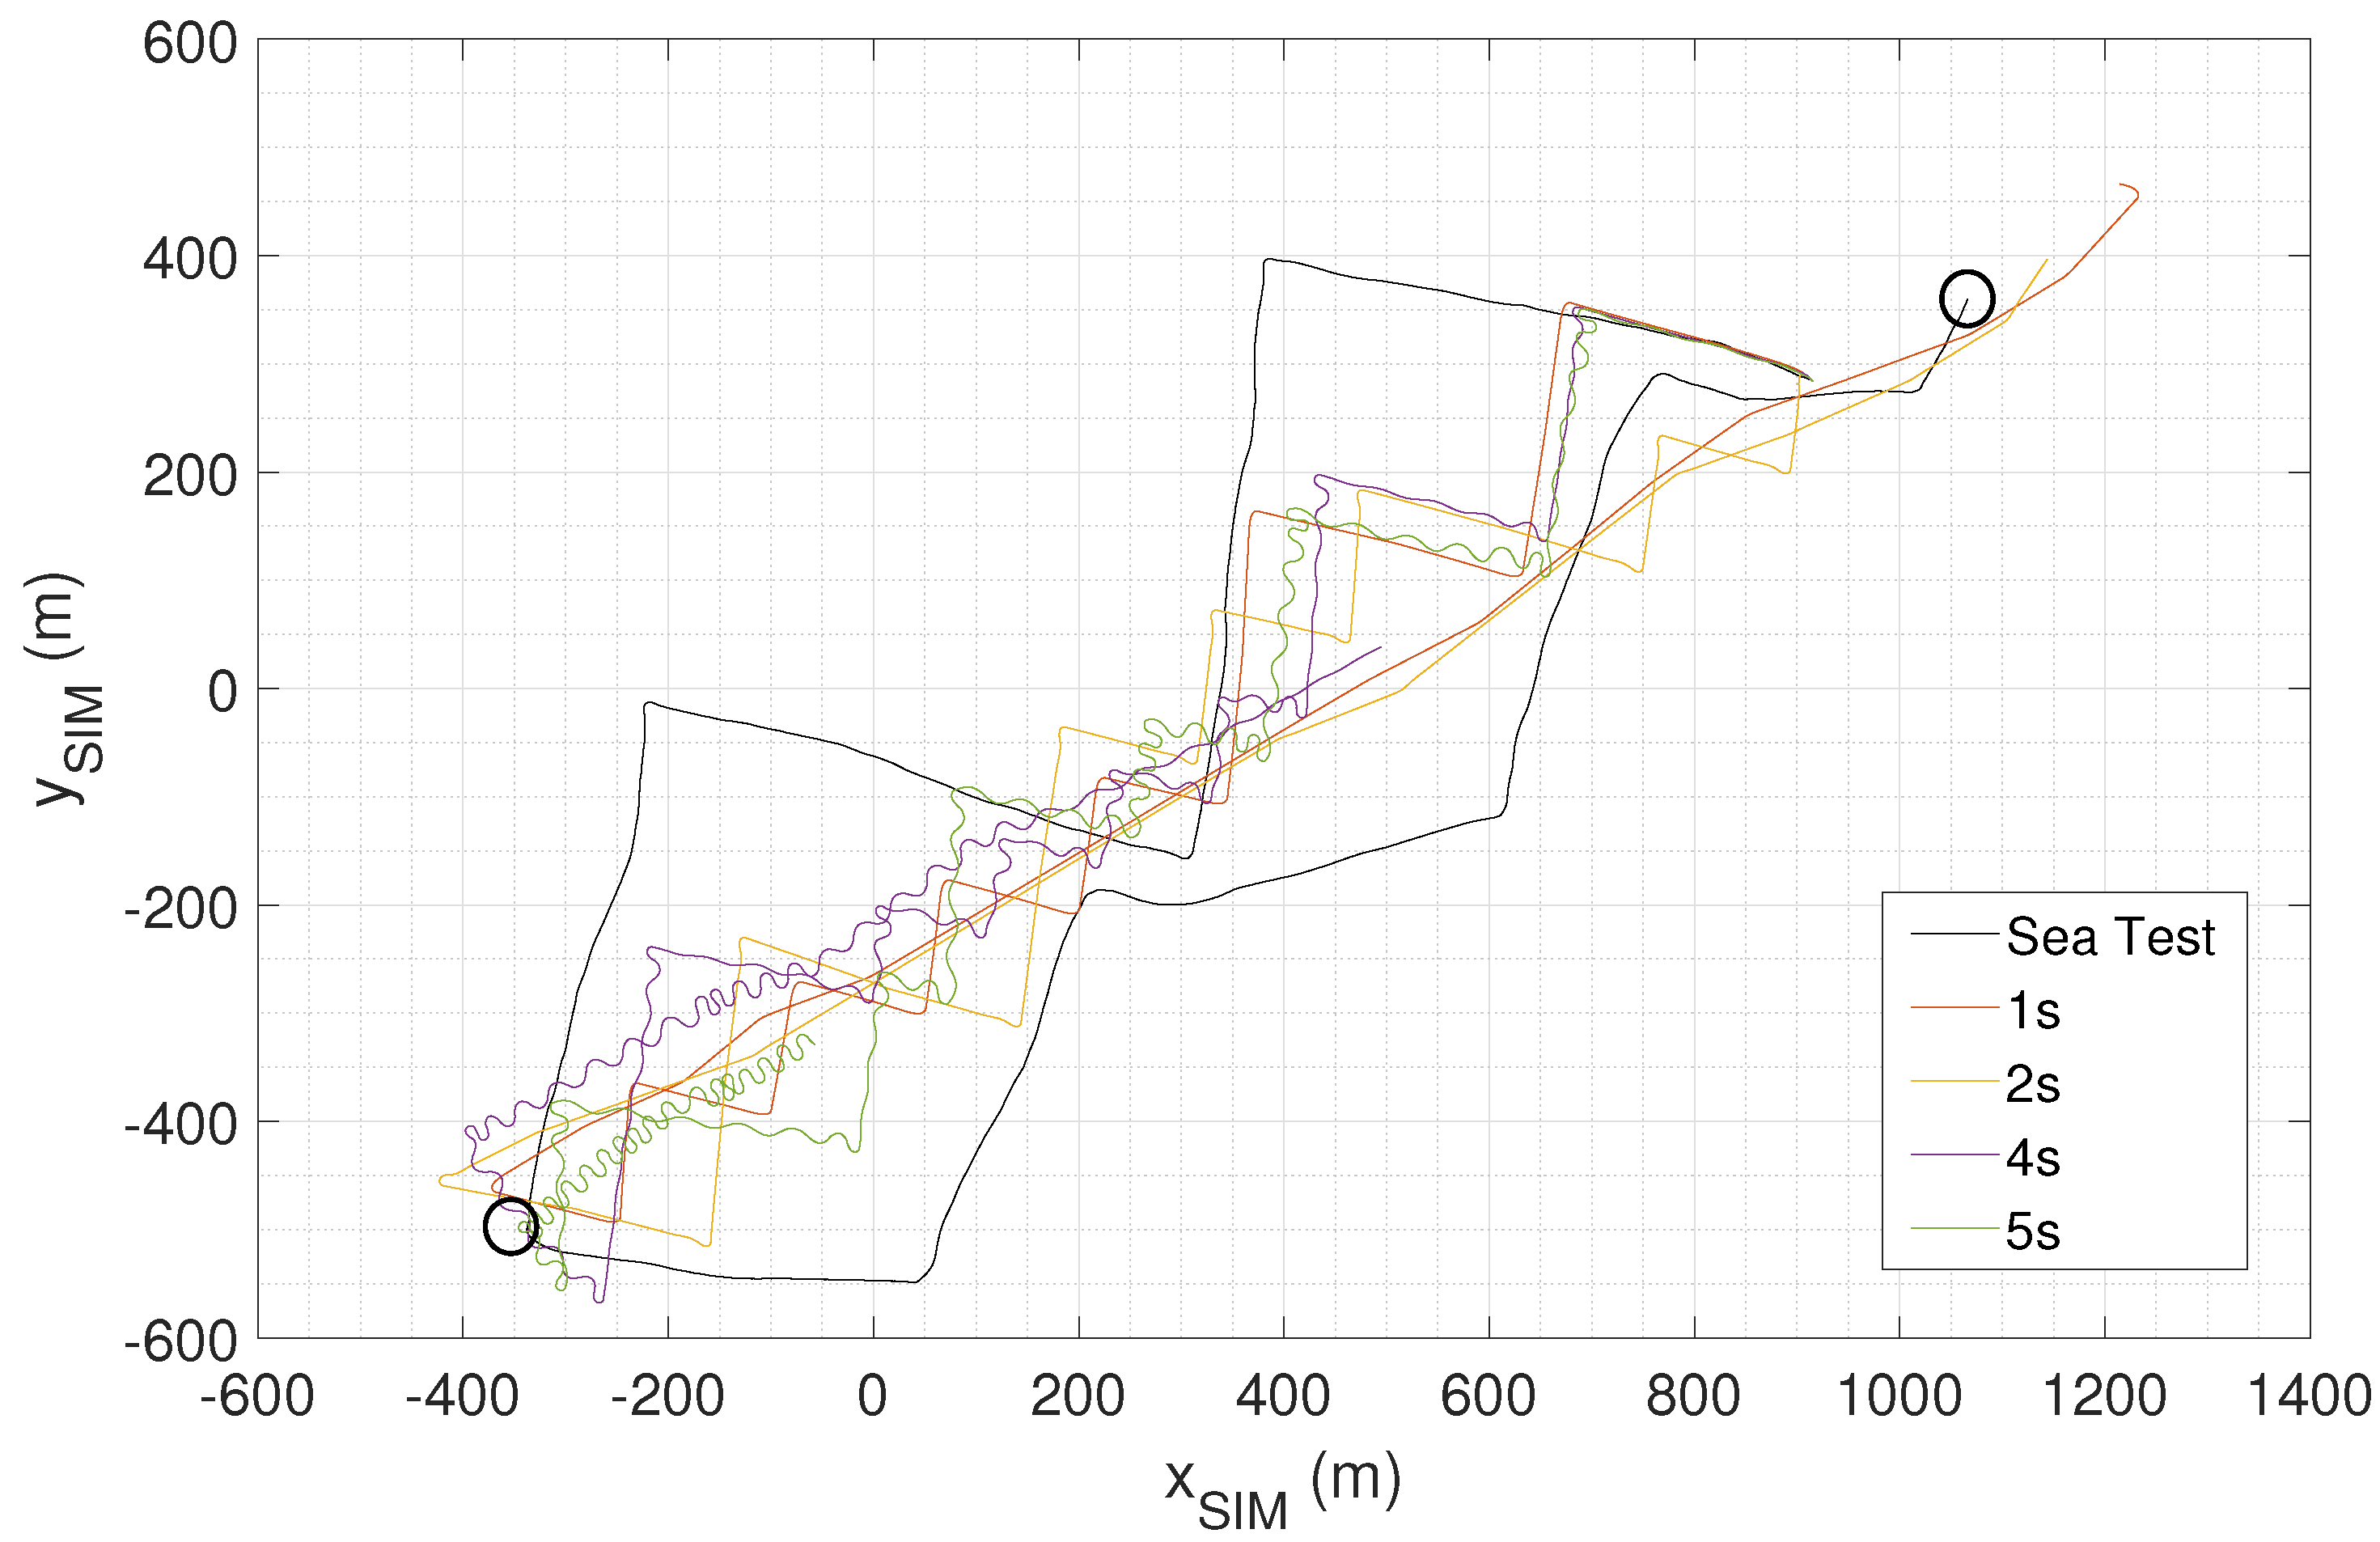
The performance of the pilot is analyzed for different refresh periods of the compass data and is compared using the time taken to reach each waypoint as listed in Table 2. The results show that a refresh period of 1.0 s provides the shortest trip duration. On the other hand, the sailboat fails to reach the second waypoints at refresh periods of 4.0 s and 5.0 s. The sailboat trajectories for different refresh periods are depicted in Figure 6. Increasing the refresh period leads to more oscillatory sailboat trajectories, which can result in instability. Consequently, the sailboat’s trajectory oscillations lead to a longer time required to reach each waypoint.
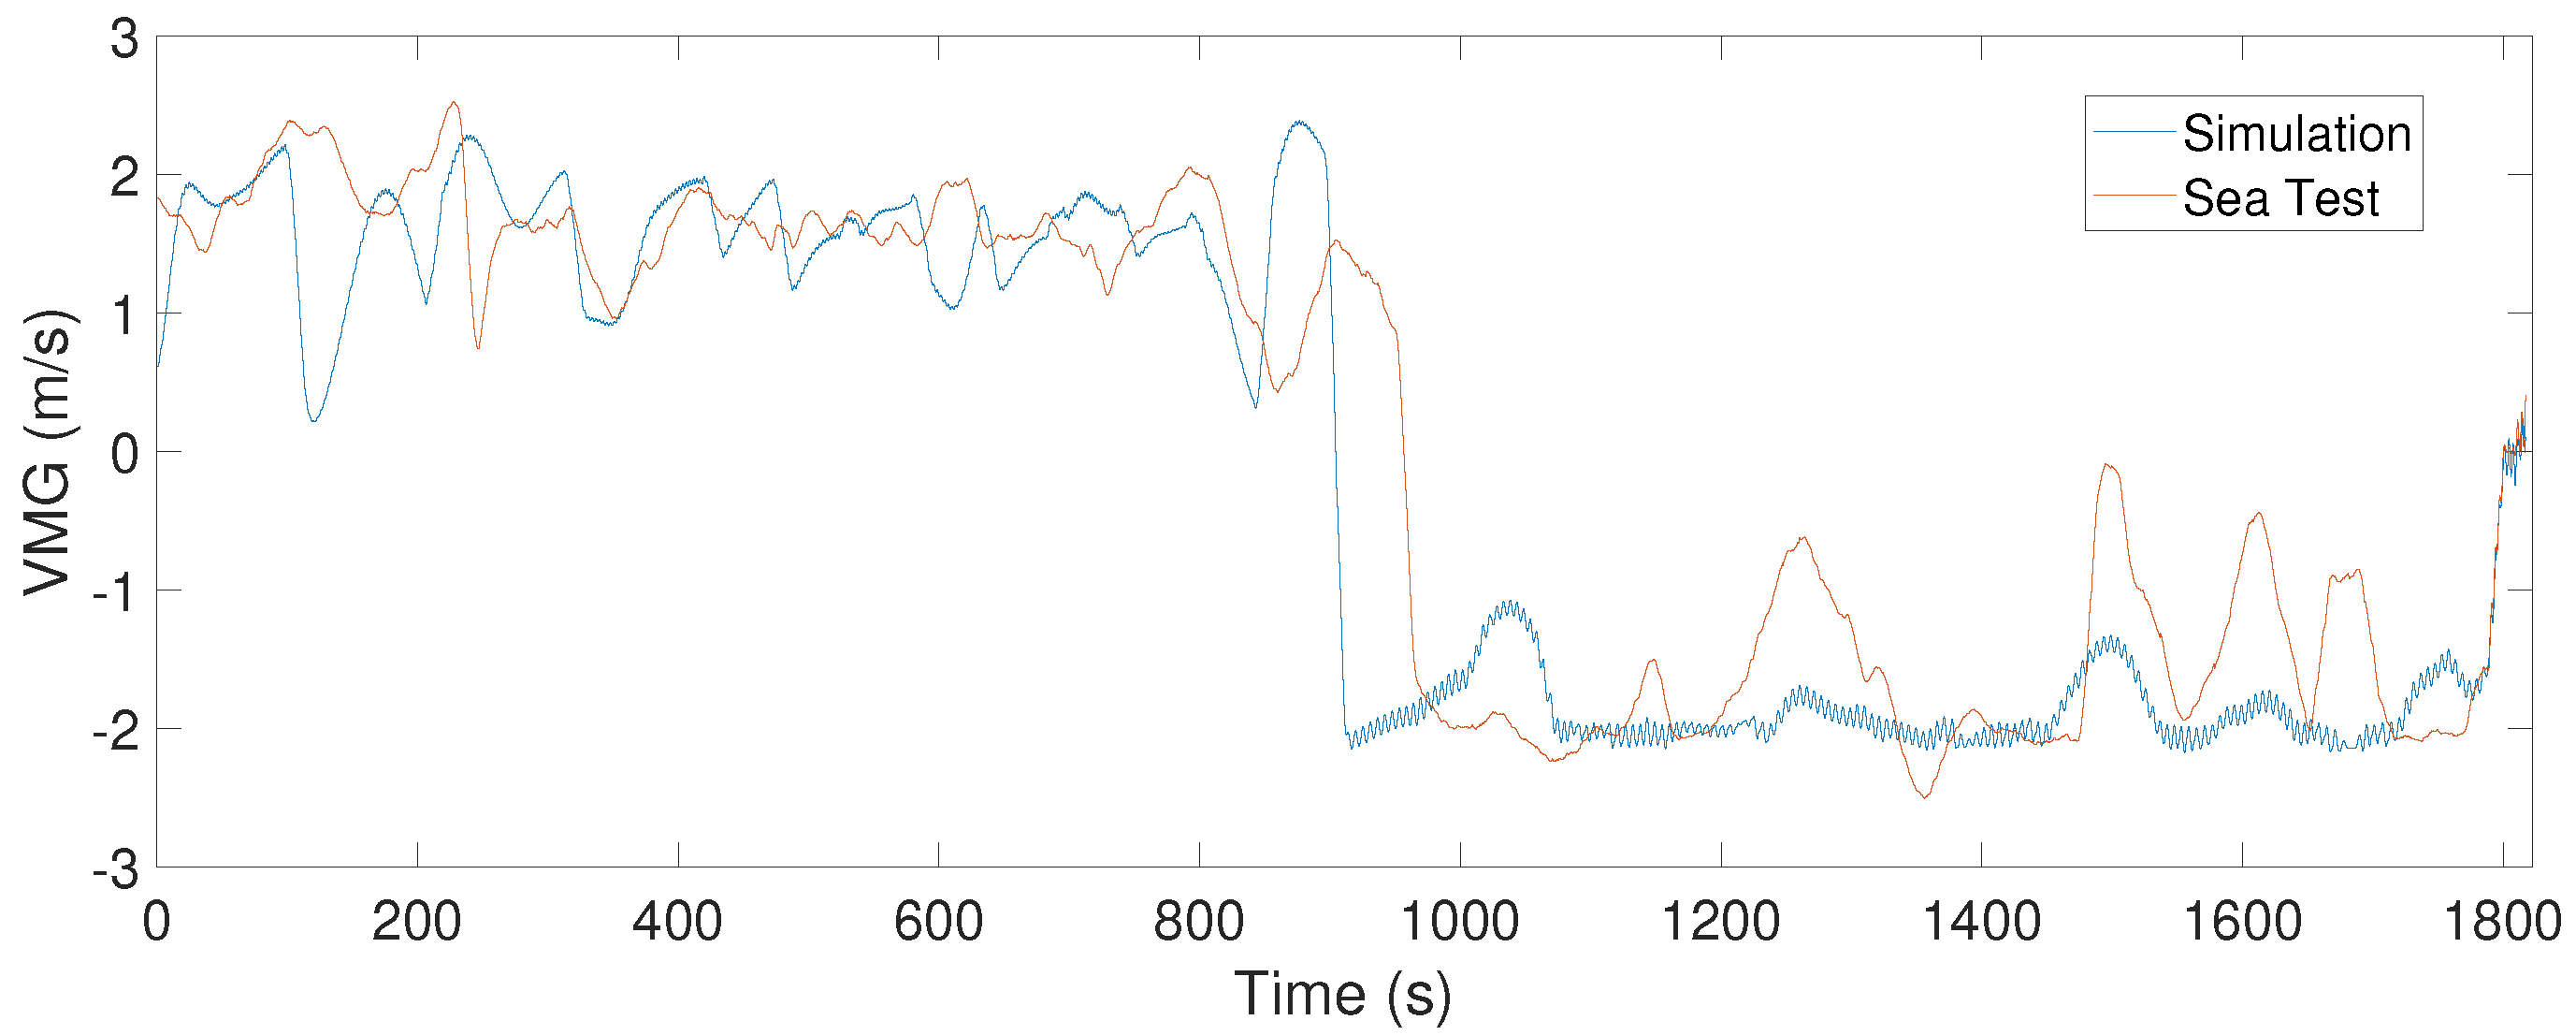
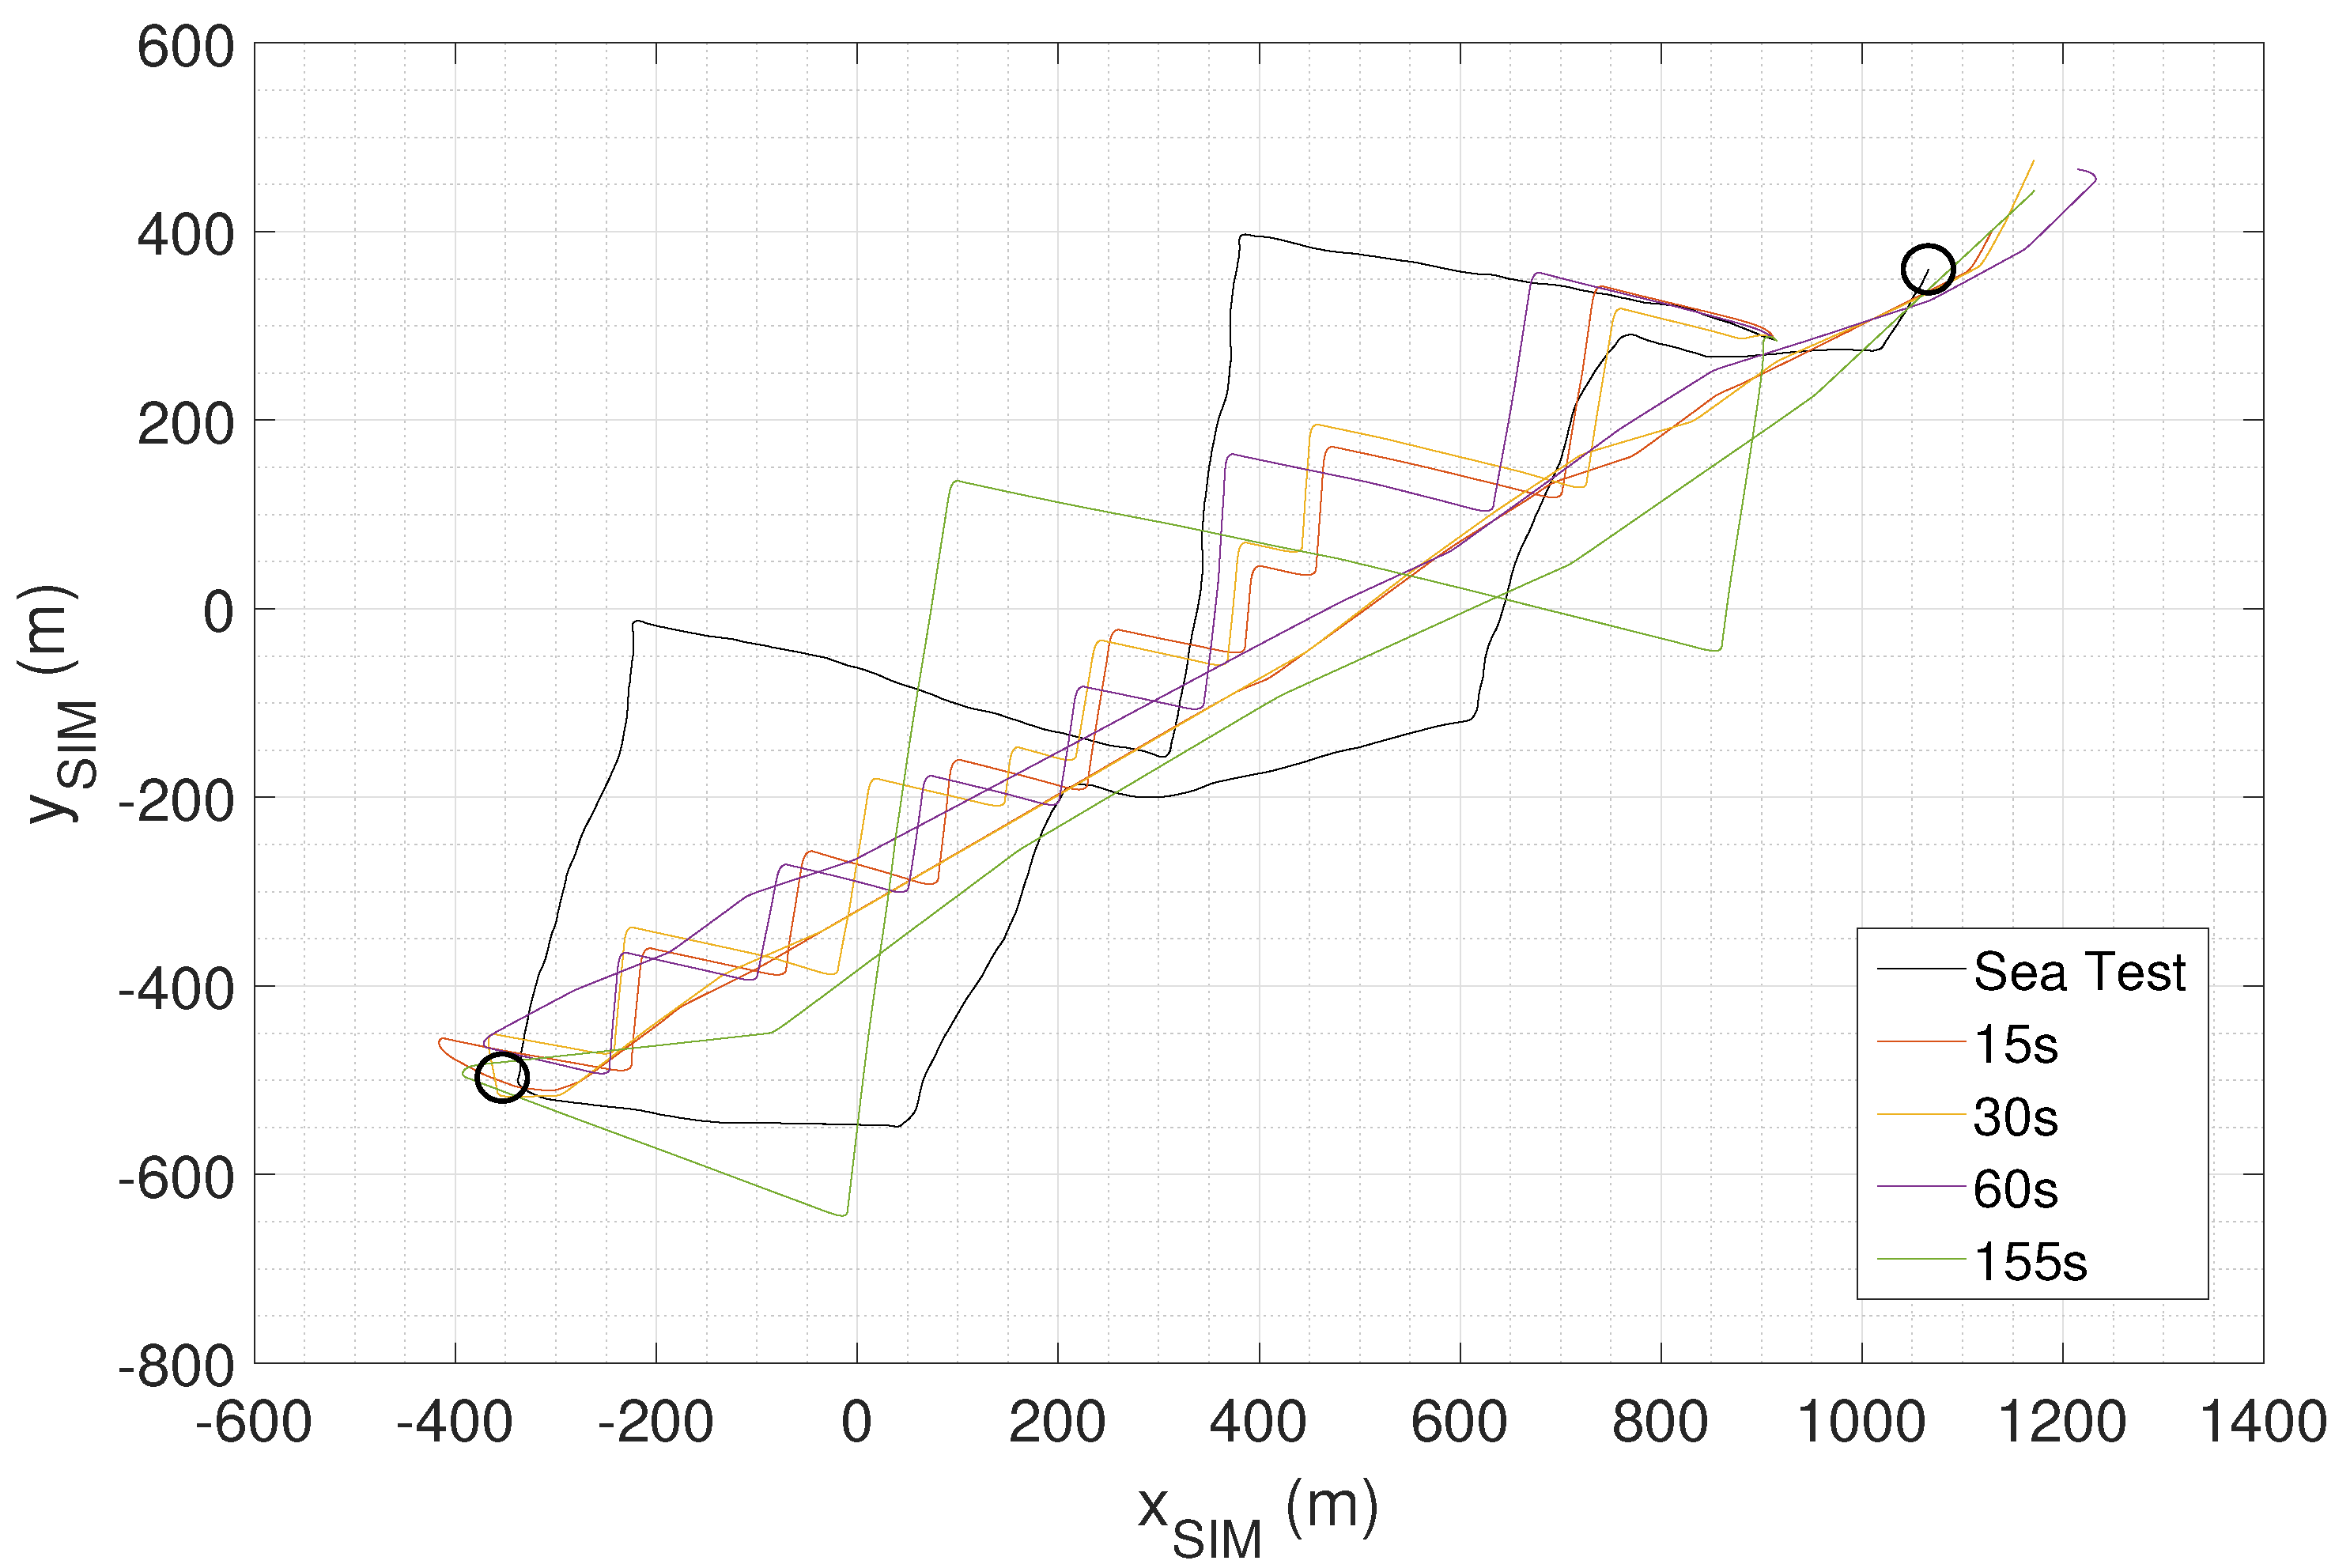
The performance of the pilot is also optimized for the refresh period to update the pilot’s course. The time taken to validate each waypoint for various refresh periods is provided in Table 3. As can be observed, the refresh period for which the trip duration is shortest is equal to 60.0 s. This is attributed to the fact that for this trajectory, the averaged velocity made good (VMG) of the vessel is maximal. VMG is the projected sailboat velocity onto the desired direction (i.e., straight to the next waypoint). It is plotted in Figure 7. We also see that local minima exist. This is due to the fact that although the sailboat may exit the dead zone prior to the refresh period, it must wait until the refresh period elapses to update its course and to effectively aim for the next mark. Because of this, the automated pilot may travel a greater distance than required. The longer the refresh period, the longer the potential extra traveled distance. In comparison, a man-operated vessel may wait such that its next tack aligns with the waypoint position. As an example, the original refresh period for the course of the SeaLeon is 60.0 s. As the Class 8 speed is near 2.5 m/s, she traveled approximately 150 m during that period. With a route consisting of two legs in opposite directions, this can mean up to 300 m of unnecessary extra distance. Hence, the significance of the validation time for the second waypoint may be comparatively limited compared to that of the first waypoint, as it is susceptible to the impact of local minima. Notably, it is observed that a course refresh period of 155.0 s yields optimal performance when navigating upwind.
The paths taken for the different conditions are shown in Figure 8 for different refresh periods of the course. As can be observed, the automated pilot tacks more often than the man-operated vessel. Each tack causes a loss of speed such that the refresh period needs to be chosen judiciously. Additionally, a factor that must be taken into consideration for longer journeys, such as the MicroTransat challenge, is that the sails may deteriorate when they flap during each tack.
To confirm which setting optimizes the performance, the velocity of the sailboat is projected along the average true wind to obtain the VMG in Figure 7. The VMG is positive upwind and negative downwind. As can be observed, the automated pilot reaches the first waypoint about 68 s before the man-operated vessel. The VMG of the autopilot boat cancels at 890 s, while that of the real boat cancels at 958 s. On the windward leg (positive VMG), the simulated boat’s VMG does not appear to be significantly higher than that of the real boat, except for the very last tack between 850 s and 900 s. At this point, the real boat team is probably focused on preparing the spinnaker, and the helmswoman likely missed an advantageous wind shift while the robot did not. This is probably the main reason for the robot’s very significant time advantage at the first mark. It is also interesting to note that while oscillation due to waves can hardly be seen for the upwind leg on the simulation curve, they are visible in the downwind leg. Similar oscillations can be observed on the measurements. However, their frequency is higher and the amplitude is lower, which may be consistent, as the sailing took place in a sheltered area (see Figure 2).
It should be noted that the current SeaLeon pilot could be upgraded to turn towards the waypoint as soon as it leaves the dead zone. However, the HIL simulator can be used to explore different scenarios and evaluate the sailboat’s trajectory under various environmental conditions, such as different wind strengths or directions. Additionally, the simulator can help assess the effectiveness of the pilot algorithm for different spacings between waypoints or different validation radii. For example, for longer distances, the pilot algorithm may opt for larger refresh periods to conserve power, but the simulator can help determine if this choice results in longer travel times or other undesired effects. Similarly, when the sailboat is approaching the validation radius, increasing the refresh rate for the GPS input can help the algorithm quickly determine whether the sailboat is inside or outside the validation radius. The HIL simulator provides information about the timings of the sailboat’s position, attitude, and velocity, which can be used to evaluate the performance of the pilot algorithm under various conditions.

5. Conclusions

In this work, an HIL sailboat simulator is described. Its primary purpose is to validate a pilot algorithm by assessing its performance under specific conditions. The HIL developed here relies on an embedded pilot that is mounted on the SeaLeon, an autonomous vessel that crossed the Atlantic. The HIL models the effect of the different forces on the sailboat to show its progress over time as it is placed under specific wind, wave and current conditions. It is shown, using a sea trial run on the coast of France, that by analyzing the trajectories of the sailboat for various refresh periods for the compass and course update, the overall speed of the sailboat can be optimized for a given mission. Specifically, for the use case presented, the compass refresh rate is minimized and equal to one second for course stability in waves, while the course refresh rate is increased to 155.0 s for the best performance upwind with a better ratio between the loss in speed when tacking and taking advantage of the wind shifts. Note that the optimal course refresh rate can have local minima when there is good synchronization between the waypoint validation and course update. Furthermore, the study demonstrates that the HIL can be used to identify weaknesses in the SeaLeon’s pilot, particularly when it tacks near a waypoint. The HIL’s ability to simulate the sailboat’s trajectory can be used in future work to diagnose the behavior of autonomous sailboats sent to sea, including the trajectory taken by the SeaLeon when it reached the Grand Banks at the crossing between the Labrador and the Gulf Stream. Overall, the HIL sailboat design presented in this work provides a valuable tool for assessing and optimizing sailboat performance under specific environmental conditions, as well as for identifying weaknesses in the pilot algorithm. Finally, an interesting use of the HIL simulator is its potential to improve the system design of a sailboat, such as the hull geometry and sail dimensions, including controllability issues in a seaway and their impact on overall performance. This will be analyzed in future work.

Author Contributions

Conceptualization, K.R.; methodology, T.A. and K.R.; software, T.A., K.R., J.-F.B.; validation, T.A. and K.R.; investigation, T.A. and K.R.; resources, J.-F.B. and K.R.; writing—original draft preparation, T.A., J.-F.B.; writing—review and editing, T.A., J.-F.B. and K.R.; supervision, J.-F.B. and K.R.; project administration, J.-F.B. and K.R.; funding acquisition, T.A., J.-F.B. and K.R.; All authors have read and agreed to the published version of the manuscript.

Funding

This research was funded by Mitacs grant number FR78315.

Conflicts of Interest

The authors declare no conflict of interest.

References

  1. Akiyama, T.; Bousquet, J.F.; Roncin, K.; Muirhead, G.; Whidden, A. An Engineering Design Approach for the Development of an Autonomous Sailboat to Cross the Atlantic Ocean. Appl. Sci. 2021, 11, 8046. [Google Scholar] [CrossRef]
  2. An, Y.; Yu, J.; Zhang, J. Autonomous sailboat design: A review from the performance perspective. Ocean Eng. 2021, 238, 109753. [Google Scholar] [CrossRef]
  3. Bakdi, A.; Glad, I.K.; Vanem, E. Testbed Scenario Design Exploiting Traffic Big Data for Autonomous Ship Trials Under Multiple Conflicts With Collision/Grounding Risks and Spatio-Temporal Dependencies. IEEE Trans. Intell. Transp. Syst. 2021, 22, 7914–7930. [Google Scholar] [CrossRef]
  4. Moreno-Ortiz, A.; Sánchez-Orozco, D.; López-Estrada, L.; Tutivén, C.; Vidal, Y.; Fajardo-Pruna, M. Modelling of an Intelligent Control Strategy for an Autonomous Sailboat - SenSailor. In Proceedings of the 2022 5th International Conference on Advanced Systems and Emergent Technologies (IC_ASET), Hammamet, Tunisia, 22–25 March 2022; pp. 34–38. [Google Scholar] [CrossRef]
  5. Martínez, L.; Jose, S.; Rodríguez, H. Design, Modeling and Simulation of the Navigation and Control Systems for an Autonomous Sailboat Using ROS-Gazebo. In Proceedings of the 2022 8th International Engineering, Sciences and Technology Conference (IESTEC), Panama City, Panama, 19–21 October 2022; pp. 691–698. [Google Scholar] [CrossRef]
  6. Sauzé, C.; Neal, M. Simulating Sailing Robots. In Robotic Sailing; Schlaefer, A., Blaurock, O., Eds.; Springer: Berlin/Heidelberg, Germany, 2011; pp. 113–124. [Google Scholar]
  7. Clement, B. Control algorithms for a sailboat robot with a sea experiment. IFAC Proc. Vol. 2013, 46, 19–24. [Google Scholar] [CrossRef]
  8. Stojcsics, D.; Molnar, A. Fixed-wing small-size UAV navigation methods with HIL simulation for AERObot autopilot. In Proceedings of the 2011 IEEE 9th International Symposium on Intelligent Systems and Informatics, Subotica, Serbia, 8–10 September 2011; pp. 241–245. [Google Scholar]
  9. Reiter, M.; Wehr, M.; Abel, D. Built-in HiL simulator: A concept for faster prototyping of navigation-and communication-based control systems. In Proceedings of the 2016 IEEE International Conference on Advanced Intelligent Mechatronics (AIM), Banff, AB, Canada, 12–15 July 2016; pp. 1363–1369. [Google Scholar]
  10. Zinchenko, S.; Mateichuk, V.; Nosov, P.; Popovych, I.; Solovey, O.; Mamenko, P.; Grosheva, O. Use of simulator equipment for the development and testing of vessel control systems. Electr. Control Commun. Eng. 2020, 16, 58–64. [Google Scholar] [CrossRef]
  11. Roncin, K.; Kobus, J.M. Dynamic simulation of two sailing boats in match racing. Sport. Eng. 2004, 7, 139–152. [Google Scholar] [CrossRef]
  12. Roncin, K. Simulation dynamique de la navigation de deux voiliers en interaction. Ph.D. Thesis, Ecole Centrale de Nantes (ECN), Nantes, France, 2002. [Google Scholar]
  13. Box, G.E.; Hunter, W.H.; Hunter, S. Statistics for Experimenters; John Wiley and Sons: New York, NY, USA, 1978; Volume 664. [Google Scholar]
  14. Masuyama, Y.; Nakamura, L.; Tatano, H.; Takagi, K. Dynamic performance of sailing cruiser by full-scale sea tests. In Proceedings of the SNAME 11th Chesapeake Sailing Yacht Symposium. OnePetro, Annapolis, MD, USA, 10–11 June 1993. [Google Scholar]
  15. Claughton, A. Developments in the IMS VPP Formulations. In Proceedings of the SNAME 14th Chesapeake Sailing Yacht Symposium, Annapolis, MD, USA, 29–30 January 1999; pp. 1–20. [Google Scholar]
  16. Claughton, A.; Fossati, F.; Battistin, D.; Muggiasca, S. Changes and development to sail aerodynamics in the ORC international handicap rule. In Proceedings of the 20th International Symposium on Yacht Design and Yacht Construction, Amsterdam, The Netherlands, 17–18 November 2008. [Google Scholar]
  17. Teeters, J.; Ranzenbach, R.; Prince, M. Changes to sail aerodynamics in the IMS rule. In Proceedings of the SNAME 16th Chesapeake Sailing Yacht Symposium, Annapolis, MD, USA, 10–11 June 2003. [Google Scholar]
  18. ORC. ORC Vpp Documentation; Technical Report; Offshore Racing Council: Livorno, Italy, 2021. [Google Scholar]
  19. Angelou, M.; Spyrou, K. Dynamic stability assessment of yacht downwind sailing in regular waves. Appl. Ocean Res. 2021, 111, 102651. [Google Scholar] [CrossRef]
  20. Thomas, G.; Harris, D.; d’Armancourt, Y.; Larkins, I. The performance and controllability of yachts sailing downwind in waves. In Proceedings of the 2nd International Conference on High Performance Yacht Design, Auckland, New Zealand, 14–16 February 2006; pp. 145–152. [Google Scholar]
  21. Harris, D.; Thomas, G.; Renilson, M. Downwind performance of yachts in waves. In Proceedings of the 2nd Australian Sailing Science Conference, Hobart, Tasmania, 1–2 February 1999. [Google Scholar]
  22. Babarit, A.; Delhommeau, G. Theoretical and numerical aspects of the open source BEM solver NEMOH. In Proceedings of the 11th European Wave and Tidal Energy Conference (EWTEC2015), Nantes, France, 6–11 September 2015. [Google Scholar]
  23. van Oossanen, P. Theoretical estimation of the influence of some main design factors on the performance of international twelve meter class yachts. In Proceedings of the 4th Chesapeake Sailing Yacht Symposium, Annapolis, MD, USA, 20 January 1979. [Google Scholar]
  24. Leloup, R.; Roncin, K.; Bles, G.; Leroux, J.B.; Jochum, C.; Parlier, Y. Kite and classical rig sailing performance comparison on a one design keel boat. Ocean Eng. 2014, 90, 39–48. [Google Scholar] [CrossRef]
  25. Roncin, K.; Kobus, J.M.; Iachkine, P.; Barré, S. Méthodologie pour la validation du simulateur de voilier par des essais en mer, une première tentative. In Proceedings of the Workshop Science-Voile. École Navale, Lanvéoc, France, 1–10 May 2005; pp. 1–10. [Google Scholar]
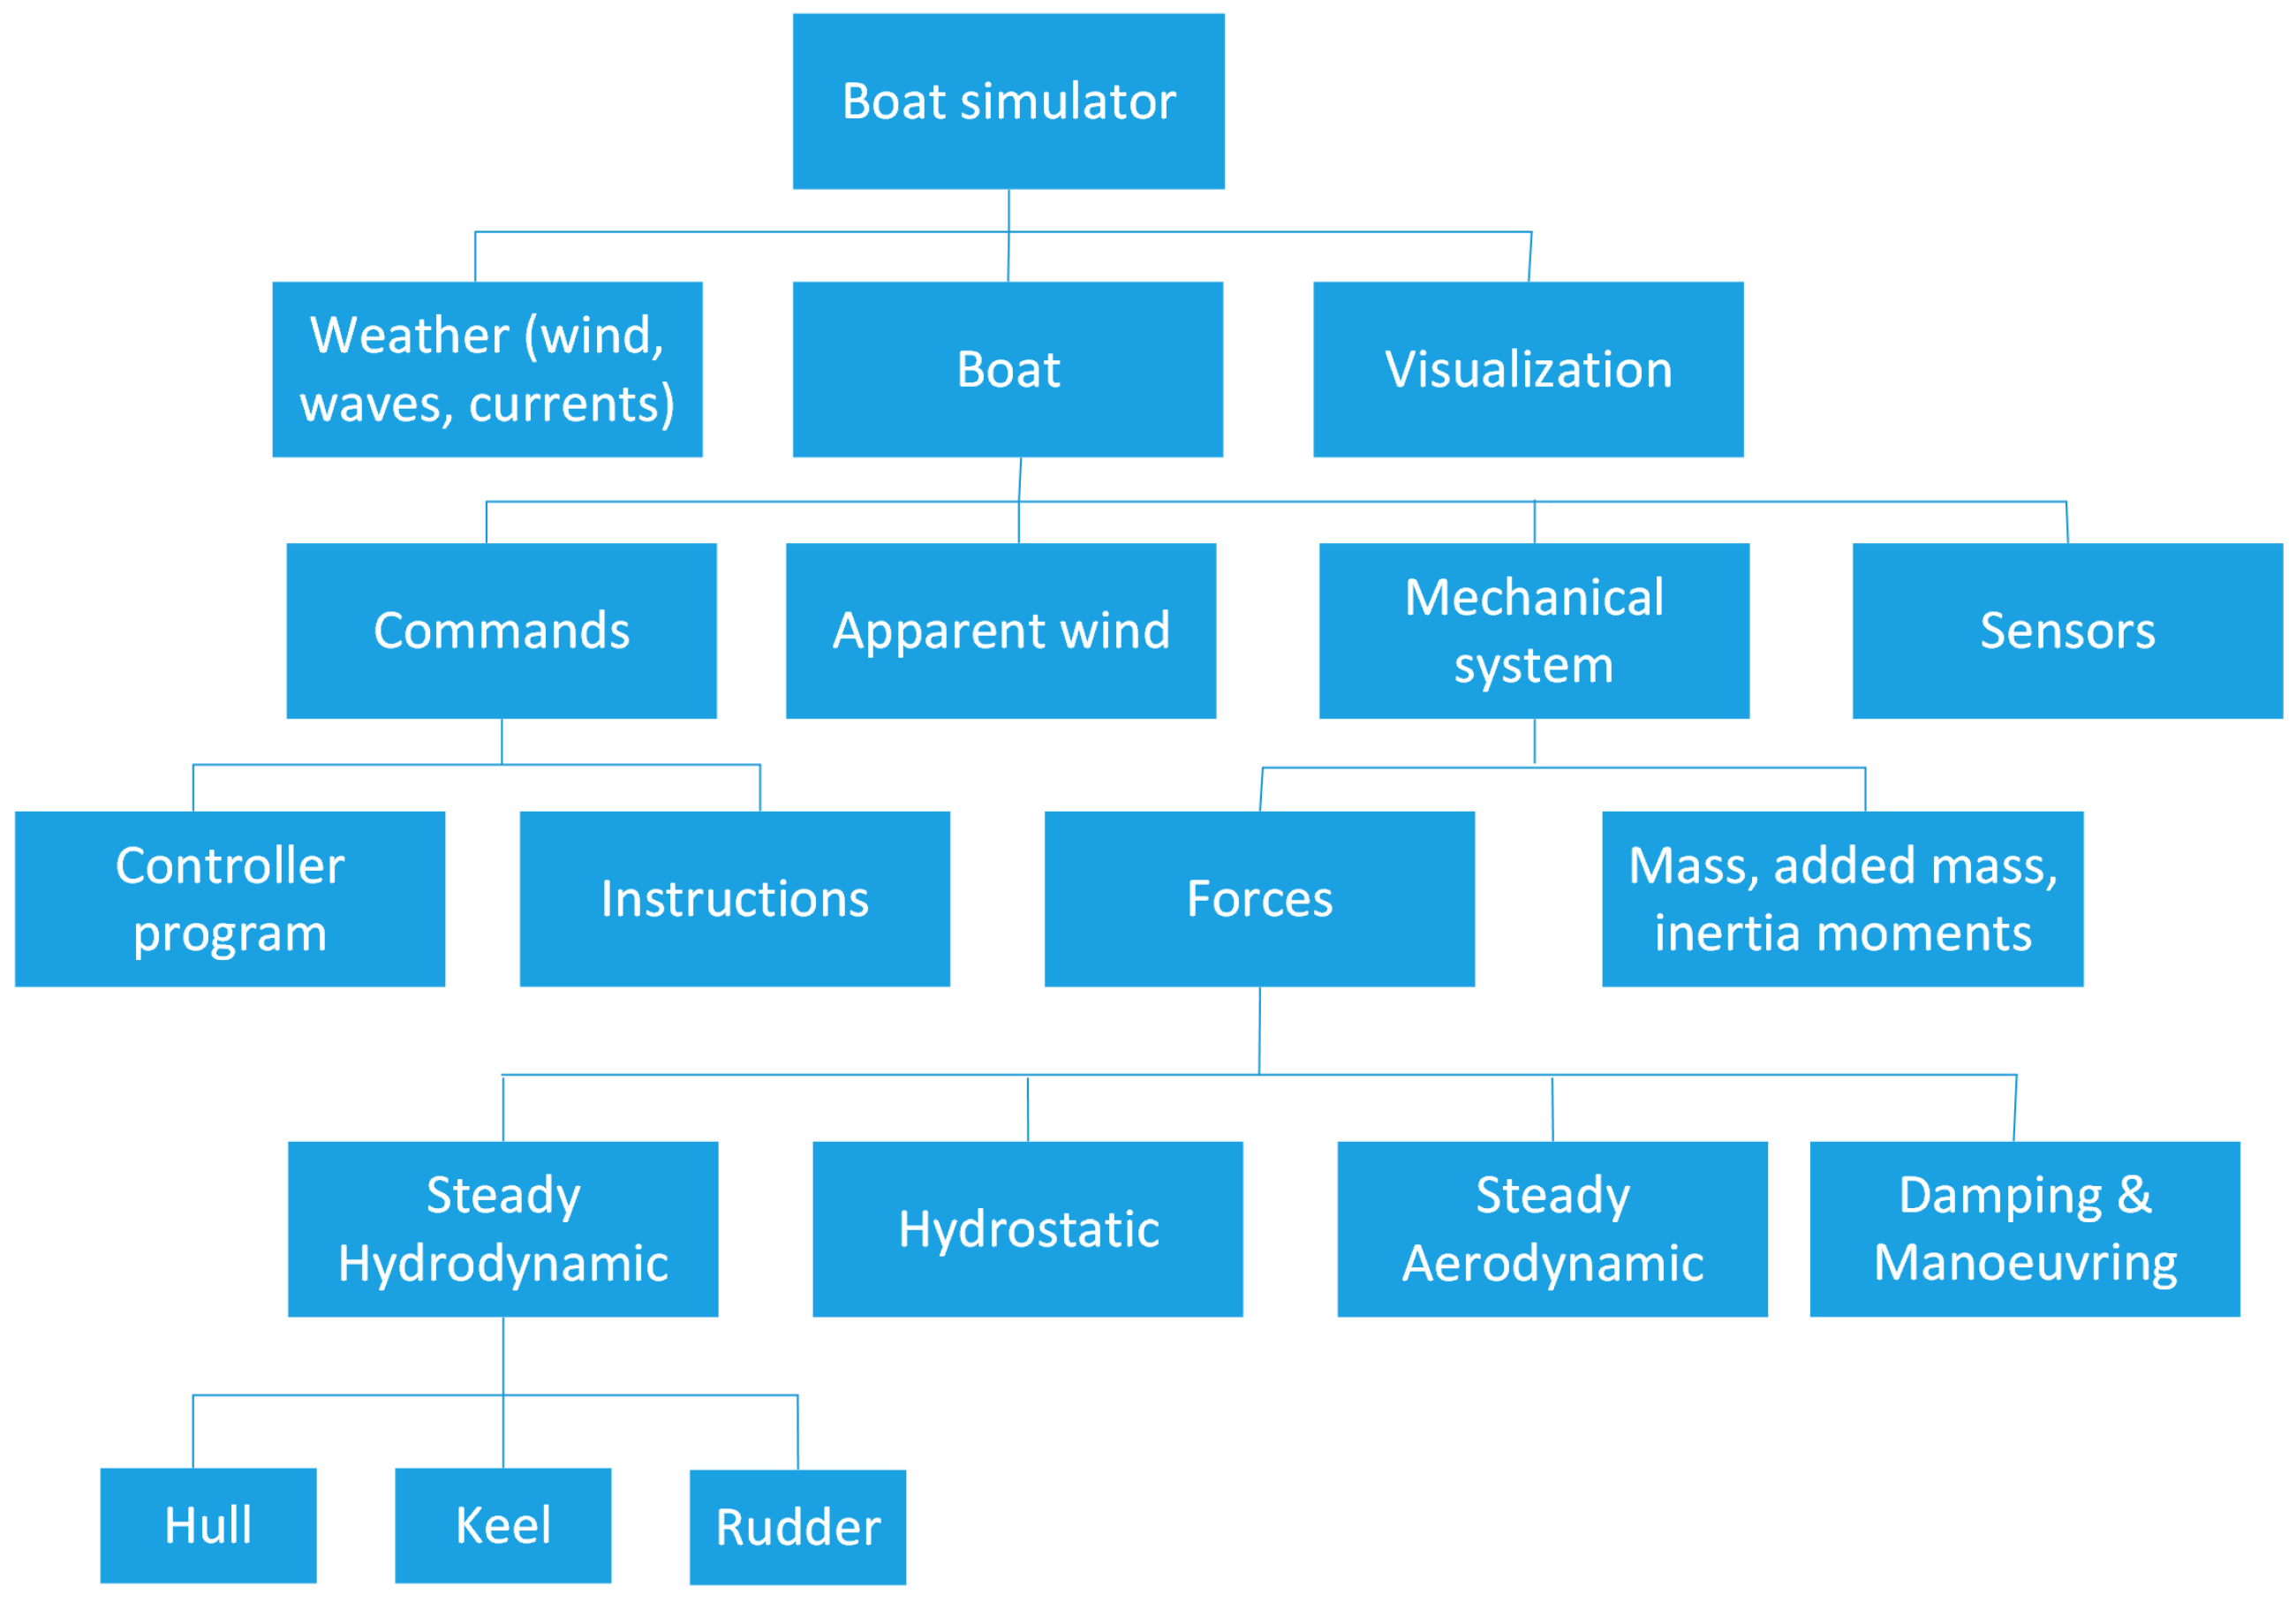
Figure 1. A 6-DOF dynamic sailboat simulator modular structure.
Jmse 11 01104 g001
Figure 2. The test area used in this study.
Jmse 11 01104 g002
Figure 3. Simulation and sea trials trajectories. The black arrows indicate the average wind and current directions. Markers are plot on trajectories every 100 s.
Jmse 11 01104 g003
Figure 4. Micro-controller interface to the host computer to implement the HIL. (a) Diagram illustrating the connections; (b) picture of the hardware.
Jmse 11 01104 g004
Figure 5. Simulated trajectory using original SeaLeon refresh rates using apparent wind and true wind in comparison to sea test trajectory. The black circles represent the 25-meter radius validation area around the upwind and downwind waypoints.
Jmse 11 01104 g005
Figure 6. Simulated trajectories for various heading refresh rates in comparison to sea test trajectory.
Jmse 11 01104 g006
Figure 7. VMG i.e., projection of velocity onto true wind for simulated and sea test results.
Jmse 11 01104 g007
Figure 8. Simulated trajectories for various course refresh rates in comparison to sea test results.
Jmse 11 01104 g008
Table 1. Sailboat control tasks and task period.
TaskPeriod (s)
Data logging5.0
GPS reading10.0
Wind vane reading5.0
Compass reading0.5
Rudder control1.0
Course selection60.0
Table 2. Waypoint validation times for various compass refresh periods.
Compass Refresh Period (s)Waypoint 1 (s)Waypoint 2 (s)
1.0912.71712.1
2.0932.91782.6
4.01178.0-
5.01390.8-
Table 3. Waypoint validation times for various course refresh periods.
Course Refresh Period (s)Waypoint 1 (s)Waypoint 2 (s)
15.0986.51772.4
30.0930.91731.7
60.0912.71712.1
155.0894.71742.4
Disclaimer/Publisher’s Note: The statements, opinions and data contained in all publications are solely those of the individual author(s) and contributor(s) and not of MDPI and/or the editor(s). MDPI and/or the editor(s) disclaim responsibility for any injury to people or property resulting from any ideas, methods, instructions or products referred to in the content.