Abstract
A vertical electro-osmosis method was proposed to improve the bearing capacity of piles in marine soft clay foundations. A top-down electro-osmosis test was conducted by setting an anode and cathode at the top and bottom of the pile, respectively, while the settings of bottom-up electro-osmosis were set in the opposite way. At the same time, a pile without electro-osmosis was also set up for comparison. The variation law of water content, water discharge volume, soil pressure, and surface settlement of soil around the pile during electro-osmosis was tested and analyzed. A direct shear test and static load test were carried out to study the effects of vertical electro-osmosis on the shear strength of soil and the bearing capacity of the pile. The experimental results show that vertical electro-osmosis can significantly improve the bearing capacity of the pile and the shear strength of soil around the pile. The bearing capacity of the piles in the top-down electro-osmosis test was 16.7% higher than that in the bottom-up electro-osmosis test, and the amount of water discharged was 41.69% higher. Compared with the horizontal electro-osmosis around the pile, the vertical electro-osmosis had a faster drainage speed, better soil consolidation, and a slightly smaller increase in the bearing capacity of the pile. Because vertical electro-osmosis is easy to implement on concrete piles, the new method proposed in this study has a broad application prospect.
1. Introduction
Marine soft clay has the characteristics of low shear strength, high compressibility, low permeability, and high water content [1]. The traditional surcharge preloading method and vacuum preloading method are often used to treat soft clay [2]. However, these methods require a longer treatment time, and the treated soft clay foundation will still show a large settlement after treatment. Electro-osmosis is considered to be an efficient method to reinforce soft clay ground [3]. In the 1930s, Casagrande [4,5] introduced electro-osmosis technology into geotechnical engineering. With current as the driving force, the corresponding electro-osmotic permeability coefficient is much higher than the hydraulic permeability coefficient, and the soil between the cathode and anode is consolidated by electro-osmosis. In 1991, Loet al. [6] assumed that the fluid flow caused by the electric field and hydraulic gradient can be superimposed to calculate the total flow, and proposed the one-dimensional consolidation theory of electro-osmosis. Su et al. [7] gave the solution of two-dimensional electro-osmotic consolidation theory under different drainage boundary conditions. Yang et al. [8] obtained the two-dimensional consolidation equation of the electro-osmotic vacuum preloading method, and believed that under the synergistic effect of electro-osmosis and vacuum preloading, the pore water pressure around the cathode and anode electrodes decreased at the same time and expanded to the center of the soil, which could promote the relatively uniform consolidation strength of the soil. Shang [9] established a consolidation analysis model of electro-osmosis enhanced preloading, and used this model to analyze the influence of pore pressure, electric field strength, treatment time, and other factors on soil treatment results. Wang et al. [10] established an analytical solution of one-dimensional electro-osmotic consolidation of unsaturated soil based on the consideration of coupling deformation, aiming at the problems of shrinkage deformation and effective voltage reduction during the electro-osmosis process. The above research results of electro-osmosis theory have laid a solid theoretical foundation for the application of electro-osmosis technology in soft clay foundations. However, in practical applications, many experimental studies have found that there are also many problems affecting the electro-osmosis efficiency, such as soil water content, particle size distribution, permeability, etc. [11,12]. Estabragh et al. [13] studied the effects of pH value, conductivity, and electro-osmosis flow rate on the electro-osmosis effect through a series of model tests. The results showed that with the increase in applied voltage, the liquid limit of soil decreased, the shear strength increased, and the electro-osmotic reinforcement effect was better. Zhang et al. [14] believe that the PH value of the soil has a very significant effect on the conductivity. The lower the PH value at the anode, the lower the conductivity. At the cathode, the conductivity increases significantly with the increase in the PH value. In the electro-osmosis process, salt pollutants accumulate at the cathode, thereby promoting the removal of pollutants. Electro-osmotic treatment is an effective method for the treatment of saline-alkaline low-permeability soil [15]. Wu [16,17] found that the nonlinear variation of electrical conductivity has an important influence on excess pore water pressure and consolidation degree. When the nonlinear change in electrical conductivity is considered, the nonlinear change in soil compressibility will have an important influence on excess pore water pressure. Wang [18] studied the effects of the voltage gradient, energization time, and drainage distance on the electro-osmosis effect, and found that the distribution of the electrode is critical. The appropriate electrode distribution spacing can increase the effective range of electro-osmosis treatment of soil. Studies have found that hexagonal electrode distribution for the electro-osmotic treatment effect is more excellent [19,20]. In order to achieve a better treatment effect, the voltage gradient of the electro-osmosis method is recommended to be kept between 0.30 and 0.50 V/cm to reduce power consumption. The electrode distribution spacing and voltage gradient are closely related to the electrode type and practical application [21]. In addition, scholars also use other methods to improve the effect of electro-osmosis. For example, Sun [22] used electro-osmosis and vacuum preloading alternating method, and Hu [23] added flocculant into the sludge to improve the electro-osmotic permeability of sludge.
Although the above studies have improved the effect of electro-osmotic treatment of soft clay foundation in various ways, the foundation bearing capacity that can be achieved by electro-osmosis or electro-osmotic vacuum preloading is still unsatisfactory. Therefore, the use of the electro-osmosis method to improve the bearing capacity of piles might be a good direction for the application of electro-osmosis technology. The implementation of electro-osmosis in soft clay around the pile can not only improve the strength of mucky soft clay, but also improve the side friction of the pile and the bearing capacity of the pile and composite foundation. Butterfield et al. [24,25,26] found that the electro-osmosis method can greatly improve the bearing capacity of steel pipe piles through field tests. M. Abdel-meguid et al. [27] verified by model tests that electric technology can significantly improve the bearing capacity and uplift capacity of steel pipe piles in marine soft clay. Some scholars [18,28,29] have studied the influencing factors of electro-osmosis, as shown in Table 1. The problem of electrode corrosion has a serious impact on metal piles, but the impact on concrete piles can be ignored. If the electrode is set on the concrete pile to implement electro-osmosis in the soil around the concrete pile, the bearing capacity of the concrete pile and the composite foundation can be effectively improved. The above research on electro-osmosis reinforced piles is based on horizontal electro-osmosis. It is necessary to set the anode and cathode on different piles, or set the anode on the pile body with the cathode in the soil for horizontal electro-osmosis. Therefore, it is not convenient in the field implementation of horizontal electro-osmosis to improve the bearing capacity of piles. In this study, a new type of vertical electro-osmosis-enhanced pile system was proposed. In this system, electrodes were installed at the top and bottom of a pile, respectively. Under the DC electric field, water in the soil around the pile flowed along the pile shaft and was discharged from the foundation, so that the soil around the pile was consolidated and the pile side friction was increased. A model test was carried out, and the monitoring data during the test and the bearing capacity and the shear strength after electro-osmosis were explored.

Table 1.
Summary of influencing factors of electro-osmosis.
2. Soil Parameters and Model Box Design
The test soil was taken from a foundation pit in Ningbo, Zhejiang Province of China. The physical and mechanical properties are shown in Table 2, and the particle size distribution is shown in Figure 1. It can be seen from Table 2 that the soil is neutral and suitable for electro-osmosis [30]. It can be seen from Figure 1 that the proportion of soil particle size less than 0.075 mm is more than 95%, indicating that its permeability is low and compressibility is high.

Table 2.
Basic physical and mechanical properties of soil.
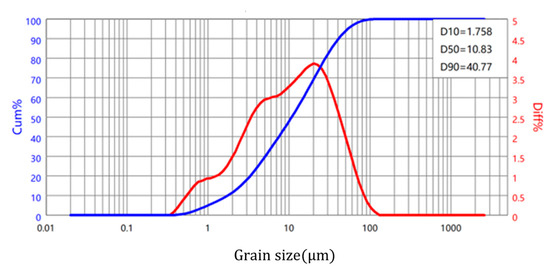
Figure 1.
Particle size distribution curve of soil.
A steel box, whose size was 2 m × 1 m × 1 m (length, width, and height), was used for the model test. The box was separated by an impermeable baffle in the middle and divided into two model boxes with a size of 1 m × 1 m × 1 m, which were used for the test of the electro-osmosis from bottom to top and from top to bottom, respectively. The marine soft clay was loaded in the model box, and a model pile was embedded in the clay. The test model pile was a PVC pipe with a diameter of 90 mm, wall thickness of 2 mm, and length of 750 mm, whose bottom was closed and top was open. The anode and cathode were arranged at the top and the bottom of the pile, respectively, to perform the vertical electro-osmosis, and the electro-osmosis direction could be reversed by exchanging the position of the anode and the cathode.
Two metal rings were installed on the pile at 20 cm from the top and 10 cm from the bottom of the pile, respectively, as electrodes. For electro-osmosis from bottom to top, as shown in Figure 2, the top metal ring was connected to the negative pole of the DC power supply, and the bottom metal ring was connected to its positive pole. The closed end of the pile is buried in soil at a depth of 65 cm. A collecting cup is placed on the soil surface to collect the water drained from soil by electro-osmosis.
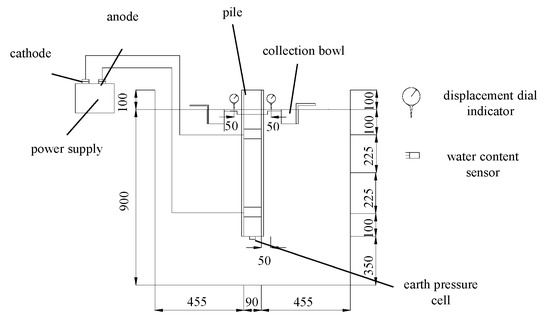
Figure 2.
Layout of electro-osmosis test from bottom to top.
For the top-down electro-osmosis test, as shown in Figure 3, the bottom electrode of the pile was connected to the negative pole of the power supply, and the top electrode of the pile was connected to the positive pole. The bottom of the pile was drilled with many small holes and wrapped with filter cloth. A plastic pumping pipe was set in the cavity of the pile to be used to pump water from pile bottom. The water content sensors were buried at a distance of 5 cm from the pile and a depth of 10 cm, 32.5 cm, and 55 cm, respectively. The water content sensor model was JXBS-3001-TR, the accuracy was 0.1, the probe length was 70 mm, the range was 0~100%, and the working temperature was −40~80 °C. The electromagnetic pulse technology was used to measure the soil water content. The measured data were calibrated with the traditional water content measurement method, and the difference between the two was within 1%. An earth pressure box was arranged at the bottom of the pile. Two displacement meters were symmetrically arranged at the soil surface 5 cm from the pile to measure the soil surface settlement. In order to reduce the influence of water evaporation on the test, the soil surface was sealed with plastic membrane.
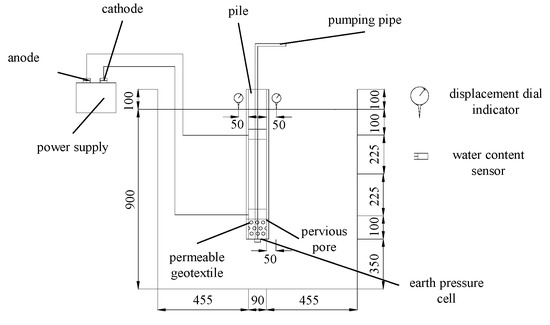
Figure 3.
Layout of electro-osmosis from top to bottom.
The clay sample was dried, crushed, and soaked to keep the initial average water content of the soil in the test box at 40%. Sensors were embedded in the filling process of the soil. The consolidation of soil was completed under gravity before testing. The shear strength of the soil before electro-osmosis was tested. The changes in water content, soil surface settlement, drainage volume, and soil pressure at the bottom of the pile were monitored during the test. The data were observed once every 1 h in the early stage of the test, once every 2 h in the middle stage of the test, and once every 3 h in the later stage of the test until the soil settlement basically stopped. The test stopped when the water content stopped changing.
As shown in Figure 4, the soil around the pile after the test was taken with a ring knife to carry out the direct shear test. The static load test of the pile after electro-osmosis was also performed to test the bearing capacity of the electro-osmosis-enhanced pile, as shown in Figure 5.
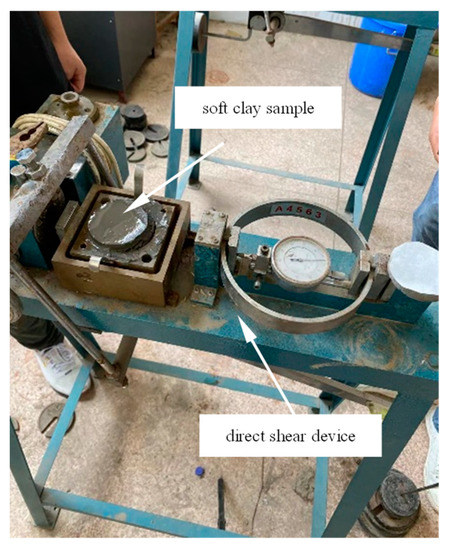
Figure 4.
Direct shear test.
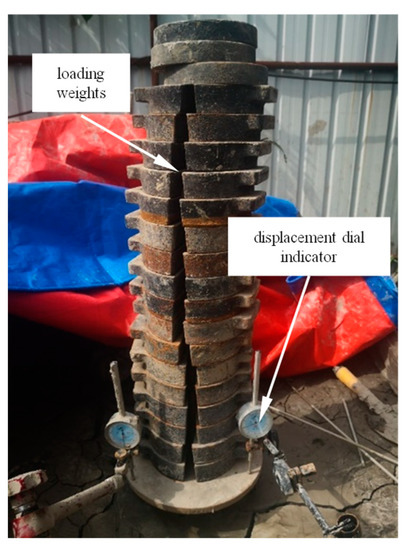
Figure 5.
Static load test.
3. Test Data Analysis
3.1. Water Content
The bottom-up electro-osmosis test and the top-down electro-osmosis test were started at the same time. The cations in the water moved to the cathode with the carried water molecules, As shown in Figure 6. The water content of the soil at the cathode increased, and the water gathered at the cathode was pumped out. During the test, water content sensors were placed at the cathode, anode, and between the cathode and anode of the pile to monitor the water content changing in the soil.
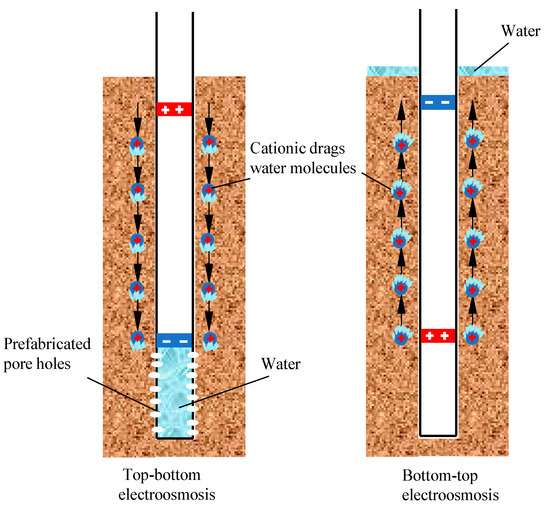
Figure 6.
Water flow in electro-osmosis.
In the bottom-up electro-osmosis test, the electrode at the bottom of the pile was the anode, and the electrode at the top was the cathode. The water in the soil flowed from the bottom to the top, seeping out of the soil surface and converging into the water-collecting cup. As shown in Figure 7, in the early stage of the test, 0–15 h, the water content of the soil at the bottom and the middle of the pile decreased rapidly, and the water content at the top increased sharply. In the middle stage of the test, at 15–30 h, the water content changed slowly. However, in the 30–35 h stage, the water content at the bottom increased slightly. This could be explained by the fact that the resistance of the pile–soil interface increased, leading to the electro-osmosis efficiency decreasing. The water in the upper part of the soil flowed downward to the anode under gravity, causing a slight increase in the water content at the anode. The water content at the cathode decreased slightly, and then tended to balance. After the end of electro-osmosis, the water content at the anode was 25.5%, which was decreased by 37.2% compared with the initial value of 40.6%.
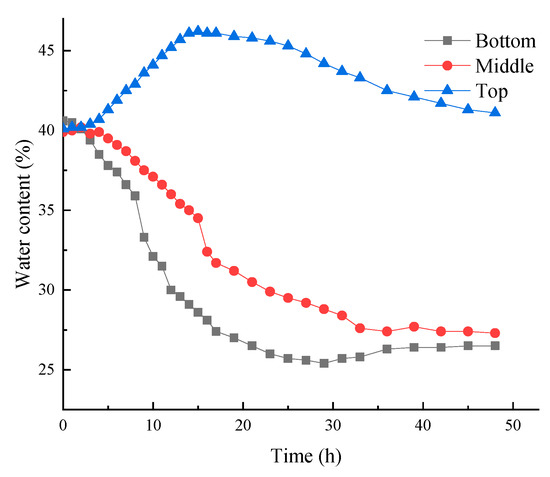
Figure 7.
Variation curve of water content with time at monitoring points of bottom-up electro-osmosis.
In the top-down electro-osmosis test, the electrode at the bottom of the pile was the cathode, and the electrode at the top was the anode. The water in the soil flowed from the top of the pile to the bottom and entered the inside of the pile through the holes on the pile at the bottom, and the water was extracted from the inside of the pile using the pumping pipe. As shown in Figure 8, in the early 3–15 h stage after the start of electro-osmosis, the water content at the bottom of the pile increased rapidly under the action of electro-osmosis, and the water content at the top of the pile decreased sharply. The water content between the two electrodes decreased after a short rise, because the water at the cathode penetrated into the pile at a limited rate, and the water in the soil at the anode rapidly infiltrated downward, resulting in a slight increase in the water content between the electrodes. In the middle stage of 15–35 h, the change in water content was slight, and the content tended to be stable in the stage of 35–48 h. The water content at the anode was 22.5% in the final, which was reduced by 44.2% compared with the initial water content of 40.3%.
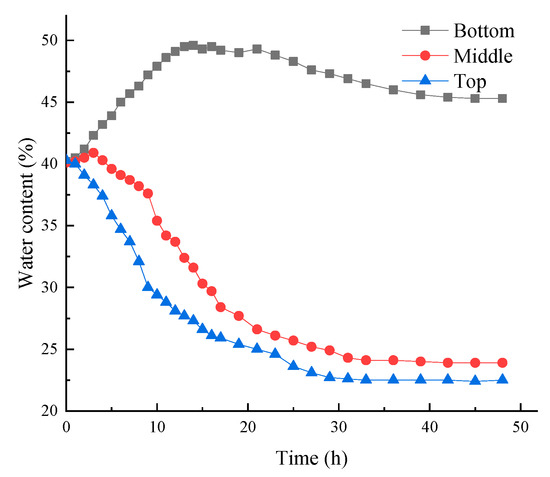
Figure 8.
Variation of water content with time at monitoring points of top-down electro-osmosis.
The test proved that it was feasible to implement vertical electro-osmosis on the pile, and the drainage effect of electro-osmosis from top to bottom was better than that from bottom to top. The bottom-up electro-osmosis needs to overcome the gravity of the water in the soil. After the power supply is stopped, part of the water in the upper soil will return downward, resulting in a slight increase in the water content of the soil at the anode.
3.2. Water Discharge Volume
The amount of water discharged from the soil in the electro-osmosis test can directly reflect the electro-osmosis effect. In the electro-osmosis test, from the bottom to the top, the water in the soil was gathered to the cathode and collected by the water-collecting cup. In the top-down electro-osmosis test, the water at the cathode entered the pile from the holes at the bottom and was pumped out from the inside of the pile by a pump.
As shown in Figure 9, the electro-osmosis water discharge increased rapidly within 20 h, but became slow thereafter and almost stopped increasing at the end of the experiment. The total amount of water extracted from the top-down electro-osmosis was 41.69% higher than that from the bottom-up experiment. Although the water content of the soil in the two tests was the same, the amount of water discharged by electro-osmosis was quite different. This indicates that the application effects of the two different electro-osmotic methods proposed in this study may be very different in engineering. In the early 0–10 h stage, the amount of water was large; in the middle 10–20 h stage, the amount of discharging water decreased rapidly; in the later stage, the amount of discharging water decreased slowly, and finally tended to 0. In the bottom-up electro-osmosis group, the amount of discharging water was maintained at about 180 mL in the initial stage of electro-osmosis. The reason was that electro-osmosis needed to overcome the gravity of water, so time was taken for the water to go upward to the cathode. At the end of the experiment, the total amount of water pumped from the top-down electro-osmosis group was 14,501 mL, while the total amount of water pumped from the bottom-up electro-osmosis group was 10,234 mL, and the amount of water pumped from the top-down electro-osmosis was 41.69% higher than that from the bottom-up test.
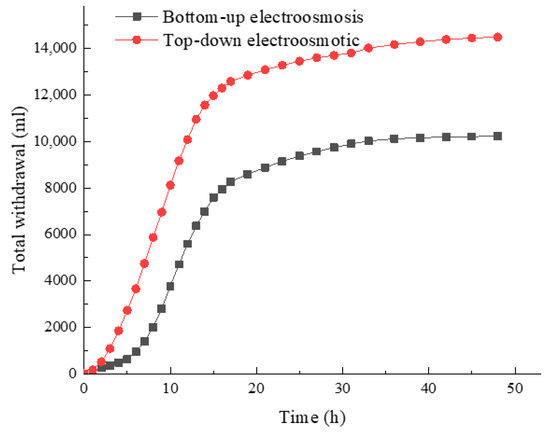
Figure 9.
Variation curve of water discharge volume with time in electro-osmosis test.
The water discharge rate with time in electro-osmosis tests is shown in Figure 10. The water discharging rate of the top-down electro-osmosis group was greater than that of the bottom-up electro-osmosis group in the early and late stages, and the discharging rate in the middle stage was basically the same. The average discharging rate of the bottom-up electro-osmosis group was 192.14 mL/h, and the average discharging rate of the top-down electro-osmosis group was 280.52 mL/h, with an increase of 46.00%. The reason was that the water in the top-down electro-osmosis group could converge to the lower cathode faster under its own gravity, and the discharging rate was faster.
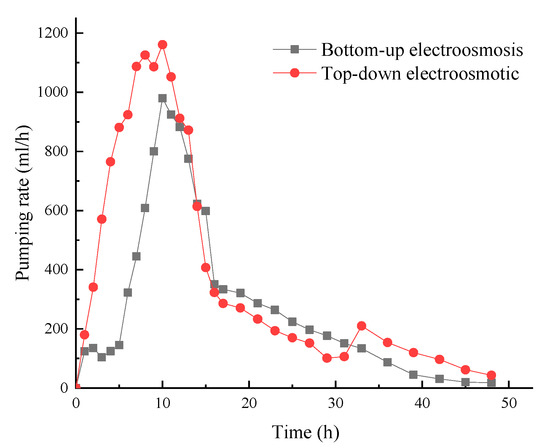
Figure 10.
Variation curve of water discharge rate with time in electro-osmosis test.
3.3. Current Change Analysis
The change in current in the process of the electro-osmosis test can better reflect the change in soil resistance and electro-osmosis energy consumption. Considering the electrical safety of the test, the power supply voltage of the two groups of tests was 36 V, and the initial current was 2.3 A. As shown in Figure 11, during the test, the current changes in the two groups of tests were basically the same. The overall trend was a rapid decline in the early stage, a slow decline in the middle and late stages, and finally tended to be gentle. The reason for this phenomenon was that in the early stage of electro-osmosis, the amount of discharging water and discharging rate were large. With the extraction of a large amount of water in the soil, the interface resistance of the pile–soil interface in the soil increased rapidly, resulting in a rapid decrease in the current in the soil. In the middle and late stages, the amount of discharging water and discharging rate decreased, the interface resistance of the pile–soil interface increased slowly, and the current in the soil tended to be gentle. In the later stage of the test, the current of the bottom-up electro-osmosis group was larger than that of the top-down electro-osmosis group. The reason was that in the later stage of the bottom-up electro-osmosis group, due to the large interface resistance of the pile–soil interface and the small electro-osmosis current, a part of the water in the soil could not overcome its own gravity to flow upward, so there was more water remaining in the soil, resulting in a larger current in the final soil. After the end of the experiment, the current of the bottom-up electro-osmosis group was 0.504 A, and the percentage of decline was 78.1%; the current of the top-down electro-osmosis group was 0.382 A, and the percentage of decline was 83.4%. The decline was greater in the latter.
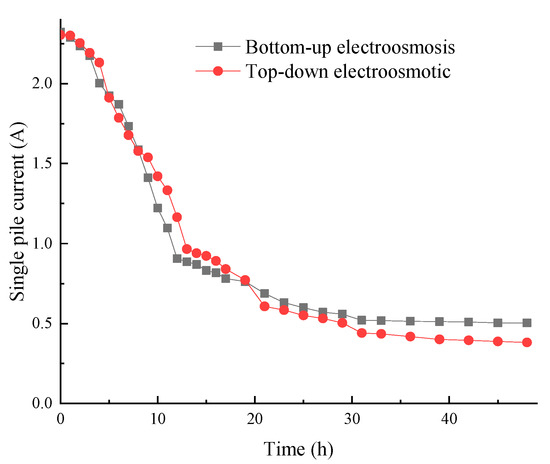
Figure 11.
Variation curve of current with time during electro-osmosis test.
3.4. Soil Surface Settlement
The soil surface settlements are shown in Figure 12. In the two groups of tests, the soil settlement in the early stage of the test was large, and the settlement in the middle and late stages of the test gradually decreased. In the 0–10 h stage of the bottom-up test group, soil settlement was not obvious. The reason was that the water in the soil moved from bottom to top, causing a slight uplift in the soil. When the water content decreased, the soil began to have a more obvious settlement. The test proved that the final settlement of the bottom-up electro-osmosis group was 15.12 mm, while the final settlement of the top-down electro-osmosis group was 21.32 mm, and the settlement was larger, with an increase of 41.00%. The electro-osmosis flow in soft clay was conducive to accelerating the discharge of water in the soil and speeding up the consolidation process of the foundation. In this process, due to the large loss of water in the soil, the foundation settled, causing the pile to settle together with the soil.
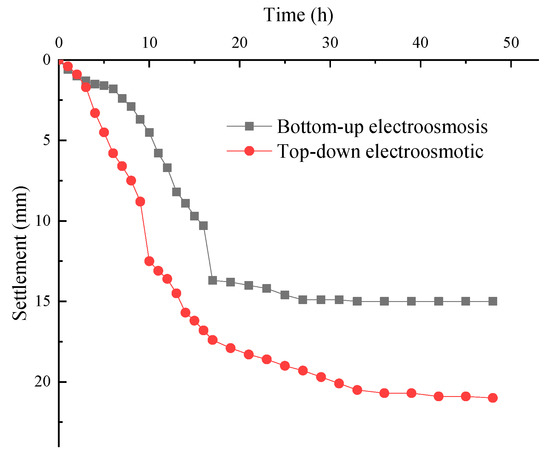
Figure 12.
Variation curve of soil surface settlement with time.
3.5. Change in Soil Pressure at Pile Bottom
The change in earth pressure at the bottom of the pile during the electro-osmosis test was monitored by installing an earth pressure cell at the bottom of the pile. As shown in Figure 13, the soil pressure at the pile bottom of the two groups of tests generally showed a downward trend. The rate of decline was fast in the early stage and slow in the later stage, and gradually slowed down to the same in the later stage. In the early 5–10 h stage, the soil pressure at the bottom of the pile in the top-down electro-osmosis group increased. The reason was that the soil around the pile settled rapidly during the electro-osmosis process, and the soil around the pile produced a downward negative friction resistance to the electro-osmosis pile, which increased the soil pressure at the bottom of the pile. With the continuous extraction of water in the soil, the upper weight decreased, and the soil pressure at the pile bottom decreased. After the test, the soil pressure at the bottom of the pile in the top-down electro-osmosis group was 6.86 kPa, and the soil pressure at the bottom of the pile in the bottom-up electro-osmosis group was 7.57 kPa, indicating that the electro-osmotic drainage in the top-down electro-osmosis group was greater.
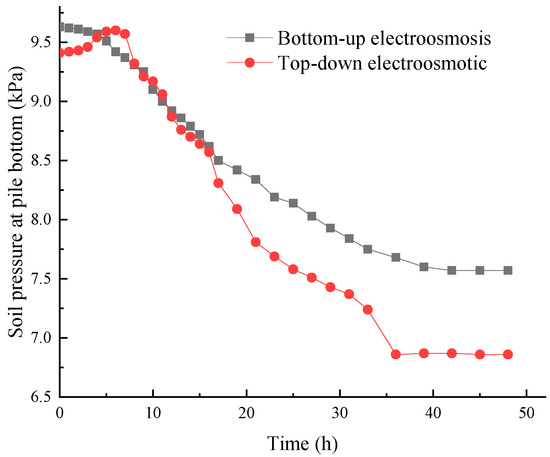
Figure 13.
Variation curve of subsoil pressure of electro-osmosis pile with time.
3.6. Comparative Analysis of Bearing Capacity of Single Pile
After the test of two groups of different electro-osmosis directions, the static load test was carried out on the two groups of electro-osmotic piles and the non-electro-osmosis control group, which was the most important and direct index to test the bearing capacity of soil after electro-osmosis effect. According to the Terzaghi method, the ultimate bearing capacity of the pile was determined. The settlement value was one-tenth of the diameter of the pile, which was 9 mm, and the corresponding load was taken as the ultimate bearing capacity of the pile.
As shown in Figure 14, the ultimate bearing capacity of the pile in the bottom-up electro-osmosis group was 755.6 N, the ultimate bearing capacity of the pile in the top-down electro-osmosis group was 881.8 N, and the ultimate bearing capacity of the control group without electro-osmosis was 240.8 N. In this test, vertical electro-osmotic flow effectively increased the bearing capacity of pile foundations in muddy clay by about 3–4 times. In practical engineering, due to the size and bearing capacity of the pile being often relatively large, vertical electro-osmosis might not be able to improve the bearing capacity of the pile so much, but it was certain that electro-osmosis could significantly improve the bearing capacity of the pile. Moreover, it was found that the electro-osmosis effect from top to bottom was better, and the bearing capacity of the pile was about 16.70% higher than that of the bottom-up electro-osmosis group.
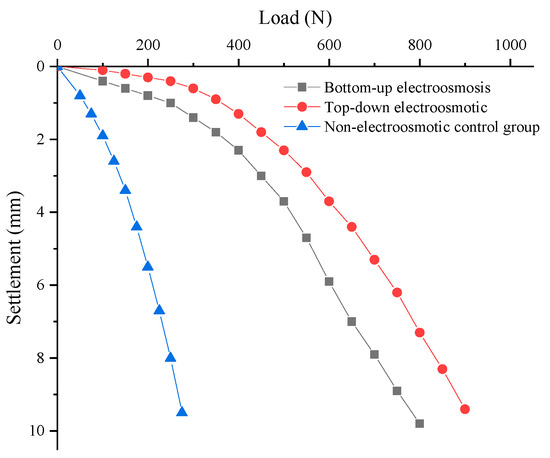
Figure 14.
Load settlement curve of different groups.
3.7. Electro-Osmotic Energy Consumption Coefficient
To compare the change in electro-osmotic energy consumption during the electro-osmosis process, the electro-osmotic energy consumption coefficient C was introduced:
In the equation, C is the energy consumption coefficient(W·h·mL−1), t1 and t2 are energization times of two adjacent monitoring and recording points (h), U is the power supply output voltage (V), I(t) is the current at time t (A), and Q is the volume of drainage (mL) from time t1 to time t2.
As shown in Figure 15, the electro-osmotic energy consumption coefficients of the two groups of experiments were generally high in the early stage, decreased in the middle stage, and increased rapidly in the later stage. The average electro-osmotic energy consumption coefficient of the bottom-up electro-osmosis group was higher, indicating that the electro-osmosis efficiency of the bottom-up electro-osmosis group was lower. The reason was that in the early stage of the test, the water in the soil of the bottom-up electro-osmosis group moved upward, and the time required was longer, resulting in a small amount of water discharging at this stage, and the electro-osmotic energy consumption coefficient was large. In the middle stage, because of the large amount of water discharging, the electro-osmotic energy consumption coefficient was small. In the later stage, as the water content in the soil decreased, the amount of water discharging decreased, and the resistance of the pile–soil interface increased, the current decreased, and the electro-osmotic energy consumption coefficient increased rapidly. The changing trend of the energy consumption coefficient shows that too long an electro-osmosis time will lead to excessive energy consumption by electro-osmosis, so the electro-osmosis time should be reasonably controlled in practical application.
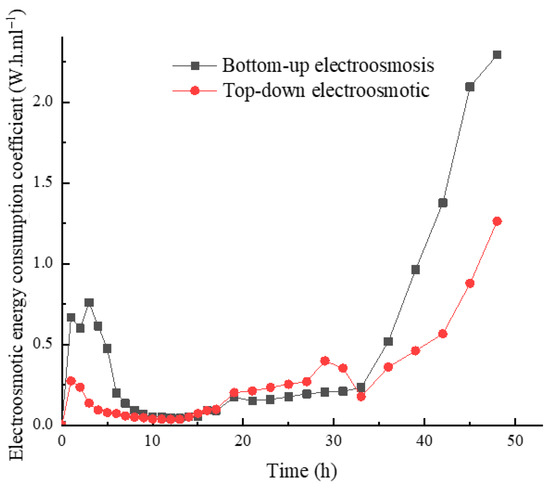
Figure 15.
Curve of electro-osmosis energy consumption coefficient with time.
3.8. Soil Shear Strength and Crack Formation
Direct shear tests were carried out on the soil around the pile before and after electro-osmosis, and the shear strength of the soil before and after the test was compared, as shown in Table 3. It was found that the cohesion of the soil after the two groups of electro-osmosis tests increased by 3.8 and 4.3 times, respectively, and the internal friction angle increased by 3.4 and 4.0 times, respectively. On the one hand, the improvement in soil strength around the pile can improve the side resistance and the bearing capacity of a single pile. On the other hand, it can improve the bearing capacity of foundation soil so as to improve the bearing capacity of composite foundations. This shows that vertical electro-osmosis is feasible and effective in improving the bearing capacity of the pile.

Table 3.
Comparison of soil shear strength before and after electro-osmosis.
During the test, a large number of mesh cracks were generated in the soil around the pile, and the cracks developed around the pile, as shown in Figure 16. Compared to the bottom-up electro-osmosis group, the cracks in the top-down electro-osmosis group appeared earlier, were greater in number, wider in width, and faster in development. The cracks in the bottom-up electro-osmosis group developed from the lower part to the upper part, which was almost invisible in the early stage. Soil shrinkage and cracks are common phenomena in electro-osmosis, especially at the anode. These cracks can be compensated by post grouting.
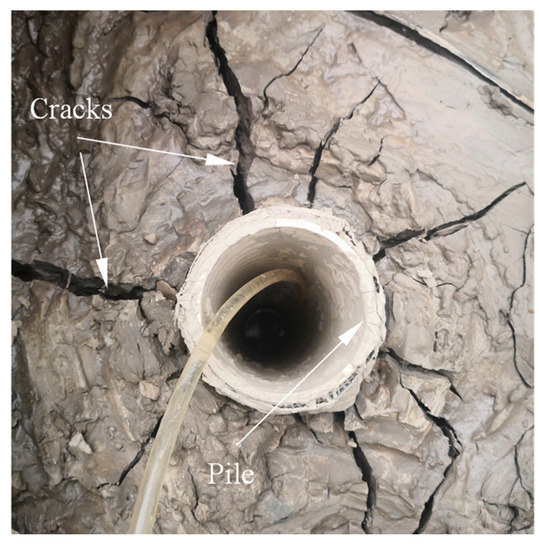
Figure 16.
Cracks in the soil around the pile.
4. Discussion
Milligan [25] applied an electro-osmotic treatment to steel H-section friction piles in clay. The overall effect of the electro-osmosis markedly increased the pile capacity. Further tests have since been carried out over the past 33 years to assess the permanence of the increase in pile capacity. No reduction in the load-bearing capacity of the piles was measured over this period, and the recorded settlement of the bridge foundations was minimal. Butterfield and Johnston [24] found the stress field around a metallic friction pile in clay can be modified quite drastically by applying a modest, direct current electrical potential across the system with the pile as one electrode. The resistance to penetration of a cathodic pile shaft can be reduced by a factor of at least three and, conversely, that of an anodic pile doubled. Once the pile is installed, continued application of electro-osmosis appears to increase its load capacity permanently. The above two examples show that it is possible to improve the bearing capacity of piles in clay by applying electro-osmosis. Although the above two embodiments were successful, this method is rarely used by later researchers. Authors have carried out experiments to improve the bearing capacity of piles by horizontal electro-osmosis, and studied the effect of horizontal electro-osmosis on the bearing capacity of steel pipe piles in detail [18]. Comparing with the results of the literature [18], it was found that when the drainage distance was 45 cm and the electro-osmosis time was 48 h, the time required for the vertical electro-osmosis reinforced pile test was shorter, and the drainage rate was faster. The drainage volume of the top-down electro-osmosis group was 16% higher than that of the horizontal electro-osmosis group. The soil settlement of the vertical electro-osmosis group was larger, and the settlement speed was faster. The bearing capacity of a single pile after electro-osmosis in the top-down electro-osmosis group was 881.8 N. Compared with the test group without electro-osmosis, the relative growth percentage of bearing capacity was 266.2%. The bearing capacity of the pile after horizontal electro-osmosis was 2759 N, which was 300.0% of the non-electro-osmosis test group. It indicated that both vertical electro-osmosis and horizontal electro-osmosis could effectively improve the bearing capacity of the pile, and the increase in bearing capacity by horizontal electro-osmosis was slightly larger. Electro-osmosis has been used worldwide to improve the bearing capacity of piles in soft clay, and, as it turns out, it works. The reason why little research has been performed in this area is that electro-osmosis requires a large amount of electricity, which is uneconomical in most cases. However, with the rapid progress of solar energy technology, the use of solar energy for electro-osmosis can significantly reduce costs. It is worth popularizing the use of electro-osmosis to improve the bearing capacity of piles. It is worth noting that for concrete piles or other non-conductive materials, the electrodes required for horizontal electro-osmosis are difficult to install, and the construction of vertical electro-osmosis is more convenient. Thus, the application of vertical electro-osmosis will be more extensive.
5. Conclusions
- (1)
- A new method to improve the bearing capacity of piles by vertical electro-osmosis with electrodes on the pile was proposed. Through the model test of the bottom-up and top-down electro-osmosis, it was proved that the proposed vertical electro-osmosis method could effectively improve the shear strength of marine soft clay around the pile and the bearing capacity of the pile.
- (2)
- Compared with the bottom-up electro-osmosis test, the electro-osmosis effect of top-down electro-osmosis was better, the consolidation settlement of soil was larger, and the bearing capacity of the pile after electro-osmosis was higher. The bearing capacity of the top-down electro-osmosis group was 16.7% higher than that of the bottom-up electro-osmosis group, and the discharging capacity was 41.69% higher.
- (3)
- Compared with the horizontal electro-osmosis around the pile, the vertical electro-osmosis drainage speed was faster, and the soil consolidation was better. Although the increase in bearing capacity of the pile was slightly smaller, the vertical electro-osmosis method is more recommended because of its convenience of construction in practical engineering.
Author Contributions
Conceptualization, Methodology, Writing-Review & Editing, Funding acquisition, Y.C.; Formal analysis, Investigation, Writing-Original draft preparation, F.Z.; Validation, Visualization, C.Q.; Supervision, Project administration, X.Y.; Resources, Data curation, X.G. All authors have read and agreed to the published version of the manuscript.
Funding
This study was financially supported by the Natural Science Foundation of the Zhejiang Province of China (Grant no. LGF20E080007, Grant no. LY21E080007).
Institutional Review Board Statement
Not applicable.
Informed Consent Statement
Informed consent was obtained from all subjects involved in the study.
Data Availability Statement
No new data were created or analyzed in this study. Data sharing is not applicable to this article.
Conflicts of Interest
The authors declare that they have no known competing financial interests or personal relationships that could have appeared to influence the work reported in this paper.
References
- Song, X.; Du, G.; Wang, Z.; Wang, Z.; Zhu, M.; Bai, W.; Xie, S.; Xia, K.; Zheng, G.; Cheng, X.; et al. Study on Engineering Properties of Deep Marine Soft Clay in Guangdong-Hong Kong-Macao Greater Bay Area. J. Phys. Conf. Ser. 2021, 2021, 012032. [Google Scholar] [CrossRef]
- Li, M.; Chen, Q.; Wen, K.; Nimbalkar, S.; Dai, R. Improved Vacuum Preloading Method Combined with Sand Sandwich Structure for Consolidation of Dredged Clay-Slurry Fill and Original Marine Soft Clay. Int. J. Geomech. 2021, 21, 04021182. [Google Scholar] [CrossRef]
- Sun, Z.; Wu, T.; Yao, K.; Kasu, C.M.; Zhao, X.; Li, Z.; Gong, J. Consolidation of Soft Clay by Cyclic and Progressive Electroosmosis Using Electrokinetic Geosynthetics. Arab. J. Geosci. 2022, 15, 1193. [Google Scholar] [CrossRef]
- Casagrande, L. Stabilization of soils by means of electroosmotic state-of-art. Boston Soc. Civ. Eng. 1983, 69, 255–302. [Google Scholar]
- Casagrande, I.L. Electro-Osmosis in Soils. Géotechnique 1949, 1, 159–177. [Google Scholar] [CrossRef]
- Lo, K.Y.; Inculet, I.I.; Ho, K.S. Electroosmotic strengthening of soft sensitive clays. Can. Geotech. J. 1991, 28, 62–73. [Google Scholar] [CrossRef]
- Su, J.Q.; Wang, Z. The two-dimensional consolidation theory of electro-osmosis. Geotechnique 2003, 53, 759–763. [Google Scholar] [CrossRef]
- Yang, S.; Jianting, F.; Chenchen, Q.; Jiawei, W. Two-dimensional consolidation theory of vacuum preloading combined with electroosmosis considering the distribution of soil voltage. Soil Mech. Found. Eng. 2020, 57, 25–34. [Google Scholar] [CrossRef]
- Shang, J.Q. Electroosmosis enhanced preloading consolidation via vertical drains. Can. Geotechical J. 1998, 35, 491–499. [Google Scholar] [CrossRef]
- Wang, L.J.; Wang, Y.M.; Liu, S.H.; Huang, P.H. Analytical Investigation of Electroosmotic Consolidation in Unsaturated Soils Considering the Coupling Effect and a Nonuniform Initial Water Content. Int. J. Geomech. 2021, 21, 06021018. [Google Scholar] [CrossRef]
- Colin, C.J.F.P.; Lamont-Black, J.; Glendinning, S. Electrokinetic geosynthetics in hydraulic applications. Geotext. Geomembr. 2010, 29, 381–390. [Google Scholar] [CrossRef]
- Malekzadeh, M.; Lovisa, J.; Sivakugan, N. An Overview of Electrokinetic Consolidation of Soils. Geotech. Geol. Eng. 2016, 34, 759–776. [Google Scholar] [CrossRef]
- Estabragh, A.R.; Naseh, M.; Javadi, A.A. Improvement of clay soil by electro-osmosis technique. Appl. Clay Sci. 2014, 95, 32–36. [Google Scholar] [CrossRef]
- Zhang, L.; Hu, L.M. Numerical simulation of electro-osmotic consolidation considering tempo-spatial variation of soil pH and soil parameters. Comput. Geotech. 2022, 147, 104802. [Google Scholar] [CrossRef]
- Bessaim, M.M.; Missoum, H.; Bendani, K.; Bekkouche, M.S.; Laredj, N. Removal of Hazardous Cationic Salt Pollutants During Electrochemical Treatment from Contaminated Mixed Heterogeneous Saline Soil. Arab. J. Sci. Eng. 2019, 44, 4783–4794. [Google Scholar] [CrossRef]
- Wu, H.; Qi, W.; Hu, L.; Wen, Q. Electro-osmotic consolidation of soil with variable compressibility, hydraulic conductivity and electro-osmosis conductivity. Comput. Geotech. 2017, 85, 126–138. [Google Scholar] [CrossRef]
- Wu, H.; Hu, L.; Qi, W.; Wen, Q. Analytical Solution for Electroosmotic Consolidation Considering Nonlinear Variation of Soil Parameters. Int. J. Geomech. 2016, 17, 06016032. [Google Scholar] [CrossRef]
- Wang, L.Z.; Qi, C.G.; Zheng, J.H.; Cui, Y.L.; Shan, Y.L.; Zheng, R.Y. Model test of electroosmosis composite foundation. J. Rock Mech. Eng. 2020, 39, 2557–2569. [Google Scholar] [CrossRef]
- Nizar, K.; Clarke, B.G. Electro-osmotic piles. Proc. Inst. Civ. Eng. Ground Improv. 2014, 167, 135–144. [Google Scholar] [CrossRef]
- Wu, H.; Hu, L.M.; Wen, Q.B. Numerical Assessment of Equivalent Radius for Electrokinetic Geosynthetics Electrodes during Electroosmotic Consolidation. Int. J. Geomech. 2018, 18, 04018024. [Google Scholar] [CrossRef]
- Karunaratne, G.P. Prefabricated and electrical vertical drains for consolidation of soft clay. Geotext. Geomembr. 2011, 29, 391–401. [Google Scholar] [CrossRef]
- Sun, Z.; Yao, K.; Yang, C.; Liang, M. Improvement of soft clay by vacuum preloading incorporated with electroosmosis using electric vertical drains. Mar. Georesources Geotechnol. 2021, 39, 1339–1349. [Google Scholar] [CrossRef]
- Hu, Z. Experimental study on flocculation-Vacuum-Electroosmosis method for strengthening soft clay foundation in coastal area. IOP Conf. Ser. Earth Environ. Sci. 2021, 643, 012167. [Google Scholar] [CrossRef]
- Butterfield, R.; Johnston, I.W. The influence of electro-osmosis on metallic piles in clay. Géotechnique 1980, 30, 17–37. [Google Scholar] [CrossRef]
- Milligan, V. First application of electro-osmosis to improve thefriction pile capacity—Three decades later. Proc. Inst. Civ. Eng. Geotech. Eng. 1995, 113, 112–116. [Google Scholar] [CrossRef]
- Soderman, L.G.; Milligan, V. Capacity of friction piles in varved clay increased by electro-osmosis. In Proceedings of the 5th International Conference on Soil Mechanics and Foundation Engineering, Paris, France, 17–22 July 1961; Volume 2, pp. 143–147. [Google Scholar]
- Abdel-Meguid, M.; Einaggar, M.H.; Shang, J.Q. Axial response of piles in electrically treated clay. Can. Geotech. J. 1999, 36, 418–429. [Google Scholar] [CrossRef]
- Li, X.; Shu, J.; Wang, J.; Fu, H.; Wang, P.; Hu, X. Influence of Dynamic Loading Activation Time on Electro-osmotic Consolidation of Soft clay. KSCE J. Civ. Eng. 2019, 23, 4687–4695. [Google Scholar] [CrossRef]
- Wang, J.; Fu, H.; Liu, F.; Cai, Y.; Zhou, J. Vacuum preloading and electro-osmosis consolidation of dredged slurry pre-treated with flocculants. Eng. Geol. 2018, 246, 123–130. [Google Scholar] [CrossRef]
- Xu, H.; Ding, T.G. Influence of Vacuum Pressure, pH, and Potential Gradient on the Vacuum Electro-osmosis Dewatering of Drinking Water Treatment Sludge. Dry. Technol. 2016, 34, 1107–1117. [Google Scholar] [CrossRef]
Disclaimer/Publisher’s Note: The statements, opinions and data contained in all publications are solely those of the individual author(s) and contributor(s) and not of MDPI and/or the editor(s). MDPI and/or the editor(s) disclaim responsibility for any injury to people or property resulting from any ideas, methods, instructions or products referred to in the content. |
© 2023 by the authors. Licensee MDPI, Basel, Switzerland. This article is an open access article distributed under the terms and conditions of the Creative Commons Attribution (CC BY) license (https://creativecommons.org/licenses/by/4.0/).