
Photogrammetry, from the Land to the Sea and Beyond: A Unifying Approach to Study Terrestrial and Marine Environments

 ,
,  ,
,  ,
,  ,
,  , , and
Abstract
1. Introduction
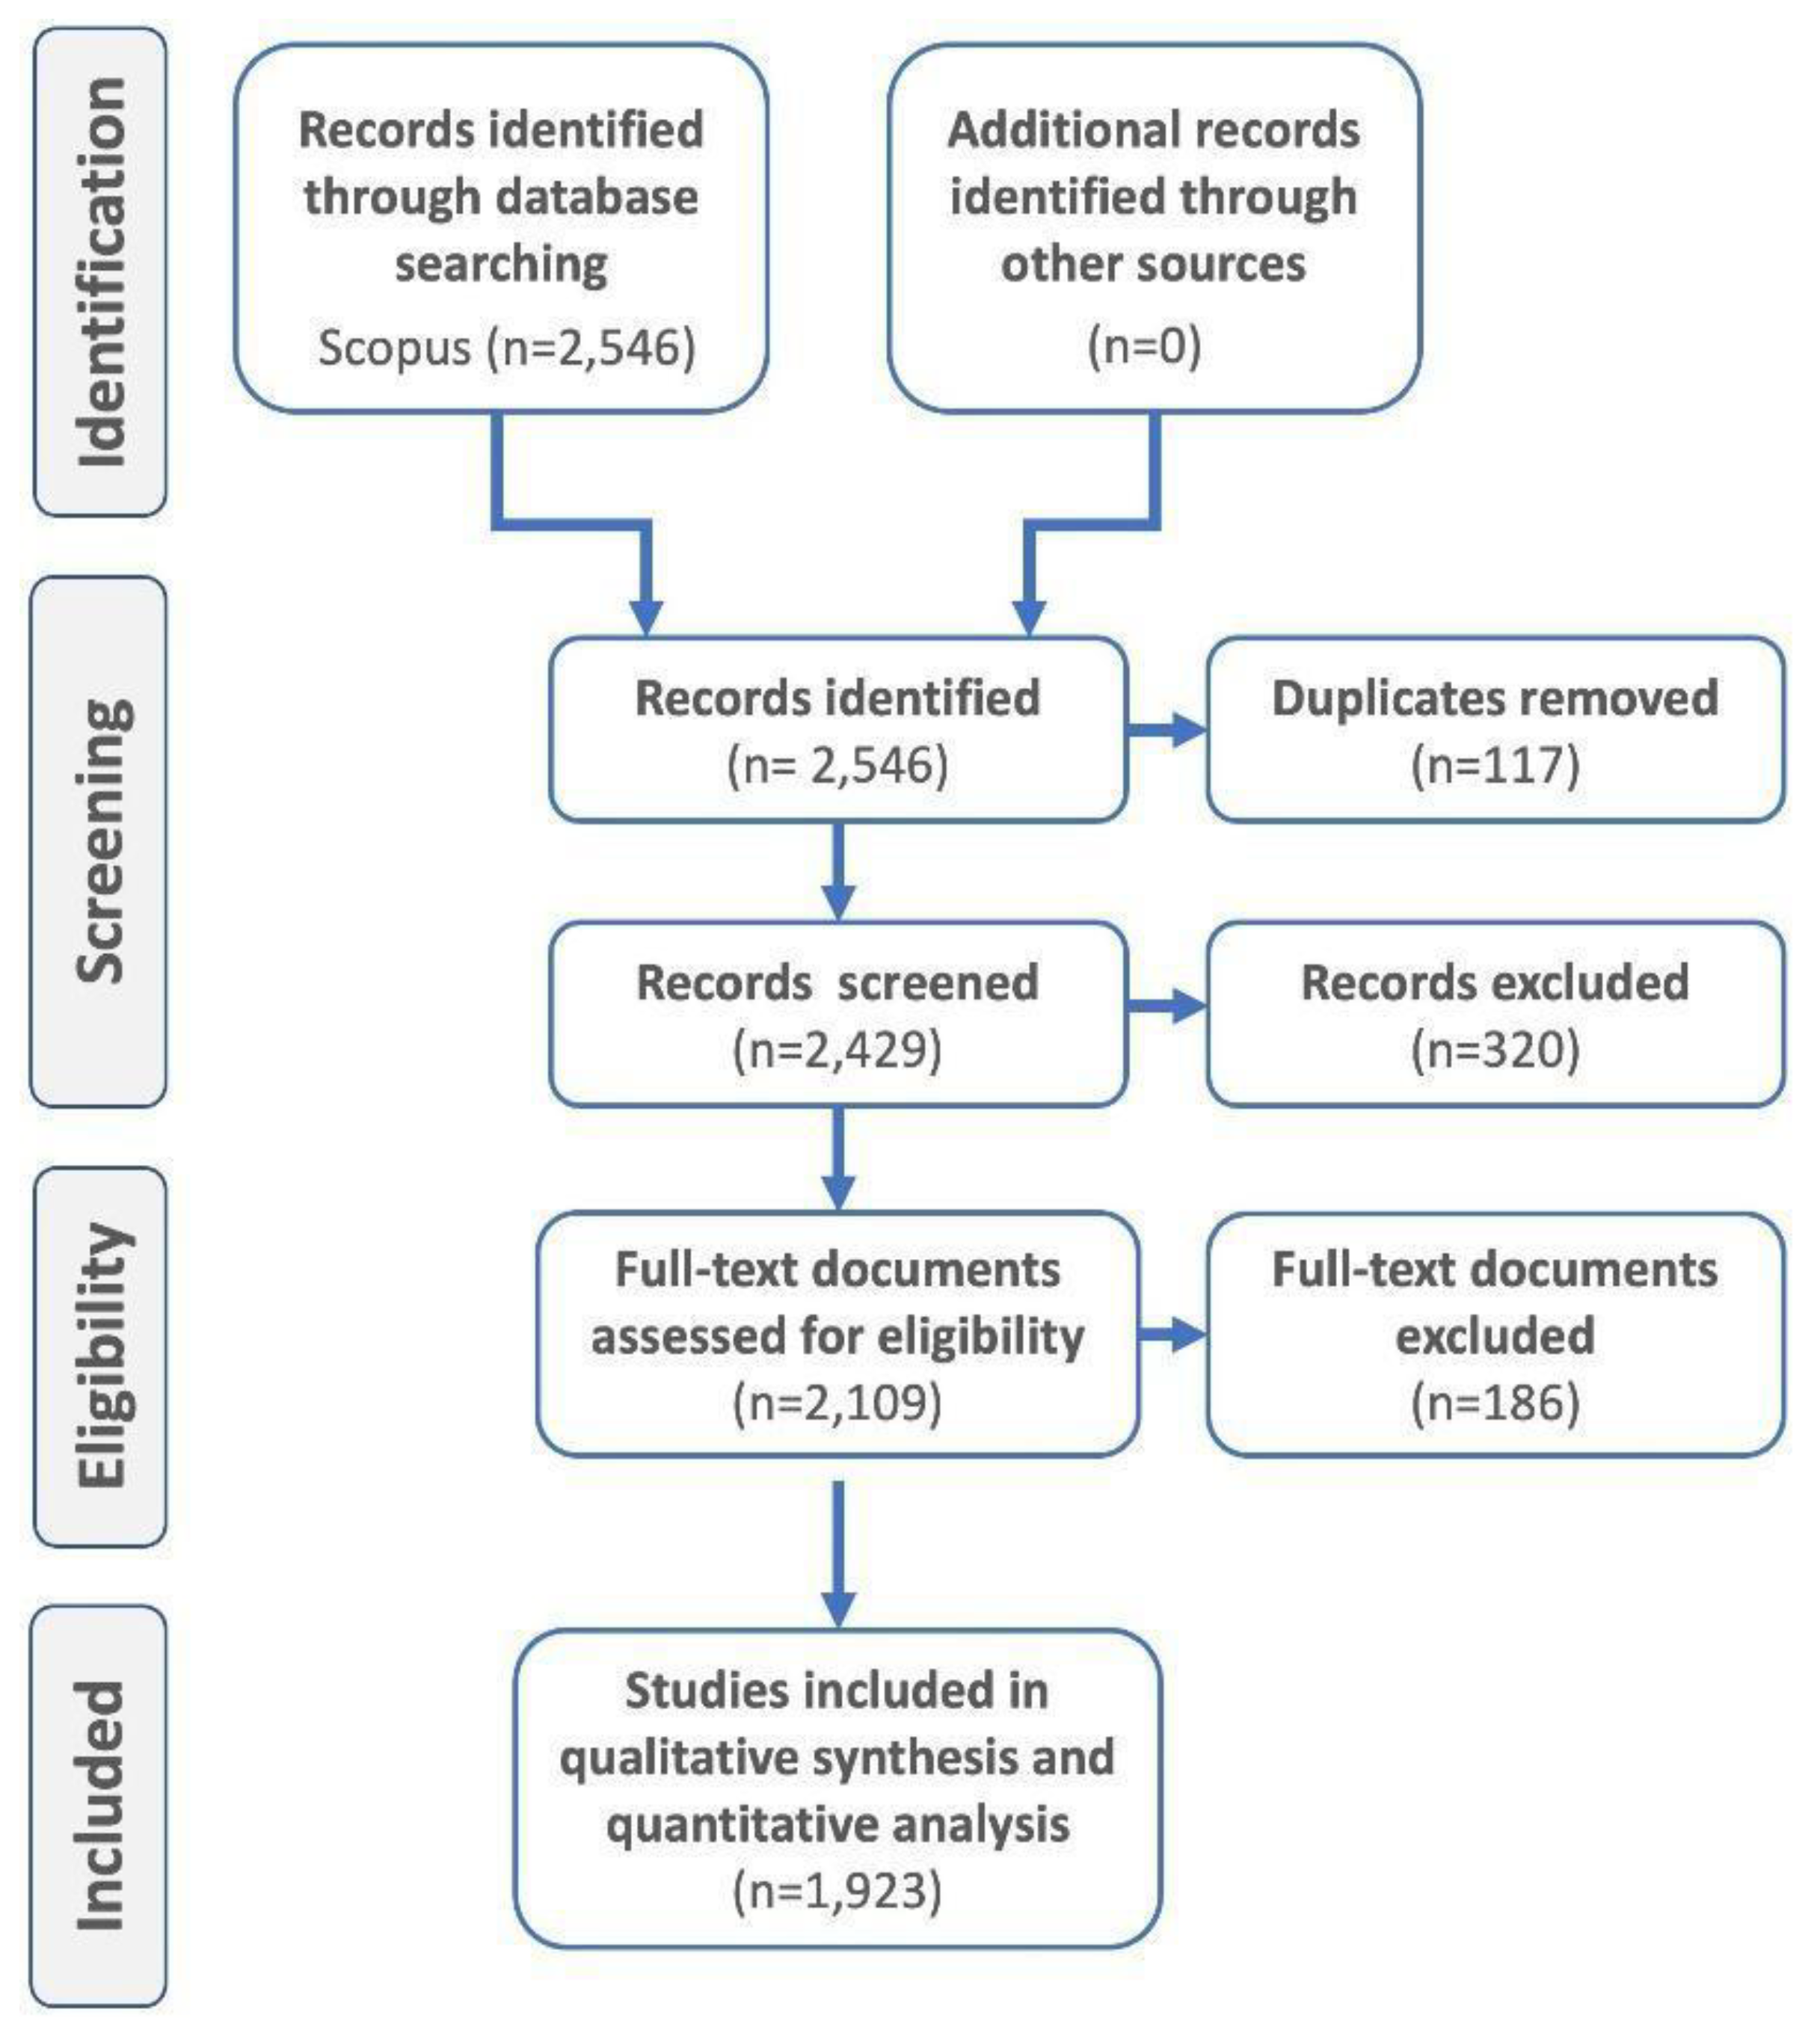
2. Materials and Methods
3. Results and Discussion
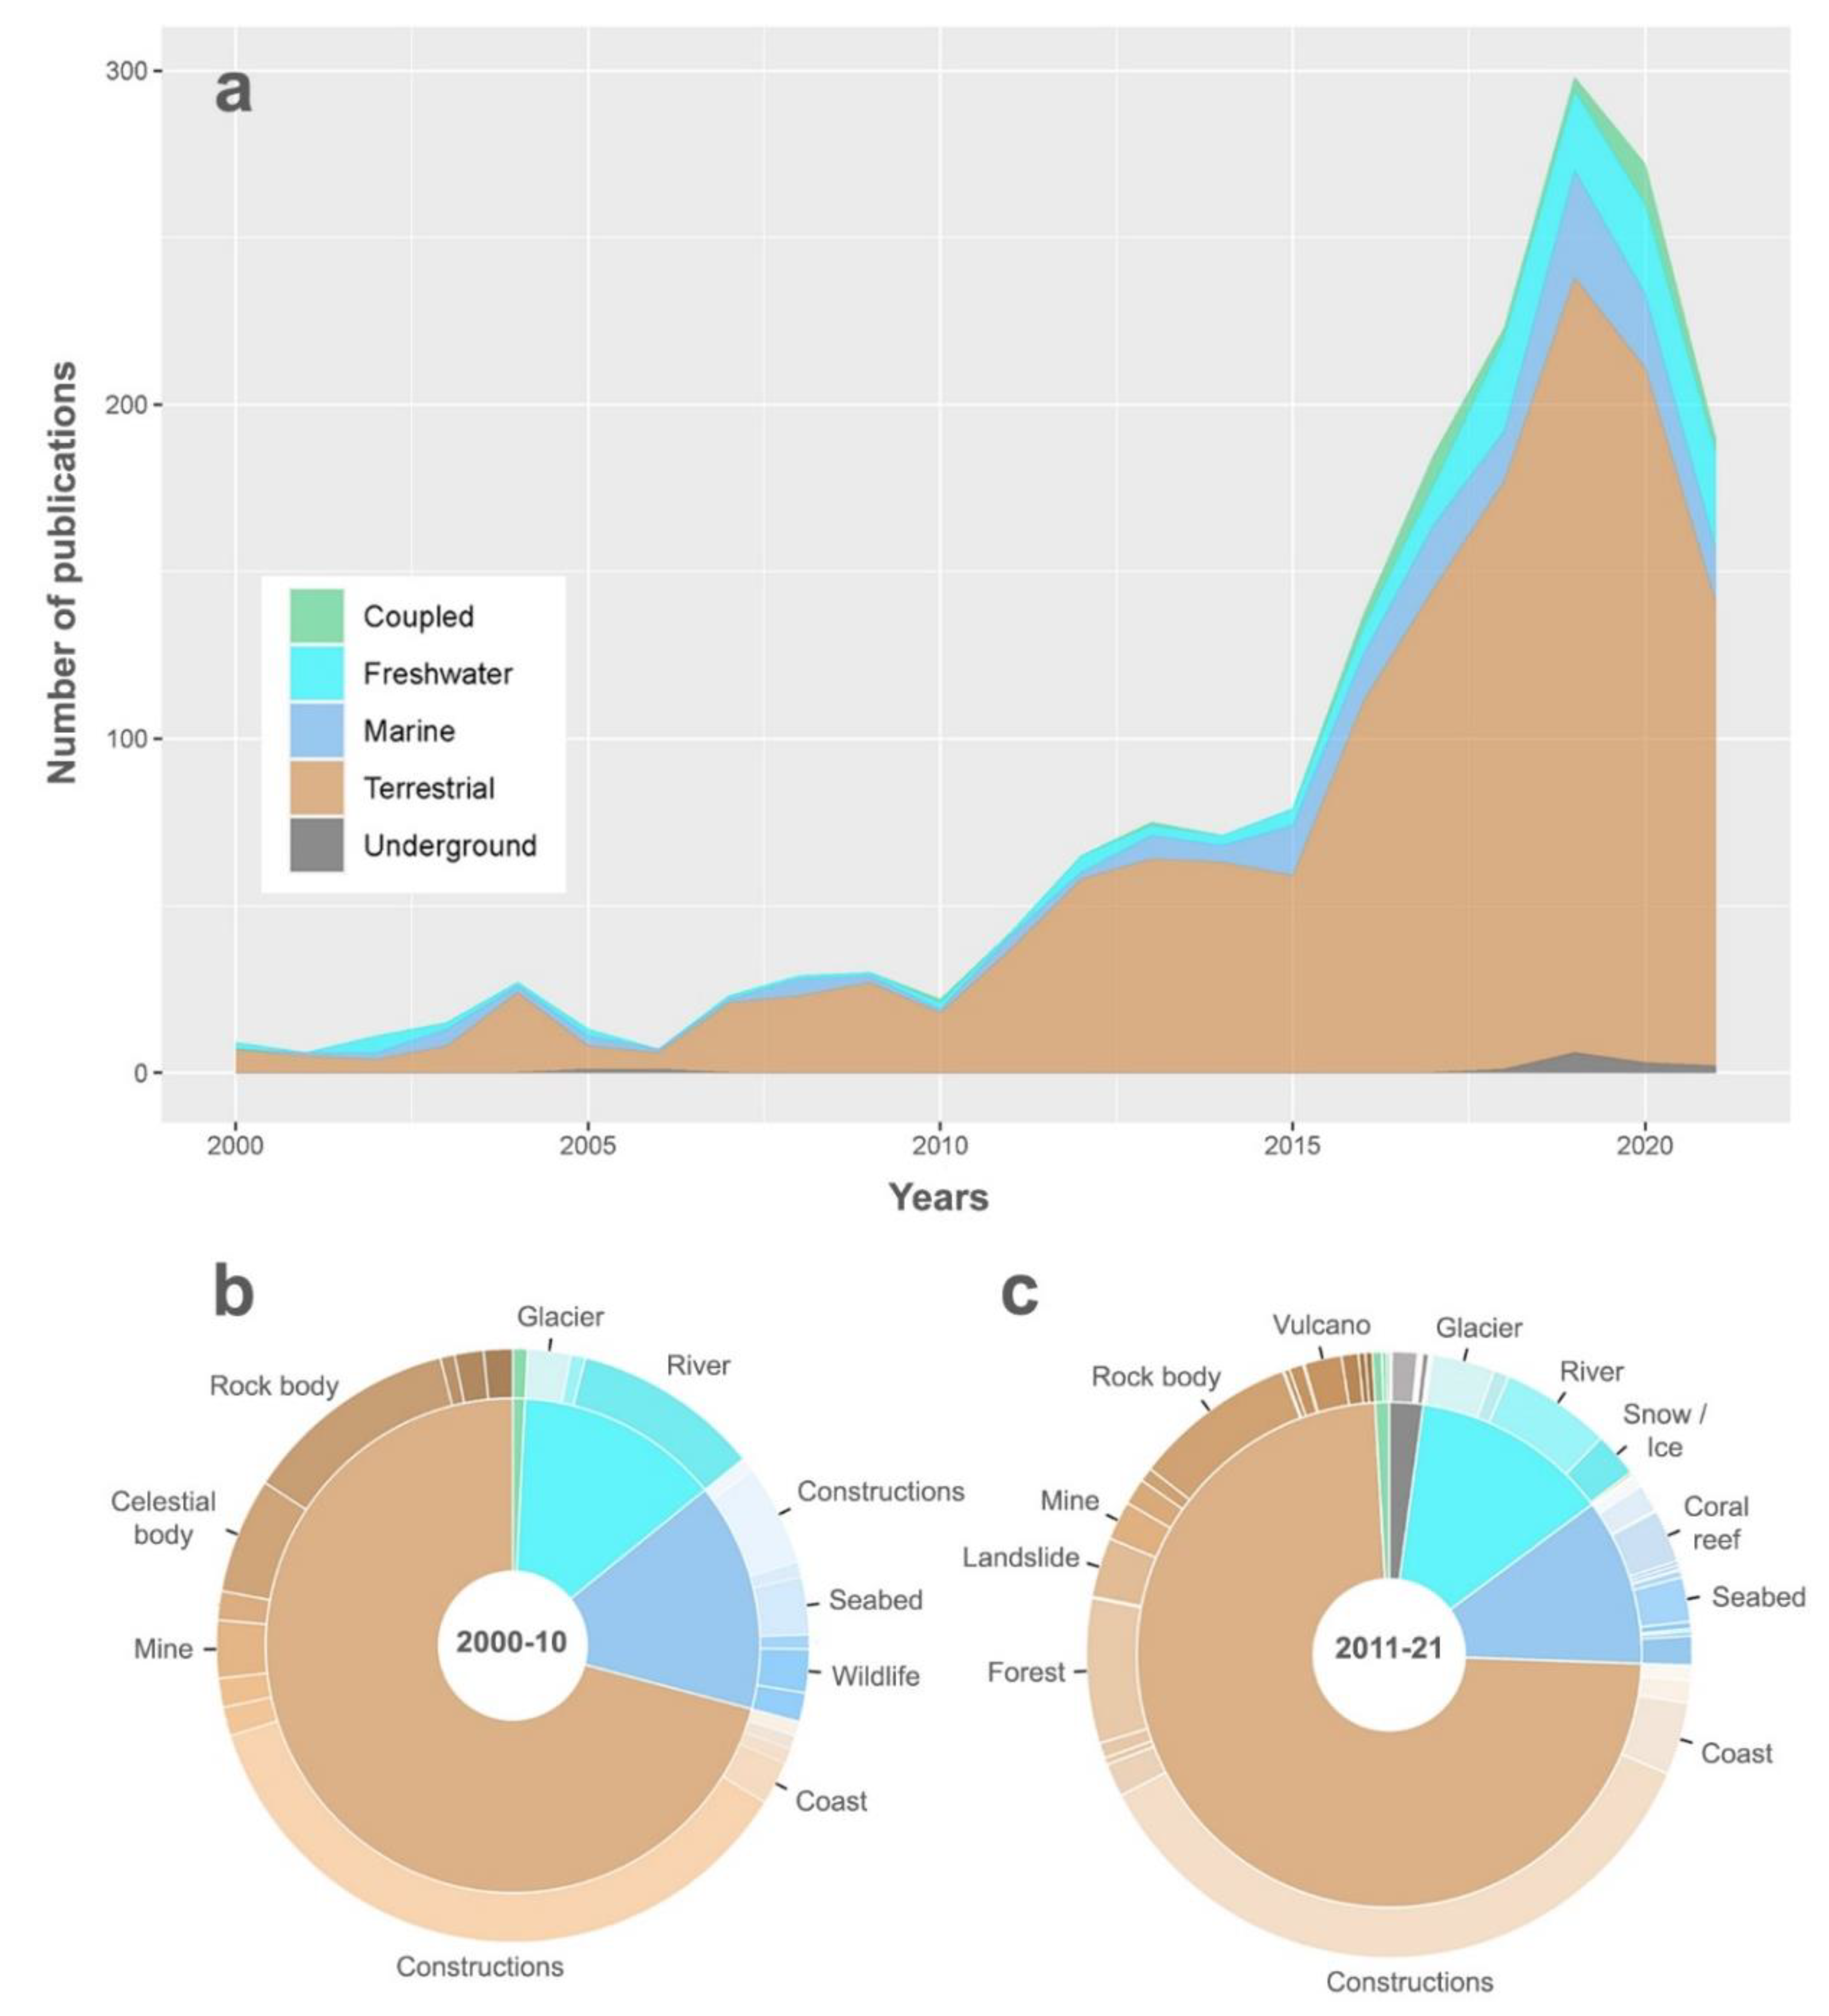
3.1. Photogrammetric Surveys through Time
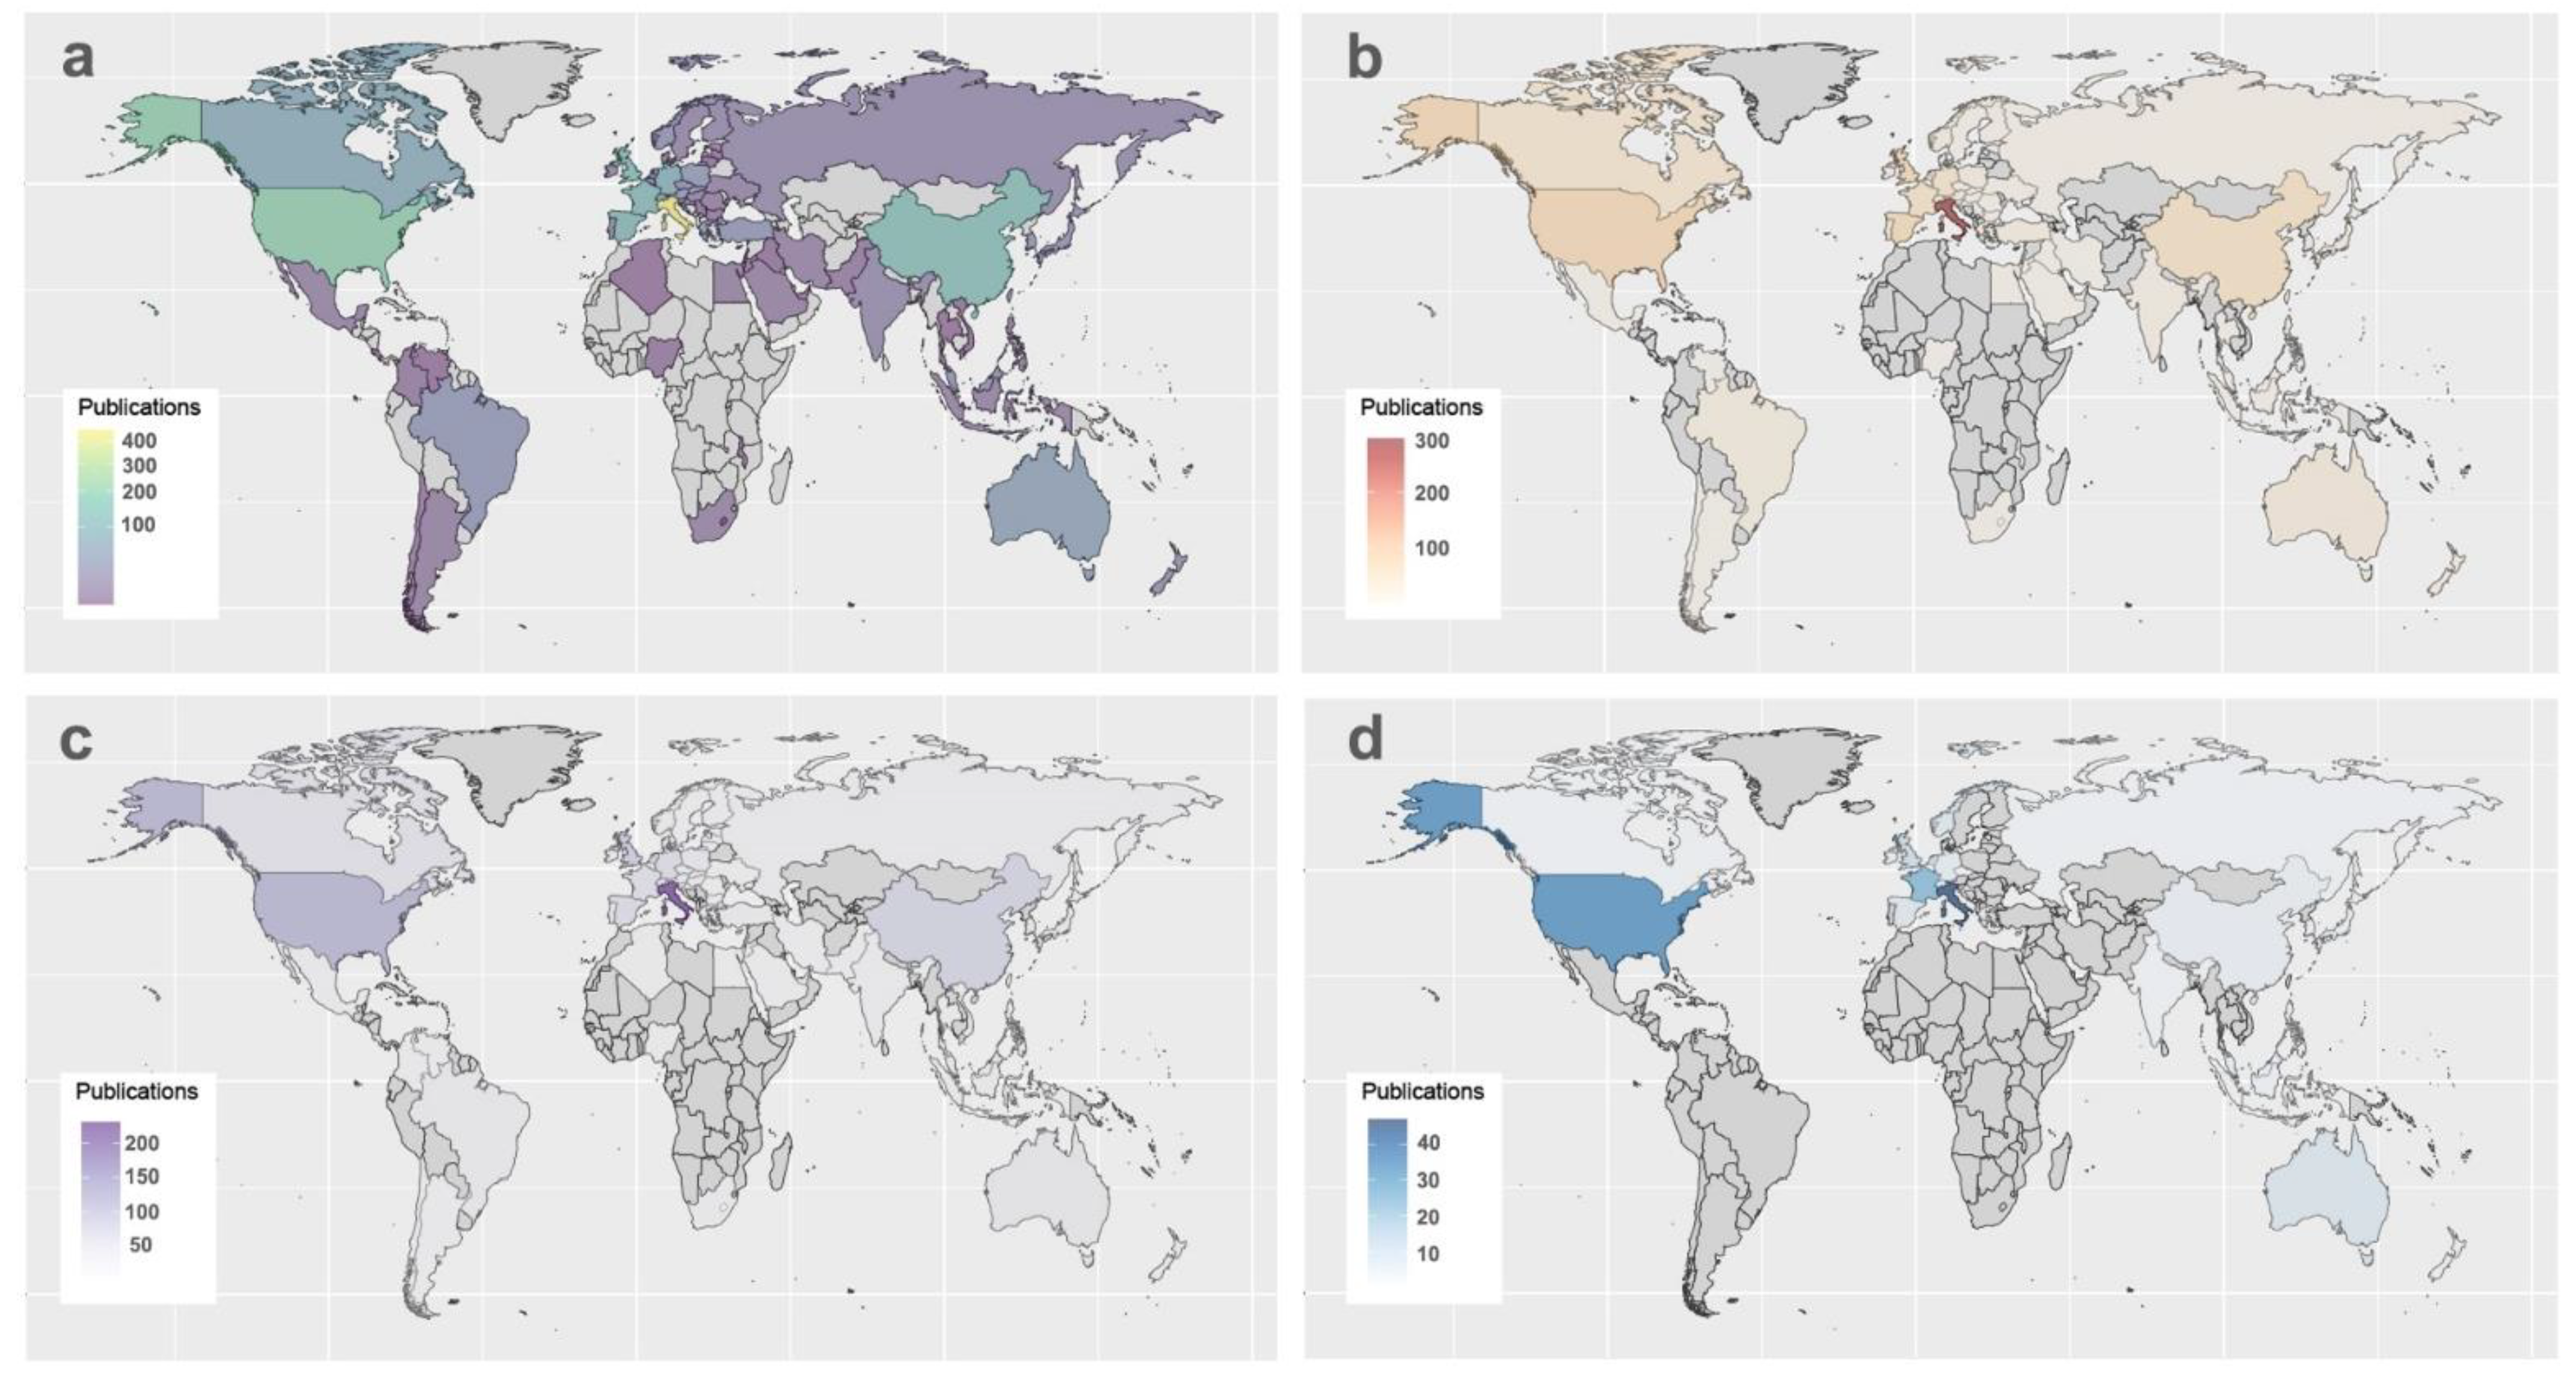
3.2. Worldwide Application of Photogrammetry
3.3. Photogrammetric Surveys among Disciplines
3.4. Environments Surveyed by Photogrammetry
3.5. Bathymetric Distribution of Underwater Surveys
3.6. The Revolution of Unmanned Vehicles
3.7. Coupling of Photogrammetry with Other Techniques
4. Conclusions and Future Perspectives
Supplementary Materials
Author Contributions
Funding
Institutional Review Board Statement
Informed Consent Statement
Data Availability Statement
Conflicts of Interest
References
- Burns, J.H.R.; Delparte, D.; Gates, R.D.; Takabayashi, M. Utilizing underwater three-dimensional modeling to enhance ecological and biological studies of coral reefs. Int. Arch. Photogramm. Remote Sens. Spat. Inf. Sci. 2015, XL-5/W5, 61–66. [Google Scholar] [CrossRef]
- Monfort, T.; Cheminée, A.; Bianchimani, O.; Drap, P.; Puzenat, A.; Thibaut, T. The Three-Dimensional Structure of Mediterranean Shallow Rocky Reefs: Use of Photogrammetry-Based Descriptors to Assess Its Influence on Associated Teleost Assemblages. Front. Mar. Sci. 2021, 8, 639309. [Google Scholar] [CrossRef]
- McGlone, C.; Mikhail, E.M.; Bethel, J.S.; Mullen, R. Manual of Photogrammetry, 5th ed.; American Society for Photogrammetry and Remote Sensing: Bethesda, MD, USA, 2004. [Google Scholar]
- Kovalenko, K.E.; Thomaz, S.M.; Warfe, D.M. Habitat complexity: Approaches and future directions. Hydrobiologia 2012, 685, 1–17. [Google Scholar] [CrossRef]
- Ferrari, R.; McKinnon, D.; He, H.; Smith, R.N.; Corke, P.; González-Rivero, M.; Mumby, P.J.; Upcroft, B. Quantifying Multiscale Habitat Structural Complexity: A Cost-Effective Framework for Underwater 3D Modelling. Remote Sens. 2016, 8, 113. [Google Scholar] [CrossRef]
- Polidori, L. On Laussedat’s contribution to the emergence of photogrammetry. ISPRS-Int. Arch. Photogramm. Remote Sens. Spat. Inf. Sci. 2020, XLIII-B2-2020, 893–899. [Google Scholar] [CrossRef]
- Konecny, G. The International Society for Photogrammetry and Remote Sensing—75 Years Old, or 75 Years Young. Photogramm. Photogramm. Eng. Remote Sens. 1985, 51, 919–933. [Google Scholar]
- Gosh, S. History of Photogrammetry; Laval University: Quebec City, QC, Canada, 1981. [Google Scholar]
- Lowe, D.G. Object recognition from local scale-invariant features. In Proceedings of the Seventh IEEE International Conference on Computer Vision, Kerkyra, Greece, 20–27 September 1999; Volume 2, pp. 1150–1157. [Google Scholar] [CrossRef]
- Ghosh, S.K. Fundamentals of Computational Photogrammetry; Concept Publishing Company: Delhi, India, 2005. [Google Scholar]
- Paris, L. Fotogrammetria e/o fotomodellazione. Geom. Desc. Rapp. Dig. 2012, 55–62. [Google Scholar]
- Westoby, M.; Brasington, J.; Glasser, N.F.; Hambrey, M.J.; Reynolds, J.M. ‘Structure-from-Motion’ photogrammetry: A low-cost, effective tool for geoscience applications. Geomorphology 2012, 179, 300–314. [Google Scholar] [CrossRef]
- Nyimbili, P.H.; Demirel, H.; Seker, D.Z.; Erden, T. Structure from Motion (SfM)—Approaches & applications. In Proceedings of the International Scientific Conference on Applied Sciences, Antalya, Turkey, 27–30 September 2016. [Google Scholar]
- Remondino, F.; Rizzi, A.; Girardi, S.; Petti, F.M.; Avanzini, M. 3D Ichnology-recovering digital 3D models of dinosaur footprints. Photogramm. Rec. 2010, 25, 266–282. [Google Scholar] [CrossRef]
- Bonali, F.L.; Tibaldi, A.; Corti, N.; Fallati, L.; Russo, E. Reconstruction of Late Pleistocene-Holocene Deformation through Massive Data Collection at Krafla Rift (NE Iceland) Owing to Drone-Based Structure-from-Motion Photogrammetry. Appl. Sci. 2020, 10, 6759. [Google Scholar] [CrossRef]
- Li, X.; Xiong, B.; Yuan, Z.; He, K.; Liu, X.; Liu, Z.; Shen, Z. Evaluating the Potentiality of Using Control-free Images from a Mini Unmanned Aerial Vehicle (UAV) and Structure-from-Motion (SfM) Photogrammetry to Measure Paleoseismic Offsets. Int. J. Remote Sens. 2021, 42, 2417–2439. [Google Scholar] [CrossRef]
- Haneberg, W.C. Using close range terrestrial digital photogrammetry for 3-D rock slope modeling and discontinuity mapping in the United States. Bull. Eng. Geol. Environ. 2008, 67, 457–469. [Google Scholar] [CrossRef]
- Kolzenburg, S.; Favalli, M.; Fornaciai, A.; Isola, I.; Harris, A.J.L.; Nannipieri, L.; Giordano, D. Rapid Updating and Improvement of Airborne LIDAR DEMs Through Ground-Based SfM 3-D Modeling of Volcanic Features. IEEE Trans. Geosci. Remote Sens. 2016, 54, 6687–6699. [Google Scholar] [CrossRef]
- Caravaca, G.; Le Mouélic, S.; Mangold, N.; L’Haridon, J.; Le Deit, L.; Massé, M. 3D digital outcrop model reconstruction of the Kimberley outcrop (Gale crater, Mars) and its integration into Virtual Reality for simulated geological analysis. Planet. Space Sci. 2020, 182, 104808. [Google Scholar] [CrossRef]
- Carnevali, L.; Ippoliti, E.; Lanfranchi, F.; Menconero, S.; Russo, M.; Russo, V. Close-range mini-UAVs photogrammetry for architecture survey. Int. Arch. Photogramm. Remote Sens. Spat. Inf. Sci. 2018, XLII-2, 217–224. [Google Scholar] [CrossRef]
- Picon-Cabrera, I.; Garcia-Gago, J.M.; Sanchez-Aparicio, L.J.; Rodriguez-Gonzalvez, P.; Gonzalez-Aguilera, D. On the Use of Historical Flights for the Urban Growth Analysis of Cities Through Time: The Case Study of Avila (Spain). Sustainability 2020, 12, 4673. [Google Scholar] [CrossRef]
- Martinez, J.G.; Albeaino, G.; Gheisari, M.; Volkmann, W.; Alarcón, L.F. UAS Point Cloud Accuracy Assessment Using Structure from Motion–Based Photogrammetry and PPK Georeferencing Technique for Building Surveying Applications. J. Comput. Civ. Eng. 2021, 35, 05020004. [Google Scholar] [CrossRef]
- Rogers, J.D. Hoover dam: Evolution of the dam’s design. In Hoover Dam: 75th Anniversary History Symposium, Proceedings of the Hoover Dam 75th Anniversary History Symposium, Las Vegas, NV, USA, 21–22 October 2010; Las Vegas, NV, USA, 21–22 October 2010, American Society of Civil Engineers: Reston, VA, USA, 2012; pp. 85–123. [Google Scholar] [CrossRef]
- Hackl, J.; Adey, B.T.; Woźniak, M.; Schümperlin, O. Use of Unmanned Aerial Vehicle Photogrammetry to Obtain Topographical Information to Improve Bridge Risk Assessment. J. Infrastruct. Syst. 2018, 24, 04017041. [Google Scholar] [CrossRef]
- Balsa-Barreiro, J.; Fritsch, D. Generation of 3D/4D photorealistic building models. The testbed area for 4D Cultural Heritage World Project: The historical center of Calw (Germany). In Advances in Visual Computing, Proceedings of the 11th International Symposium, ISVC 2015, Las Vegas, NV, USA, 14–16 December 2015; Springer International Publishing: Cham, Switzerland, 2015; Volume 11, pp. 361–372. [Google Scholar] [CrossRef]
- Balsa-Barreiro, J.; Fritsch, D. Generation of visually aesthetic and detailed 3D models of historical cities by using laser scanning and digital photogrammetry. Digit. Appl. Archaeol. Cult. Heritage 2018, 8, 57–64. [Google Scholar] [CrossRef]
- Owda, A.; Balsa-Barreiro, J.; Fritsch, D. Methodology for digital preservation of the cultural and patrimonial heritage: Generation of a 3D model of the Church St. Peter and Paul (Calw, Germany) by using laser scanning and digital photogrammetry. Sens. Rev. 2018, 38, 282–288. [Google Scholar] [CrossRef]
- Pierdicca, R.; Intrigila, C.; Piccinini, F.; Malinverni, E.S.; Giannetti, I.; Caruso, G. Multidisciplinary Approach for the Analysis of Structural Heritage at Risk: The Case Study of Stylite Tower at Umm ar-Rasas (Jordan). Int. J. Arch. Heritage 2021, 1–25. [Google Scholar] [CrossRef]
- Laba, M.; Tsai, F.; Ogurcak, D.; Smith, S.; Richmond, M.E. Field Determination of Optimal Dates for the Discrimination of Invasive Wetland Plant Species Using Derivative Spectral Analysis. Photogramm. Eng. Remote Sens. 2005, 71, 603–611. [Google Scholar] [CrossRef]
- Urbina-Barreto, I.; Garnier, R.; Elise, S.; Pinel, R.; Dumas, P.; Mahamadaly, V.; Facon, M.; Bureau, S.; Peignon, C.; Quod, J.-P.; et al. Which Method for Which Purpose? A Comparison of Line Intercept Transect and Underwater Photogrammetry Methods for Coral Reef Surveys. Front. Mar. Sci. 2021, 8, 636902. [Google Scholar] [CrossRef]
- Hagan, T. A case for terrestrial photogrammetry in deep-mine rock structure studies. Int. J. Rock Mech. Min. Sci. Géoméch. Abstr. 1980, 17, 191–198. [Google Scholar] [CrossRef]
- Kappenberger, G.; Steinegger, U.; Braun, L.N.; Kostka, R. Recent changes in glacier tongues in the Langtang Khola basin, Nepal, determined by terrestrial photogrammetry. IAHS Publ.-Publ. Int. Assoc. Hydrol. Sci. 1993, 218, 95–102. [Google Scholar]
- Rodríguez, M.S.C.; Maidagan, D.G.; González-Aguilera, D.; Nieto, L.M.; Gómez-Lahoz, J.; Herrero, J.S. Nouveaux regards sur la Grotte de La Peña (San Román de Candamo, Asturies, Espagne). L’anthropologie 2011, 115, 384–424. [Google Scholar] [CrossRef]
- Alessandri, L.; Baiocchi, V.; Del Pizzo, S.; Di Ciaccio, F.; Onori, M.; Rolfo, M.F.; Troisi, S. Three-dimensional survey of Guattari cave with traditional and mobile phone cameras. ISPRS-Int. Arch. Photogramm. Remote Sens. Spat. Inf. Sci. 2019, XLII-2/W11, 37–41. [Google Scholar] [CrossRef]
- Pizarro, O.; Eustice, R.; Singh, H. Large area 3D reconstructions from underwater surveys. In Oceans’ 04 MTS/IEEE Techno-Ocean’04 (IEEE Cat. No. 04CH37600); IEEE: New York, NY, USA, 2004; Volume 2, pp. 678–687. [Google Scholar] [CrossRef]
- Palma, M.; Casado, M.R.; Pantaleo, U.; Pavoni, G.; Pica, D.; Cerrano, C. SfM-Based Method to Assess Gorgonian Forests (Paramuricea clavata (Cnidaria, Octocorallia)). Remote Sens. 2018, 10, 1154. [Google Scholar] [CrossRef]
- Liu, Z.; Peng, M.; Di, K. A continuative variable resolution digital elevation model for ground-based photogrammetry. Comput. Geosci. 2014, 62, 71–79. [Google Scholar] [CrossRef]
- Rebikoff, D. History of underwater photography. Photogramm. Eng. 1967, 33, 897–904. [Google Scholar]
- Capra, A.; Castagnetti, C.; Dubbini, M.; Gruen, A.; Guo, T.; Mancini, F.T.; Neyer, F.; Rossi, P.; Troyer, M. High Accuracy Underwater Photogrammetric Surveying. In Proceedings of the 3rd IMEKO International Conference on Metrology for Archeology and Cultural Heritage, Lecce, Italy, 23–25 October 2017. [Google Scholar]
- Martínez, A. “A souvenir of undersea landscapes:” underwater photography and the limits of photographic visibility, 1890–1910. História Ciências Saúde-Manguinhos 2014, 21, 1029–1047. [Google Scholar] [CrossRef] [PubMed]
- Welsh, N.; Leadbetter, I.K.; Cheffins, O.W.; Hall, H.M. Photogrammetric procedures for a North Sea oil rig leg repair. Int. Arch. Photogramm. 1980, 23, 474–483. [Google Scholar]
- Lucarelli, A.; Brandolini, P.; Corradi, N.; De Laurentiis, L.; Federici, B.; Ferrando, I.; Lanzone, A.; Sguerso, D. Potentialities of integrated 3D surveys applied to maritime infrastructures and to the study of morphological/sedimentary dynamics of the seabed. In Proceedings of the IMEKO TC-19 International Workshop on Metrology for the Sea, Genoa, Italy, 3–5 October 2019; pp. 3–5. [Google Scholar]
- Barrile, V.; Pucinotti, R.; Bilotta, G. Geomatics and Virtual Reality Techniques for Underwater Heritage. In INTERNATIONAL SYMPOSIUM: New Metropolitan Perspectives; Springer: Cham, Switzerland, 2020; pp. 1598–1607. [Google Scholar] [CrossRef]
- Cahyono, A.B.; Wibisono, A.C.; Saptarini, D.; Permadi, R.I.; Budisusanto, Y.; Hidayat, H. Underwater Photogrammetry Application for Coral Reef Mapping and Monitoring. Int. J. Adv. Sci. Eng. Inf. Technol. 2020, 10, 293–297. [Google Scholar] [CrossRef]
- Bemis, S.P.; Micklethwaite, S.; Turner, D.; James, M.R.; Akciz, S.; Thiele, S.T.; Bangash, H.A. Ground-based and UAV-Based photogrammetry: A multi-scale, high-resolution mapping tool for structural geology and paleoseismology. J. Struct. Geol. 2014, 69, 163–178. [Google Scholar] [CrossRef]
- Stone, C.; Webster, M.; Osborn, J.; Iqbal, I.A. Alternatives to LiDAR-derived canopy height models for softwood plantations: A review and example using photogrammetry. Aust. For. 2016, 79, 271–282. [Google Scholar] [CrossRef]
- Menna, F.; Agrafiotis, P.; Georgopoulos, A. State of the art and applications in archaeological underwater 3D recording and mapping. J. Cult. Heritage 2018, 33, 231–248. [Google Scholar] [CrossRef]
- Aicardi, I.; Chiabrando, F.; Lingua, A.M.; Noardo, F. Recent trends in cultural heritage 3D survey: The photogrammetric computer vision approach. J. Cult. Herit. 2018, 32, 257–266. [Google Scholar] [CrossRef]
- Iglhaut, J.; Cabo, C.; Puliti, S.; Piermattei, L.; O’Connor, J.; Rosette, J. Structure from Motion Photogrammetry in Forestry: A Review. Curr. For. Rep. 2019, 5, 155–168. [Google Scholar] [CrossRef]
- Chemisky, B.; Menna, F.; Nocerino, E.; Drap, P. Underwater Survey for Oil and Gas Industry: A Review of Close Range Optical Methods. Remote Sens. 2021, 13, 2789. [Google Scholar] [CrossRef]
- Deliry, S.I.; Avdan, U. Accuracy of Unmanned Aerial Systems Photogrammetry and Structure from Motion in Surveying and Mapping: A Review. J. Indian Soc. Remote Sens. 2021, 49, 1997–2017. [Google Scholar] [CrossRef]
- Śledź, S.; Ewertowski, M.W.; Piekarczyk, J. Applications of unmanned aerial vehicle (UAV) surveys and Structure from Motion photogrammetry in glacial and periglacial geomorphology. Geomorphology 2021, 378, 107620. [Google Scholar] [CrossRef]
- Zahari, N.M.; Karim, M.A.A.; Nurhikmah, F.; Aziz, N.A.; Zawawi, M.H.; Mohamad, D. Review of unmanned aerial vehicle photogrammetry for aerial mapping applications. In Proceedings of the International Conference on Civil, Offshore and Environmental Engineering; Springer: Singapore, 2021; pp. 669–676. [Google Scholar] [CrossRef]
- Page, M.J.; McKenzie, J.E.; Bossuyt, P.M.; Boutron, I.; Hoffmann, T.C.; Mulrow, C.D.; Shamseer, L.; Tetzlaff, J.M.; Akl, E.A.; Brennan, S.E.; et al. The PRISMA 2020 Statement: An Updated Guideline for Reporting Systematic Reviews. BMJ 2021, 372, n71. [Google Scholar] [CrossRef] [PubMed]
- Medina, M. Surveys in Aguascalientes by photogrammetric methods. Trans. Am. Geophys. Union 1935, 16, 67–70. [Google Scholar] [CrossRef]
- Wolff, N. Air Survey and Colonial Cadastral Mapping. Emp. Surv. Rev. 1938, 4, 281–290. [Google Scholar] [CrossRef]
- Powell, J.R. The Quantum Limit to Moore’s Law. Proc. IEEE 2008, 96, 1247–1248. [Google Scholar] [CrossRef]
- Raoult, V.; David, P.A.; Dupont, S.F.; Mathewson, C.P.; O’Neill, S.J.; Powell, N.N.; Williamson, J.E. GoPros™ as an underwater photogrammetry tool for citizen science. PeerJ 2016, 4, e1960. [Google Scholar] [CrossRef]
- Hobday, A.J.; I Browman, H.; Bograd, S.J. Publishing and peer reviewing as indicators of the impact of COVID-19 on the productivity of the aquatic science community. ICES J. Mar. Sci. 2020, 77, 2439–2444. [Google Scholar] [CrossRef]
- Roveta, C.; Annibaldi, A.; Afghan, A.; Calcinai, B.; Di Camillo, C.; Gregorin, C.; Illuminati, S.; Mantas, T.P.; Truzzi, C.; Puce, S. Biomonitoring of Heavy Metals: The Unexplored Role of Marine Sessile Taxa. Appl. Sci. 2021, 11, 580. [Google Scholar] [CrossRef]
- Karatas, İ. The evolution of unmanned aerial vehicles (UAVs) and their similarities with proxy groups. Akade-Mik Hassasiyetler 2020, 7, 53–69. [Google Scholar]
- Faig, W. Calibration of close-range photogrammetric systems: Mathematical formulation. Photogramm. Eng. Remote Sens. 1975, 41, 1479–1486. [Google Scholar]
- Fryer, J.G.; Done, T.J. An underwater trilateration. Aust. Surv. 1982, 31, 7–12. [Google Scholar] [CrossRef]
- Watts, A.C.; Perry, J.H.; Smith, S.E.; Burgess, M.A.; Wilkinson, B.E.; Szantoi, Z.; Ifju, P.G.; Percival, H.F. Small Unmanned Aircraft Systems for Low-Altitude Aerial Surveys. J. Wildl. Manag. 2010, 74, 1614–1619. [Google Scholar] [CrossRef]
- Guarnieri, A.; Milan, N.; Vettore, A. Monitoring of Complex Structure for Structural Control Using Terrestrial Laser Scanning (Tls) And Photogrammetry. Int. J. Arch. Heritage 2013, 7, 54–67. [Google Scholar] [CrossRef]
- Fassi, F.; Achille, C.; Fregonese, L. Surveying and modelling the main spire of Milan Cathedral using multiple data sources. Photogramm. Rec. 2011, 26, 462–487. [Google Scholar] [CrossRef]
- Salvini, R.; Francioni, M.; Riccucci, S.; Fantozzi, P.L.; Bonciani, F.; Mancini, S. Stability analysis of “Grotta delle Felci” Cliff (Capri Island, Italy): Structural, engineering–geological, photogrammetric surveys and laser scanning. Bull. Eng. Geol. Environ. 2011, 70, 549–557. [Google Scholar] [CrossRef]
- Dall’Asta, E.; Bruno, N.; Bigliardi, G.; Zerbi, A.; Roncella, R. Photogrammetric techniques for promotion of the archaeological heritage: The archaeological museum of Parma (Italy). ISPRS-Int. Arch. Photogramm. Remote Sens. Spat. Inf. Sci. 2016, XLI-B5, 243–250. [Google Scholar] [CrossRef]
- Esmaeili, H.; Thwaites, H.; Woods, P.C. Workflows & Challenges Involved in Creation of Realistic Immersive Virtual Museum, Heritage, and Tourism Experiences. In Proceedings of the 13th International Conference on Signal-Image Technology & Internet-Based Systems (SITIS), Jaipur, India, 4–7 December 2017. [Google Scholar] [CrossRef]
- Palma, M.; Magliozzi, C.; Casado, M.R.; Pantaleo, U.; Fernandes, J.; Coro, G.; Cerrano, C.; Leinster, P. Quantifying Coral Reef Composition of Recreational Diving Sites: A Structure from Motion Approach at Seascape Scale. Remote Sens. 2019, 11, 3027. [Google Scholar] [CrossRef]
- Rossi, P.; Ponti, M.; Righi, S.; Castagnetti, C.; Simonini, R.; Mancini, F.; Agrafiotis, P.; Bassani, L.; Bruno, F.; Cerrano, C.; et al. Needs and Gaps in Optical Underwater Technologies and Methods for the Investigation of Marine Animal Forest 3D-Structural Complexity. Front. Mar. Sci. 2021, 8, 591292. [Google Scholar] [CrossRef]
- Gambin, T.; Hyttinen, K.; Sausmekat, M.; Wood, J. Making the Invisible Visible: Underwater Malta—A Virtual Museum for Submerged Cultural Heritage. Remote Sens. 2021, 13, 1558. [Google Scholar] [CrossRef]
- Costa, E. The progress of survey techniques in underwater sites: The case study of Cape Stoba Shipwreck. ISPRS-Int. Arch. Photogramm. Remote Sens. Spat. Inf. Sci. 2019, XLII-2/W10, 69–75. [Google Scholar] [CrossRef]
- Firth, A.; Bedford, J.; Andrews, D. HMS Falmouth: 3D Visualization of a First World War Shipwreck. In Coastal Research Library; Springer: Berlin/Heidelberg, Germany, 2019; Volume 31, pp. 187–196. [Google Scholar] [CrossRef]
- Prado, E.; Gómez-Ballesteros, M.; Cobo, A.; Sánchez, F.; Rodriguez-Basalo, A.; Arrese, B.; Rodríguez-Cobo, L. 3D modeling of Rio Miera wreck ship merging optical and multibeam high resolution points cloud. ISPRS-Int. Arch. Photogramm. Remote Sens. Spat. Inf. Sci. 2019, XLII-2/W10, 159–165. [Google Scholar] [CrossRef]
- Secci, M.; Beltrame, C.; Manfio, S.; Guerra, F. Virtual reality in maritime archaeology legacy data for a virtual diving on the shipwreck of the Mercurio (1812). J. Cult. Heritage 2019, 40, 169–176. [Google Scholar] [CrossRef]
- Mogstad, A.A.; Ødegård, Ø.; Nornes, S.M.; Ludvigsen, M.; Johnsen, G.; Sørensen, A.J.; Berge, J. Mapping the Historical Shipwreck Figaro in the High Arctic Using Underwater Sensor-Carrying Robots. Remote Sens. 2020, 12, 997. [Google Scholar] [CrossRef]
- Ozaki, Y. The Accuracy of the Contour Lines I. J. Geod. Soc. Jpn. 1959, 5, 92–95. [Google Scholar] [CrossRef]
- Gerdes, K.; Arbizu, P.M.; Schwarz-Schampera, U.; Schwentner, M.; Kihara, T.C. Detailed Mapping of Hydrothermal Vent Fauna: A 3D Reconstruction Approach Based on Video Imagery. Front. Mar. Sci. 2019, 6, 96. [Google Scholar] [CrossRef]
- Kalacska, M.; Chmura, G.L.; Lucanus, O.; Bérubé, D.; Arroyo-Mora, J.P. Structure from motion will revolutionize analyses of tidal wetland landscapes. Remote Sens. Environ. 2017, 199, 14–24. [Google Scholar] [CrossRef]
- Karkani, A.; Evelpidou, N.; Vacchi, M.; Morhange, C.; Tsukamoto, S.; Frechen, M.; Maroukian, H. Tracking shoreline evolution in central Cyclades (Greece) using beachrocks. Mar. Geol. 2017, 388, 25–37. [Google Scholar] [CrossRef]
- Maté-González, M.; Sánchez-Aparicio, L.J.; Blázquez, C.S.; García, P.C.; Álvarez-Alonso, D.; de Andrés-Herrero, M.; García-Davalillo, J.C.; González-Aguilera, D.; Ruiz, M.H.; Bordehore, L.J.; et al. On the Combination of Remote Sensing and Geophysical Methods for the Digitalization of the San Lázaro Middle Paleolithic Rock Shelter (Segovia, Central Iberia, Spain). Remote Sens. 2019, 11, 2035. [Google Scholar] [CrossRef]
- Pukanská, K.; Bartoš, K.; Bella, P.; Gašinec, J.; Blistan, P.; Kovanič, Ľ. Surveying and High-Resolution Topography of the Ochtiná Aragonite Cave Based on TLS and Digital Photogrammetry. Appl. Sci. 2020, 10, 4633. [Google Scholar] [CrossRef]
- Ferrari, R.; Bryson, M.; Bridge, T.; Hustache, J.; Williams, S.B.; Byrne, M.; Figueira, W. Quantifying the response of structural complexity and community composition to environmental change in marine communities. Glob. Chang. Biol. 2016, 22, 1965–1975. [Google Scholar] [CrossRef]
- Reichert, J.; Backes, A.R.; Schubert, P.; Wilke, T. The power of 3D fractal dimensions for comparative shape and structural complexity analyses of irregularly shaped organisms. Methods Ecol. Evol. 2017, 8, 1650–1658. [Google Scholar] [CrossRef]
- Jackson, T.D.; Williams, G.J.; Walker-Springett, G.; Davies, A.J. Three-dimensional digital mapping of ecosystems: A new era in spatial ecology. Proc. R. Soc. B Boil. Sci. 2020, 287, 20192383. [Google Scholar] [CrossRef] [PubMed]
- Waltham, N.J.; Elliott, M.; Lee, S.Y.; Lovelock, C.; Duarte, C.M.; Buelow, C.; Simenstad, C.; Nagelkerken, I.; Claassens, L.; Wen, C.K.-C.; et al. UN Decade on Ecosystem Restoration 2021–2030—What Chance for Success in Restoring Coastal Ecosystems? Front. Mar. Sci. 2020, 7, 71. [Google Scholar] [CrossRef]
- Cattaneo-Vietti, R.; Mojetta, A. The essential role of diving in Marine Biology. BELS-Bullet. Environ. And Life Sci. 2021, 3, 1–44. [Google Scholar] [CrossRef]
- Kennedy, B.R.C.; Cantwell, K.; Malik, M.; Kelley, C.; Potter, J.; Elliott, K.; Lobecker, E.; Gray, L.M.; Sowers, D.; White, M.P.; et al. The Unknown and the Unexplored: Insights into the Pacific Deep-Sea Following NOAA CAPSTONE Expeditions. Front. Mar. Sci. 2019, 6, 480. [Google Scholar] [CrossRef]
- Mayer, L.; Jakobsson, M.; Allen, G.; Dorschel, B.; Falconer, R.; Ferrini, V.; Lamarche, G.; Snaith, H.; Weatherall, P. The Nippon Foundation—GEBCO Seabed 2030 Project: The Quest to See the World’s Oceans Completely Mapped by 2030. Geosciences 2018, 8, 63. [Google Scholar] [CrossRef]
- Teague, J.; Allen, M.J.; Scott, T.B. The potential of low-cost ROV for use in deep-sea mineral, ore prospecting and monitoring. Ocean Eng. 2018, 147, 333–339. [Google Scholar] [CrossRef]
- Willners, J.S.; Carlucho, I.; Katagiri, S.; Lemoine, C.; Roe, J.; Stephens, D.; Łuczyński, T.; Xu, S.; Carreno, Y.; Pairet, È.; et al. From market-ready ROVs to low-cost AUVs. In OCEANS 2021: San Diego–Porto; IEEE: New York, NY, USA, 2021; pp. 1–7. [Google Scholar] [CrossRef]
- Turicchia, E.; Ponti, M.; Rossi, G.; Milanese, M.; Di Camillo, C.G.; Cerrano, C. The Reef Check Mediterranean Underwater Coastal Environment Monitoring Protocol. Front. Mar. Sci. 2021, 8, 620368. [Google Scholar] [CrossRef]
- Pulido Mantas, T.; Varotti, C.; Roveta, C.; Palma, M.; Innocenti, C.; Giusti, M.; Benabdi, M.; Trainito, E.; Mačić, V.; Gambi, M.C.; et al. Mediterranean Sea shelters for the gold coral savalia savaglia (Bertoloni, 1819): An assessment of potential distribution of a rare parasitic species. Mar. Environ. Res. 2022, 179, 105686. [Google Scholar] [CrossRef]
- Viduka, A.; Edney, J. GIRT scientific divers citizen science programme: Volunteer motivations and characteristics. J. Community Archaeol. Heritage 2021, 9, 143–160. [Google Scholar] [CrossRef]
- Estes, M.; Anderson, C.; Appeltans, W.; Bax, N.; Bednaršek, N.; Canonico, G.; Djavidnia, S.; Escobar, E.; Fietzek, P.; Gregoire, M.; et al. Enhanced monitoring of life in the sea is a critical component of conservation management and sustainable economic growth. Mar. Policy 2021, 132, 104699. [Google Scholar] [CrossRef]
- Purzycki, M.; Komorowska, A.; Ilnicka, A.; Papiez, J.; Szymanska, E. From ROVs to AUVs–Optimization and Analysis of Underwater Vehicles Design. In Proceedings of the 2022 45th Jubilee International Convention on Information, Communication and Electronic Technology (MIPRO), Opatija, Croatia, 23–27 May 2022; IEEE: New York, NY, USA, 2022; pp. 1517–1521. [Google Scholar] [CrossRef]
- Nex, F.; Remondino, F. UAV for 3D mapping applications: A review. Appl. Geomat. 2014, 6, 1–15. [Google Scholar] [CrossRef]
- McLean, D.L.; Parsons, M.J.G.; Gates, A.; Benfield, M.C.; Bond, T.; Booth, D.J.; Bunce, M.; Fowler, A.; Harvey, E.S.; Macreadie, P.I.; et al. Enhancing the Scientific Value of Industry Remotely Operated Vehicles (ROVs) in Our Oceans. Front. Mar. Sci. 2020, 7, 220. [Google Scholar] [CrossRef]
- Frodella, W.; Elashvili, M.; Spizzichino, D.; Gigli, G.; Adikashvili, L.; Vacheishvili, N.; Kirkitadze, G.; Nadaraia, A.; Margottini, C.; Casagli, N. Combining InfraRed Thermography and UAV Digital Photogrammetry for the Protection and Conservation of Rupestrian Cultural Heritage Sites in Georgia: A Methodological Application. Remote Sens. 2020, 12, 892. [Google Scholar] [CrossRef]
- Puce, S.; Cerrano, C.; Marques, A.C.; Bavestrello, G. Eudendrium klausi (Cnidaria, Hydrozoa), a new species of hydroid from Belize. J. Mar. Biol. Assoc. U. K. 2005, 85, 291–305. [Google Scholar] [CrossRef]
- Qin, J.; Yang, K.; Li, M.; Zhong, J.; Zhang, H. Real-Time Positioning and Tracking for Vision-Based Unmanned Underwater Vehicles. ISPRS-Int. Arch. Photogramm. Remote Sens. Spat. Inf. Sci. 2022, XLVI-3/W1, 163–168. [Google Scholar] [CrossRef]
- Balletti, C.; Beltrame, C.; Costa, E.; Guerra, F.; Vernier, P. Photogrammetry in maritime and underwater archaeology: Two marble wrecks from Sicily. In Optics for Arts, Architecture, and Archaeology, V; SPIE: Bellingham, WA, USA, 2015; Volume 9527, pp. 127–138. [Google Scholar] [CrossRef]
- Kurz, T.H.; Buckley, S.J.; Howell, J.A. Close range hyperspectral imaging integrated with terrestrial LiDAR scanning applied to rock characterization at centimeter scale. Int. Arch. Photogramm. Remote Sens. Spat. Inf. Sci. 2012, 39, 417–422. [Google Scholar] [CrossRef]
- Sebar, L.E.; Lombardo, L.; Parvis, M.; Angelini, E.; Re, A.; Grassini, S. A metrological approach for multispectral photogrammetry. Acta IMEKO 2021, 10, 111–116. [Google Scholar] [CrossRef]
- Patrucco, G.; Cortese, G.; Tonolo, F.G.; Spanò, A. Thermal and Optical Data Fusion Supporting Built Heritage Analyses. ISPRS-Int. Arch. Photogramm. Remote Sens. Spat. Inf. Sci. 2020, XLIII-B3-2, 619–626. [Google Scholar] [CrossRef]
- Dlesk, A.; Vach, K.; Pavelka, K. Photogrammetric Co-Processing of Thermal Infrared Images and RGB Images. Sensors 2022, 22, 1655. [Google Scholar] [CrossRef]
- Baltsavias, E.P. A comparison between photogrammetry and laser scanning. ISPRS J. Photogramm. Remote Sens. 1999, 54, 83–94. [Google Scholar] [CrossRef]
- Moussa, W. Integration of Digital Photogrammetry and Terrestrial Laser Scanning for Cultural Heritage Data Recording. Master’s Thesis, University of Stuttgart, Stuttgart, Germany, 2014. [Google Scholar] [CrossRef]
- Roosevelt, C. Mapping site-level microtopography with Real—Time Kinematic Global Navigation Satellite Systems (RTK GNSS) and Unmanned Aerial Vehicle Photogrammetry (UAVP). Open Archaeol. 2014, 1, 29–53. [Google Scholar] [CrossRef]
- Ekaso, D.; Nex, F.; Kerle, N. Accuracy assessment of real-time kinematics (RTK) measurements on unmanned aerial vehicles (UAV) for direct geo-referencing. Geo-Spat. Inf. Sci. 2020, 23, 165–181. [Google Scholar] [CrossRef]
- Remondino, F.; Barazzetti, L.; Nex, F.; Scaioni, M.; Sarazzi, D. UAV photogrammetry for mapping and 3d modelling–current status and future perspectives. Int. Arch. Photogramm. Remote Sens. Spat. Inf. Sci. 2011, 38, 25–31. [Google Scholar] [CrossRef]
- Sakagami, N.; Hirayama, K.; Taba, R.; Kobashigawa, S.; Arashiro, S.; Takemura, F.; Takahashi, S. Development and field experiments of a human-portable towed ROV for high-speed and wide area data acquisition. Artif. Life Robot. 2020, 26, 1–9. [Google Scholar] [CrossRef]
- Abdelhafiz, A.; Mostafa, Y. Automatic texture mapping mega-projects. J. Spat. Sci. 2018, 65, 467–479. [Google Scholar] [CrossRef]
- Dorozhynskyy, O. Influence of GPS data fixed during the flight for aerial survey and aerial triangulation. Int. Arch. Photogramm. Remote Sens. 2000, 33 Pt 4, 238–246. [Google Scholar]
- Rau, J.-Y.; Teo, T.-A.; Chen, L.-C.; Tsai, F.; Hsiao, K.-H.; Hsu, W.-C. Integration of gps, gis and photogrammetry for texture mapping in photo-realistic city modeling. In Pacific-Rim Sym-Posium on Image and Video Technology; Springer: Berlin/Heidelberg, Germany, 2006; pp. 1283–1292. [Google Scholar] [CrossRef]
- Cooper, I.; Hotchkiss, R.; Williams, G. Extending Multi-Beam Sonar with Structure from Motion Data of Shorelines for Complete Pool Bathymetry of Reservoirs. Remote Sens. 2020, 13, 35. [Google Scholar] [CrossRef]
- Biass, S.; Orr, T.R.; Houghton, B.F.; Patrick, M.R.; James, M.R.; Turner, N. Insights Into Pāhoehoe Lava Emplacement Using Visible and Thermal Structure-From-Motion Photogrammetry. J. Geophys. Res. Solid Earth 2019, 124, 5678–5695. [Google Scholar] [CrossRef]
- Lathlean, J.; Seuront, L. Infrared thermography in marine ecology: Methods, previous applications and future challenges. Mar. Ecol. Prog. Ser. 2014, 514, 263–277. [Google Scholar] [CrossRef]
- Garrabou, J.; Bensoussan, N.; Di Franco, A.; Boada, J.; Cebrian, E.; Santamaria, J.; Guala, I.; Grech, D.; Cerrano, C.; Pulido, T.; et al. Monitoring Climate-Related Responses in Mediterranean Marine Protected Areas and Beyond: ELEVEN STANDARD PROTOCOLS; Institute of Marine Sciences, Ed.; Spanish Research Council ICM-CSIC: Barcelona, Spain, 2022; pp. 37–49. [Google Scholar] [CrossRef]


| Years | 1950–2021 |
|---|---|
| Search terms | “Photogrammetry” AND (“mapping” OR “survey”) AND (“terrestrial” OR” underwater”) |
| Database | Scopus |
| Inclusion criteria | Peer reviewed studies, conference papers and books Studies including photogrammetric applications. Published in English, Italian, French, or Spanish |
| Exclusion criteria | Duplicated manuscripts Studies not including photogrammetric surveys |
| Category | Definition |
|---|---|
| (A) General features of the manuscript | |
| Year | Year of publication |
| Authors | Authors of the publication |
| Title | Title of the publication |
| DOI | DOI of the publication |
| Country | Country in which is located the research group that performed the study |
| (B) Features extracted from each survey | |
| Branch of science | Discipline in which it is applied the survey |
| Environment | Environment in which the survey has been performed: |
| (i) terrestrial; (ii) marine; (iii) freshwater; (iv) terrestrial-aquatic; (v) underground | |
| Specific environment | Specific type of environment/structure/object surveyed |
| Nature scenario | Nature of the surveyed structure: |
| (i) natural; (ii) artificial | |
| Sampling approach | Type of photogrammetry implemented: |
| (i) airborne; (ii) ground-based; (iii) underwater; (iv) space-borne | |
| Depth | If underwater, maximum depth at which the survey was performed |
| Coupled techniques | If appliable, complementary approach with which have been coupled the photogrammetry: |
| (i) laser-scan; (ii) multi-spectral imaging; (iii) thermal imaging; | |
| (iv) acoustic techniques; (v) tomography; (vi) radiation; (vii) machine learning | |
| Coupled location system | If appliable, location system with which have been coupled the photogrammetry: |
| (i) global positioning system (GPS) & global navigation satellite system (GNSS); | |
| (ii) mobile mapping system (MMS); iii) post-processing kinetics (PPK); | |
| (iv) real time kinetics (RTK); v) simultaneous location and mapping (SLAM) | |
| Vehicles | If appliable, vehicle use for the photogrammetry survey: |
| (i) remote operated vehicle; (ROV); (ii) unmanned aerial vehicle (UAV); (iii) satellite | |
Disclaimer/Publisher’s Note: The statements, opinions and data contained in all publications are solely those of the individual author(s) and contributor(s) and not of MDPI and/or the editor(s). MDPI and/or the editor(s) disclaim responsibility for any injury to people or property resulting from any ideas, methods, instructions or products referred to in the content. |
© 2023 by the authors. Licensee MDPI, Basel, Switzerland. This article is an open access article distributed under the terms and conditions of the Creative Commons Attribution (CC BY) license (https://creativecommons.org/licenses/by/4.0/).
Share and Cite
Pulido Mantas, T.; Roveta, C.; Calcinai, B.; di Camillo, C.G.; Gambardella, C.; Gregorin, C.; Coppari, M.; Marrocco, T.; Puce, S.; Riccardi, A.; et al. Photogrammetry, from the Land to the Sea and Beyond: A Unifying Approach to Study Terrestrial and Marine Environments. J. Mar. Sci. Eng. 2023, 11, 759. https://doi.org/10.3390/jmse11040759
Pulido Mantas T, Roveta C, Calcinai B, di Camillo CG, Gambardella C, Gregorin C, Coppari M, Marrocco T, Puce S, Riccardi A, et al. Photogrammetry, from the Land to the Sea and Beyond: A Unifying Approach to Study Terrestrial and Marine Environments. Journal of Marine Science and Engineering. 2023; 11(4):759. https://doi.org/10.3390/jmse11040759
Chicago/Turabian StylePulido Mantas, Torcuato, Camilla Roveta, Barbara Calcinai, Cristina Gioia di Camillo, Chiara Gambardella, Chiara Gregorin, Martina Coppari, Teo Marrocco, Stefania Puce, Agnese Riccardi, and et al. 2023. "Photogrammetry, from the Land to the Sea and Beyond: A Unifying Approach to Study Terrestrial and Marine Environments" Journal of Marine Science and Engineering 11, no. 4: 759. https://doi.org/10.3390/jmse11040759
APA StylePulido Mantas, T., Roveta, C., Calcinai, B., di Camillo, C. G., Gambardella, C., Gregorin, C., Coppari, M., Marrocco, T., Puce, S., Riccardi, A., & Cerrano, C. (2023). Photogrammetry, from the Land to the Sea and Beyond: A Unifying Approach to Study Terrestrial and Marine Environments. Journal of Marine Science and Engineering, 11(4), 759. https://doi.org/10.3390/jmse11040759