Article

Selection of CO2 Emission Reduction Measures Affecting the Maximum Annual Income of a Container Ship

College of Transport and Communications, Shanghai Maritime University, Shanghai 201306, China
*
Author to whom correspondence should be addressed.
J. Mar. Sci. Eng. 2023, 11(3), 534; https://doi.org/10.3390/jmse11030534
Submission received: 20 January 2023 / Revised: 14 February 2023 / Accepted: 21 February 2023 / Published: 1 March 2023
(This article belongs to the Section Marine Environmental Science)

Abstract

:
China’s carbon peaking and carbon neutrality targets have created huge challenges for all the economic sectors in China, including the shipping industry. Various emission reduction measures, such as Waste Heat Recovery Systems (WHRSs), Drag Reduction Coatings (DRCs), and Slow Steaming (SS), are the main options for container ship companies to select in advance. This paper aims to find the optimal combination of measures for container ship companies to reach the carbon reduction targets, which are mainly set according to the carbon reduction requirements of the International Maritime Organization (IMO). A 0–1 integer programming model is proposed under the Maritime Emissions Trading Scheme (METS) to help container ship companies select the optimal combination of measures in the context of carbon peaking and carbon neutrality. Our results show that combination 6 (using a WHRS alone and a 5.0% reduction in the original speed) is the most suitable solution with the selected values of parameters. Sensitivity analyses of the parameters are performed, such as bunker price, the auction and purchase prices of carbon and incentive levels. From the sensitivity analysis, it is found that using a WHRS is the optimal combination of abatement measures within the fluctuation range of the parameters. At the same time, according to the results, container ship companies could choose the most appropriate and profitable strategy in the dual-carbon context. Therefore, container ship companies and policymakers have access to relevant carbon reduction suggestions to encourage the implementation of carbon reduction initiatives.

1. Introduction

With the increase in international trade, the shipping industry is playing an increasingly important role in international logistics [1]. Emissions from the shipping industry account for the majority of air pollution in ports and sea areas around the world [2]. Figure 1 clearly shows that transportation accounts for 16.5% of global greenhouse gas emissions. Shipping is a part of transportation. According to a report of the International Maritime Organization (IMO), international shipping accounts for 2.6% of global CO2 emissions [3]. Containerization transportation accounts for a great proportion of international shipping [4]. Kageson considered the ship itself as the liable entity [5]. Therefore, the container ship itself is considered the liable entity. Container ships emit large amounts of CO2 at sea, and CO2 emissions from container ships are 1.3, 2.2 and 2.5 times greater than those from bulk shipping, crude oil tankers and general cargo ships [6]. Container shipping is considered to be an emission-intensive industry [7]. Large amounts of CO2 emissions can cause several problems, such as global warming. Furthermore, IMO has projected a significant increase of 50.0% to 250.0% in the period to 2050 in maritime CO2 emissions [3]. Obviously, further action is imminent. The Paris Agreement [8] aims to reduce the risk of climate change by limiting the rise in global average temperatures to well below 2 °C above pre-industrial levels and by working towards limiting the temperature increase to 1.5 °C above pre-industrial levels. Such a temperature target is conducive to addressing the massive CO2 emissions and the resulting climate change. Therefore, reducing CO2 emissions is not only critical to decarbonization but also related to the temperature targets of the Paris Agreement [9]. IMO and national authorities have introduced relevant policies and applied appropriate measures to accelerate the decarbonization process.
IMO has developed an initial strategy to decarbonize the shipping industry. The strategy aims to reduce CO2 emissions per transport work, as an average across international shipping, by at least 40.0% by 2030 and to pursue a 70.0% reduction by 2050, on the benchmark of 2008 levels [10]. Moreover, to reduce more CO2 emissions, net-zero carbon emissions have become the development direction of carbon reduction goals. Limiting warming to 1.5 °C would bring the world to net-zero CO2 emissions around 2050 [11]. Huang and Zhai stated that countries around the world have formally adopted or announced or are considering net-zero targets corresponding to the Paris Agreement [12]. Lu et al. mentioned that over 60 countries around the world are working towards zero carbon emissions by 2050 at present [13]. As an international power, China is also actively responding to carbon reduction initiatives. China has committed to achieving carbon neutrality before 2060 [14]. Meanwhile, at the United Nations General Assembly in 2020, President Xi Jinping announced that China was stepping up its efforts to achieve peak CO2 by 2030 and working towards achieving carbon neutrality by 2060 [15]. Against this background, IMO has formulated many CO2 emission reduction measures for the shipping industry, and China has proposed corresponding policies in response to the carbon reduction process.
There are many solutions to decarbonizing the shipping industry, which could be divided into three main categories: technical measures, operational measures and market-based measures (MBMs) [16]. IMO introduced the Energy Efficiency Design Index (EEDI), applicable to new ships, and the Ship Energy Efficiency Management Plan (SEEMP), applicable to all ships [17,18]. To reduce the resistance of a ship during navigation, a Drag Reduction Coating (DRC) is a necessary measure. Waste Heat Recovery Systems (WHRSs) save fuel and significantly reduce CO2 emissions [19]. As an operational measure, Slow Steaming (SS) is considered to be a way to reduce shipping emissions [20]. Gu et al. demonstrated the Maritime Emission Trading Scheme (METS), one of the market-based measures, which might be utilized to control CO2 emissions from international shipping [21]. There exist three scenarios of METS. For example, when CO2 emissions are within the boundary of free quotas, operators have no need to pay CO2 costs, and they can obtain extra benefits by selling their redundant quotas. However, if CO2 emissions exceed free quotas but are within the boundary of the “cap” of CO2 emissions, operators need to auction their quotas under METS. Unfortunately, operators have to purchase quotas in the market or pay a penalty when CO2 emissions exceed the “cap” of CO2 emissions. Under these conditions, the paper mainly refers to the European Union Emissions Trading System (EU ETS) to conduct an analysis on the possible auction rates in the future METS [22]. Table 1 shows the significant elements of METS. Meanwhile, China has also introduced the policy of carbon trading pilot projects. The National Development and Reform Commission of China officially approved the implementation of carbon trading pilot projects in Beijing, Shanghai, Tianjin, Chongqing, Hubei and Guangdong.
The introduction and application of carbon reduction measures have had a positive impact on the decarbonization process of the shipping industry under carbon peaking and carbon neutrality. When using carbon reduction solutions to address emission reductions, both policymakers and container ship companies need to give some support. The achievement of the carbon reduction targets proposed by IMO requires the utilization of technical measures, operational measures and market-based measures. Hence, to better achieve carbon peaking and carbon neutrality, an overview of measures to achieve CO2 reduction is presented. The benefits of applying carbon reduction measures under METS in terms of ship emission reduction are analyzed in detail. The best combination that allows container ship companies to achieve the optimal annual net income is obtained. Corresponding rewards for container ships using the carbon reduction measures and penalties beyond the prescribed CO2 emission limits are also necessary. According to the carbon reduction requirements of IMO for the shipping industry, a “cap” on CO2 emission is set to be 60.0% of 2008 levels by 2030 and 30.0% of 2008 levels by 2060 [10]. This “cap” is used to limit CO2 emissions from container ships to achieve carbon peaking and carbon neutrality as soon as possible. Above all, according to the final calculation results, not only could container ship companies choose the most appropriate and profitable strategy in the dual-carbon context, but policymakers could also receive advice on carbon reduction.
The remainder of this paper is organized as follows: Section 2 reviews the existing literature. In the context of carbon peaking and carbon neutrality, a model is developed to select the emission reduction measures that can maximize the annual income for a container ship in Section 3. Then, Section 4 carries out a case study of an 8000-TEU container ship. Discussions and sensitivity analyses are carried out in Section 5. The final section draws conclusions.

2. Literature Review

This section discusses the measures used to reduce CO2 emissions from the shipping industry, including technical measures, operational measures, market-based measures and other innovative measures, as well as methods to compare these measures.

2.1. Technical Measures

A mandatory limit on EEDI for new ships is considered a cost-effective solution [23]. With the implementation of the proposed EEDI, an increasing number of international ship operators have adopted a range of technical measures [4]. Technical measures are effective means of reducing CO2 emissions, including resistance-reducing measures, engine-related measures, other technical measures and alternative fuels [24]. A range of technical solutions have emerged from the research, including Drag Reduction Coatings (DRCs), Waste Heat Recovery Systems (WHRSs), biofuels, hydrogen with marine fuel cells, methanol and Liquefied Natural Gas (LNG). The utilization of antifouling (AF) coatings with lower roughness can reduce fuel consumption and greenhouse gas (GHG) emissions [9]. Waste Heat Recovery Systems have the ability to recover and utilize thermal energy from exhaust gases [25]. Shu et al. [26] assumed that waste heat recovery has a particularly high potential. DRCs and WHRSs can save energy by 40.0~50.0% and 20.0~40.0%, respectively [27]. Therefore, DRCs and WHRSs are effective measures to reduce CO2 emissions. To meet more stringent emission reduction targets, alternative fuels with the potential to reduce CO2 emissions are increasingly being investigated. Ampah et al. [28] stated that methanol and hydrogen fuels were the research priorities based on recent trends. Nevertheless, biofuels and hydrogen face significant barriers in terms of economics, resource potential and public acceptability [29]. Eide et al. [30] argued that sustainable biofuels and hydrogen are still not feasible in the short term, even though they could potentially reduce CO2 emissions. Meanwhile, Balcombe et al. [29] highlighted that LNG was becoming mainstream, providing 20.0~30.0% CO2 reductions. However, the utilization of LNG is also not yet widespread, and its cost is relatively high. Thus, these alternative fuels are not mature enough to be used in large quantities.

2.2. Operational Measures

One category of the possible measures to reduce the bunker consumption of ships is operational measures [31]. Serra and Fancello [32] mentioned that operational measures included speed management, route planning and voyage optimization. Voyage optimization plays an important role in reducing fuel consumption. With weather conditions being an important consideration during a voyage, weather routing has become a common measure. More effective methods for optimizing ship routing have the ability to effectively reduce CO2 emissions [33]. However, researchers mostly analyzed Slow Steaming (SS) due to its practicality and operability. Firstly, Cullinane and Yang [34] ranked speed reduction first under the criteria of “energy saving” and “marginal cost effectiveness”. Wan et al. [35] considered that SS could save energy consumption, but it has limited potential to reduce further emissions in practice. Furthermore, SS not only saves energy but also reduces fuel consumption and CO2 emissions. Balcombe et al. [29] suggested that SS might reduce fuel consumption and CO2 emissions by about 20.0~30.0%. Li [36] also concluded that SS could effectively reduce the CO2 emissions of ship voyages. Psaraftis and Kontovas [37] stated briefly that the slower the ship moves, the less it emits. SS with a positive carbon mitigation potential can result in a 55.0% reduction of fuel consumption when the ship sails at a 30.0% slower speed [38].

2.3. Market-Based Measures

Cullinane and Yang [34] argued that future industry decarbonization would require MBMs. In general, MBMs can be divided into emission taxes and the Emissions Trading Scheme (ETS). Emissions taxes usually have political characteristics, and there are some difficulties in ensuring a uniform standard and implementation worldwide [22]. Meanwhile, the fate of MBMs in IMO is also unclear [39]. However, the need for carbon reduction still exists. The European Union Emissions Trading System (EU ETS) is the oldest system in force [40]. The “Fit for 55 package” aims to include emissions from maritime transport in the EU ETS [41]. Additionally, METS can reduce fuel consumption [42]. Zhu et al. [43] noted that METS might give operators stimulation to use new technologies. Therefore, the employment of METS needs to be clearly stated. Kageson [5] pointed out that the shipping section’s initial allocation of allowances could be determined based on historic emissions (grandfathering) (grandfathering refers to a method of allocating allowances free of charge based on historical emissions [44]), auctioning or their combination, and it has been proven that grandfathering is problematic in ETS. Furthermore, if shipping companies only employ auctioning to allocate allowances, they may undertake a heavy financial burden. Hence, this paper chooses a combination to allocate allowances. However, Lagouvardou et al. [39] clearly stated that it was a challenge for METS to decide how many allocations ought to be free.

2.4. Innovative Measures

In addition to the three main abatement measures mentioned above, several other innovative measures exist. Carbon capture and wind and solar energy are among the popular ones. Carbon capture is an emerging measure for the shipping industry to meet the stringent requirements of GHG emission reduction [45]. Mallouppas et al. [46] considered that carbon capture and storage (CCS) holds promise for reducing CO2 emissions. Nevertheless, CCS has the ability to contribute to removing CO2 from the atmosphere [47]. Wind and solar energy are also more or less problematic. Wind and solar energy can provide auxiliary power for ships, despite the limitations of weather conditions and ship conditions [48]. Mallouppas et al. discussed technologies that were not mature enough to achieve deep decarbonization by themselves, such as wind and solar energy [46].

2.5. Methods to Compare Different Measures

Since the innovative measures mentioned above are not yet mature, we are concerned with technical, operational and market-based measures. Market-based measures are still needed, as operational and technological innovations are not sufficient to achieve complete decarbonization [34]. There is not much literature that combines three measures and delves into the carbon reduction effect or revenue impact on ships. Therefore, we focus on methods to compare the measures. A Gaussian-process-metamodel-based method is proposed to evaluate mitigation measures [49]. Based on a comprehensive review of existing studies, Xing et al. [33] performed a meta-analysis on mitigation measures. Using an international freight transport and emission model, Halim et al. [50] tested the impact of mitigation measures on CO2 emissions until 2035. Eide et al. [30] developed a decision parameter called the Cost of Averting a Tonne of CO2-eq Heating (CATCH), showing that the reductions in cost effectiveness for a fleet is about 30.0% for technical measures and above 50.0% when speed reductions are included. Meanwhile, through a systematic review of previous studies, Bouman et al. [51] concluded that a large amount of practical combinations of measures exist, such as ship size, hull shape, ballast water reduction, hull coatings, hybrid power/propulsion, propulsion efficiency devices, speed optimization and weather routing. According to the CATCH, weather routing, silicon coatings, speed reduction and waste heat recovery systems can be recommended for implementation on a purely economic gain basis for large container ships [30].
MBM can be placed at the base and provide a platform for implementing solutions, such as speed reduction, technical and operational improvements [52]. Hence, in this paper, the optimal annual revenue of container ships is studied in the context of METS through the combination of WHRSs, DRCs and SS. In addition, studies about the cost analysis of specific mitigation measures (WHRSs or DRCs) are few in the existing literature.

3. Modeling

A model is built to explore which combinations of reduction measures can help container ships obtain the maximum annual net income. It is assumed that bunker prices, freight rate, the auction and purchase prices of CO2 and the actual sailing speed of the container ship are constant. The parameters and formulas that are used to calculate the annual net income of container ships are listed and explained below. The basic voyage estimation model and the 0–1 integer programming model are utilized. The variables and parameters are defined in Table 2.
This paper uses Excel for data calculation and mainly involves a 0–1 integer programming model. Formulas (1)–(3) are used to calculate the total annual revenue and total annual cost. Formulas (5)–(12) are then used to calculate the various costs required over the course of the voyage. Finally, Formula (4) is used for integration.
Based on the parameters given, the number of trips travelled by the container ship per year can be calculated using Equation (1). The total annual revenue and the total annual cost of the container ship during the whole operation period are obtained using Equations (2) and (3). Our main objective is to obtain the maximum annual net income of the container ship, as shown in Equation (4).
R = y / ( d 24 × V + D ) ,
T R = ( r i j × T i j + r j i × T j i ) × R ,
T C = n × C w + m × C D + C C + C d t × y + C B + C P C R   ,
M A X   N = T R T C
Equations (5)–(7) refer to [4,6]. VP in Equation (5) means the optimal speed of a container ship, and it is set as the original speed (OS) of a container ship [4,6]. The bunker consumption of a ship is the sum of the bunker consumed by the main engine and auxiliary engine; Equation (6) represents the total bunker cost of a container ship.
O S = V P = [ ( C d t + P a × A F s ) × V 0 3 / 2 × P m × M F ] 1 / 3
C B = { [ M F × ( V / V 0 ) 3 × P m + A F s × P a ] × d 24 × V + A F P × D × P a } × R
Once the bunker consumption of the container ship is obtained, we multiply it by the carbon content proportion of fuel (0.8645) and the factor of conversion of carbon to CO2 (44/12) to convert the bunker consumption into CO2 emissions [6].
C O 2 ( A ) = 0.8645 × 44 / 12 × { [ ( 1 n β m α ) × M F × ( V / V 0 ) 3 + A F S ] × d 24 × V + A F P × D } × R
Equations (8) and (9) adapted from [4] are used to estimate CW and CD by using the annual depreciation cost minus the annual bunker savings of the main engine.
C W = P w Y w [ β × M F × ( V / V 0 ) 3 × P m × d 24 × V × R ]
C D = P d Y d [ α × M F × ( V / V 0 ) 3 × P m × d 24 × V × R ] ,
Drawing on Qiu et al. [53], the formulas are developed. The corresponding reward for container ships using the carbon reduction measures is expressed in Equation (10). In order to keep the emissions of container ships less than the initial emissions, carbon reduction measures must be taken. Hence, we set (n, m) ϵ {(0, 1),(1, 0),(1, 1)} in Equation (10). To achieve the dual-carbon target as soon as possible, a stricter mechanism is implemented, whereby operators have to pay certain fines. Equation (11) is utilized to calculate the corresponding penalties beyond the specified CO2 emission limits. We assume that the reward is denoted by CR and that the punishment is denoted by CP.
C R = θ × P c × C O 2 ( A )
C P = θ × P r × ( C O 2 ( A ) C O 2 ( C ) )
Additionally, the total annual cost of CO2 emissions is determined by comparing the actual CO2 emissions with the free CO2 emission allowances and the upper limit of CO2 emissions.
C C = { P c × [ C O 2   ( A ) C O 2   ( F ) ] P r × [ C O 2   ( A ) C O 2   ( C ) ] + P c × [ C O 2   ( C ) C O 2   ( F ) ]
When CO2(A) is not more than CO2(F), C C = 0, meaning that shipowners do not have to pay for CO2 emissions.
When CO2(F) < CO2(A) ≤ CO2(C), C C = P c × [ C O 2 ( A ) C O 2 ( F ) ] , indicating that there exist costs of CO2 emissions, that is, the cost of auctioning the quota of allowance.
When CO2(A) > CO2(C), P r × [ C O 2 ( A ) C O 2 ( C ) ] + P c × [ C O 2 ( C ) C O 2 ( F ) ] . In this case, shipowners not only have to auction CO2 allowances but also need to purchase quotas of allowance in the market.

4. Case Study

Among global container ships, the 7500–9999 TEU loading capacity is the most important in maritime industry [54]. An 8000 TEU (Table 3) container ship that travels on the Asia–North Europe route is taken as a case. This route can be divided into Westbound and Eastbound, and the distances are 11,449 nm and 11,017 nm, respectively
In addition to the parameters given above, the auction and purchase prices of carbon are assumed as 25 USD/ton and 30 USD/ton, respectively according to [40]. The incentive level is set at 100.0%.
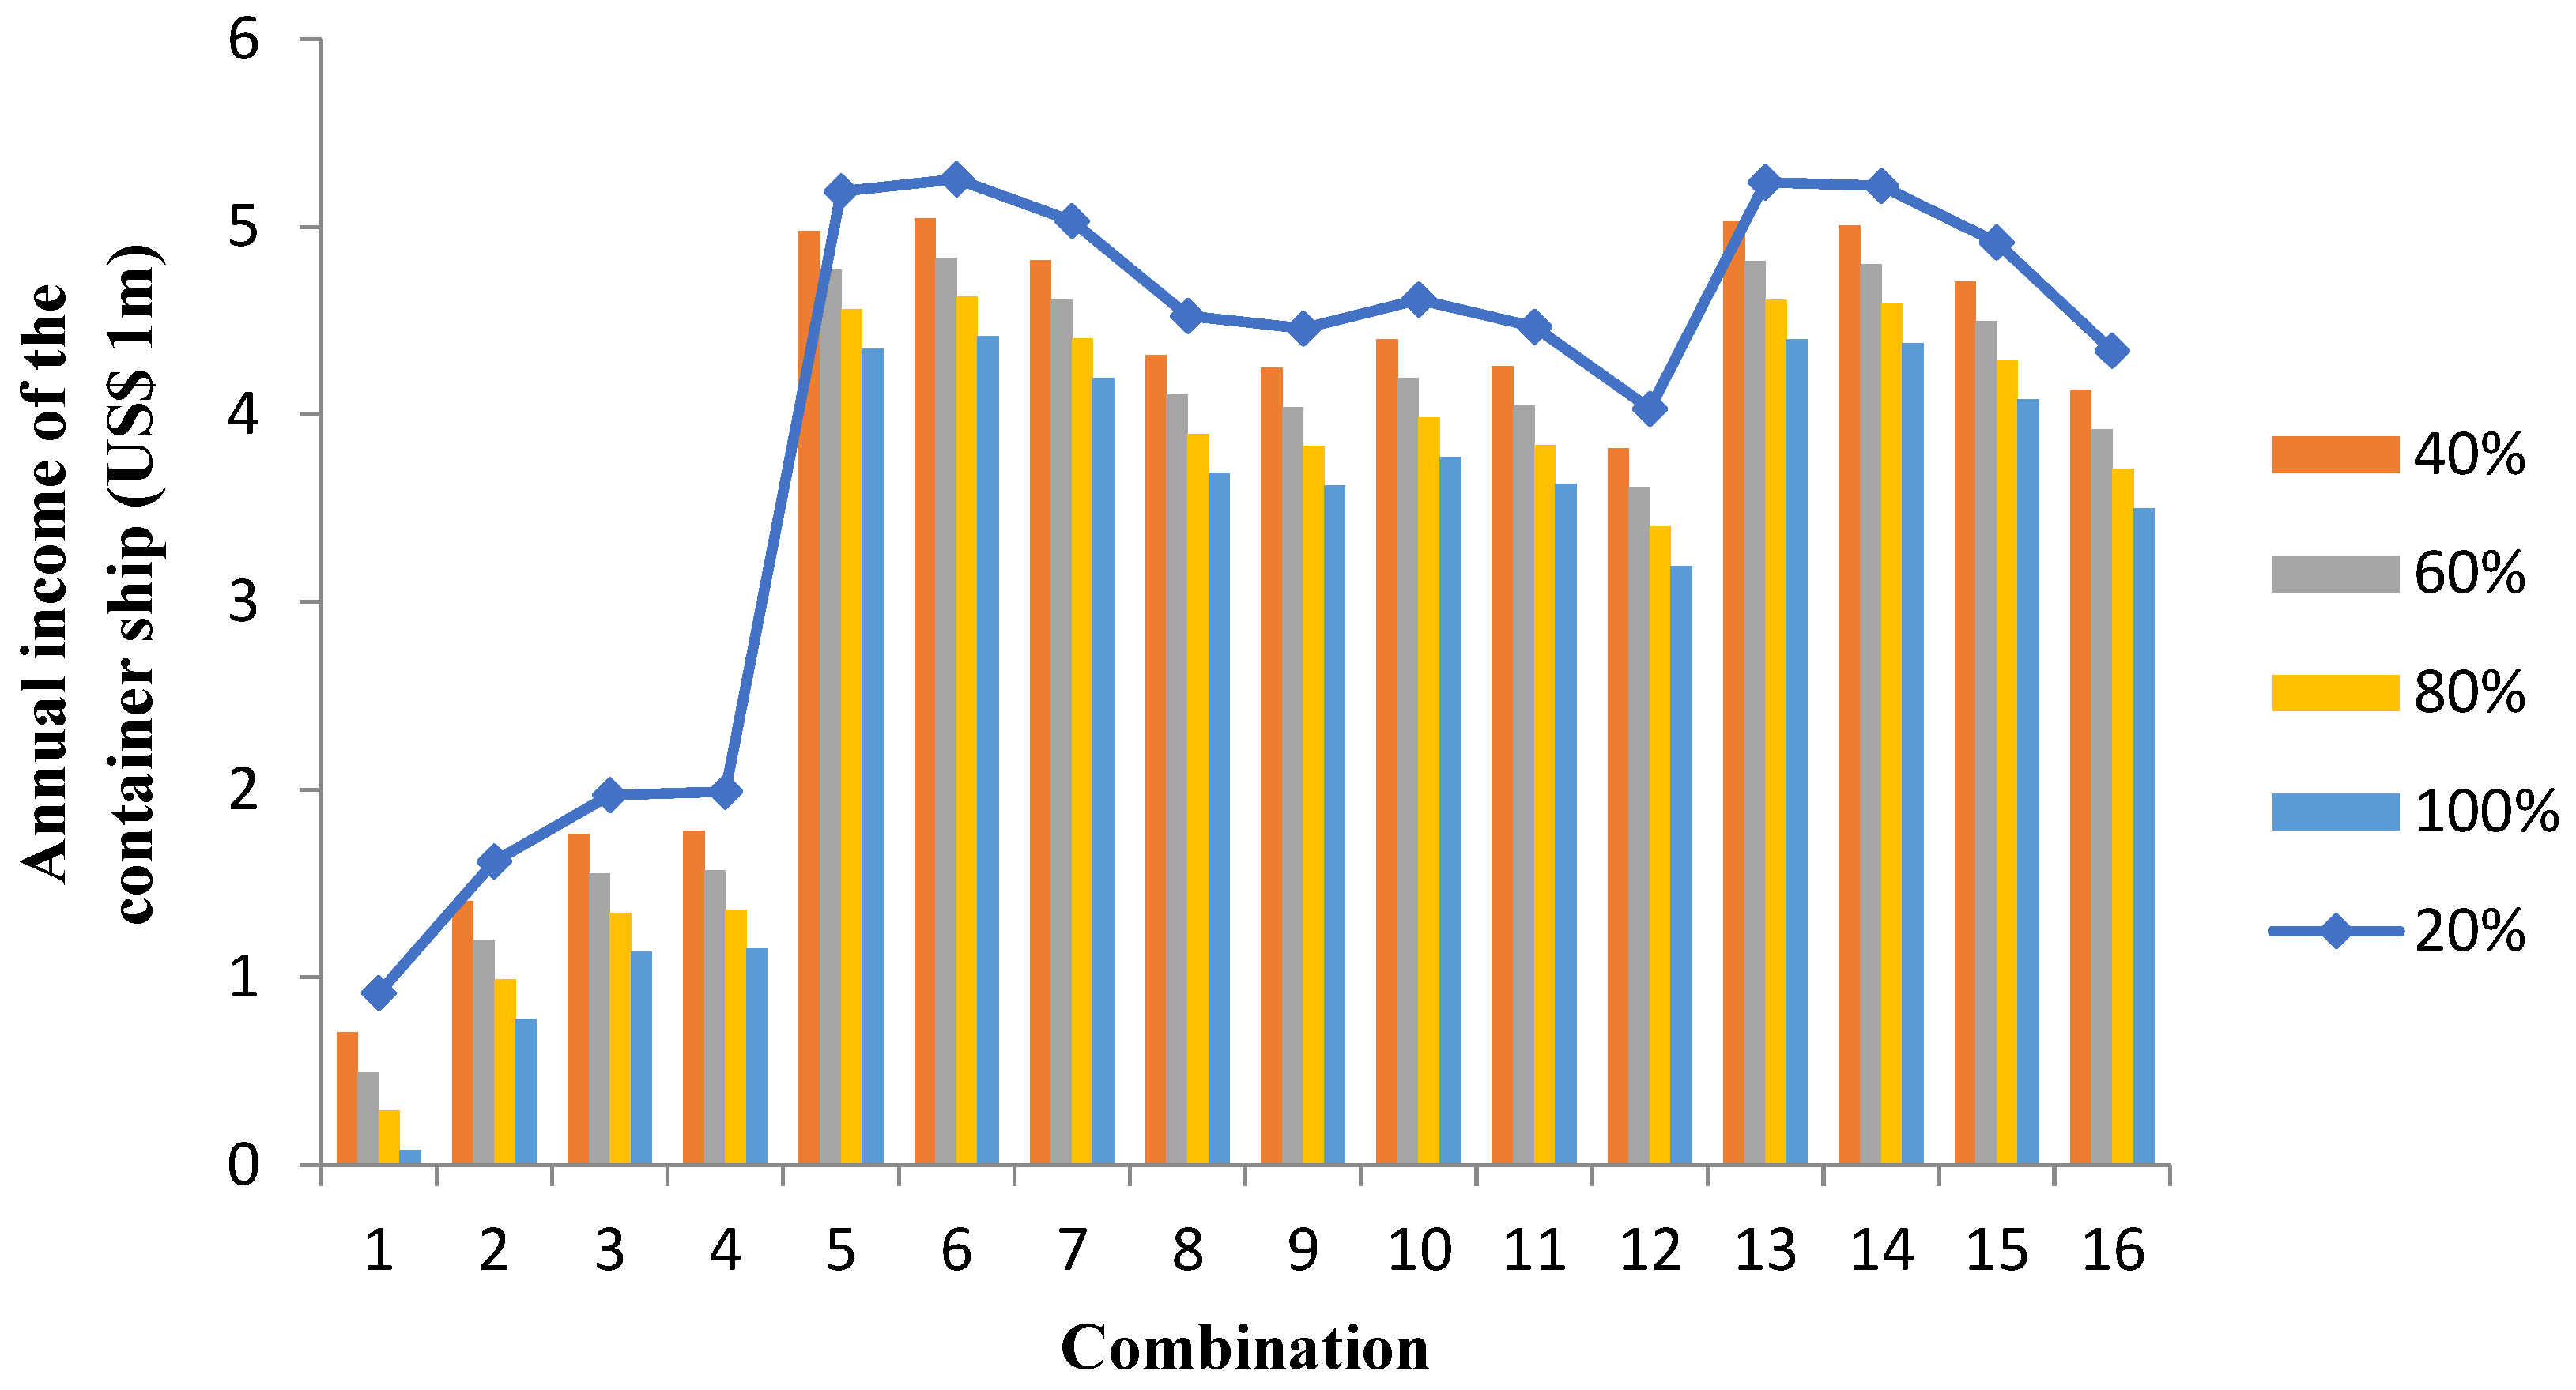
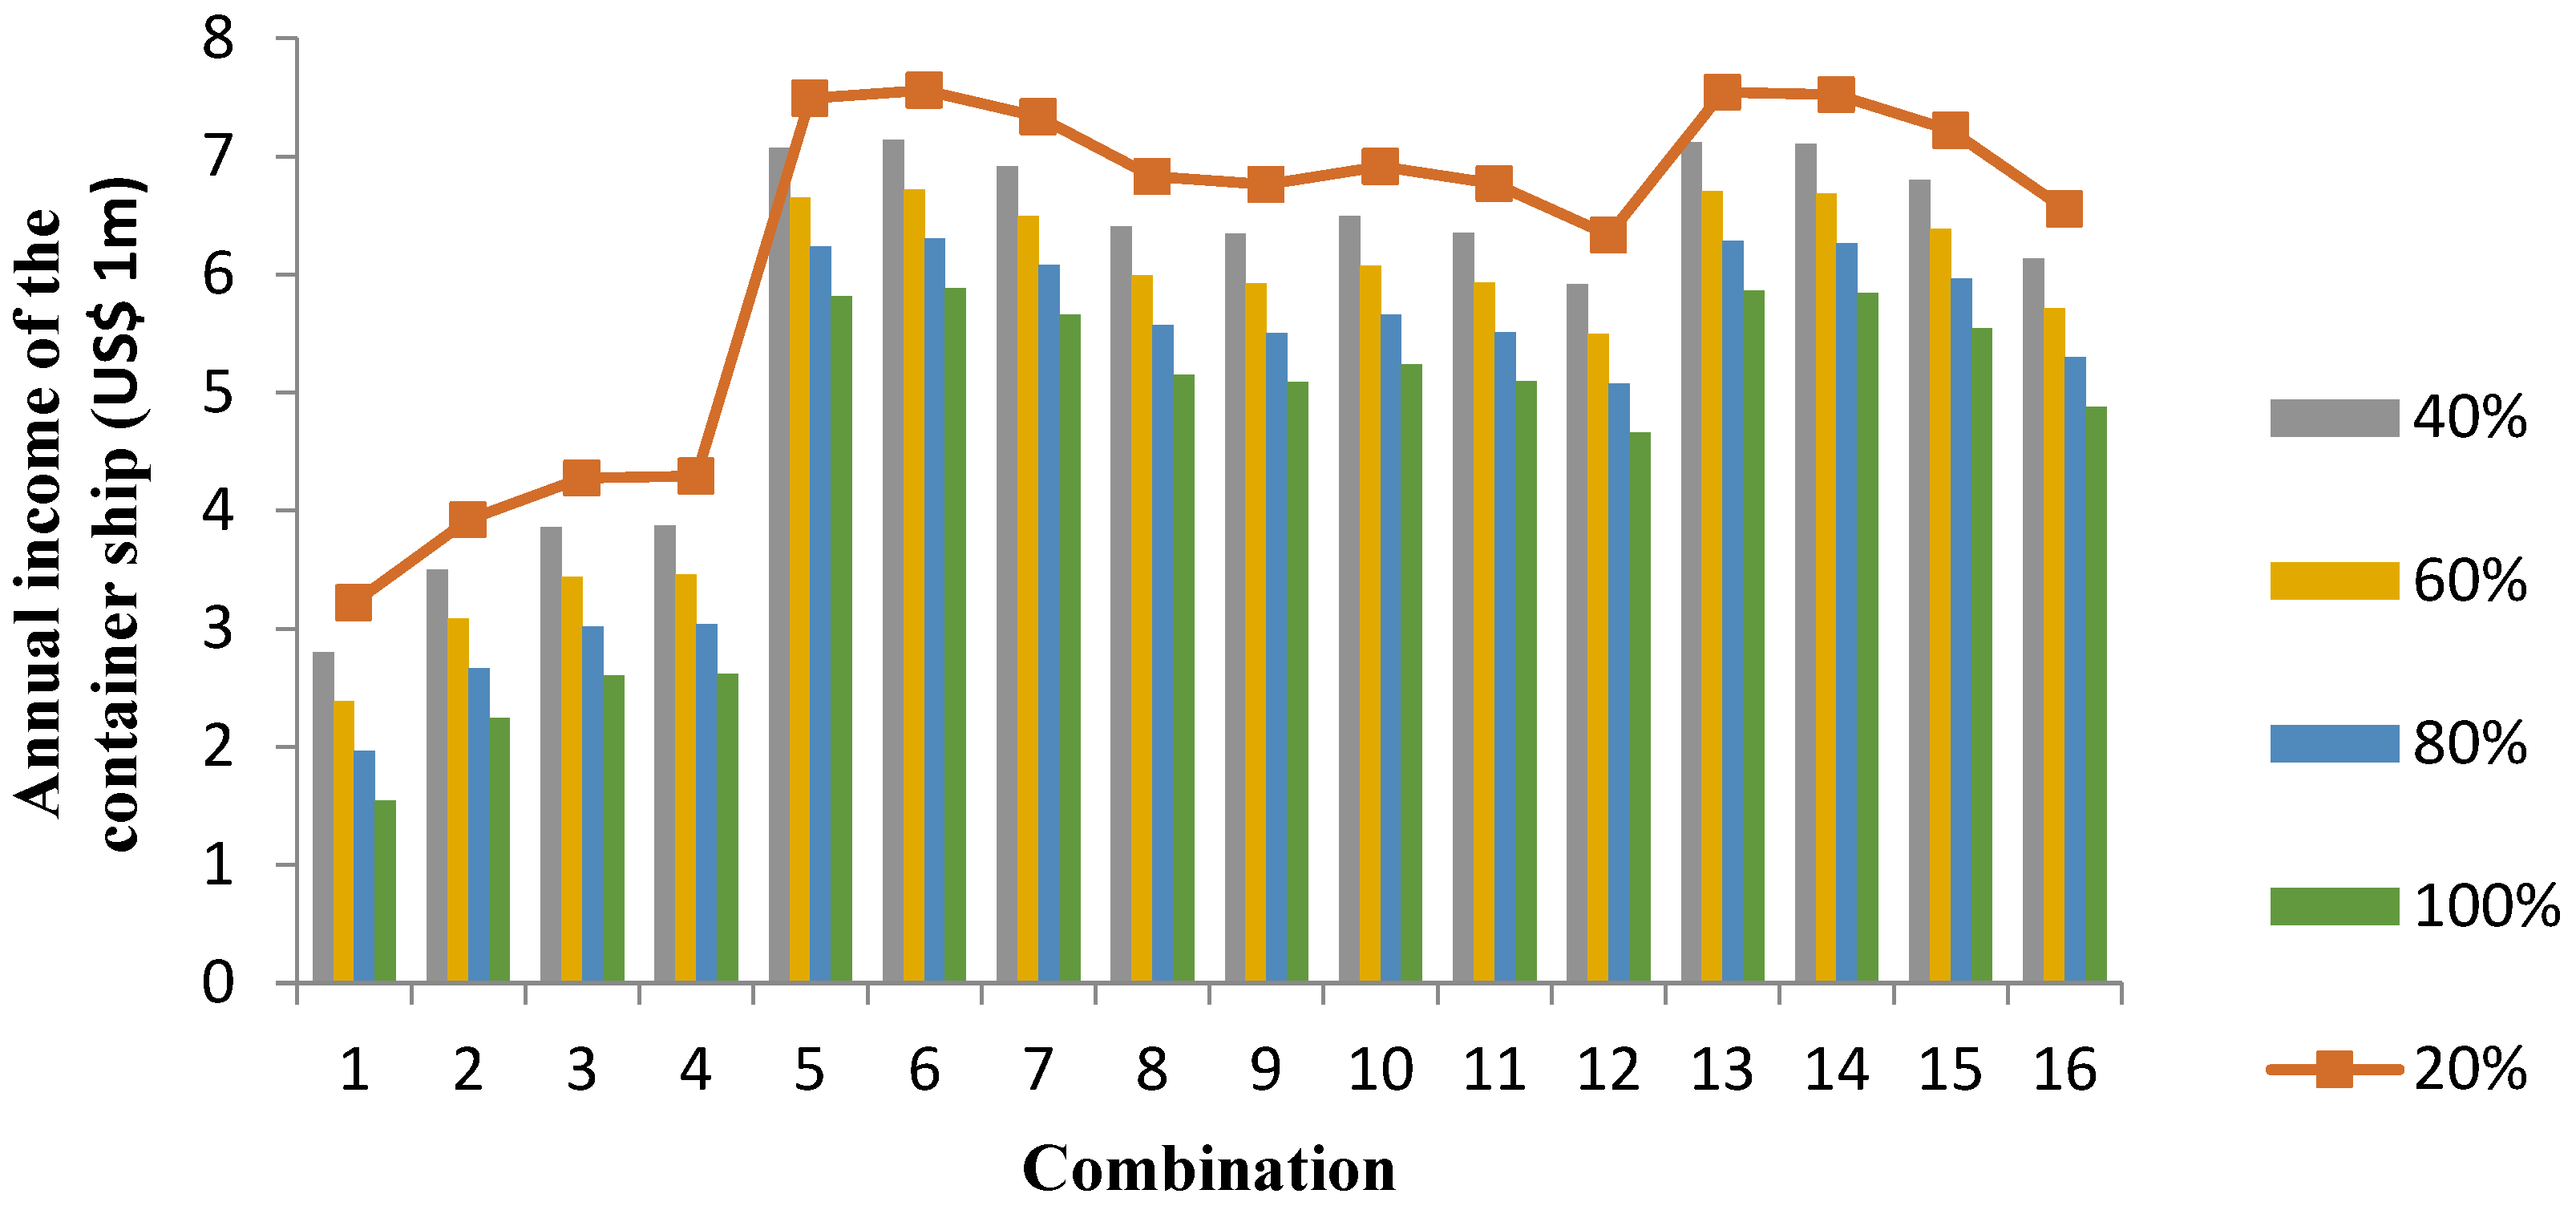
It can be calculated that the original speed of the container ship is 20.002 kn using Equation (5). Without using abatement measures, the corresponding CO2 emissions in 2008 are calculated using Equation (7) to be 139,659.176 tons. Based on the “cap” emission of CO2 and the free quotas set in Table 1, the CO2 emissions in 2008 are used for the calculations shown in Table 4 and Table 5. Meanwhile, OS and its 95.0%, 90.0% and 85.0% rates are used to calculate the results. [22]. On the basis of the corresponding formula, the costs of carbon reduction measures and other costs are first calculated separately under different speed reduction rates, and then the final results are obtained under multiple auction percentages. As a consequence, the final annual net incomes of the container ship in 2030 and 2060 are shown in Table 6 and Table 7, respectively. The corresponding figures are Figure 2 and Figure 3, respectively.

5. Sensitivity Analysis and Discussions

According to Table 8 and Table 9, it can be found that the changes in the maximum annual revenue of the container ship are generally similar under the different scenarios in 2030 and 2060. Accordingly, the discussion of the results and the sensitivity analysis of the parameters are carried out on the basis of carbon peaking.
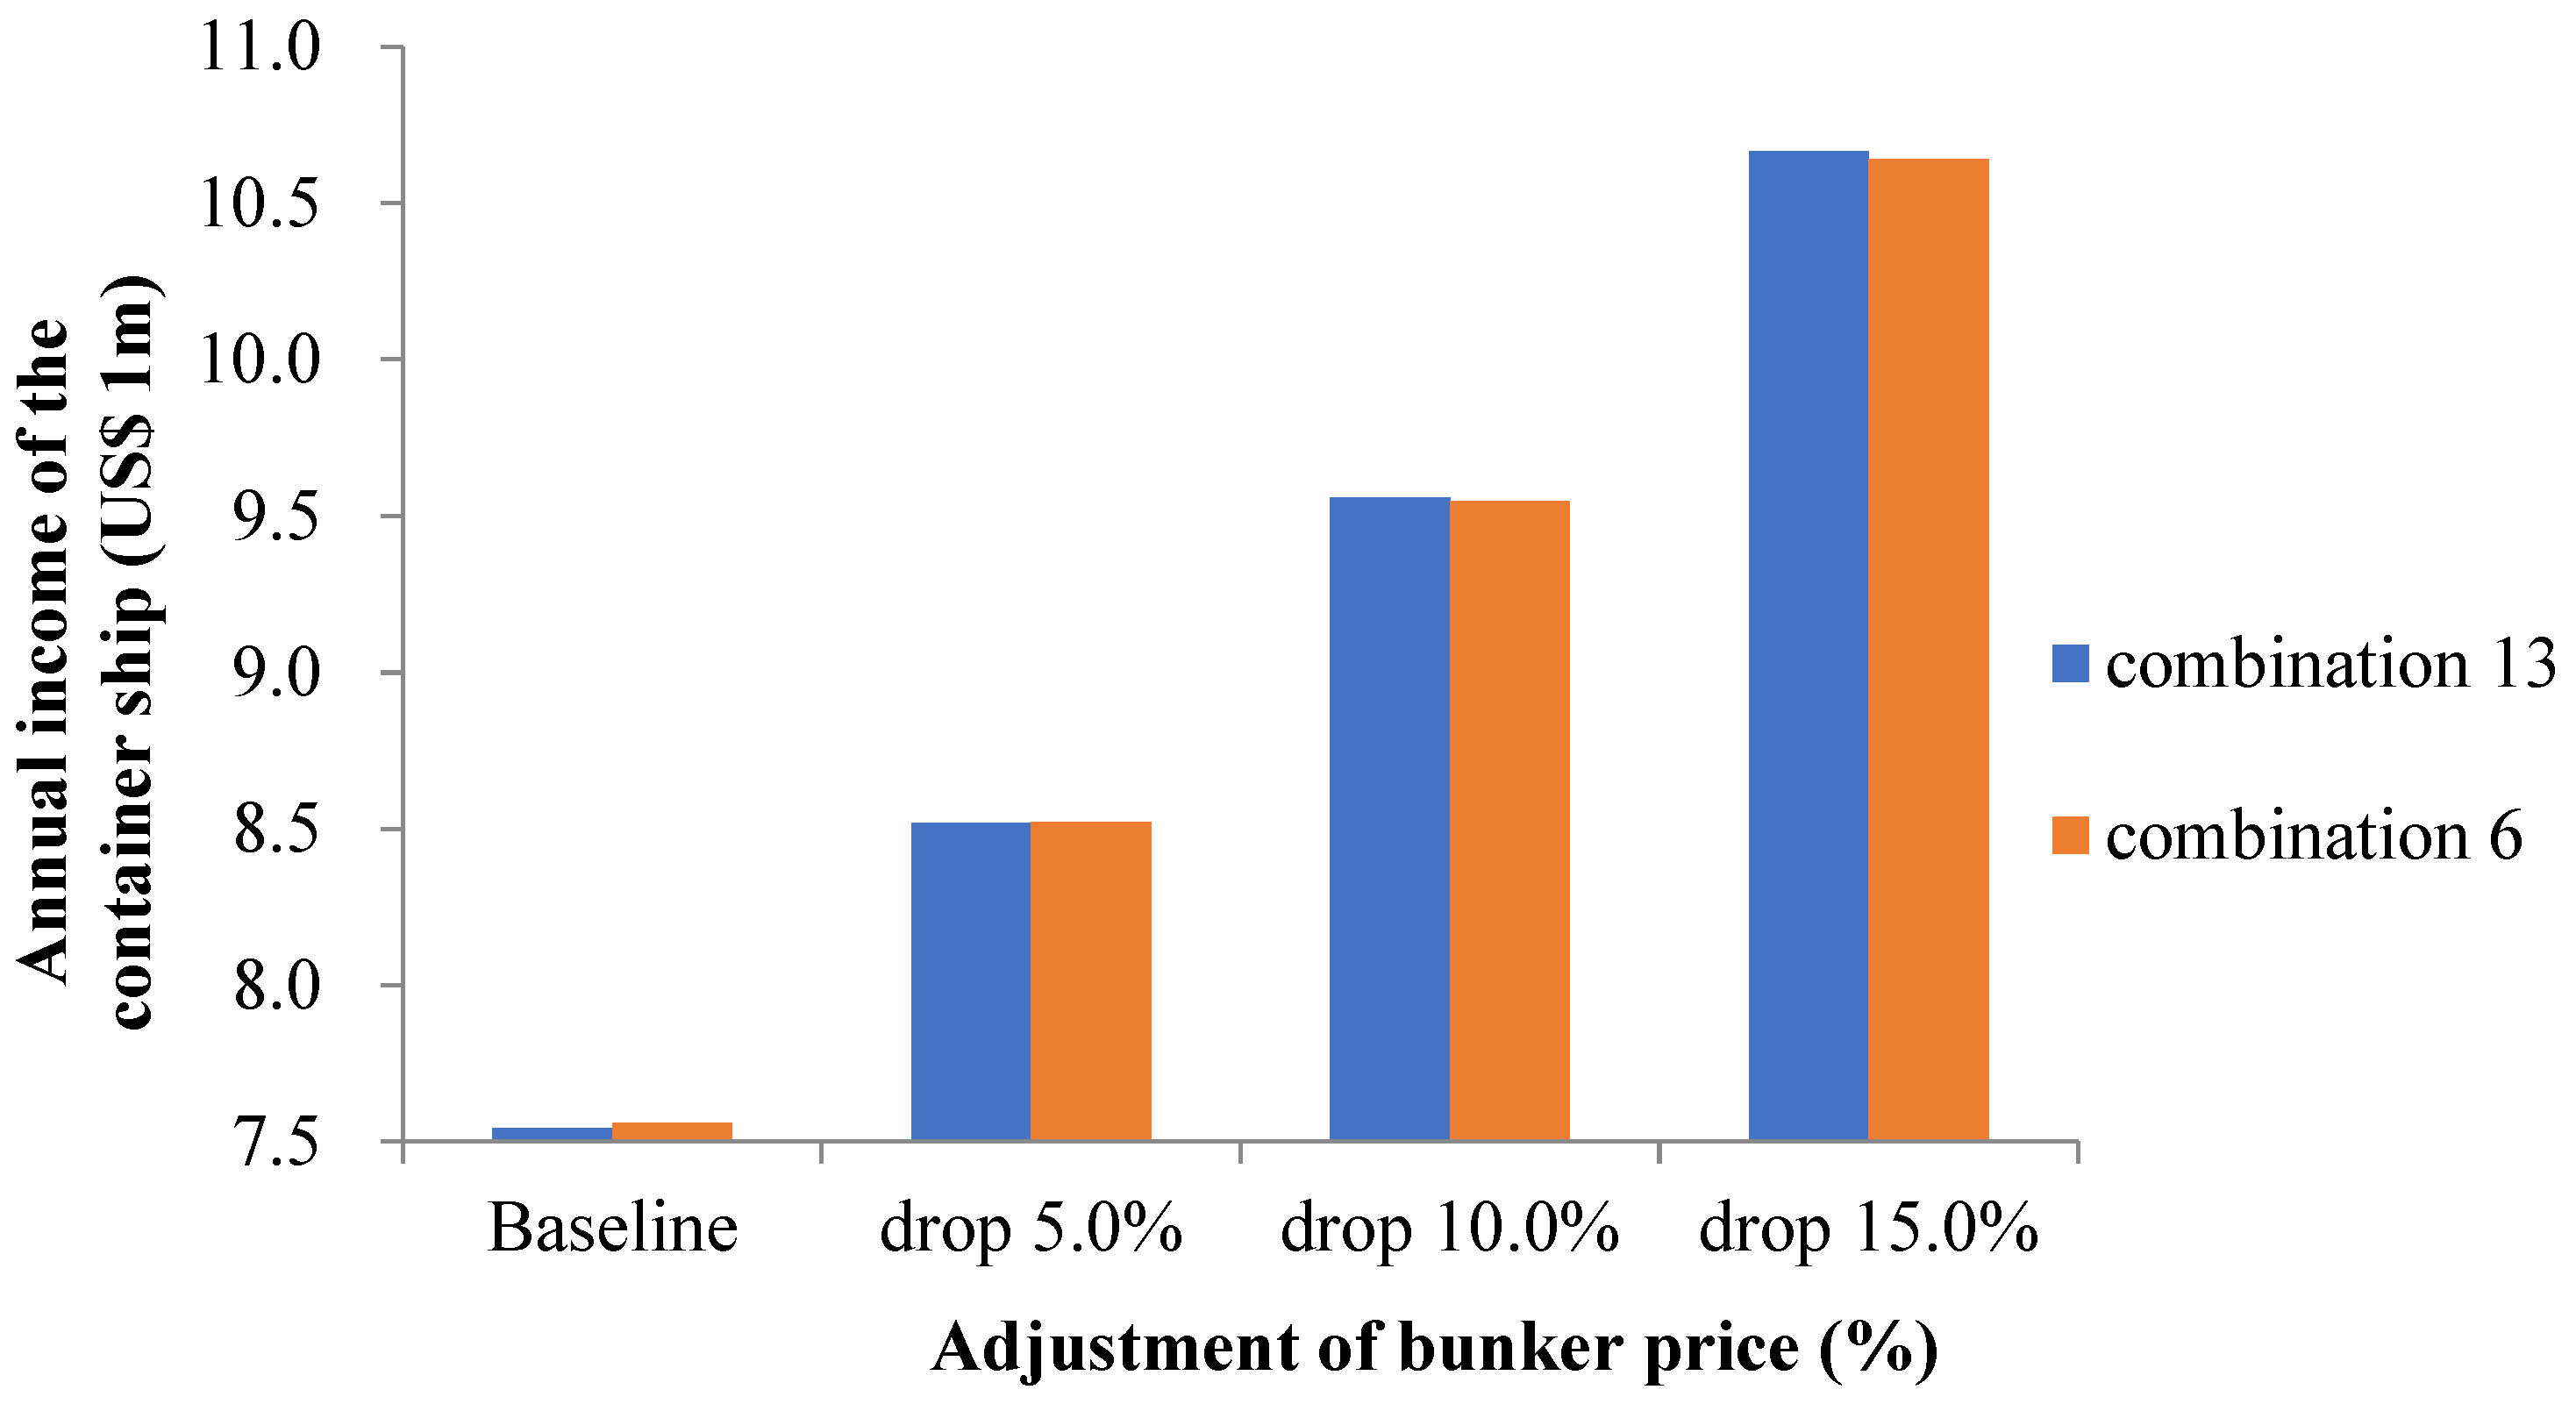
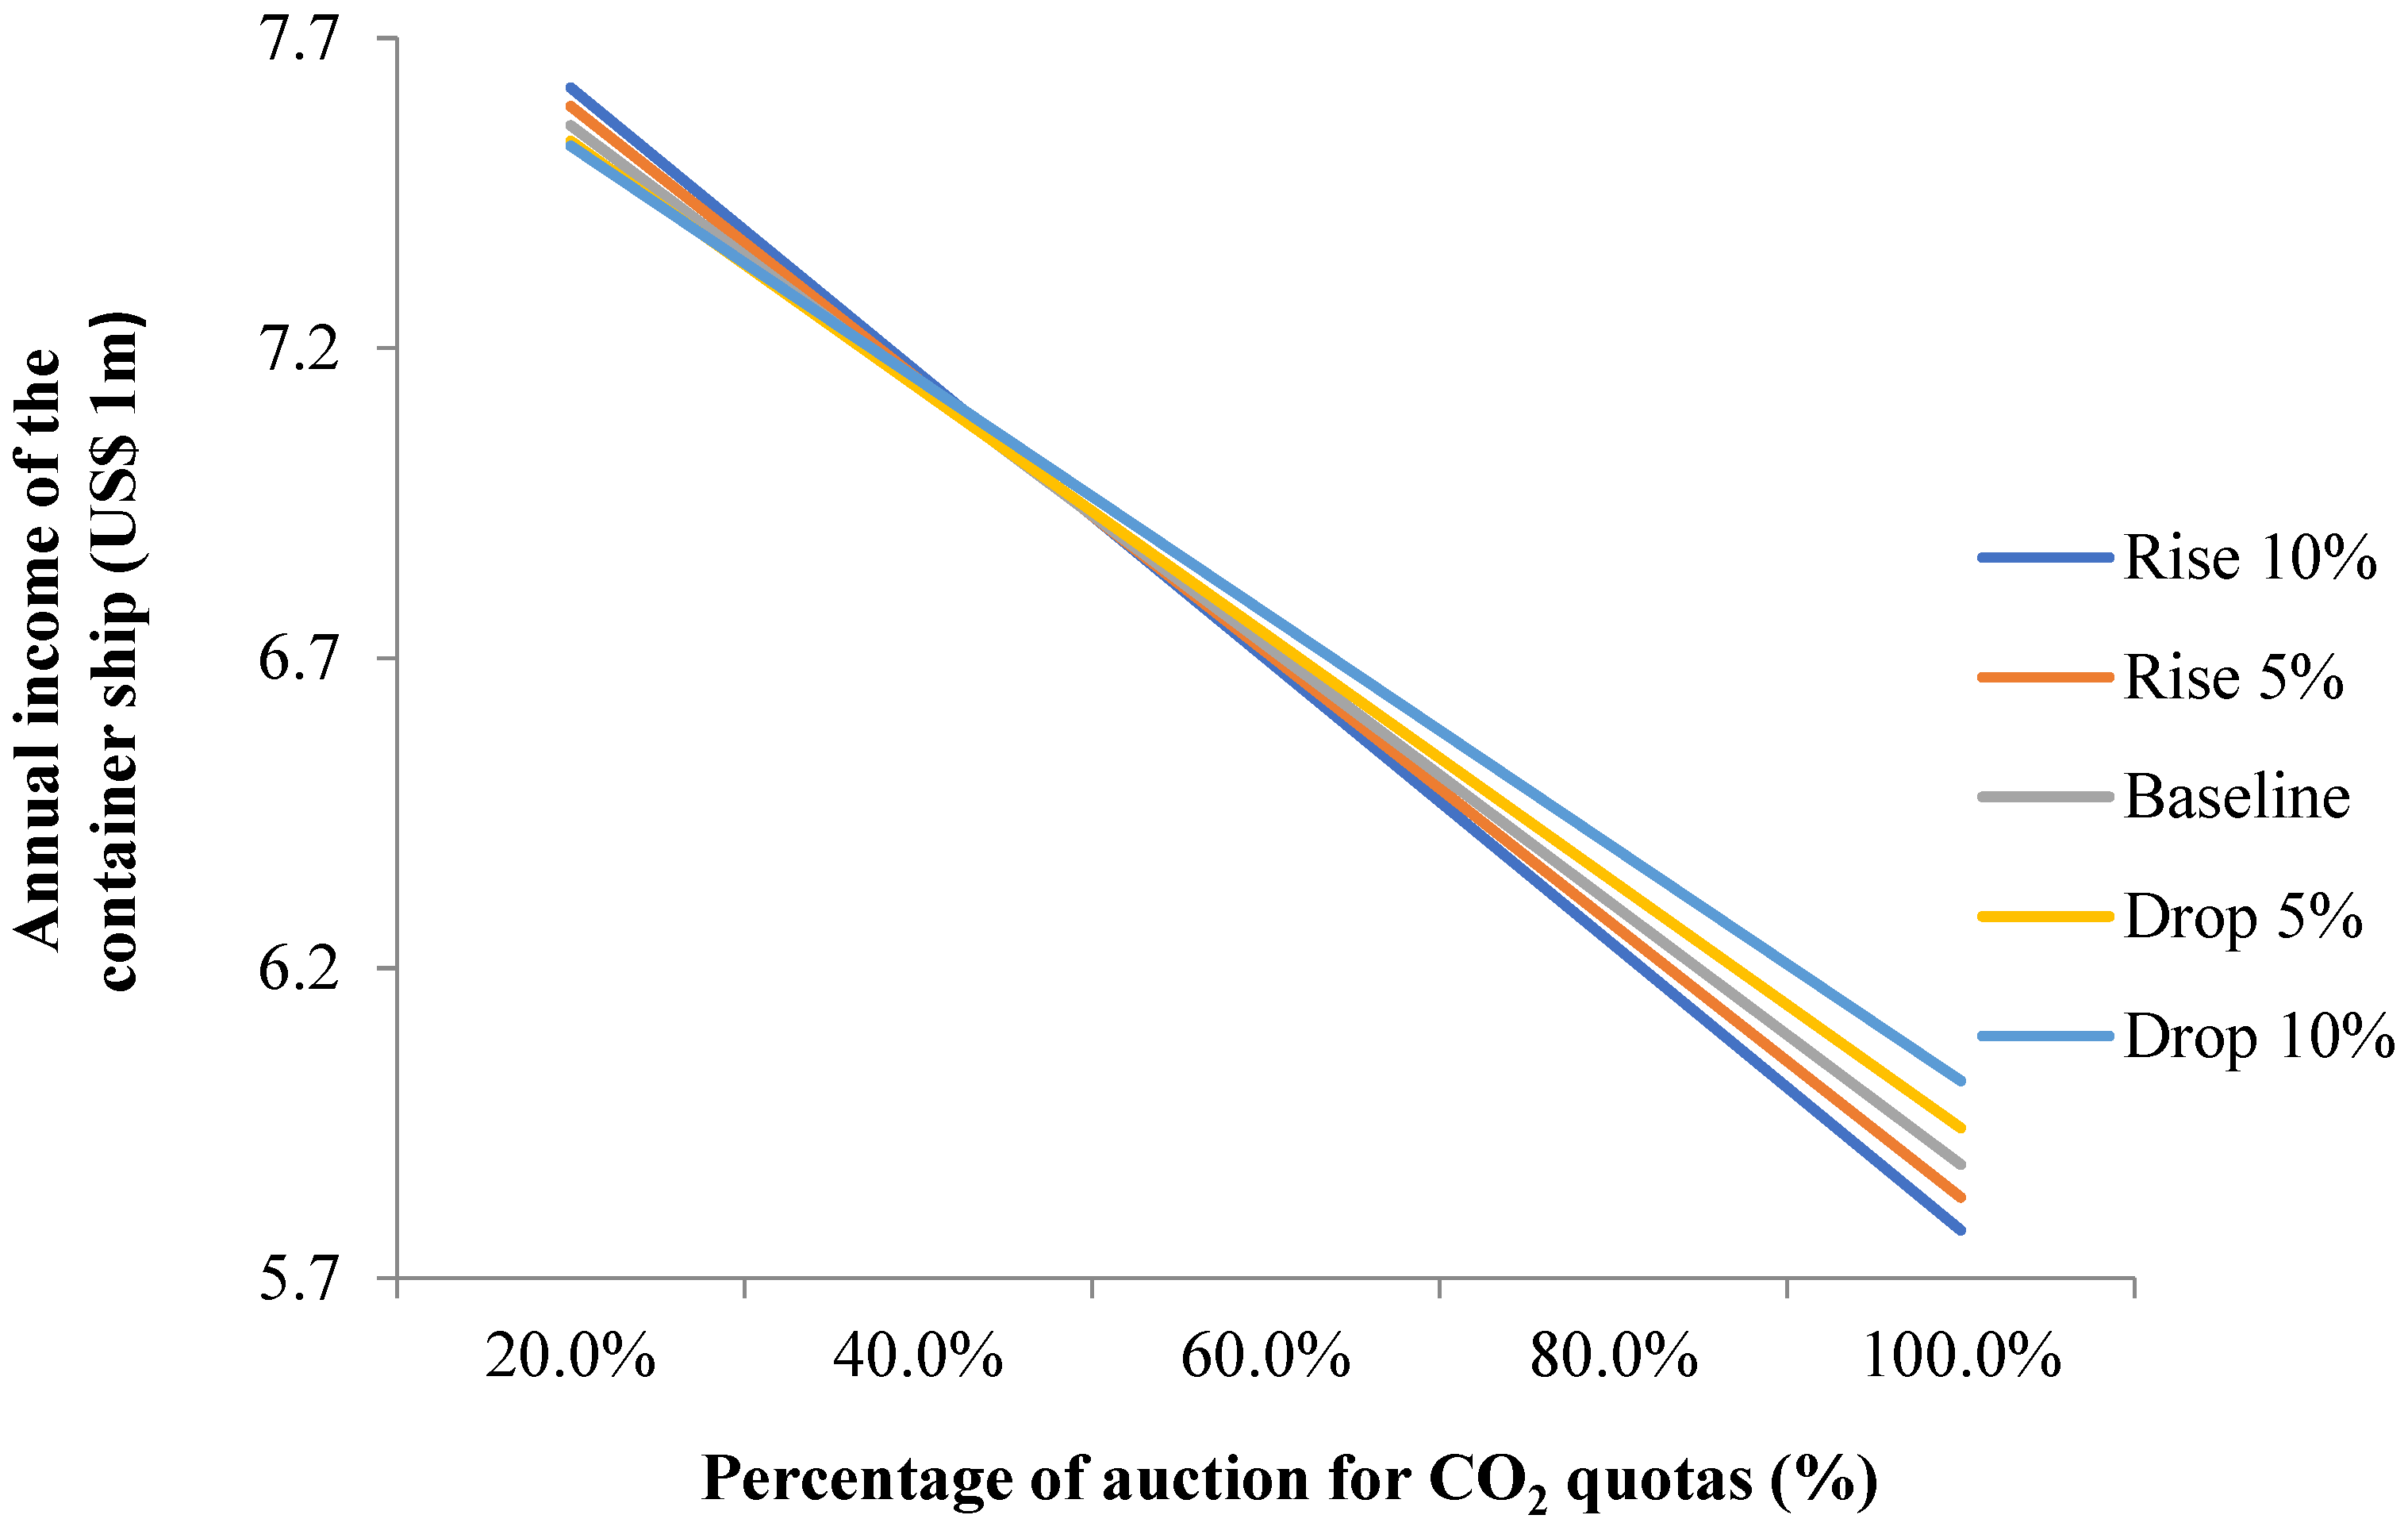
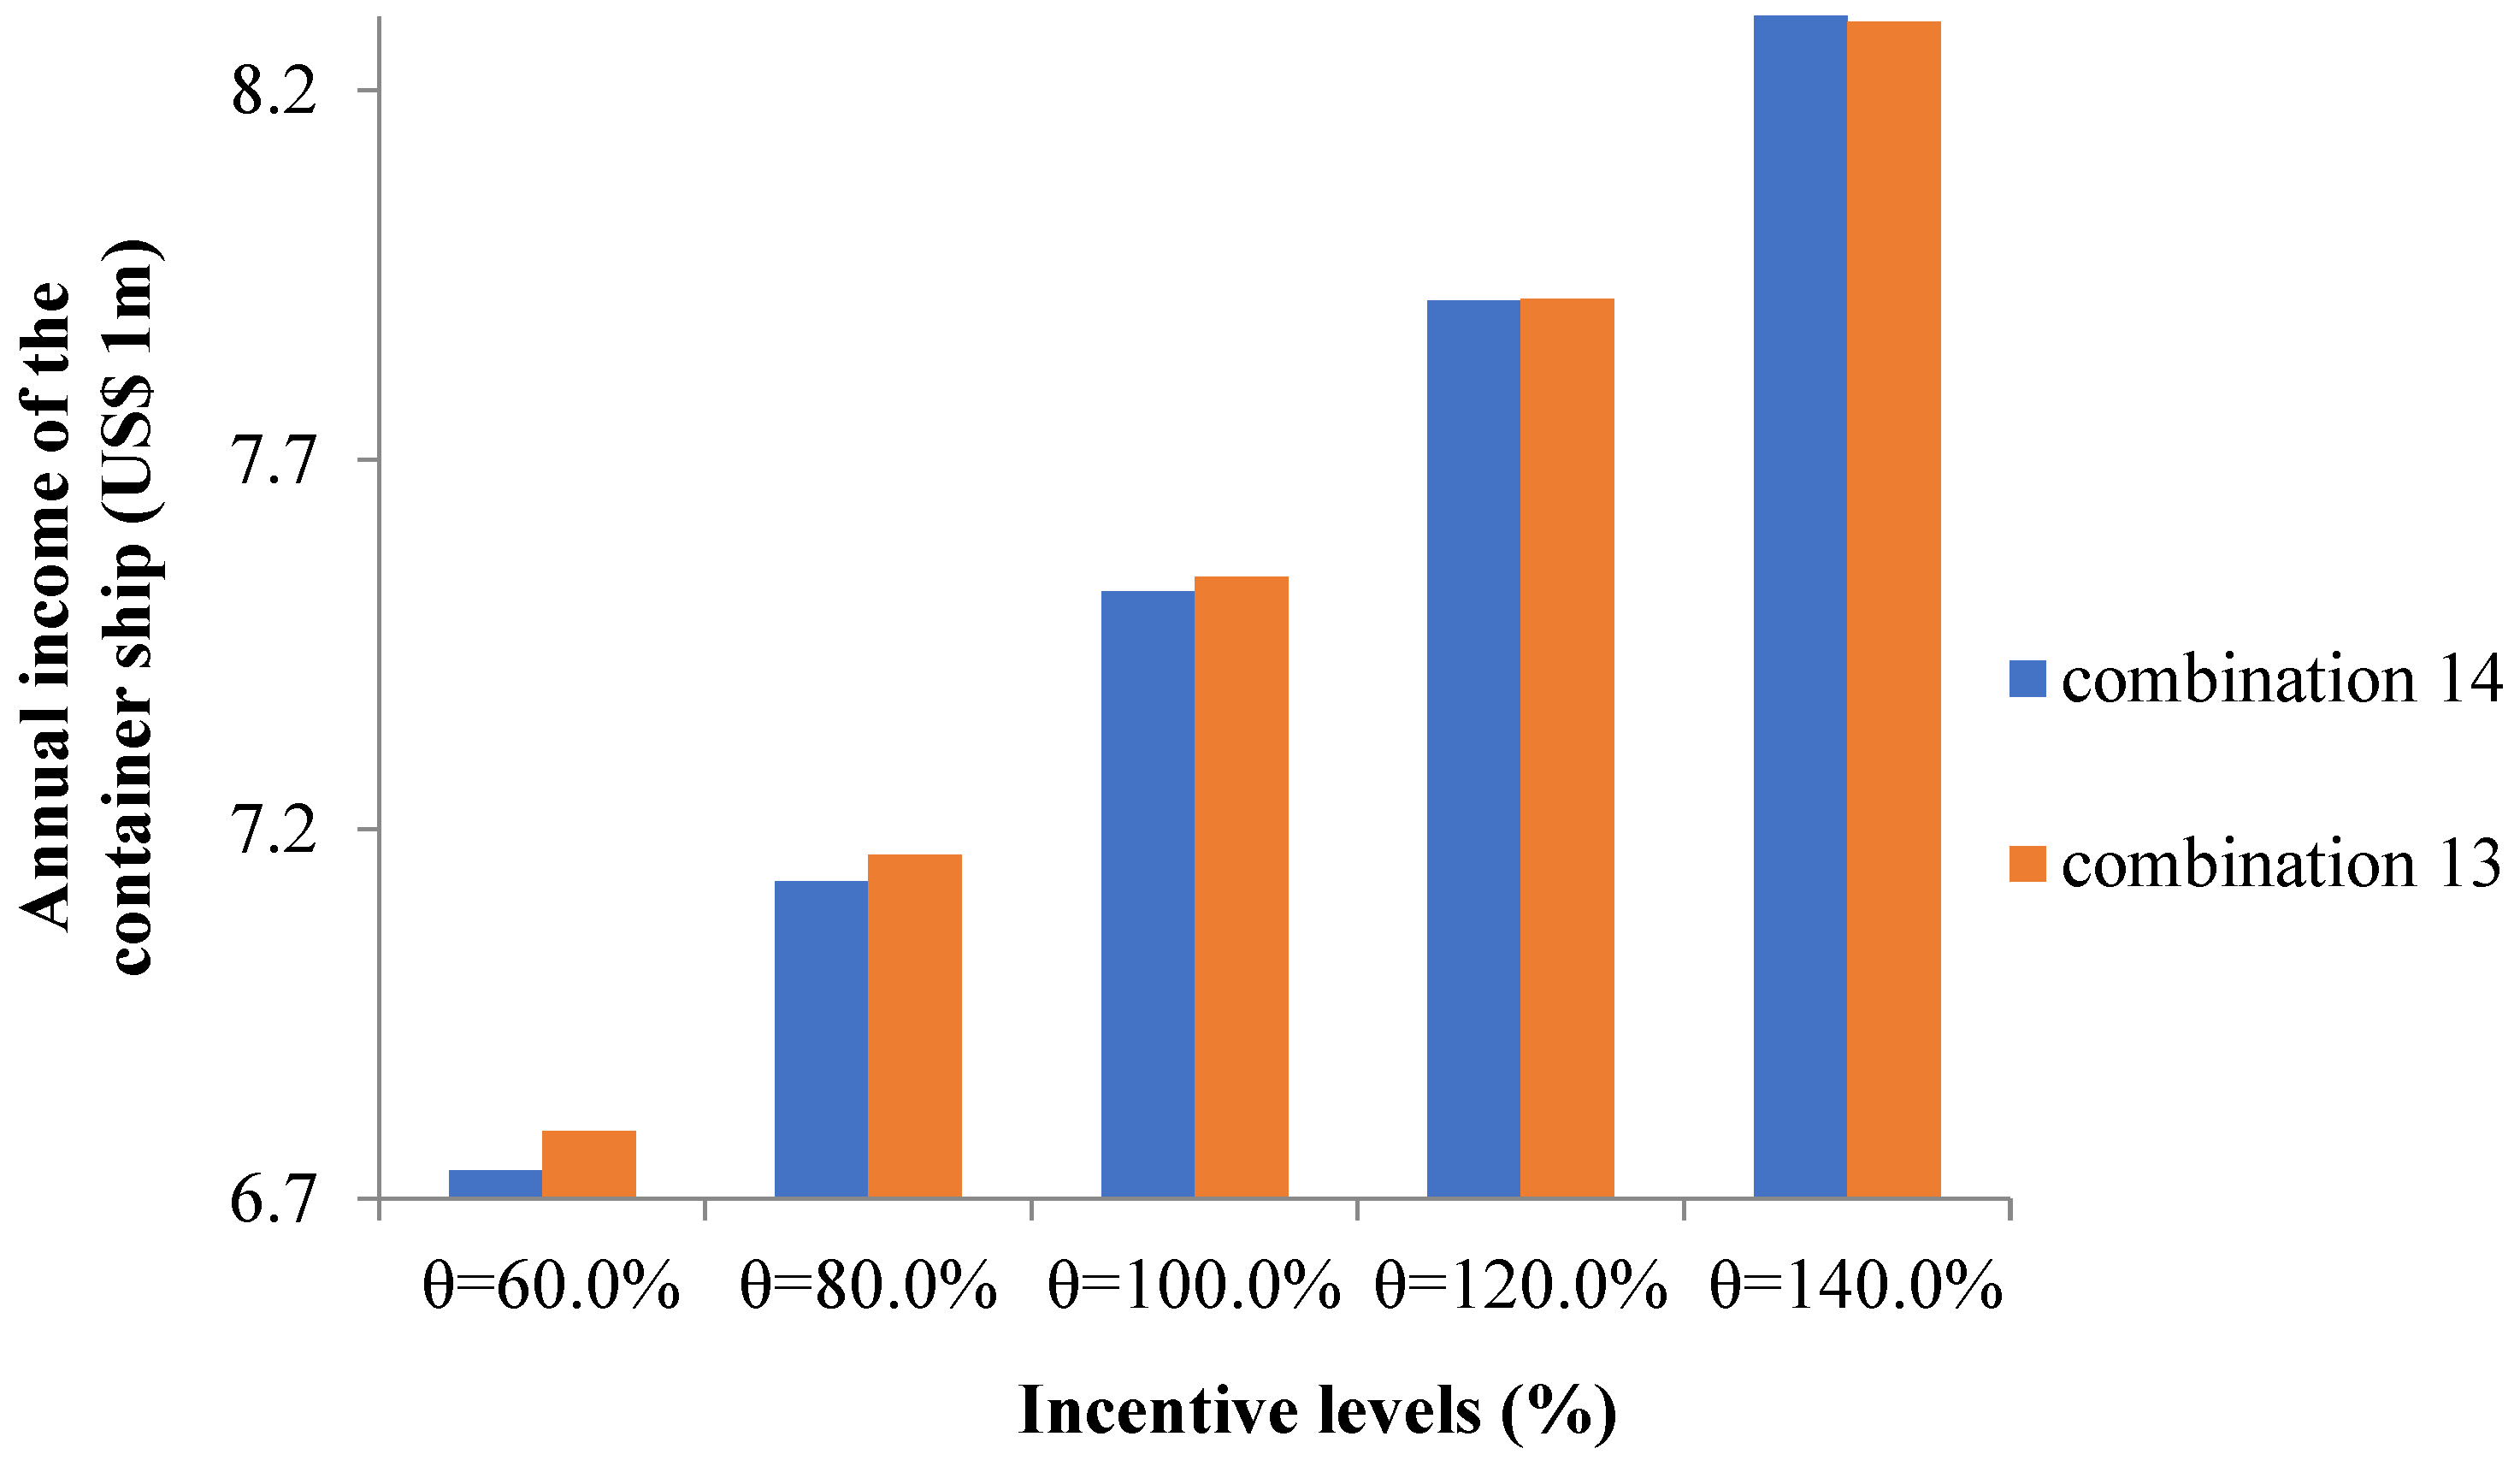
The freight rate, the average loading factor, the bunker price and the carbon auction and purchase prices of carbon are taken as constants. However, the fluctuations in these variables can cause certain impacts on the results. The freight rate and the average loading factor mainly influence the total annual revenue of a container ship. Therefore, this section attempts to estimate the impact on container ships by performing sensitivity analyses on bunker price, as well as on the auction and purchase prices of carbon, under METS. Meanwhile, five kinds of incentive levels are considered, that is, θ = 60.0%, θ = 80.0%, θ = 100.0%, θ = 120.0% and θ = 140.0% [53]. The results of the sensitivity analysis for 5.0%, 10.0% and 15.0% adjustments above and below the bunker price baseline are shown in Table 8. Annual net incomes for combination 6 and combination 13 when the percentage of bunker price drops to a certain point are shown in Figure 4. However, Table 9 shows the sensitivity analysis for calculating the auction and purchase prices of carbon with a 5.0% or 10.0% change in the baseline.The corresponding figure is presented in Figure 5. Finally, the sensitivity analysis of the five incentive levels is presented in Table 10. Figure 6 reflects the annual net income for combination 13 and combination 14 when incentive levels rise. As mentioned above, the annual income decreases as the percentage of auction increases; Figure 4 and Figure 6 choose 20.0% as the percentage of auction.
The results are discussed according to Figure 2 and Figure 3. Our results show that combination 6 (using a WHRS alone and 5.0% of the original speed reduction) is the best, while combination 13 (using a WHRS and a DRC with the original speed) and combination 14 (using a WHRS and a DRC with a 5.0% reduction in the original speed) follow closely behind. The presence of a WHRS in the combination of abatement measures allows the container ship to achieve a greater annual income. Furthermore, the results show that the higher the proportion of CO2 auction quotas, the lower the annual net income in the same combination. However, the proportion of CO2 auction quotas has no impact on the selection of the mitigation measures for the container ship. Hence, these results can help container ship companies choose the most appropriate mitigation measures under carbon peaking and carbon neutrality.
It is clear that combination 14 allows container ships to earn a greater annual income than combination 13 with a continuous increase in bunker prices. When bunker prices and the auction and purchase prices of carbon rise, combination 6 remains the best mitigation measure. However, Figure 4 shows the annual net income for combination 6 and combination 13 when the percentage of bunker prices falls to a certain level. In such a situation, the container ship companies are inclined to select combination 13 to obtain the maximum annual income. As shown in Figure 5, the auction and purchase prices of carbon that bring the optimal income for container ships vary at different auction ratios. Table 10 shows that combination 6 is the better choice for container ship companies at these five incentive levels. However, with increasing incentive levels, combination 14 is more likely to be chosen by container ship companies than combination 13. This is reflected in Figure 6.

6. Conclusions

This paper explores the optimal CO2 reduction measures for container ship companies under the Maritime Emissions Trading Scheme (METS) to comply with the CO2 emission policy in the context of carbon peaking and carbon neutrality.
Our results show that combination 6 (using a WHRS alone and a 5.0% reduction in the original speed) is the most suitable solution for container ship companies with the selected values of parameters. The presence of a WHRS in the combination of abatement measures allows the container ship to achieve a greater annual income. Based on the results, the proportion of CO2 auction quotas has no impact on the selection of mitigation measures for container ships. To show a more clear analysis, sensitivity analyses are discussed. From the sensitivity analysis, it is found that a WHRS exists for the optimal combination of abatement measures within the fluctuation range of the parameters. When the bunker prices fluctuate up or down by 5.0%, it has no effect on the selection of the optimal combination for container ships. As the incentive level continues to increase, it is more likely that container ship companies choose to make a 5.0% speed reduction. The discussion and sensitivity analysis show the importance of installing a WHRS, which has practical implications for container companies.
However, there are also deficiencies in this paper that need to be further studied. Firstly, an 8000-TEU container ship and the Asia–North Europe route may not be able to reflect all types of ships and routes. Secondly, the cost calculation of the WHRS or DRC and the reward and penalty mechanism are not comprehensive. Therefore, a more detailed and comprehensive analysis of the above deficiencies remains to be explored in future studies, for example, considering various types of container ships and other routes. We leave this for future studies to further improve the emission reduction and annual net income of container ships under carbon peaking and carbon neutrality.

Author Contributions

Conceptualization, D.H.; methodology, Y.W. and D.H.; software, Y.W.; validation, D.H. and C.Y.; formal analysis, Y.W.; investigation, Y.W.; resources, D.H.; data curation, Y.W.; writing—original draft preparation, Y.W.; writing—review and editing, D.H. and C.Y.; visualization, Y.W.; supervision, D.H.; project administration, D.H.; funding acquisition, D.H. All authors have read and agreed to the published version of the manuscript.

Funding

This research was funded by [the National Key Research and Development Program of China #1] under Grant [No. 2021YFC2801005] and [Ministry of Education in China #2] under Grant [No. 19YJCGJW003]. And The APC was funded by [No. 19YJCGJW003].

Institutional Review Board Statement

Not applicable.

Informed Consent Statement

Not applicable.

Data Availability Statement

The data presented in this study are available on request from the corresponding author. The data are not publicly available due to privacy.

Conflicts of Interest

The authors declare no conflict of interest.

Abbreviations

IMOInternational Maritime Organization
WHRSWaste Heat Recovery System
DRCDrag Reduction Coatings
SSSlow Steaming
METSMaritime Emissions Trading Scheme
MBMsMarket-Based Measures
EEDIEnergy Efficiency Design Index
SEEMPShip Energy Efficiency Management Plan
LNGLiquefied Natural Gas
AFAntifouling
GHGGreenhouse Gas
ETSEmissions Trading Scheme
EU ETSEuropean Union Emissions Trading System
CCSCarbon Capture and Storage
CATCHCost of Averting a Tonne of CO2-eq Heating
TEUTwenty-feet Equivalent Unit
OSOriginal Speed

References

  1. Xiao, G.; Wang, T.; Chen, X.; Zhou, L. Evaluation of Ship Pollutant Emissions in the Ports of Los Angeles and Long Beach. J. Mar. Sci. Eng. 2022, 10, 1206. [Google Scholar] [CrossRef]
  2. Huang, D.; Hua, Y.; Loughney, S.; Blanco-Davis, E.; Wang, J. Lifespan cost analysis of alternatives to global sulphur emission limit with uncertainties. Proc. IMechE Part M J. Eng. Marit. Environ. 2021, 235, 921–930. [Google Scholar] [CrossRef]
  3. IMO. Third IMO GHG Study; IMO: London, UK, 2014. [Google Scholar]
  4. Huang, Z.; Shi, X.; Wu, J.; Hu, H.; Zhao, J. Optimal annual net income of a containership using CO2 reduction measures under a marine emissions trading scheme. Transp. Lett. 2015, 7, 24–34. [Google Scholar] [CrossRef]
  5. Kageson, P. Linking CO2 Emissions from International Shipping to the EU ETS; Federal Environment Agency: Dessau-Roßlau, Germany, 2007.
  6. Corbett, J.J.; Wang, H.; Winebrake, J.J. The effectiveness and costs of speed reductions on emissions from international shipping. Transp. Res. Part D Transp. Environ. 2009, 14, 593–598. [Google Scholar] [CrossRef]
  7. Doukas, H.; Spiliotis, E.; Jafari, M.A.; Giarola, S.; Nikas, A. Low-cost emissions cuts in container shipping: Thinking inside the box. Transp. Res. Part D Transp. Environ. 2021, 94, 102815. [Google Scholar] [CrossRef]
  8. Paris Agreement. United Nations Treaty Collection. Available online: https://unfccc.int/files/essential_background/convention/application/pdf/english_paris_agreement.pdf (accessed on 12 November 2022).
  9. Farkas, A.; Degiuli, N.; Martić, I.; Vujanović, M. Greenhouse gas emissions reduction potential by using antifouling coatings in a maritime transport industry. J. Clean. Prod. 2021, 295, 126428. [Google Scholar] [CrossRef]
  10. IMO. Initial IMO Strategy on Reduction of GHG Emissions from Ships, MEPC72/17; IMO: London, UK, 2018. [Google Scholar]
  11. IPCC. Global Warming of 1.5 °C. An IPCC Special Report on the Impacts of Global Warming of 1.5 °C above Pre-Industrial Levels and Related Global Greenhouse Gas Emission Pathways, Mitigation Pathways Compatible with 1.5 °C in the Context of Sustainable Development. Available online: https://www.ipcc.ch/sr15/ (accessed on 17 October 2022).
  12. Huang, M.T.; Zhai, P.M. Achieving Paris Agreement temperature goals requires carbon neutrality by middle century with far-reaching transitions in the whole society. Adv. Clim. Chang. Res. 2021, 12, 281–286. [Google Scholar] [CrossRef]
  13. Lu, C.; Wang, B.; Chen, T.; Yang, J. A Document Analysis of Peak Carbon Emissions and Carbon Neutrality Policies Based on a PMC Index Model in China. Int. J. Environ. Res. Public Health 2022, 19, 9312. [Google Scholar] [CrossRef]
  14. Xu, G.; Dong, H.; Xu, Z.; Bhattarai, N. China can reach carbon neutrality before 2050 by improving economic development quality. Energy 2022, 243, 123087. [Google Scholar] [CrossRef]
  15. Sun, Y.; Liu, S.; Li, L. Grey Correlation Analysis of Transportation Carbon Emissions under the Background of Carbon Peak and Carbon Neutrality. Energies 2022, 15, 3064. [Google Scholar] [CrossRef]
  16. Psaraftis, H.N. Market-based measures for greenhouse gas emissions from ships: A review. WMU J. Marit. Aff. 2012, 11, 211–232. [Google Scholar] [CrossRef] [Green Version]
  17. IMO. Amendments to the Annex of the Protocol of 1997 to Amend the International Convention for the Prevention of Pollution from Ships, 1973, as Modified by the Protocol of 1978 Relating Thereto, (Inclusion of Regulations on Energy Efficiency for Ships in MARPOL Annex VI); MEPC.203(62); IMO: London, UK, 2011. [Google Scholar]
  18. IMO. Adoption of the Initial IMO Strategy on Reduction of GHG Emissions from Ships and Existing IMO Activity Related to Reducing GHG Emissions in the Shipping Sector. Available online: https://unfccc.int/sites/default/files/resource/250_IMO%20submission_Talanoa%20Dialogue_April%202018.pdf (accessed on 27 November 2021).
  19. Peng, C. Technical Analysis of Ship Waste Heat Recovery System. Ship Eng. 2022, 44, 84–87+178. [Google Scholar]
  20. Schwartz, H.; Gustafsson, M.; Spohr, J. Emission abatement in shipping—Is it possible to reduce carbon dioxide emissions profitably? J. Clean. Prod. 2020, 254, 120069. [Google Scholar] [CrossRef]
  21. Gu, Y.; Wallace, S.W.; Wang, X. Can an Emission Trading Scheme really reduce CO2 emissions in the short term? Evidence from a maritime fleet composition and deployment model. Transp. Res. Part D Transp. Environ. 2019, 74, 318–338. [Google Scholar] [CrossRef] [Green Version]
  22. Huang, Z.; Shi, X.; Wu, J.; Hu, H.; Zhao, J. How Will the Marine Emissions Trading Scheme Influence the Profit and CO2 Emissions of a Containership. Lect. Notes Comput. Sci. 2013, 8197, 45–57. [Google Scholar]
  23. IMO. Second IMO GHG Study; IMO: London, UK, 2009. [Google Scholar]
  24. Rehmatulla, N.; Calleya, J.; Smith, T. The implementation of technical energy efficiency and CO2 emission reduction measures in shipping. Ocean Eng. 2017, 139, 184–197. [Google Scholar] [CrossRef]
  25. Waste Heat Recovery Systems. Available online: https://glomeep.imo.org/technology/waste-heat-recovery-systems/ (accessed on 18 January 2023).
  26. Shu, G.; Liang, Y.; Wei, H.; Tian, H.; Zhao, J.; Liu, L. A review of waste heat recovery on two-stroke IC engine aboard ships. Renew. Sustain. Energy Rev. 2013, 19, 385–401. [Google Scholar] [CrossRef]
  27. Hao, J.; Qiang, Z.; Shi, J.; Suo, S.; Xiao, L. Research on response measures for ship emission reduction and energy saving. Ship Sci. Technol. 2012, 34, 3–10. [Google Scholar]
  28. Ampah, J.D.; Yusuf, A.A.; Afrane, S.; Jin, C.; Liu, H. Reviewing two decades of cleaner alternative marine fuels: Towards IMO’s decarbonization of the maritime transport sector. J. Clean. Prod. 2021, 320, 128871. [Google Scholar] [CrossRef]
  29. Balcombe, P.; Brierley, J.; Lewis, C.; Skatvedt, L.; Speirs, J.; Hawkes, A.; Staffell, I. How to decarbonise international shipping: Options for fuels, technologies and policies. Energy Convers. Manag. 2019, 182, 72–88. [Google Scholar] [CrossRef]
  30. Eide, M.S.; Endresen, Ø.; Skjong, R.; Longva, T.; Alvik, S. Cost-effectiveness assessment of CO2 reducing measures in shipping. Marit. Policy Manag. 2009, 36, 367–384. [Google Scholar] [CrossRef]
  31. Beşikçi, E.B.; Arslan, O.; Turan, O.; Ölçer, A.I. An artificial neural network based decision support system for energy efficient ship operations. Comput. Oper. Res. 2016, 66, 393–401. [Google Scholar] [CrossRef] [Green Version]
  32. Serra, P.; Fancello, G. Towards the IMO’s GHG Goals: A Critical Overview of the Perspectives and Challenges of the Main Options for Decarbonizing International Shipping. Sustainability 2020, 12, 3220. [Google Scholar] [CrossRef] [Green Version]
  33. Xing, H.; Spence, S.; Chen, H. A comprehensive review on countermeasures for CO2 emissions from ships. Renew. Sustain. Energy Rev. 2020, 134, 110222. [Google Scholar] [CrossRef]
  34. Cullinane, K.; Yang, J. Evaluating the Costs of Decarbonizing the Shipping Industry: A Review of the Literature. J. Mar. Sci. Eng. 2022, 10, 946. [Google Scholar] [CrossRef]
  35. Wan, Z.; Makhloufi, A.E.; Chen, Y.; Tang, J. Decarbonizing the international shipping industry: Solutions and policy recommendations. Mar. Pollut. Bull. 2018, 126, 428–435. [Google Scholar] [CrossRef] [Green Version]
  36. Li, B. CO2 emission reduction through Speed Optimization with Management Performance Analyzed. Mar. Technol. 2021, 73–74+77. [Google Scholar]
  37. Psaraftis, H.N.; Kontovas, C.A. Ship speed optimization: Concepts, models and combined speed-routing scenarios. Transp. Res. Part C Emerg. Technol. 2014, 44, 52–69. [Google Scholar] [CrossRef] [Green Version]
  38. Cariou, P. Is slow steaming a sustainable means of reducing CO2 emissions from container shipping? Transp. Res. Part D Transp. Environ. 2011, 16, 260–264. [Google Scholar] [CrossRef]
  39. Lagouvardou, S.; Psaraftis, H.N.; Zis, T. A Literature Survey on Market-Based Measures for the Decarbonization of Shipping. Sustainability 2020, 12, 3953. [Google Scholar] [CrossRef]
  40. International Carbon Action Partnership. EU Emissions Trading System (EU ETS). Available online: https://icapcarbonaction.com/en/?option=com_etsmap&task=export&format=pdf&layout=list&systems%5B%5D=43 (accessed on 4 December 2021).
  41. European Council and Council of the European Union. European Green Deal, Fit for 55. Available online: https://www.consilium.europa.eu/en/policies/green-deal/fit-for-55-the-eu-plan-for-a-green-transition/ (accessed on 21 November 2022).
  42. Wang, K.; Fu, X.; Luo, M. Modeling the impacts of alternative emission trading schemes on international shipping. Transp. Res. Part A Policy Pract. 2015, 77, 35–49. [Google Scholar] [CrossRef] [Green Version]
  43. Zhu, M.; Yuen, K.F.; Ge, J.W.; Li, K.X. Impact of maritime emissions trading system on fleet deployment and mitigation of CO2 emission. Transp. Res. Part D Transp. Environ. 2018, 62, 474–488. [Google Scholar] [CrossRef]
  44. Wit, R.C.N.; Boon, B.H.; Van Velzen, A.; Cames, M.; Deuber, O.; Lee, D.S. Giving Wings to Emission Trading-Inclusion of Aviation under the European Emission Trading System (ETS): Design and Impacts; CE Delft: Delft, The Netherlands, 2005. [Google Scholar]
  45. Damartzis, T.; Asimakopoulou, A.; Koutsonikolas, D.; Skevis, G.; Georgopoulou, C.; Dimopoulos, G.; Nikolopoulos, L.; Bougiouris, K.; Richter, H.; Lubenau, U.; et al. Solvents for Membrane-Based Post-Combustion CO2 Capture for Potential Application in the Marine Environment. Appl. Sci. 2022, 12, 6100. [Google Scholar] [CrossRef]
  46. Mallouppas, G.; Yfantis, E.A. Decarbonization in Shipping Industry: A Review of Research, Technology Development, and Innovation Proposals. J. Mar. Sci. Eng. 2021, 9, 415. [Google Scholar] [CrossRef]
  47. Bui, M.; Adjiman, C.S.; Bardow, A.; Anthony, E.J.; Boston, A.; Brown, S.; Fennell, P.S.; Fuss, S.; Galindo, A.; Hackett, L.A.; et al. Carbon capture and storage (CCS): The way forward. Energy Environ. Sci. 2018, 11, 1062–1176. [Google Scholar] [CrossRef] [Green Version]
  48. Li, X.; Chu, J. On Measures of Carbon Emission Reduction for Ship Products. Ship Boat 2022, 33, 28–36. [Google Scholar]
  49. Yuan, J.; Nian, V.; He, J.; Yan, W. Cost-effectiveness analysis of energy efficiency measures for maritime shipping using a metamodel based approach with different data sources. Energy 2019, 189, 116205. [Google Scholar] [CrossRef]
  50. Halim, R.A.; Kirstein, L.; Merk, O.; Martinez, L.M. Decarbonization Pathways for International Maritime Transport: A Model-Based Policy Impact Assessment. Sustainability 2018, 10, 2243. [Google Scholar] [CrossRef] [Green Version]
  51. Bouman, E.A.; Lindstad, E.; Rialland, A.I.; Strømman, A.H. State-of-the-art technologies, measures, and potential for reducing GHG emissions from shipping—A review. Transp. Res. Part D Transp. Environ. 2017, 52, 408–421. [Google Scholar] [CrossRef]
  52. Masodzadeh, P.G.; Ölçer, A.I.; Ballini, F.; Christodoulou, A. A review on barriers to and solutions for shipping decarbonization: What could be the best policy approach for shipping decarbonization? Mar. Pollut. Bull. 2022, 184, 114008. [Google Scholar] [CrossRef]
  53. Qiu, R.; Xu, J.; Xie, H.; Zeng, Z.; Lv, C. Carbon tax incentive policy towards air passenger transport carbon emissions reduction. Transp. Res. Part D Transp. Environ. 2020, 85, 102441. [Google Scholar] [CrossRef]
  54. Shen, H.C.; Tzu, F.M.; Lin, C.; Yeh, C.K.; Huang, W.Y.; Pu, H.P.; Chang, S.H. Verification of Fuel Consumption and Carbon Dioxide Emissions under Sulfur Restriction Policy during Oceanographic Navigation. Appl. Sci. 2022, 12, 9857. [Google Scholar] [CrossRef]
  55. Yang, W.; Li, J. The Application of the Silicone Painting in Ship. Total Corros. Control 2009, 23, 63–64+56. [Google Scholar]
  56. Liang, A.; Guan, C.; Zhou, K.; Chen, H. Simulation and Analysis of Marine Diesel Engine Waste Heat Recovery System. Navig. China 2017, 40, 26–31. [Google Scholar]
Figure 1. Proportion of global greenhouse gas emissions by sector (%). Source: Climate Watch. Historical GHG Emissions.
Jmse 11 00534 g001
Figure 2. Annual income of the container ship with different combinations of CO2 emission reduction measures in 2030.
Jmse 11 00534 g002
Figure 3. Annual income of the container ship with different combinations of CO2 emission reduction measures in 2060.
Jmse 11 00534 g003
Figure 4. Annual net income for combination 6 and combination 13 when the percentage of bunker price drops to a certain point.
Jmse 11 00534 g004
Figure 5. Volatility graph of the auction and purchase prices of carbon.
Jmse 11 00534 g005
Figure 6. Annual net income for combination 13 and combination 14 when incentive levels rise.
Jmse 11 00534 g006
Table 1. The key elements of METS [22].
EntityGreenhouse GasCapFree RateAuction Rate
Carbon PeakingCarbon Neutrality
ShipCO260.0% of CO2 emissions in 200830.0% of CO2 emissions in 20080.0%100.0%
20.0%80.0%
40.0%60.0%
60.0%40.0%
80.0%20.0%
Table 2. Variables and parameters in this model.
ExplanationUnit
Decision variables
nBinary variable; when WHRS is utilized, it equals 1, otherwise 0.
mBinary variable; when DCR is utilized, it equals 1, otherwise 0.
Variables to be determined by decision variables
TRTotal annual revenue of the container shipUSD
TCTotal annual cost of the container shipUSD
NAnnual net income of the container shipUSD
CWAnnual costs incurred by using WHRSUSD
CDAnnual costs incurred by using DRCUSD
CCTotal cost of CO2 generated by the container shipUSD
CBCosts incurred by the container ship for annual bunker consumptionUSD
VPOptimal speed of a container shipkn
VOperational speed of a container shipkn
RThe number of annual round trips completed by the container ship
CO2(A)Annual actual CO2 emissions from the container shipton
CO2(F)Free CO2 emission quotas for the container shipton
CO2(C)The prescribed cap on CO2 emissions from the container shipton
CRThe reward for container ships using the carbon reduction measures USD
CPThe penalties for container ships beyond the specified CO2 emission limitsUSD
Parameter given
rijFreight rate per TEU from i port to j portUSD/TEU
TijThe number of containers from i port to j portTEU
rjiFreight rate per TEU from j port to i portUSD/TEU
TjiThe number of containers from j port to i portTEU
dijDistance from i port to j portnautical mile
djiDistance from j port to i portnautical mile
dTotal distance between two portsnautical mile
yAnnual operating days of the container shipday
βRatio of bunker saving of WHRS for main engine
αRatio of bunker saving of DRC for main engine
V0Design speed at sea of the container shipkn
DTime that a container ship stays at ports for a round tripday
PwTotal cost incurred by using WHRSUSD
YwDepreciation period for WHRSyear
PdTotal cost incurred by using DRCUSD
YdDepreciation period for DRCyear
MFMaximum daily fuel consumption of the main engineTon/day
AFSAuxiliary engine daily bunker consumption when sailing at seaTon/day
AFPAuxiliary engine daily bunker consumption when staying at portTon/day
CdtDaily fixed comprehensive costs of container ship, including capital costs, insurance, maintenance costs and port chargesUSD/day
PcPrices at the auction of CO2 quotasUSD/ton
PrPurchase price of CO2 quotas in the marketUSD /ton
θThe incentive level
PaBunker price of auxiliary engineUSD/ton
PmBunker price of main engineUSD/ton
Table 3. Basic data about the 8000-TEU container ship [4,55,56].
MF/ton·day−1V0/knAFS/ton·day−1AFP/ton·day−1Cdt/USD·day−1y/dayD/dayPw/Yw/USDPd/Yd/USDβα
281.624.521114,66735011500,000590,0006.0%3.0%
Table 4. Quota allocation of CO2 cap for the container ship under different scenarios in 2030.
Total Cap of CO2 Emission of the Container Ship Is 83,795.505 tons
Percentage of Auction/%20.040.060.080.0100.0
Auction quotas/ton16,759.10133,518.202 50,277.303 67,036.404 83,795.505
Free quotas/ton67,036.404 50,277.303 33,518.202 16,759.101 0.000
Table 5. Quota allocation of CO2 cap for the container ship under different scenarios in 2060.
Total Cap of CO2 Emission of This Container Ship Is 41,897.753 tons
Percentage of Auction/%20.040.060.080.0100.0
Auction quotas/ton8379.551 16,759.101 25,138.652 33,518.202 41,897.753
Free quotas/ton33,518.20225,138.65216,759.1018379.5510.000
Table 6. Annual income of the container ship with different combinations of CO2 emission reduction measures in 2030.
Annual Income of the Container Ship/USD 1 m
CO2 Emission Reduction MeasuresPercentage of Auction for CO2 Quotas/%
CombinationWHRSDRCSS20.040.060.080.0100.0
1NONOOS3.2212.8022.3831.9651.546
2NONO95.0% OS3.9223.5033.0842.6652.246
3NONO90.0% OS4.2773.8583.4393.0202.601
4NONO85.0% OS4.2943.8753.4563.0372.618
5YESNOOS7.4927.0736.6546.2355.816
6YESNO95.0% OS7.5597.1406.7216.3025.883
7YESNO90.0% OS7.3356.9166.4976.0795.660
8YESNO85.0% OS6.8296.4105.9915.5725.153
9NOYESOS6.7636.3445.9255.5065.087
10NOYES95.0% OS6.9156.4966.0775.6585.239
11NOYES90.0% OS6.7706.3515.9325.5135.094
12NOYES85.0% OS6.3355.9165.4975.0784.659
13YESYESOS7.5427.1236.7046.2855.866
14YESYES95.0% OS7.5227.1036.6846.2655.846
15YESYES90.0% OS7.2216.8026.3835.9645.545
16YESYES85.0% OS6.5546.1355.7165.2974.878
Table 7. Annual income of the container ship with different combinations of CO2 emission reduction measures in 2060.
Annual Income of the Container Ship/USD 1 m
CO2 Emission Reduction MeasuresPercentage of Auction for CO2 Quotas/%
CombinationWHRSDRCSS20.040.060.080.0100.0
1NONOOS0.9170.7080.4980.2890.079
2NONO95.0% OS1.6181.4081.1990.9890.780
3NONO90.0% OS1.9721.7631.5531.3441.135
4NONO85.0% OS1.9901.7801.5711.3611.152
5YESNOOS5.1884.9784.7694.5594.350
6YESNO95.0% OS5.2545.0454.8354.6264.416
7YESNO90.0% OS5.0314.8224.6124.4034.193
8YESNO85.0% OS4.5254.3154.1063.8963.687
9NOYESOS4.4584.2494.0393.8303.620
10NOYES95.0% OS4.6114.4014.1923.9823.773
11NOYES90.0% OS4.4664.2564.0473.8373.628
12NOYES85.0% OS4.0313.8213.6123.4023.193
13YESYESOS5.2375.0284.8184.6094.399
14YESYES95.0% OS5.2185.0084.7994.5894.380
15YESYES90.0% OS4.9164.7074.4974.2884.078
16YESYES85.0% OS4.3394.1303.9203.7113.501
Table 8. Sensitivity analysis of bunker price.
Top 2 Annual Incomes of a Container Ship/USD 1 m
Carbon Peaking
AdjustmentCombination20.0%40.0%60.0%80.0%100.0%
Rise 15.0%64.9824.6134.2443.8753.506
144.9354.5664.1973.8283.459
Rise 10.0%65.7945.4105.0264.6424.257
145.7505.3664.9824.5984.213
Rise 5.0%66.6526.2515.8505.4495.048
136.6216.2205.8195.4185.017
Baseline67.5597.1406.7216.3025.883
137.5427.1236.7046.2855.866
Drop 5.0%68.5228.0837.6447.2056.766
138.5188.0797.6407.2016.762
Drop 10.0%139.5579.0968.6358.1747.713
69.5479.0868.6258.1637.702
Drop 15.0%1310.66610.1809.6949.2098.723
610.64210.1579.6719.1858.700
Table 9. Sensitivity analysis of auction and purchase prices of carbon.
The Maximum Annual Income of a Container Ship/USD 1 m
Carbon Peaking
AdjustmentCombination20.0%40.0%60.0%80.0%100.0%
Rise 10.0%67.6207.1606.6996.2385.777
Rise 5.0%67.5907.1506.7106.2705.830
Baseline67.5597.1406.7216.3025.883
Drop 5.0%137.5347.1366.7386.3405.942
Drop 10.0%137.5267.1496.7726.3956.018
Table 10. Sensitivity analysis of incentive levels.
Top 2 Annual Incomes of a Container Ship/USD 1 m
Carbon Peaking
AdjustmentCombination20.0%40.0%60.0%80.0%100.0%
θ = 60.0%136.7916.3725.9535.5345.115
66.7816.3625.9435.5245.105
θ = 80.0%67.1706.7516.3325.9135.494
137.1666.7476.3285.9095.490
θ = 100.0%67.5597.1406.7216.3025.883
137.5427.1236.7046.2855.866
θ = 120.0%67.9477.5287.1096.6906.272
137.9177.4987.0796.6606.241
θ = 140.0%68.3367.9177.4987.0796.660
148.3077.8887.4697.0506.631
Disclaimer/Publisher’s Note: The statements, opinions and data contained in all publications are solely those of the individual author(s) and contributor(s) and not of MDPI and/or the editor(s). MDPI and/or the editor(s) disclaim responsibility for any injury to people or property resulting from any ideas, methods, instructions or products referred to in the content.