1. Introduction
Air pollution is a significant health risk for human population. The World Health Organization (WHO) estimated that outdoor air pollution caused 4.2 million premature deaths worldwide in 2016 [
1]. More specifically, particulate matter smaller than 2.5 µm in diameter (PM2.5), which is one of the factors affecting air quality, has been strongly linked to premature deaths [
2,
3]. The fraction of marine traffic in PM2.5 concentrations varies significantly depending on location, being relatively high in countries with significant shipping activity in coastal areas. In country-specific average values, shipping constitutes for instance 10% of PM2.5 in Great Britain, Denmark and Sweden while it constitutes up to 22% in Oceania [
4]. As the contribution of shipping in PM2.5 is relatively large in some countries, the effects of reduction in shipping emissions could significantly improve air quality and decrease the health risks related to air pollution.
Currently, particle emissions in seafaring ships are not limited. The International Maritime Organization (IMO) plans to limit marine engine Black Carbon (BC) emissions. Worldwide limits for Particle Number (PN) or PM emissions do not exist nor have they been planned. However, local limitations exist, such as in the inland waterways of European Union, where limits resemble the ones decreed for non-road engines. In addition, e.g., the fuel-related regulations can have indirect effects on particle emissions.
Introduction of less polluting fuels can be used to reduce particulate emissions from ships, for example natural gas offers a drastic reduction in particle emissions, see e.g., [
5]. Oil-type fuels can be changed to less polluting ones. Traditionally, the marine sector has been using Heavy Fuel Oil (HFO), which can be substituted with cleaner alternatives, for example with Marine Diesel Oil (MDO). Bio-based fuel blends may also reduce emissions, e.g., [
6,
7]. However, alternative oil-type fuels do not reduce particulate emissions as much as the switch to natural gas.
On the other hand, when using oil-type fuels, exhaust aftertreatment methods can be used in emission reduction. Highly efficient filtration methods are options to reduce particle emissions down to low levels. Diesel Particulate Filters (DPF) [
8] used in light- and heavy-duty vehicles rely on a porous structure, which collects particles from the exhaust flow with high efficiency [
9]. Soot collected into the DPF is burned, i.e., DPF is regenerated, in order to prevent clogging of the filter and to enable long-term operation of the device. As the operation of a DPF relies on the regeneration process, exhaust particles should only contain combustible substances. Ash in the exhaust, originating from fuel or lube oil, is not burned in the regeneration and accumulates in the DPF. Typical distilled diesel fuel only contains minimal concentrations of ash-forming compounds, not significantly affecting the operation of the DPF. HFO often used in marine engines contains significant concentrations of metal compounds and sulfur, which form incombustible ash [
10]. Moreover, the ash content of lubricant oils used in marine engines is high [
10]. As a result, normal DPFs are not applicable for large marine engines, especially when operated with HFO.
Electrostatic precipitation is a well-known particle removal technique in power plants and industrial processes, introduced for instance in a review by Jaworek et al. [
11]. Electrostatic precipitation is suitable for high particle concentrations, also containing ash components. Operation of an Electrostatic Precipitator (ESP) typically relies on a corona discharge, which produces ions that charge particles. A corona electrode is a body with sharp edges or with other types of small outer dimensions, for instance a small diameter wire. When such an electrode is near a large conductive body, which is at different voltage, the electric field is high near the sharp edges and low near the large conductive body. When the voltage is increased, the electric field eventually exceeds the dielectric strength of the gas and an electric breakdown occurs first near the sharp edges producing a corona discharge. Corona discharge produces ions, which are transported away from the electrode due to the electric field. These ions charge particles by diffusion and field charging mechanisms [
11]. Charged particles are collected onto collection electrodes with an electric field, which is formed between the corona electrode and the collection electrode (the same electric field produces the corona discharge) or which is formed between separate collection electrodes not related to corona discharge (two-stage electrostatic precipitator). Various geometries for electrodes and collection surfaces exist [
11]. Electrostatic precipitators operating in low humidity are called Dry ESPs and in high humidity Wet ESPs (WESP).
Electrostatic precipitation is a common flue gas purification technique in power generation. For instance, Xu et al. [
12] studied the performance of a coal power plant emission reduction system consisting of selective catalytic reduction, Dry ESP, wet limestone–gypsum flue gas desulfurization and Wet ESP. The performance of similar systems has also been reported in other studies such as [
13,
14,
15]. Wet ESPs could be used to remove particles from waste incinerator flue gas and the performance of a pilot WESP has been studied in Sweden [
16]. Potential future applications of ESPs include small-scale power generation and residential boilers, systems introduced, e.g., in a recent review [
17].
So far, ESPs have not been actively used to reduce ship emissions although the technique has potential for this. Some studies related to marine applications and ESPs exist. Zukeran et al. studied how ESP removes polyaromatic hydrocarbons from the exhaust of a marine engine [
18,
19]. Jeong et al. recently published a study where WESP was combined with a research engine [
20]. The system in this recent study consisted of a scrubber and a commercial CAROLA WESP [
21].
In our study, we tested the performance and particle removal characteristics of an emission reduction system consisting of a scrubber and a WESP intended for marine applications. The system was tested with an exhaust from a medium speed 1.6 MW marine diesel engine running with MDO and HFO. Particle removal capability for particle number (>23 nm), black carbon and particulate matter (mass) was measured as a function of engine load. Performance of the system was also tested in tilted positions to mimic the heeling of a ship.
2. Materials and Methods
2.1. Scrubber and WESP
The emission reduction system investigated in this study contained two main components. First, the exhaust enters the scrubber designed to decrease SO2 emissions. The scrubber relies on a closed loop cycle with an additional NaOH feed, which is used to stabilize pH in the device. The scrubber is followed by the WESP designed to decrease particle emissions. In the WESP, particles are charged with a negative corona discharge and collected into the walls of the device with an electric field. The WESP in this study was a slipstream pilot plant made of fiberglass and designed for research and evaluation purposes. It was based on single-field construction. The electric field and the length of the collection zone were similar with a full-scale unit. Thus, the performance measured for the pilot plant was seen to correspond with the performance of a full-scale WESP installed after a MW-range marine engine.
Tilting of the device was used to mimic the heeling of a ship as the tilting may affect the performance of the ESP significantly. The system was installed firmly on a skid. The combination of the skid and the system was lifted from one side with a truck-mounted loader-crane causing the device to tilt. Performance of the system was measured at 8° and 15° tilt angles.
2.2. Engine and Fuels
The exhaust was generated in an engine laboratory with a 1.6 MW marine diesel engine (Wärtsilä Vasa 4R32, Wärtsilä Oyj, Helsinki, Finland) in genset configuration. The engine utilizes unit pump fuel injection and runs at 750 RPM. The engine was operated at 30%, 50% and 75% of its rated power.
First measurements were conducted with MDO (DMB) and then the fuel was switched to HFO (RMG 380). Both fuels were fed into the engine from the same heated storage tank. HFO was first separated and then pumped into the storage tank. MDO was used without any pretreatment. Both the storage tank and the feeder/booster unit was drained before the fuel was switched from MDO to HFO. MDO was analyzed by the supplier (Neste Oyj, Espoo, Finland) and a sample of HFO was sent to outsourced analysis (ASG Analytic-Service AG, Neusäß, Germany). The main fuel analysis results are presented in
Table 1. The largest differences in the fuels were the sulfur and the ash contents. HFO also contained asphaltenes not present in MDO.
2.3. Measurement Setup
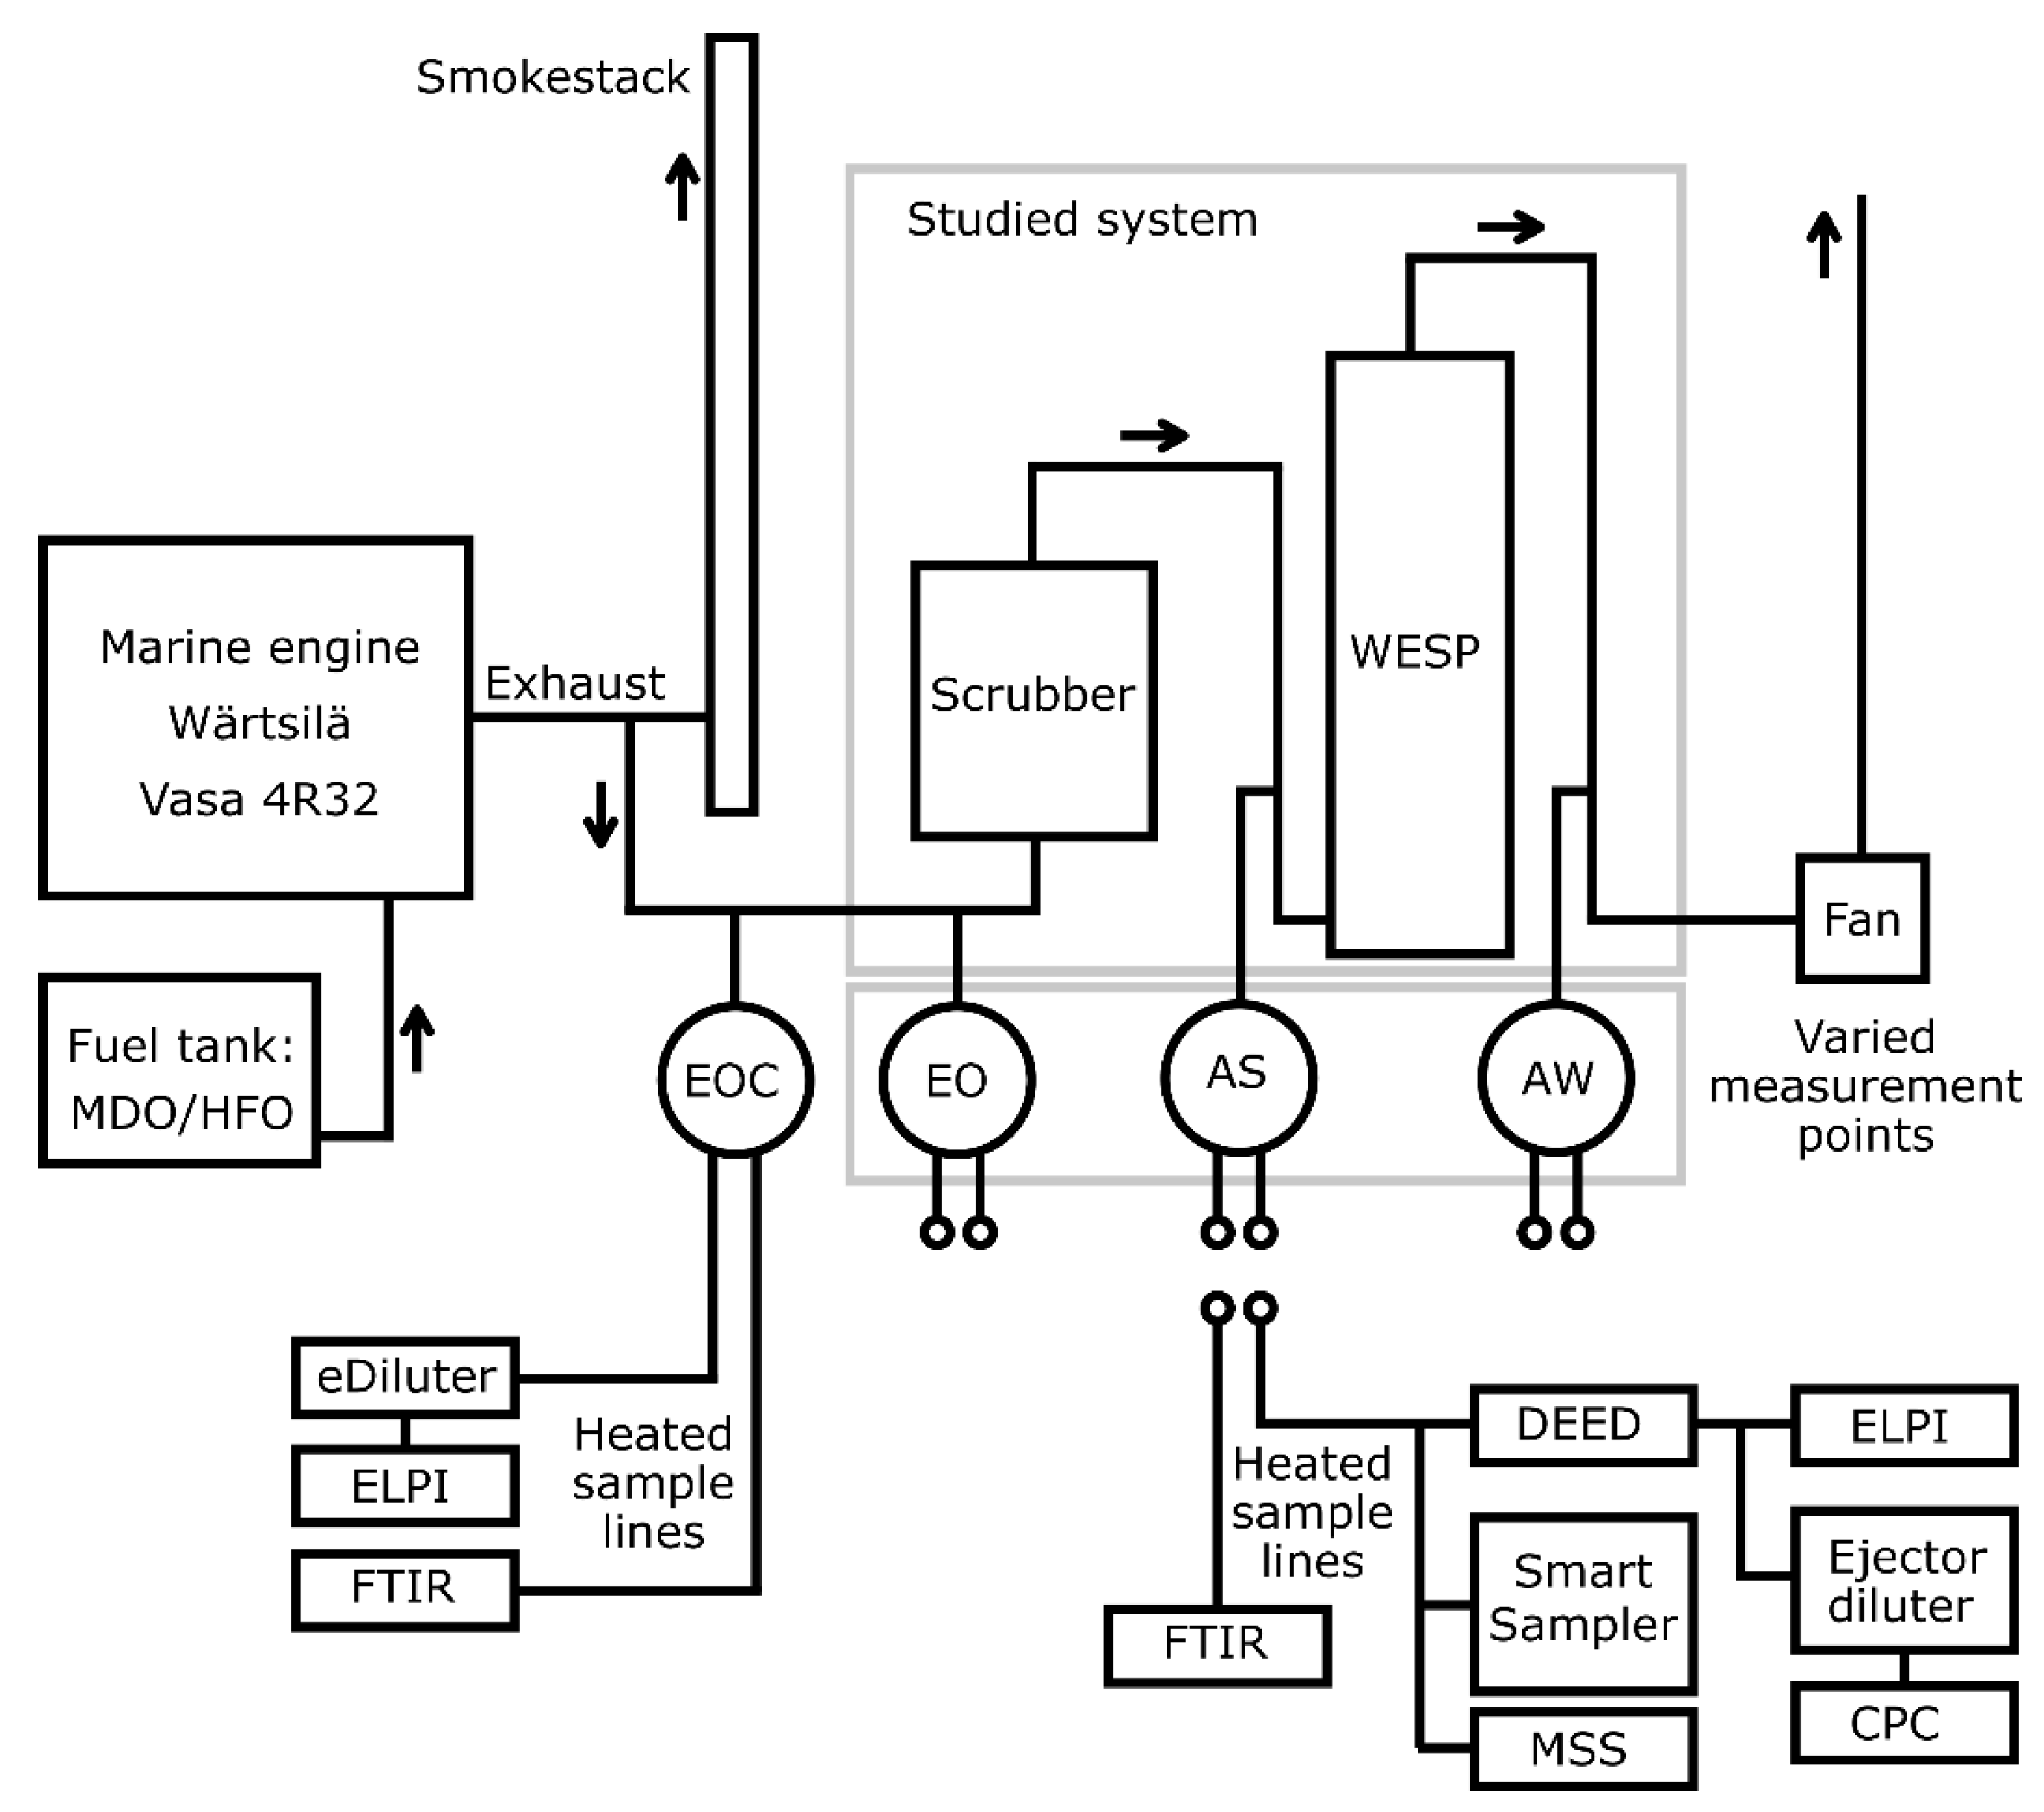
Measurements were conducted from four different sampling points shown in
Figure 1. One sampling point was used to measure engine-out emissions constantly (named EOC) and it was located before the scrubber. Instrument setup for this point was kept constant over the measurements. Other three sampling points were used to measure engine out emissions before the scrubber (named EO), after the scrubber and before the WESP (named AS) and after the WESP (named AW).
2.4. Instrumentation
A single fixed EOC location was used to ensure that engine emissions were uniform between the test points. Two separate heated sampling lines connected to the same probe were installed: a heated (180 °C) pre-filter and polytetrafluoroethylene (PTFE) line for gaseous measurement and a heated (250 °C) stainless steel line for particle measurements. Measurement of gaseous compounds was conducted with a Fourier-Transform Infrared spectrometer (FTIR, DX4000, Gasmet Technologies Oy, Vantaa, Finland) and particulates with a combination of a two-stage diluter (eDiluter, Dekati Oy, Kangasala, Finland) and an Electrical Low-Pressure Impactor (ELPI, Dekati Oy). The first stage of the diluter was heated to 350 °C to remove volatile compounds from particles. The dilution ratios of both stages were set to 15 resulting in a total dilution ratio of 225.
In the comparison measurements, the same heated sample probe was used in all the measurement points: EO, AS and AW. From the probe, the sample was divided between the gaseous sample and the particle sample. The gaseous sample was filtered in a heated pre-filter located between the probe and a heated (180 °C) PTFE line leading to an FTIR (DX4000, Gasmet Technologies Oy). The particle sample was taken to the instruments through a heated (250 °C) stainless steel line.
PN measurement was performed with instrumentation meeting the requirements of ISO 8178-1:2017, which is used in PN emission testing of engines in general and also engines used in the European Union inland waterways. A diluter (DEED, Dekati Oy) was used to dilute the sample flow. The high dilution ratio mode (DR = 844) was selected for the measurements. The DEED contains a high-temperature primary dilution followed by evaporation chamber and cold dilution. This configuration removes volatile compounds from particles. The ELPI measuring the size distribution was connected directly to the outlet of the DEED. A Condensation Particle Counter (CPC, A23, Airmodus Oy, Helsinki, Finland) measuring the particle number concentration of particles larger than 23 nm was connected directly to the outlet of the DEED in MDO measurements but in HFO measurements, an additional ejector diluter (DI-1000, Dekati Oy) was used to reduce concentration to CPC-measurable levels.
The Black Carbon (BC) concentration was measured with a Micro Soot Sensor (MSS 483, AVL List GmbH, Graz, Austria), which is based on the photoacoustic measurement principle that IMO has selected as one of candidate methods for BC measurement [
22,
23]. MSS sampled directly from the sample line and the instrument used its internal dilution system with the dilution ratio set to 15.
The filter sampling for PM emission measurements was conducted with instrumentation meeting requirements of ISO 8178-1:2017, which is used to determine PM emissions for engines used in the European Union inland waterways. The sampling was conducted with a Smart Sampler (AVL List GmbH), which dilutes the sample before it is collected in a filter. The temperature of the filter housing was (47 ± 5) °C, the total flow rate was 1.2 g/s and the inlet flow rate was 0.12 g/s (dilution ratio 10). The duration of the filter sampling time was varied to acquire optimal PM mass in the filter. The shortest sampling time was used for HFO engine-out and after scrubber points (2 min) and the longest time for after WESP points (30 min). PTFE-bonded glass fiber filters (TX40, Pall Corporation, Port Washington, NY, USA) were used in PM emission measurements. PM values reported in this study were based on average concentrations from three filter samples. Filter samples were weighted using a microbalance (SE2-F, Sartorius AG, Göttingen, Germany). Samples for carbon analysis were collected on quartz filters (Tissuquartz, Pall Corporation). Analysis of Organic Carbon (OC) and Elemental Carbon (EC) was performed using thermal–optical analysis with an EC/OC-analyzer (Model 4L, Sunset Laboratory Inc., Tigard, OR, USA) using EUSAAR2 protocol. Sulfates from samples were determined in outsourced analysis (Eurofins Labtium Oy, Espoo, Finland).
2.5. Measurement Matrix
The measurement matrix is presented in
Table 2. Measurements were conducted with MDO at a 50% load and HFO at 30%, 50% and 75% loads. With all loads, samples were taken from engine-out, after scrubber and after WESP positions. Measured quantities were particle number, particulate matter (mass) and black carbon mass. In addition, particle size distributions were measured. Particle chemistry was studied from points where the engine was running with HFO at a 50% load. Tilting experiments for WESP were also conducted with this fuel and load combination and included PN, PM and BC measurements.
3. Results
3.1. Concentrations and Size Distributions
Particle concentrations measured from engine-out, after scrubber and after WESP positions are presented in
Figure 2 and in
Table A1 (
Appendix A). Concentrations are reported at 273.15 K and 1013.25 mbar conditions and include corrections for diluter dilution ratios. WESP utilizes a flush air for insulators, which dilutes the sample. In the presented concentration values, this internal dilution was corrected by using the CO
2 tracer method [
24] based on engine-out and after WESP CO
2 measurements.
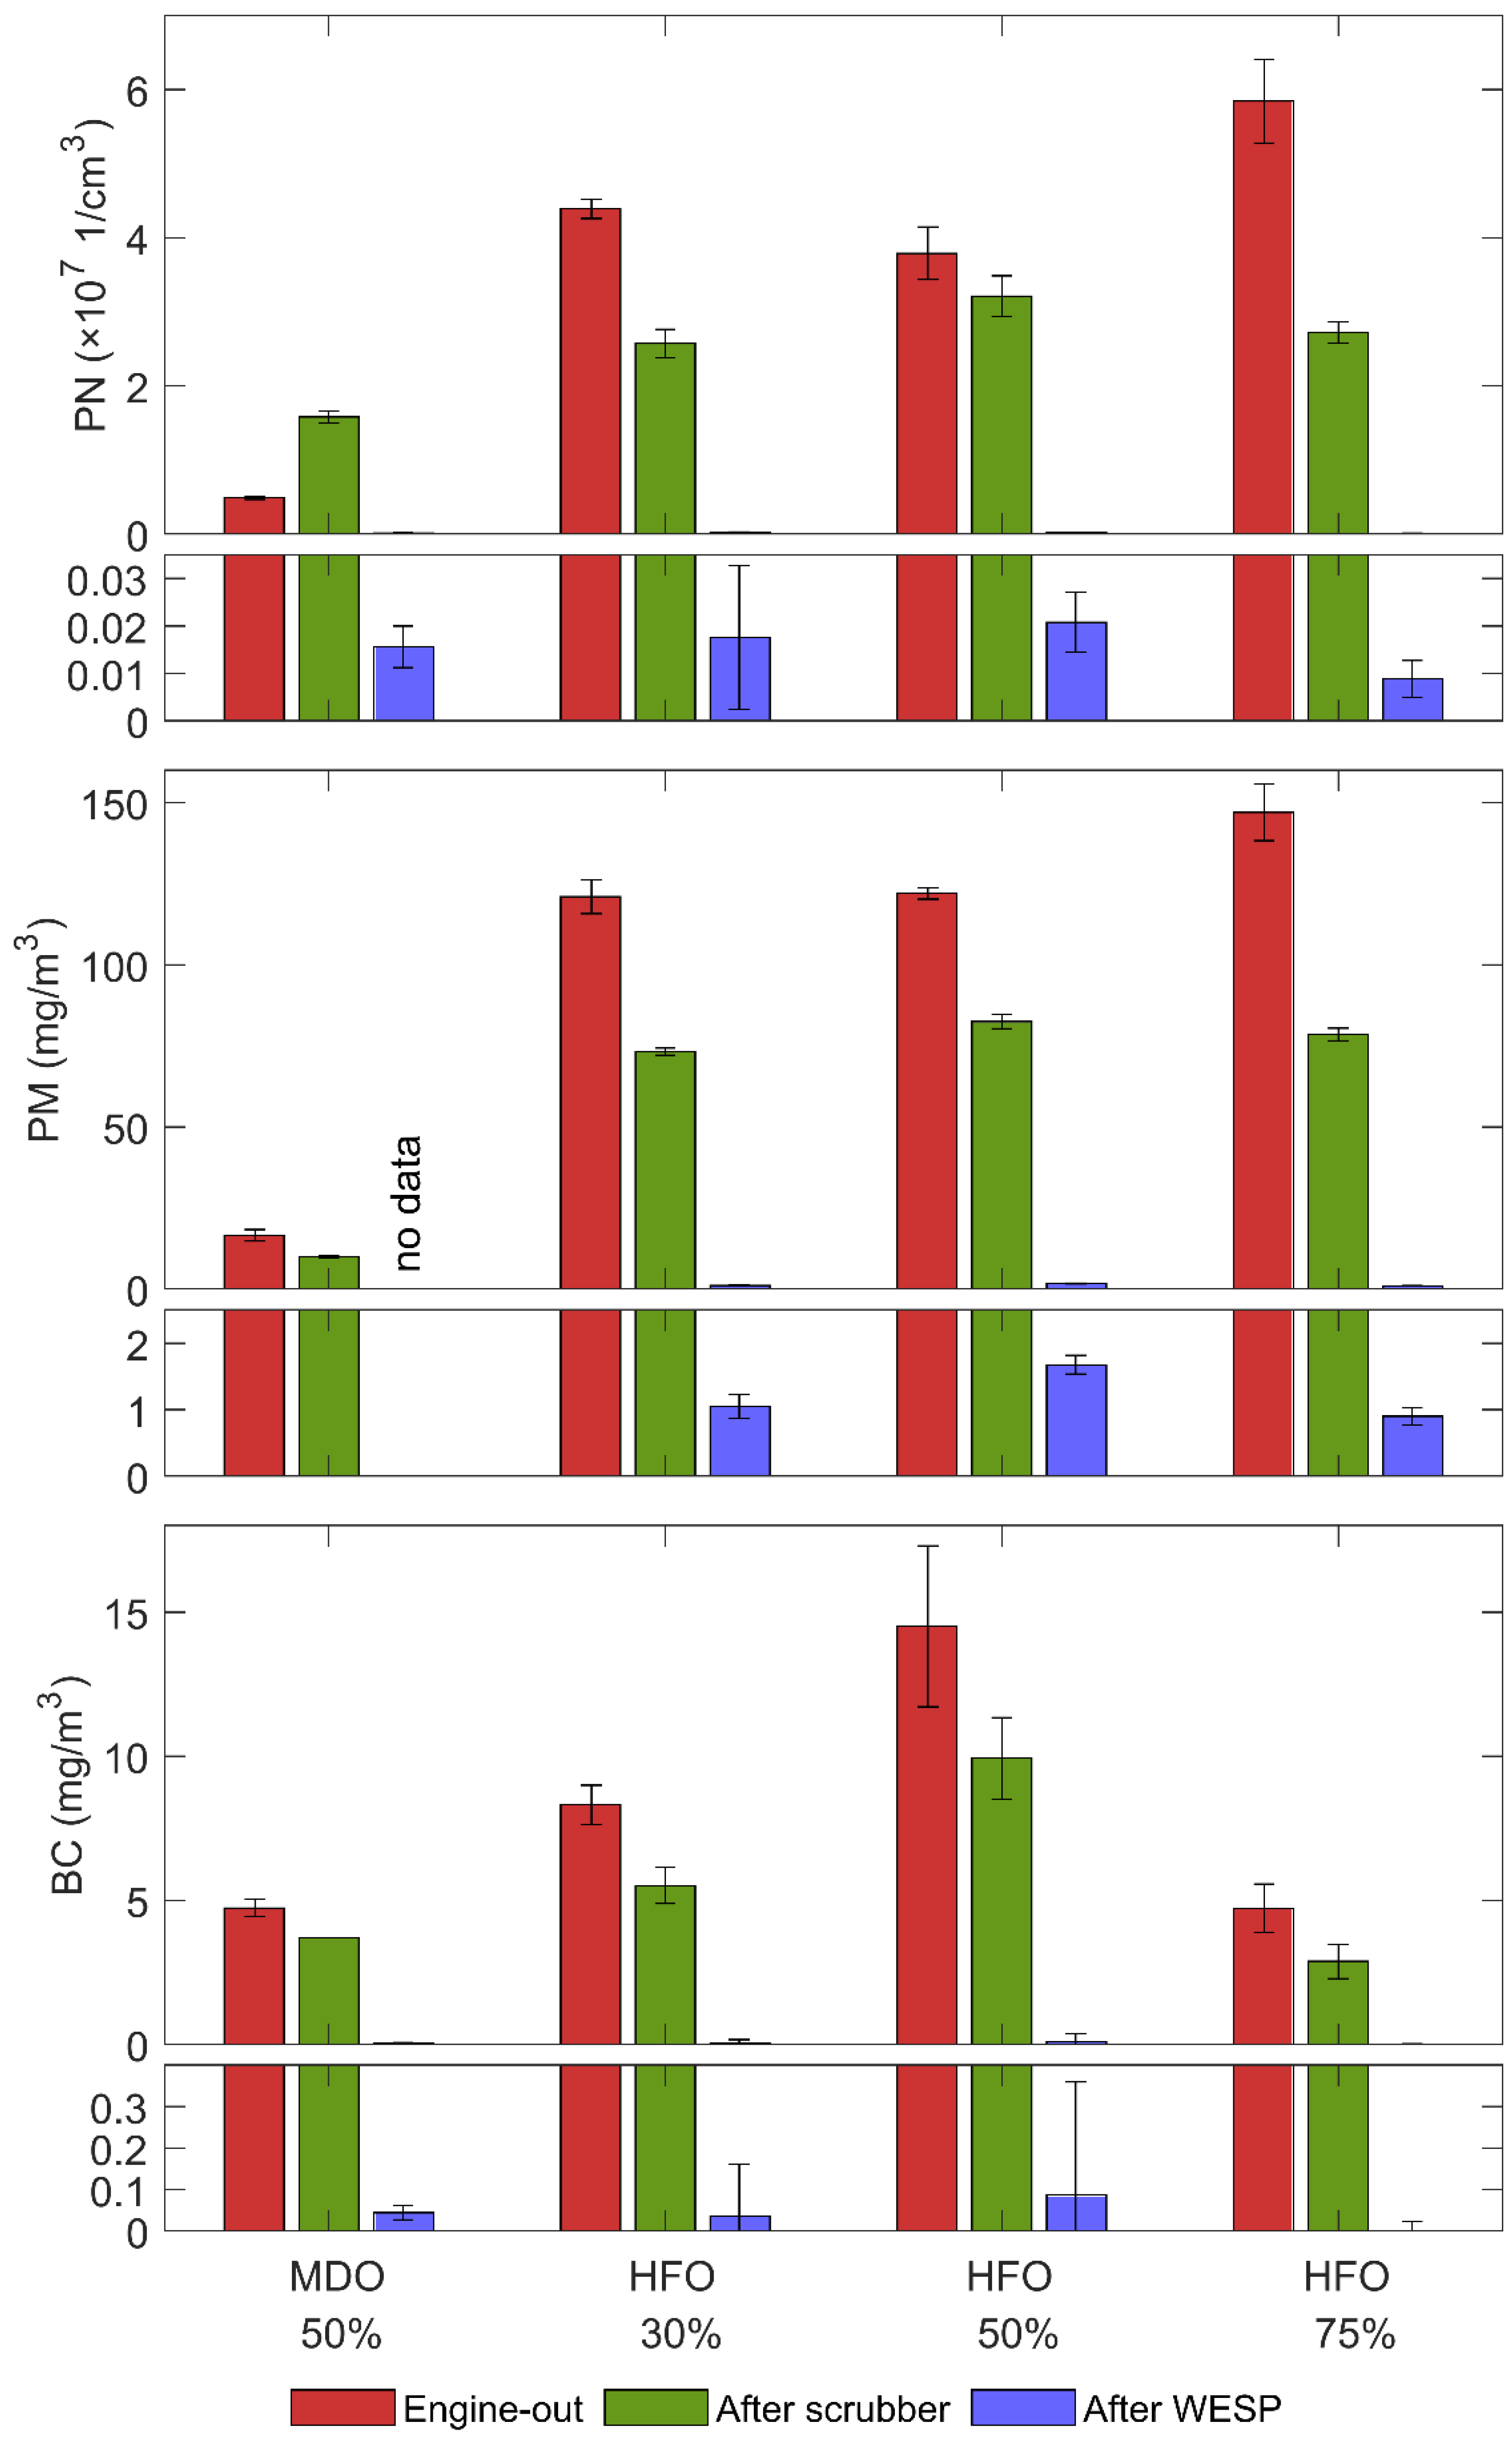
Number concentrations are presented for non-volatile >23 nm particles. With MDO, the engine produced lower PN concentrations than with HFO at a 50% engine load. In case of MDO, the after scrubber PN concentration was approximately three times the engine-out concentration, which indicates that the scrubber produced particles. With HFO, PN concentrations after the scrubber were relatively constant, between 2 × 10⁷ and 3.5 × 10⁷ 1/cm3, for different engine loads and lower than corresponding engine-out concentrations. The WESP was effective at reducing particle number concentrations; only extremely low concentrations were observed after the WESP at all engine loads. When the engine was run with HFO and the system was tilted by 8° or 15°, the PN concentrations measured after WESP were very low, from 2.7 × 10⁵ to 3.4 × 10⁵ 1/cm3, and in similar level without tilting.
Fuel significantly affected particle mass concentrations in engine-out and after scrubber results. With MDO, the engine out PM concentration was approximately 17 mg/m3 and with HFO between 120 and 150 mg/m3. When samples were taken after scrubber, PM concentrations were between 70 and 100 mg/m3, hence lower than from the engine-out position with HFO. PM concentrations after scrubber were not significantly affected by engine load. Only small PM concentrations, from 0.9 to 1.7 mg/m3, were measured after the WESP. PM measurement with MDO was not conducted due to an instrumentation problem. Tilting of the system did not affect PM concentrations, which were in the tilted position 1.3 and 1.4 mg/m3.
Engine-out black carbon concentrations varied between different engine loads from approximately 5 to 15 mg/m3. BC concentrations after the scrubber were from 3 to 10 mg/m3, hence smaller than concentrations from the engine out position. The scrubber reduced BC concentrations at approximately the same percentage as PN or PM concentrations in the case of HFO. This indicates that the scrubber reduced particles originating from the engine and the increase in the PN concentrations in case of MDO must be related to the formation of new particles in the scrubber. After the WESP, BC was present only in very low concentrations both during normal (from 0 to 0.09 mg/m3) and tilted (0.02 and 0.04 mg/m3) positions.
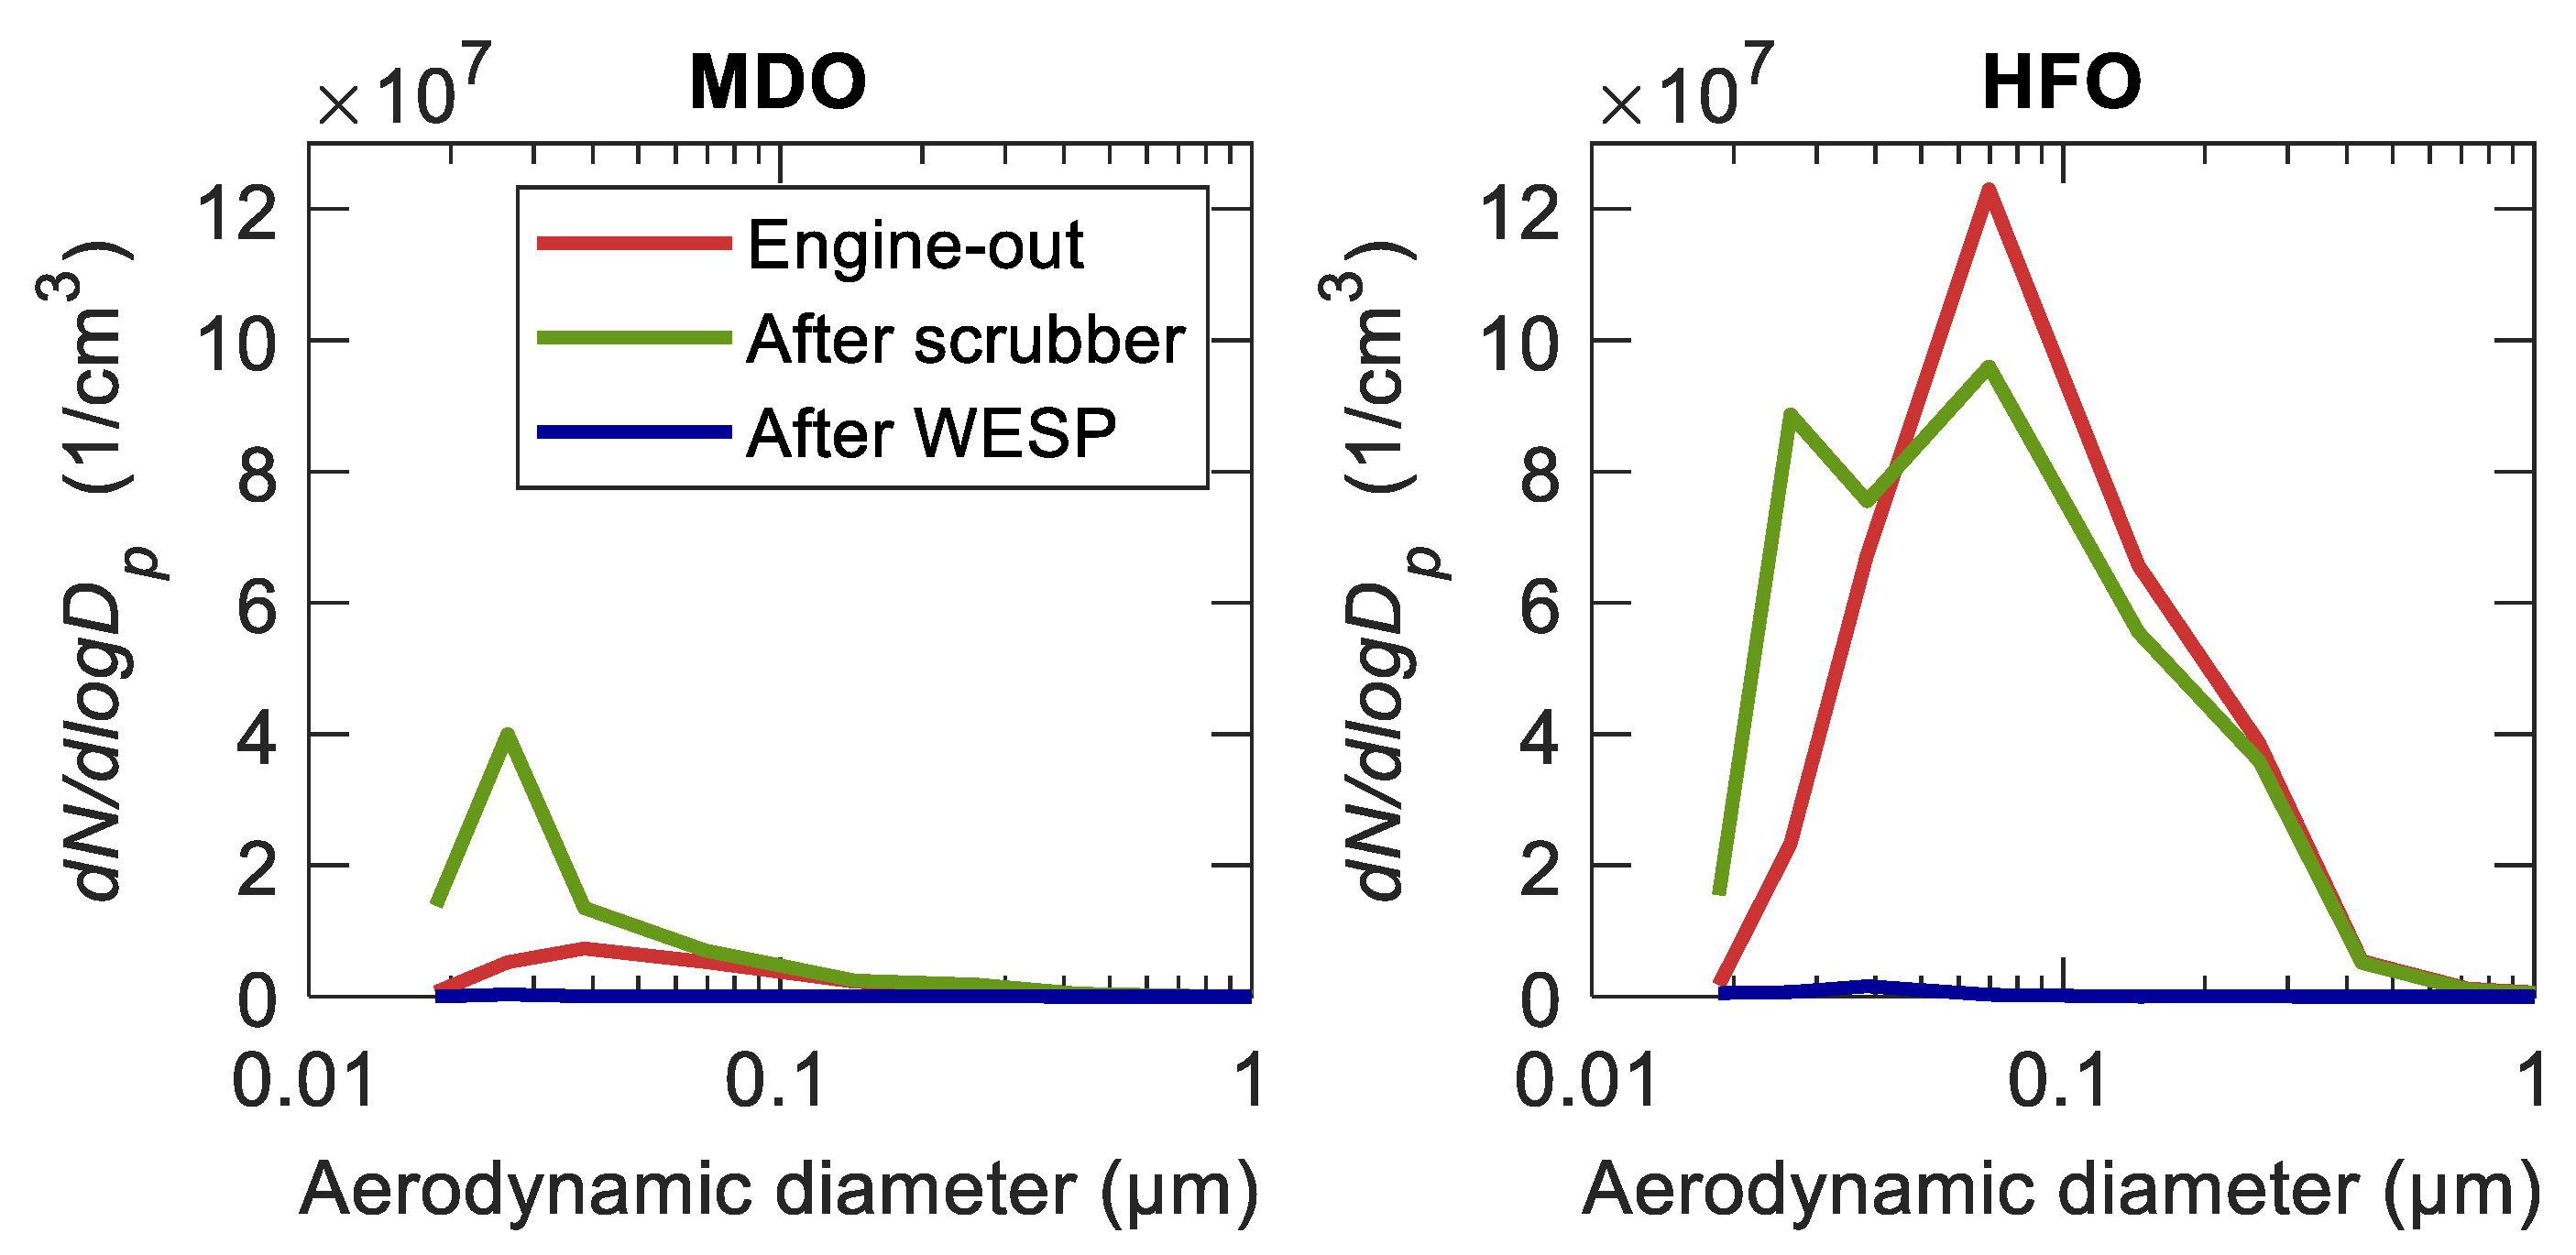
Particle number size distributions measured with the ELPI from engine-out, after scrubber and after WESP locations are presented in
Figure 3. The size distributions were calculated from measured data assuming a particle effective density of 1 g/cm
3. The distributions shown were measured when the engine was running at a 50% load. Distributions were measured with both MDO and HFO. In engine-out distributions, the peak of the distributions was approximately at 40 nm aerodynamic diameter with MDO and approximately at 70 nm diameter with HFO. The difference in the concentrations was also significant. The number concentration with HFO was significantly higher than with MDO.
In the after scrubber measurement, an interesting phenomenon was seen for which PN measurements already gave some indications. It appears that the scrubber generated particles in the 20–40 nm size range. This effect was emphasized when the engine was run with MDO but these particles were also seen in the size distribution from HFO as an additional particle mode in the aforementioned size range.
Particle number concentrations after the WESP were too low to acquire clear particle size distributions in case of both fuels. Low concentrations indicate that WESP removes particles efficiently.
3.2. Composition
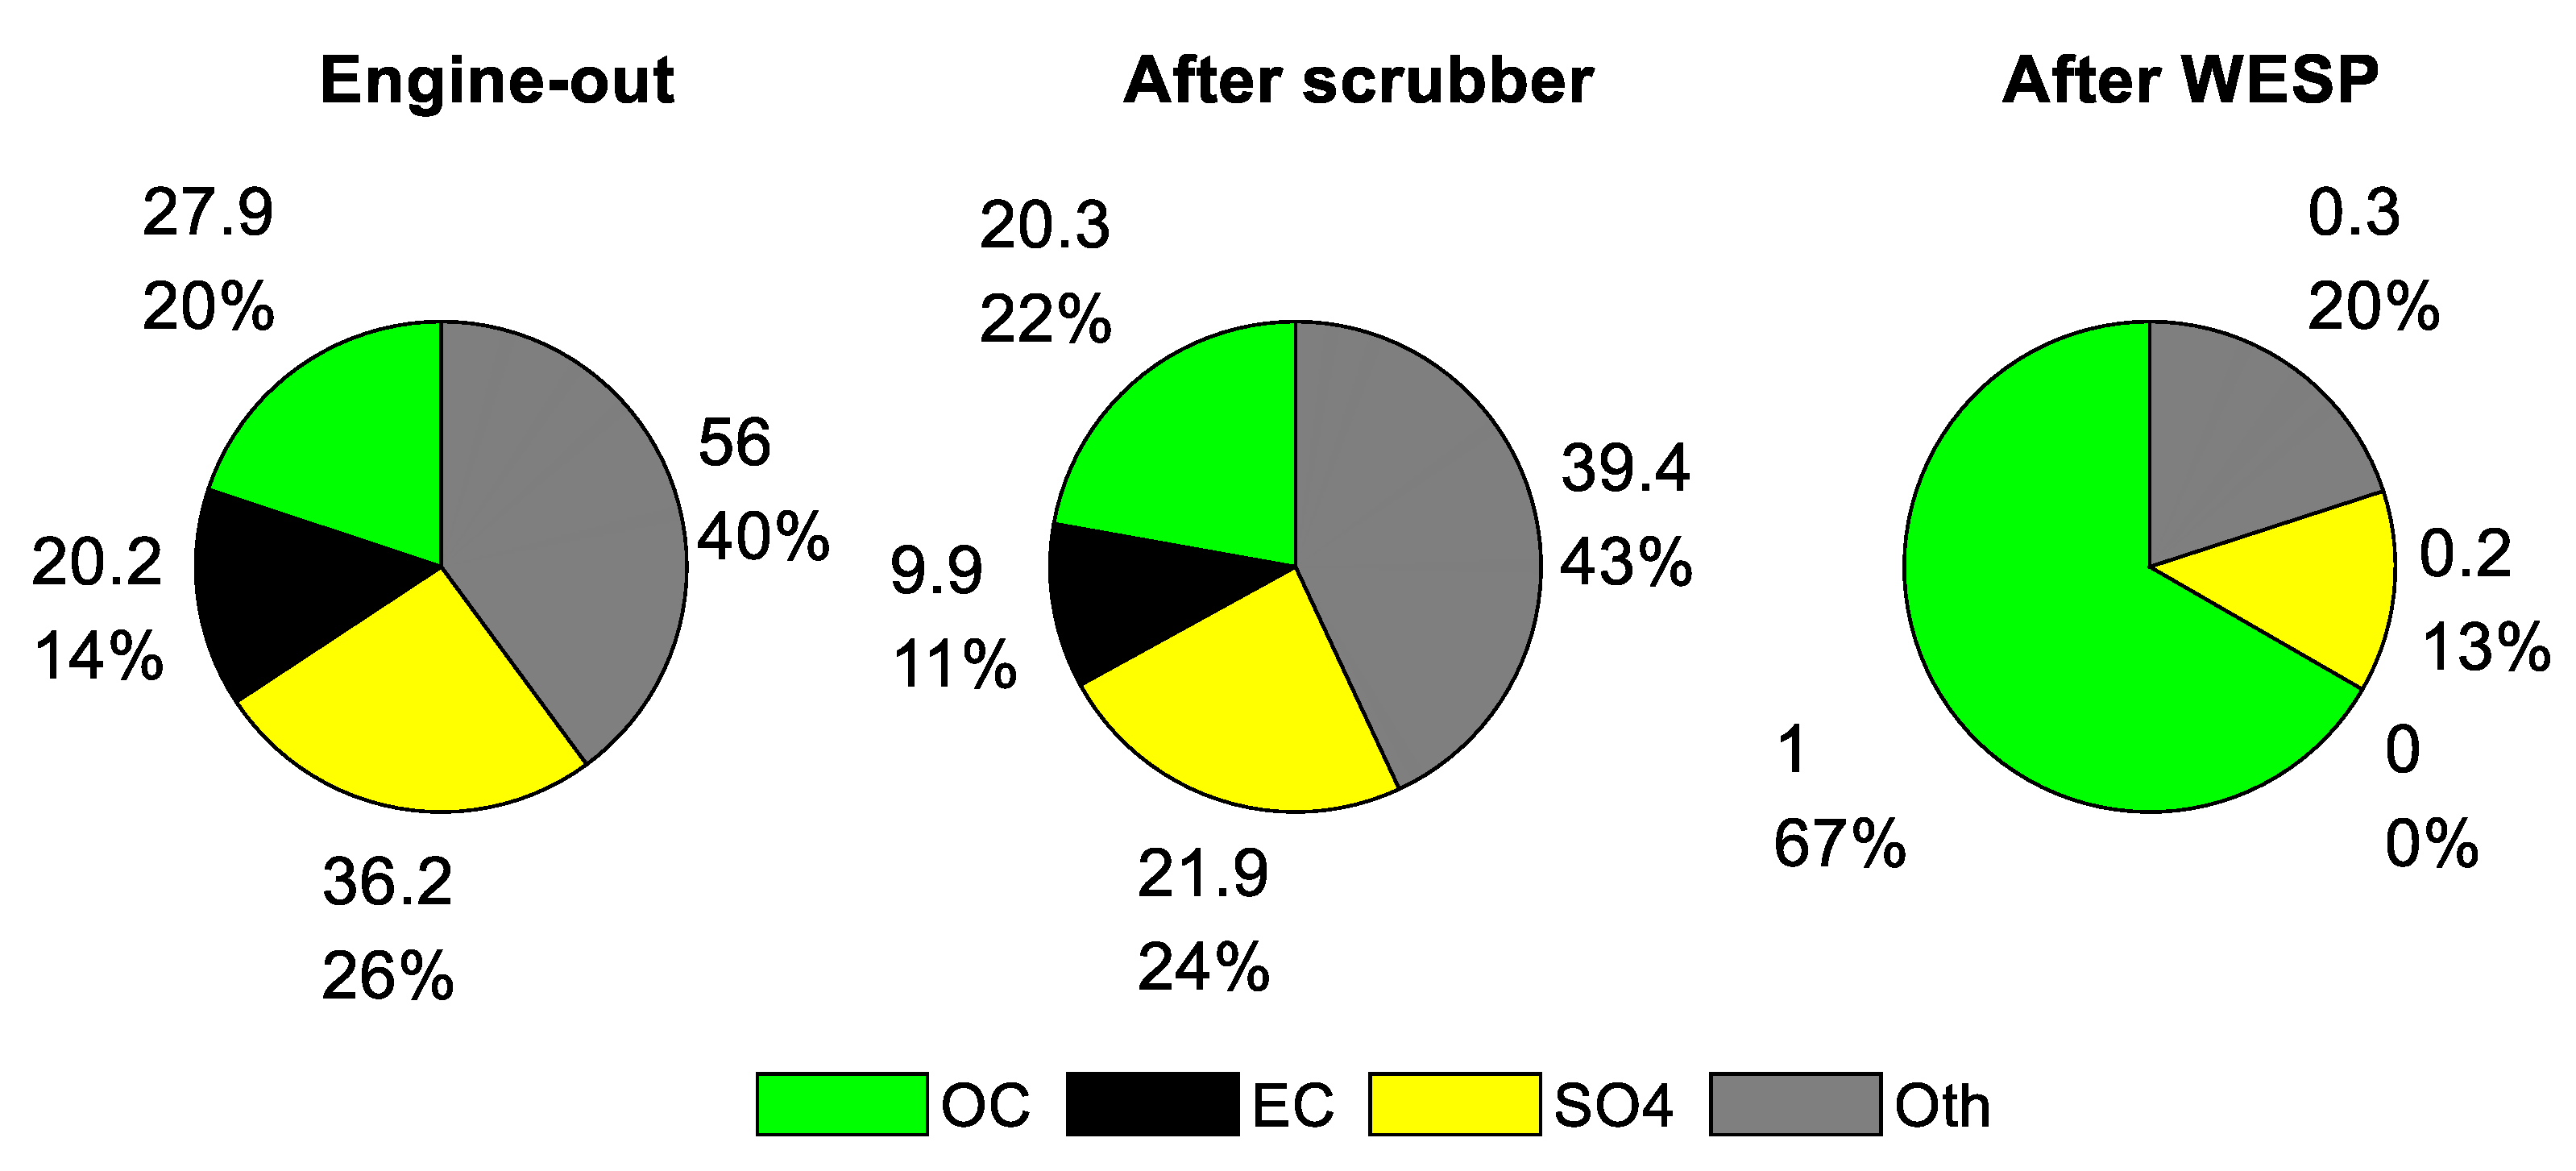
Results of the EC/OC-analysis from filter samples collected from 50% engine load with HFO are presented in
Figure 4 supplemented with results from the sulfate analysis. EC/OC-analysis only measures the mass of elemental and organic carbon from the filters. The composition was classified in four categories: Organic Carbon (OC), Elemental Carbon (EC), sulfate and other compounds. The mass of the other compounds was calculated as a remaining mass after the OC, EC and sulfate masses were subtracted from the PM mass.
Engine-out and after scrubber cases were rather similar in terms of composition. The mass of organic carbon was approximately 20%, mass of elemental carbon from 10 to 15%, mass of sulfate 25% and mass of other compounds, such as water associated with sulfate and ash, approximately 40–45%. Measurements conducted after the scrubber were associated with somewhat smaller mass emissions of PM and BC than acquired from engine-out measurements. The reduction due to the scrubber was from 27 to 52% depending on the component. After the WESP, PM mass concentrations were low and they did not contain any EC. The small PM mass measured from the filters consisted mostly of organic carbon and small amounts of sulfate and other compounds such as water associated with sulfate. In particular, the organic carbon may have originated from the semivolatile compounds, which have high boiling points compared to the temperature of 47 °C, which is the filter sampling temperature defined in ISO 8178-1:2017.
3.3. Filtration Efficiencies
Filtration efficiencies
ηi were calculated with the equation:
where
ci is the average concentration after the scrubber or after WESP and
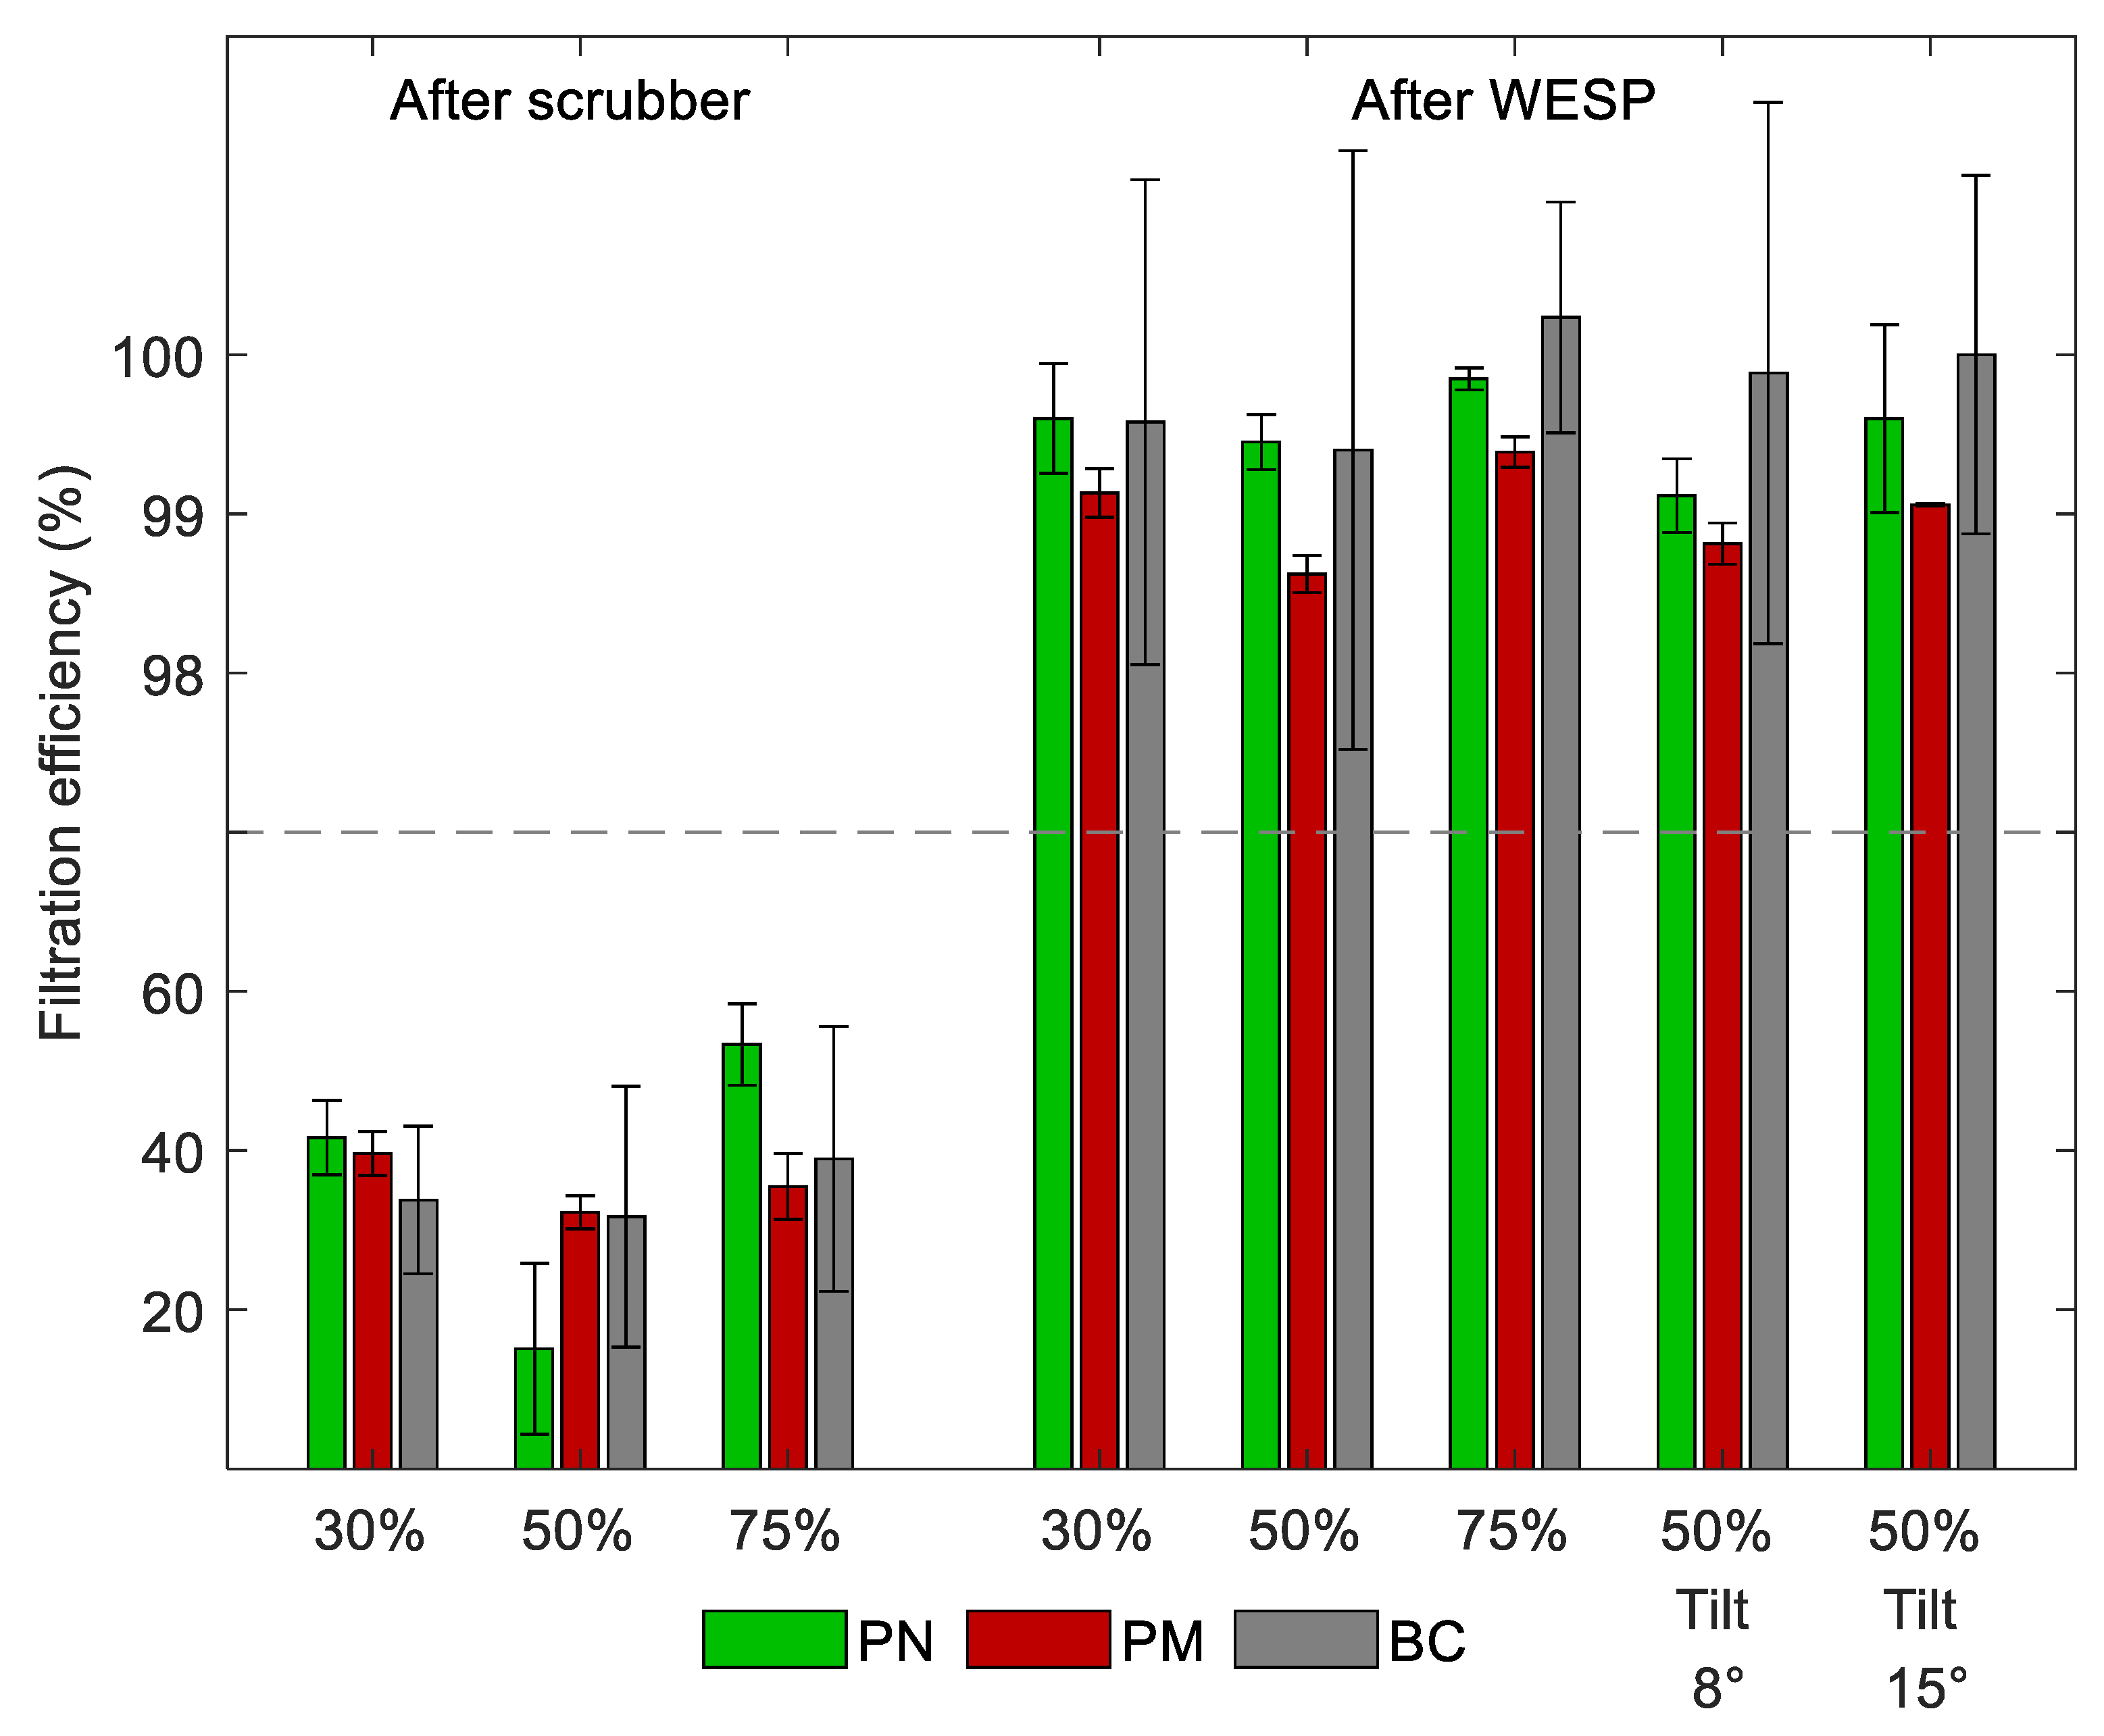
ceo is the average concentration from engine-out measurements. These concentrations include corrections of the dilution ratios in the dilution systems and dilution inside the WESP. Filtration efficiencies for different engine loads and aftertreatment combinations are shown in
Figure 5. Only the points measured with HFO were selected to the figure as with MDO the PN concentration after the scrubber was higher than before the scrubber, resulting in negative filtration efficiency. The calculation of the statistical uncertainties in
Figure 5 is presented in
Appendix A.
The scrubber reduced PN concentrations from 10 to 55% with HFO. The smallest reduction was observed for PN at a 50% load. Most likely, the scrubber reduced particles originating from the engine but also generated particles as the size distribution information suggested, resulting in a low filtration efficiency for PN for this load. For PM and BC, the filtration efficiency was more consistent compared to the PN, between 20 and 45% all cases and between 30 and 40% with HFO.
The entire system consisting of the scrubber and WESP removed particles effectively and the reduction efficiency was more than 98.5% in the case of HFO fuel for all the studied particle metrics and engine loads. The tilting of the system by 8° or 15° did not affect the filtration efficiency. In case of MDO, the filtration efficiency was 96.5% for PN and 99% for BC. PN and BC were removed by higher efficiencies than PM. This minimal difference may be related to semivolatile compounds, which were not filtrated by the WESP and were seen in the PM measurement because they were partly absorbed in the filter material.
3.4. Visible Smoke
In addition to PN, PM and BC emissions, visually observable smoke is a factor that interests shipping companies, especially in the cruise sector. To see the effect of the WESP on visible smoke, photos and videos were taken during measurements. Two photos taken from a video when the WESP was initially off and then switched on are shown in
Figure 6 along with the results from a simultaneous PN measurement. During these photos, the engine was running with HFO.
When the WESP was off, a highly visible exhaust plume was seen. After the WESP was switched on, visible smoke vanished. Simultaneous measurement of non-volatile >23 nm particles was used to study the effect. When the WESP was off, particle concentration was approximately 1.3 × 10⁷ 1/cm3. This is a smaller value than the after scrubber concentration and probably resulted from the diffusional deposition of particles in the WESP. When the WESP was switched on, the particle concentration dropped rapidly to negligible numbers in less than 1 min. One explanation for the vanishing smoke may be the absence of condensation nuclei, i.e., particles, which grow to larger sizes due to condensation and form highly visible smoke. This process may begin in the plume if exhaust is hot or already in the exhaust system if the exhaust temperature decreases. In the scrubber and WESP, the exhaust cools significantly, which may initiate the condensation process already in the scrubber located before the WESP. If particles have formed and grown before the WESP, the WESP easily removes those particles and visible smoke is not seen.
4. Discussion
Values describing the emissions, acquired in the measurements and calculated to per kWh values, are listed in
Table 3. Per kWh values were calculated from the measured concentrations corrected with dilution ratios multiplied with the full engine exhaust flow rates and divided by the engine powers at the measurement points. Note that the exhaust from the engine was not led into the system, only a portion of it. Thus, the reported emission values are indicative and represent achievable emissions if the all the exhaust was led into a larger system with similar design. Emissions from previous studies conducted with the same engine are presented in
Table A2 (
Appendix A).
In this study, with MDO fuel, the engine-out PM emission was 0.117 g/kWh and BC emission was 0.033 g/kWh at 50% load. These values are in line with a previous study, where 0.11 g/kWh of PM and 0.011 g/kWh of BC at a somewhat higher 75% engine load were measured from the same engine running with MDO [
25]. Moreover, in the case of HFO, engine-out results were similar. In this study, at a 30% load, PM was 0.874 g/kWh and BC 0.0599 g/kWh, while a previous study reported 1.03 g/kWh PM and 0.104 g/kWh BC at a slightly lower 25% load [
25]. At a 75% load with HFO, values of 0.915 g/kWh of PM and 0.029 g/kWh of BC were measured in this study, while previously almost equal 0.85 g/kWh of PM and 0.032 g/kWh of BC at the same load were measured [
25]. Matching results indicated that the engine and the measurement system were performing as in the previous study.
PN emissions were approximately 3 × 10
13 1/kWh in the case of MDO and without aftertreatment. Previously, higher concentrations, from 7 × 10
13 to 3 × 10
14 1/kWh, were measured from the same engine, which was operated in a different derated dual fuel configuration with MDO [
5]. Another study with different engine reported approximately 1 × 10
15 1/kWh PN emissions (>6 nm particles) [
26], while we measured approximately 3 × 10
14 1/kWh (>23 nm particles) without exhaust aftertreatment for HFO. These results agree relatively well when the difference in the instrument detection size range is considered.
The scrubber reduced non-volatile PN, PM and BC emissions mostly less than 50% in this study. The scrubber was a pilot-size unit and its performance was probably slightly lower compared to full-sized units. However, the results are in line with previous studies. Winnes et al. also reported values less than 50% in terms of PM reduction [
26]. Lehtoranta et al. determined PM reductions between 8 and 45% for scrubbers, low PM reduction values were achieved during low engine load operation, while the highest reductions were achieved during high load operation [
5]. Reductions in PN were minor; there was no significant reduction in the case of one engine and a 30% reduction in case of another engine [
5].
The WESP reduced particle emissions significantly, with more than 98.5% of particles in PM, PN and BC metrics in case of HFO. A previous study conducted with a different WESP and a different engine reported a PN filtration efficiency of up to 98% [
20]. In general, ESPs tend to have relatively high filtration efficiencies. In coal power plants, filtration efficiencies have been for instance for PM10 and PM1 98.7% and 99.3% for Dry ESP and 87.8% and 84.4 for WESP [
13]. Another study conducted in a coal power plant reported WESP filtration efficiencies for PM from 30% to 80% [
14]. A pilot-type WESP installed in waste incinerator achieved mass filtration efficiencies mostly in the order of 98 to 100% at high operation voltages [
16].
The filtration efficiency of the WESP significantly affects the engine emission factors. After the WESP, non-volatile PN emissions were approximately 1 ·10
12 1/kWh slightly depending on the engine load. Engines operating with natural gas (NG) in a dual fuel configuration with a pilot oil ignition produced PN emissions of approximately the same magnitude [
5,
27]. PM emissions were mostly below 0.01 g/kWh in our study when the WESP was on. When the same engine was configured and operated in dual fuel NG mode, PM emissions were higher, approximately 0.02–0.03 g/kWh [
5]. However, an engine originally designed for NG produced very low PM emissions, approximately 0.0002 g/kWh [
27], which is lower than what we measured after WESP. In WESP on state, BC emissions were below 0.0005 g/kWh, which is the same level achieved with NG [
5] and significantly lower than that achieved with MDO or HFO without aftertreatment.
Tilting of the system by 8° or 15° used to mimic the heeling of the ship did not significantly affect the particle concentrations measured after the WESP. Thus, it is expected that WESP with a similar design could be operated on-board a ship on sea without a decrease in the performance.
This study showed that a scrubber alone is not a highly effective method in reducing particle emissions, especially when compared to the system consisting of both a scrubber and a WESP. According to particle number concentration and particle size distribution measurements, a scrubber may generate new non-volatile particles although it reduced PM and BC originating from the engine. New particles, potentially originating from the scrubber, were seen in the 20–40 nm aerodynamic size range when the engine was running with an MDO or HFO. A similar additional mode in particle size distribution was also seen in a previous study [
26]. We have a similar hypothesis on the origin of these new particles. It is possible that water sprays in the scrubber act as particle generators because water in the scrubber is not clean. It contains NaOH added to stabilize pH and sulfur-containing ions, which can generate non-volatile particles seen in the PN measurement. In addition, some organic compounds, ash compounds and soot may be present in water circulating in the scrubber and contribute to the seen particle mode.
The measurements indicate that the combination of a scrubber and a WESP is a potential aftertreatment system for large marine engines running with HFO, leading to significantly lower emissions than the use of scrubbers only, see, e.g., [
28], without changing into different fuel such as natural gas. As the upscaling of the system is relatively simple, a larger system could be constructed with a design flow rate large enough for the entire engine exhaust flow. Performance of such a full-scale system could be tested in on-board measurements.


 ,
, 