Article

Permeability of Hydrate-Bearing Sediment Formed from CO2-N2 Mixture

1
State Key Laboratory of Heavy Oil Processing, China University of Petroleum-Beijing at Karamay, Karamay 834000, China
2
State Key Laboratory of Heavy Oil Processing, China University of Petroleum, Beijing 102249, China
3
China Offshore Oil Engineering Co., Ltd., Tianjin 300461, China
*
Authors to whom correspondence should be addressed.
J. Mar. Sci. Eng. 2023, 11(2), 376; https://doi.org/10.3390/jmse11020376
Submission received: 11 January 2023 / Revised: 2 February 2023 / Accepted: 7 February 2023 / Published: 8 February 2023
(This article belongs to the Special Issue Gas Hydrate—Unconventional Geological Energy Development)

Abstract

:
CO2-N2-mixture injection can be used for the exploitation and reformation of natural gas hydrate reservoirs. The permeability evolution of sediments in the presence of CO2-N2 hydrate is very important. In current permeability tests, hydrate-bearing sediment formed from CO2-N2 gas mixture is rarely involved. In this work, hydrate-bearing sediment was formed from CO2-N2 mixtures, and a constant flow method was employed to measure the permeability of the hydrate-bearing sediments. The effects of CO2 mole fraction and hydrate saturation on the permeability were investigated. The results show that gas composition is the key factor affecting hydrate formation. Hydrate saturation increases with increasing CO2 mole fraction in the gas mixture. The presence of hydrate formed from a CO2-N2 mixture leads to a sharp permeability reduction. The higher the fraction of CO2 in the injected gas mixture, the lower the sediment’s permeability. Our measured permeability data were also compared with and fitted to prediction models. The pore-filling model underestimates the permeability of hydrate-bearing sediments formed from a CO2-N2 gas mixture. The fitted hydrate saturation index in the Masuda model is 15.35, slightly higher than the general values, which means that the formed hydrates tend to occupy the pore center, and even block the pore throat.

1. Introduction

Natural gas hydrate (NGH), commonly known as “combustible ice”, is an ice-like solid crystal composed of natural gas and water molecules [1]. Natural gas hydrate is widely distributed in marine and terrestrial permafrost, and is considered to be an alternative energy in the future [2]. Hydrate reservoirs have been found in the Shenhu sea area of China, which has been recognized as one of the most favorable NGH accumulation areas in the world. The recoverable natural gas hydrate resource in the South China Sea is estimated to be 5.25 × 10¹² m3 [3]. In 2013, Japan carried out the first international trial production of natural gas hydrate in the Nankai Trough, but it lasted only two weeks due to serious sand production [4]. China carried out two pilot production tests in the Shenhu area in 2017 and 2020, which were the first successful and safe vertical and horizontal well production trials in the shallow surface layer of a deep seabed [5]. At present, the methods for promoting the release of natural gas from hydrate mainly include traditional depressurization, heat injection, inhibitor injection and novel CO2 replacement. The combination of depressurization and heat/inhibitor injection can improve the production efficiency; however, it still cannot solve the geological stability problem caused by hydrate dissociation [6,7].
The CO2 replacement method can replace natural gas hydrate with CO2 hydrate, theoretically realizing energy development and greenhouse gas storage, as well as maintaining geological stability [8]. However, when pure CO2 is used, the gas replacement rate is low, and it also can lead to engineering problems, such as wellbore plugging. On this basis, a CO2 + N2 injection method has been derived [9]. Compared with pure CO2, injection of a CO2 + N2 gas mixture can greatly improve the recovery efficiency of natural gas hydrate, can reduce engineering risks, and is considered to be a technological development with great application potential. In 2012, the United States carried out a gas hydrate pilot production project in the permafrost zone on the northern slope of Alaska using CO2-N2 (23:77) injection [10]. A total volume of 24,000 m3 of gas mixture was produced in the test. Kang et al. conducted an experimental study on the methane release process of the injected air + CO2 mixture (20 mol% CO2) [11]. Li et al. compared the methane release performance of fracture-filled hydrate when injecting a mixture containing high N2 (75 mol% N2) and high CO2 (75 mol% CO2) under different conditions [12]. Kan et al. conducted a numerical simulation of gas production from permafrost hydrate deposits enhanced with CO2/N2 injection [13]. They found that an increase in the N2 mole fraction can significantly improve the CH4 production efficiency, but when the N2 mole fraction is higher than 50%, serious N2 production results in difficult separation of the produced gas.
In addition to the exploitation of natural gas hydrate, CO2 injection is also used to reform the natural gas hydrate reservoir. Permeable cap rocks make hydrate reservoirs vulnerable to the invasion of external seawater during the exploitation process [14,15]. To overcome this problem, reformation of the natural gas hydrate reservoir by CO2 injection has been proposed [16,17]. In this method, CO2 is injected into the permeable cap rock and transforms into solid CO2 hydrate, acting as an artificial CO2 hydrate cap rock, with low permeability, around the natural gas hydrate reservoir. Sun et al. and Cui et al. verified the feasibility of CH4 hydrate reservoir reformation by CO2 injection [17,18]. Furthermore, Li et al. conducted tests on hydrate reservoir reformation by CO2 + N2 injection [19]. The research results showed that the injection of mixed gas can also form an impermeable CO2 hydrate cap with good geological stability, which can effectively reduce water production and improve the recovery of CH4 during the depressurization process.
During the above injection and production operations, fluid flow, heat transfer and mass transfer in the reservoir are subject to an evolution of the reservoir’s permeability [20,21]. Researchers have endeavored to establish the relationship between hydrate occurrence and sediment permeability through a series of experiments and numerical simulation studies. In early prediction models, the pore structure in the sediment was simplified as a parallel capillary tube bundle, and the hydrate could be uniformly wrapped in the capillary wall (capillary-coating model) or could grow in the capillary filling (capillary-filling model) [22]. In addition, some researchers believe that the connectivity of hydrate bearing sediments is not only related to the hydrate saturation and the hydrate occurrence, but is also affected by the pore structure of sediments [23,24]. In the Kozeny–Carman permeability equation (KC equation), the flow section is formed by the package of sediment particles in an irregular geometric shape, and the influence of channel tortuosity is considered. Therefore, based on the KC equation, researchers have established sediment permeability prediction models in the presence of grain-coating hydrate and pore-filling hydrate [22].
Kumar et al. tested the permeability of CO2-hydrate-bearing sediments [25]. They found that, when the saturation of CO2 hydrate is less than 35%, the measured data are consistent with the predicted results of the grain-coating model, and when the saturation of hydrate is greater than 35%, the measured permeability data are consistent with the predicted results of the pore-filling model. Delli et al. also observed a similar phenomenon using different sands [26]. Li et al. [27] prepared methane hydrate sediment samples in three sand beds with different particle sizes. They found that, when the hydrate saturation is less than 10%, the permeability data are in good agreement with the pore-filling model, but when the hydrate saturation is greater than 10%, their measured value is far less than the predicted value of the pore filling model. They believed that the increase in hydrate saturation changed the pore shape and, on the basis of the KC equation, they modified the influence of hydrate on the fluid flow cross-sectional area and established a new pore-filling prediction model. Li et al. used NMR to measure the permeability of hydrate-bearing sediment samples in the South China Sea [28]. They also found that the pore-filling model underestimated the reduction in the permeability of hydrate to sediment. Dai et al. investigated the influence of the heterogeneity of hydrate distribution on sediment permeability [29]. Wang et al. used the excessive free gas method to prepare a low saturation hydrate sample (hydrate saturation less than 30%) and used CT scanning technology to show that the hydrate is unevenly distributed as a filling type [30,31,32]. They reconstructed the pore structure of hydrate-bearing sediment based on a pore network model, and calculated the hydrate saturation, capillary pressure and permeability. Their calculation results were in good agreement with the pore-filling model.
At present, for CO2-N2 mixture, most relevant studies have focused on the thermodynamic and kinetic behaviors of hydrate formation/dissociation in sediments, as well as the performance of enhancing CH4 hydrate recovery [33,34,35,36]. For the application of CO2 + N2 mixture injection in the exploitation and reformation of natural gas hydrate reservoirs, the permeability evolution of sediments during CO2-N2 hydrate formation after gas injection is critical. However, in current permeability tests, hydrate-bearing sediment, formed from CO2-N2, is rarely involved. In this work, hydrate-bearing sediments were formed from a CO2-N2 mixture, and permeability tests were carried out. The purpose of this study is to expand the permeability data of CO2-N2 hydrate, master the change rule of permeability with gas injection composition and establish the relationship between permeability data and hydrate saturation.

2. Experimental Design

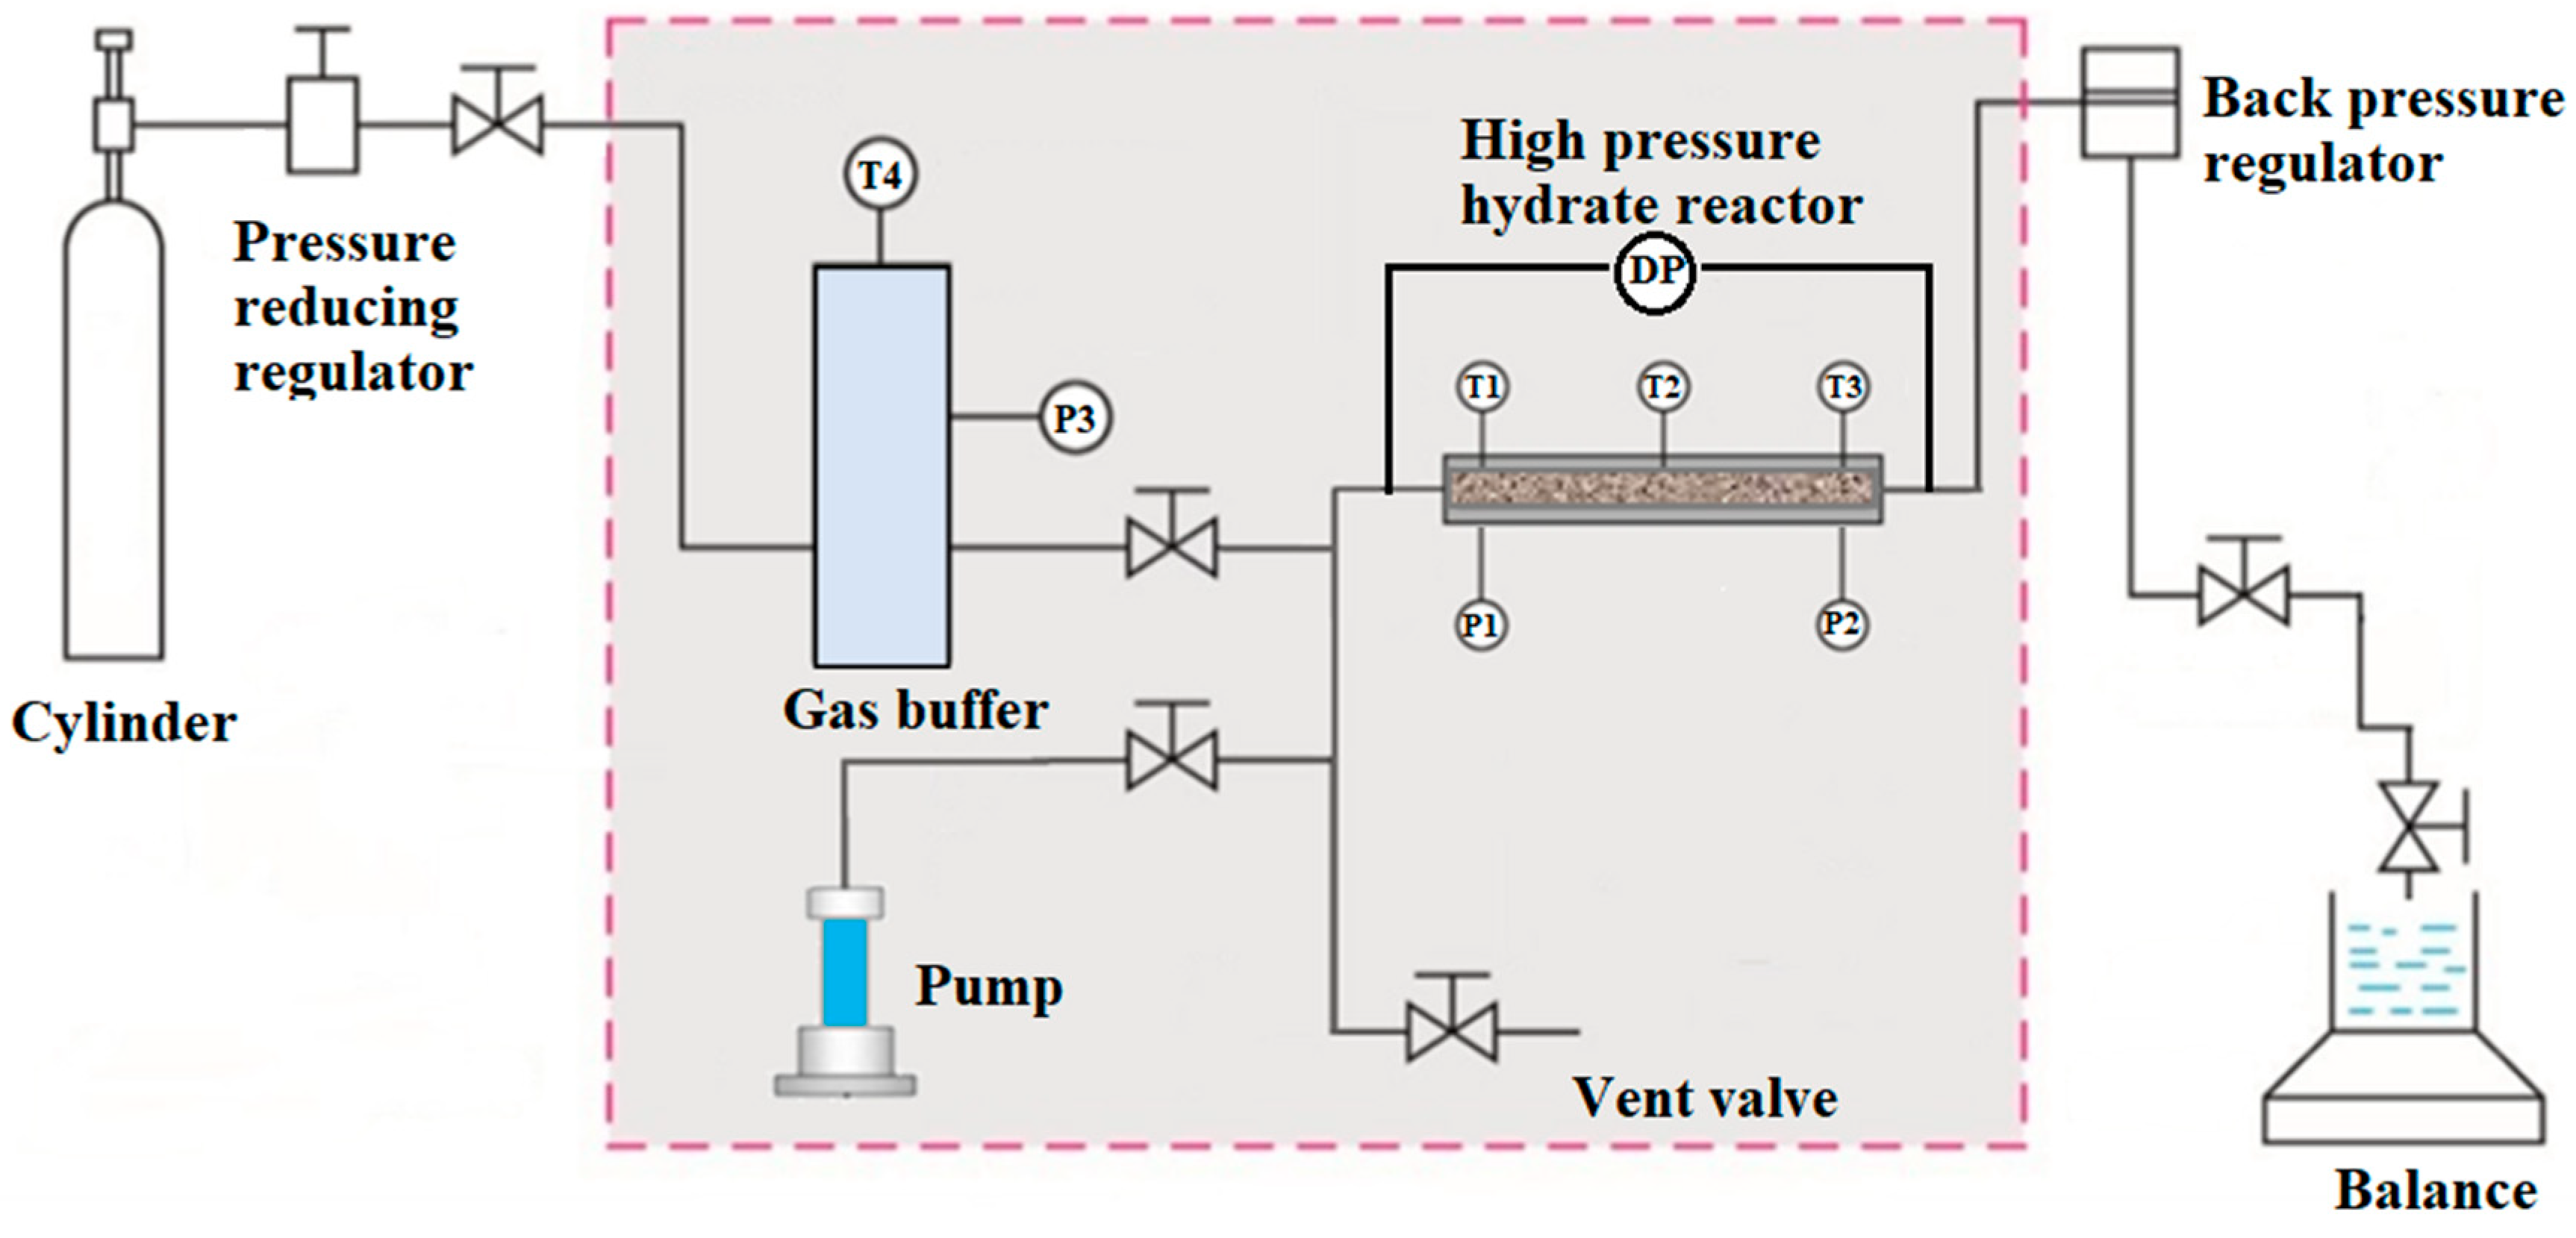
2.1. Devices and Materials
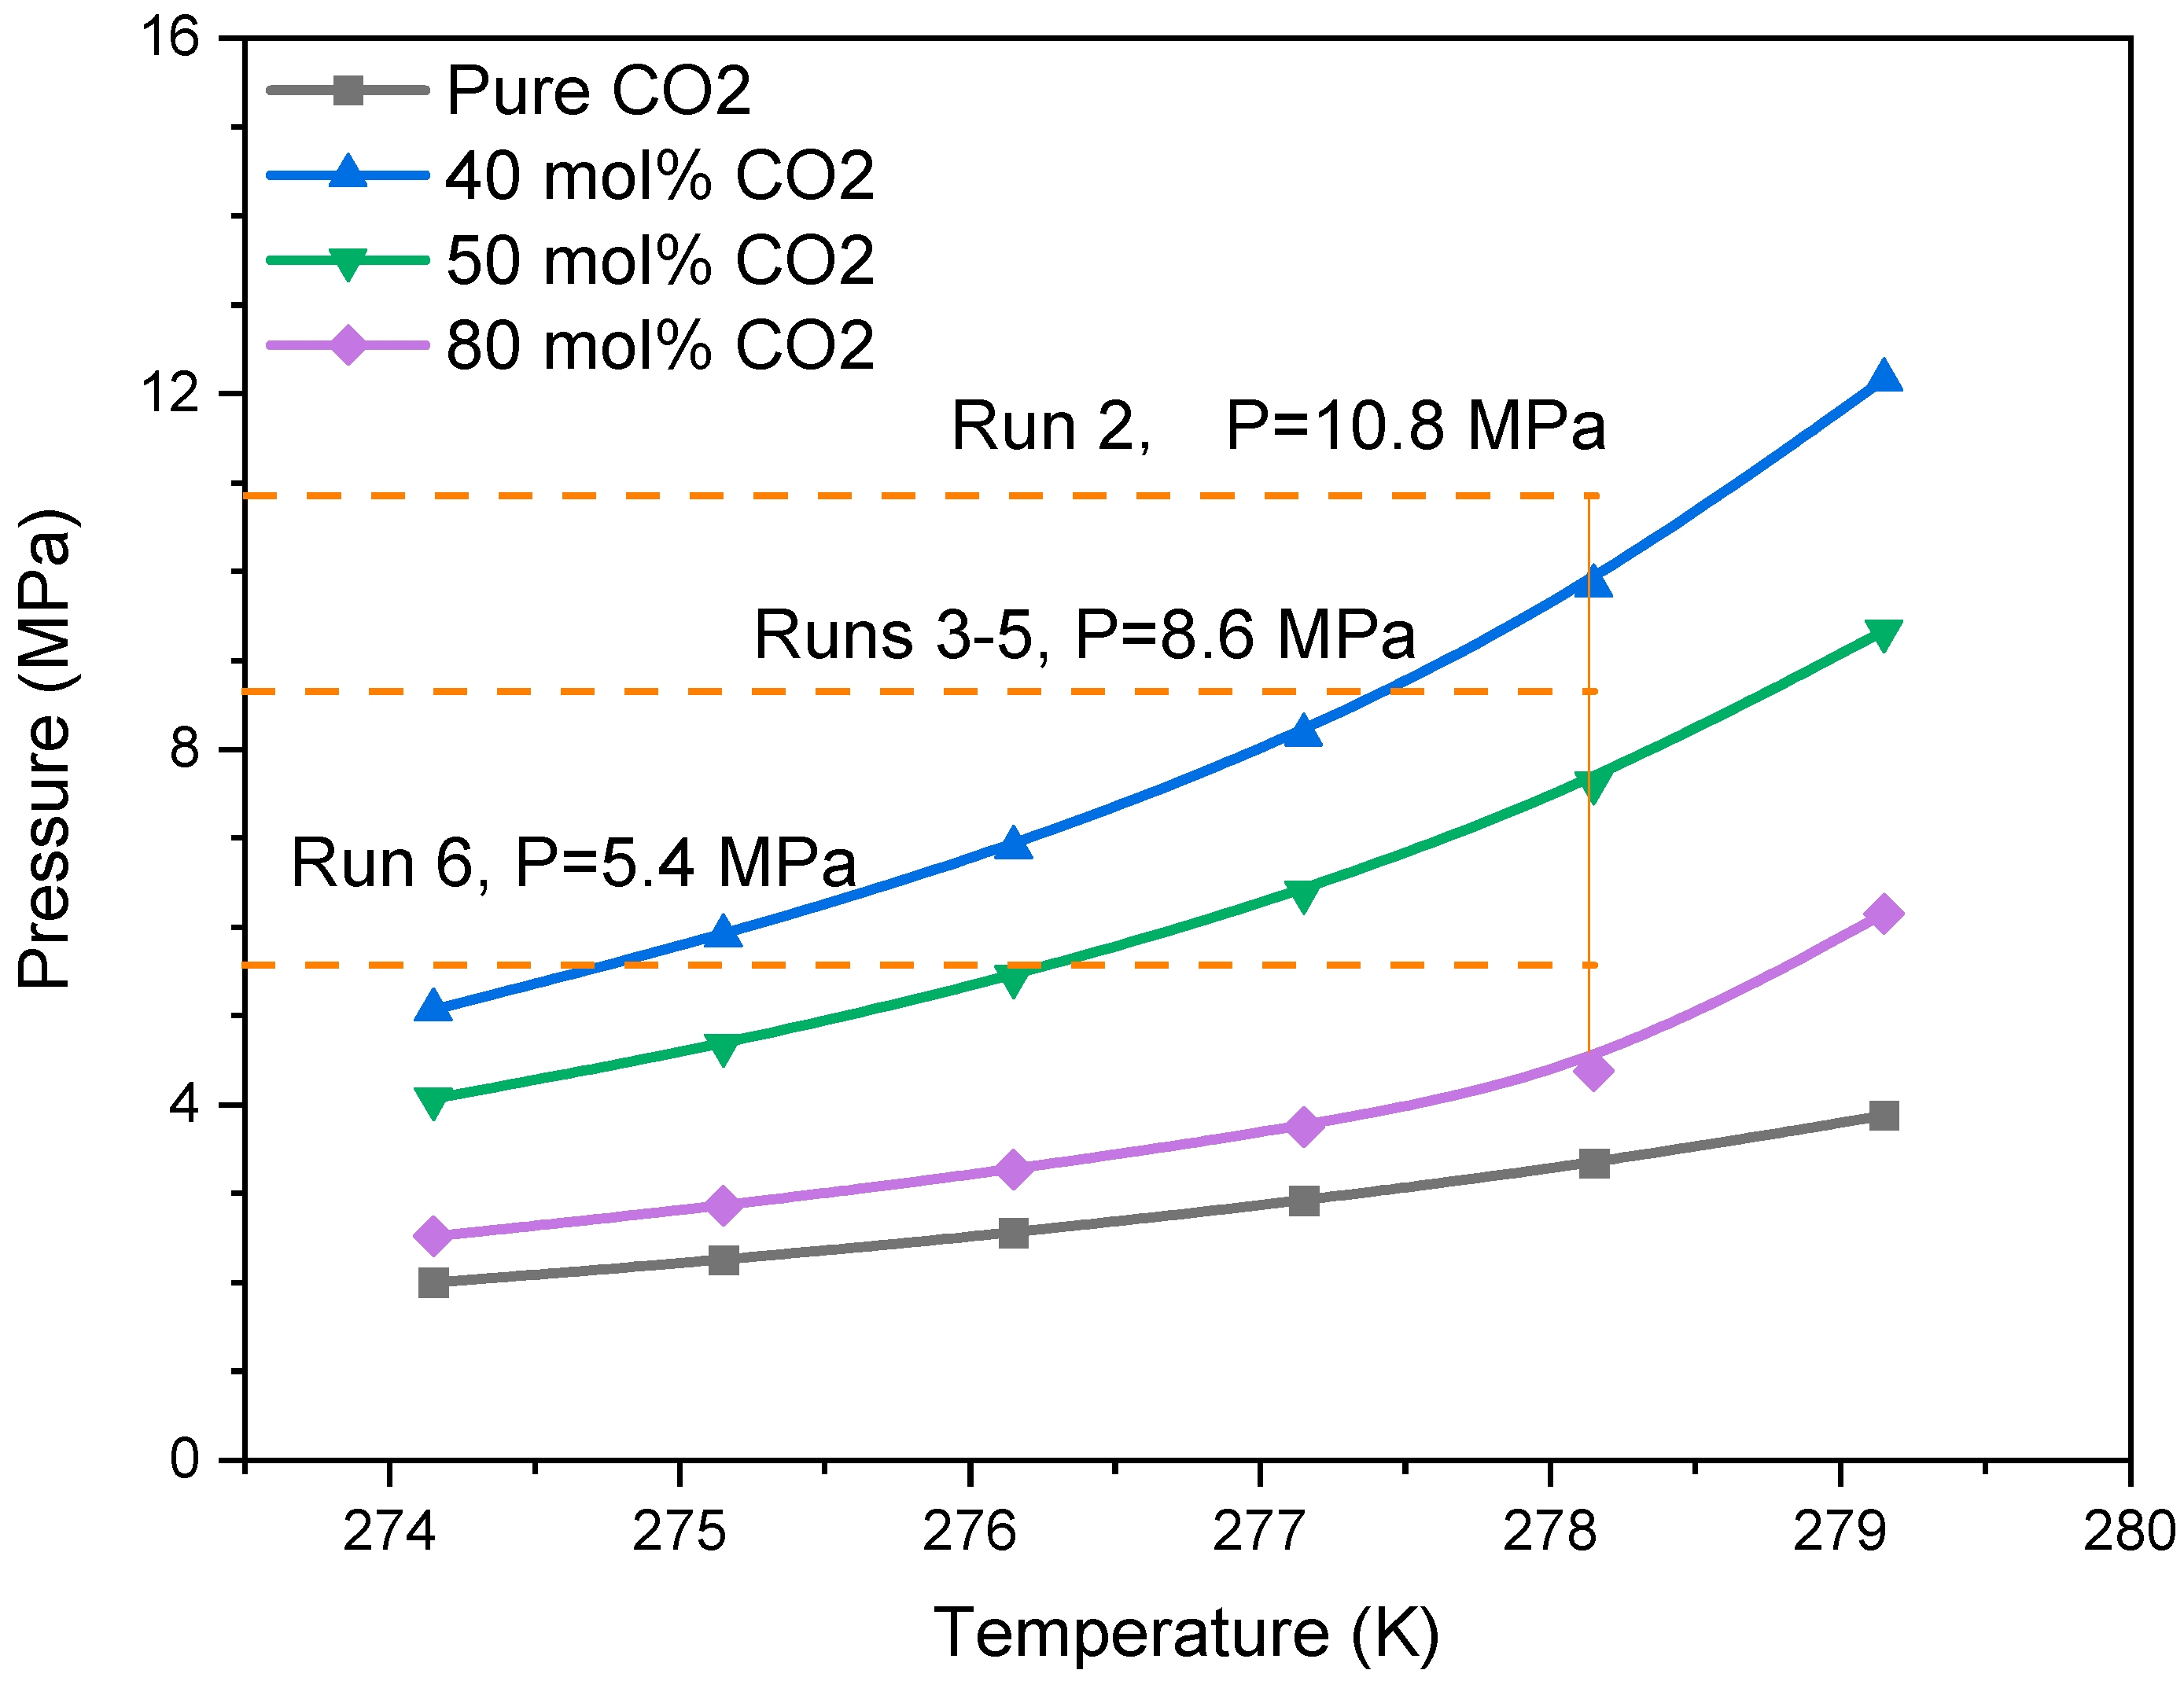
Figure 1 shows the permeability measurement apparatus, which included four parts: a high-pressure hydrate reactor (placed horizontally), a gas mixture buffer tank, a temperature control system, and a data acquisition system. The high-pressure hydrate reactor had an inner diameter of 35 mm and a length of 300 mm. Its effective volume was 250 mL, in which two pressure transducers and three temperature sensors were located, as shown in Figure 1, and the maximum work pressure was about 40 MPa. The gas buffer tank’s effective volume was 500 mL and its pressure and temperature were also monitored by a set of sensors. The temperature sensor was a Pt100 thermocouple with an accuracy of ±0.1 K. The accuracy of the pressure sensor was ±0.1%. A differential pressure sensor with an accuracy of ±0.25% was used to measure the differential pressure between the inlet and outlet of the high-pressure hydrate reactor. A pump (Stigma 300, Core Laboratories, Houston, Texas, U.S.) was used for the permeability measurements, and the system pressure was controlled by a back-pressure regulator. The injected water was recovered from the outlet by a glass beaker placed on an electronic weighing balance. The whole experimental apparatus was placed in a constant temperature room with a control accuracy of ±0.1 K. The data acquisition system collected temperature and pressure data during the experiment in real time.
The simulated sediment used in this study was 150-mesh quartz sand with an average size of 129.75 μm and a reference density of 2.6 g/mL. CO2 gas, with a purity of 99.9%, and CO2/N2 mixtures were provided by the Beijing Beifen Gas Industry Corporation.

2.2. Procedures

Firstly, dry quartz sands were completely mixed with a certain amount of water, to simulate marine sediments with different water saturation, and then prepared wet sands were tightly packed into the high-pressure hydrate reactor before the reactor was sealed and vacuumed for 30 min. Afterwards, the CO2-N2 mixture was injected into the hydrate reactor from the buffer tank, slowly, with a target pressure that was higher than the hydrate phase equilibrium pressure. In this study, the constant temperature was kept stable at 278.15 K during the whole experiment, and the formation-driven force was set at about 1 MPa. High pressure will easily lead to CO2 liquefaction, and low pressure will lead to a limited hydrate formation rate. Figure 2 shows the hydrate phase equilibrium data with different gas compositions, which were calculated using Chen–Guo model [37]. During hydrate formation, the pressure in the reactor was kept constant by injecting gas mixture from the gas buffer tank into the reactor. When no gas was injected, it was considered that the hydrate growth process had stopped. After hydrate formation, CO2-saturated water was injected into the whole reactor, and residual gas in the reactor was displaced via the outlet of the reactor. The pressure in the hydrate reactor at this stage was kept stable to avoid hydrate dissociation. After the water injection, the whole system was kept stable for 24 h for hydrate re-crystallization; thus, the hydrate samples were prepared. After preparation of the hydrate samples, flow tests were conducted to measure the permeability of the hydrate-bearing sediments. In order to avoid hydrate decomposition caused by the reestablishment of gas-solid equilibrium between hydrate and gas phases during gas injection, considering the incompressibility of water and the low solubility of hydrate in water, water was selected for permeability measurement in this experiment. The outlet valve was opened and the back-pressure regulator was adjusted to target pressures higher than the hydrate phase equilibrium pressure, as shown in Figure 2. After the inlet valve was opened, water saturated by CO2 was injected into the reactor again with a constant flow rate of 3.64 mL/min. After water breakthrough, the water produced from the outlet was recovered and measured. When the mass of injected water was closed to the produced water, it could be considered that the water flow in the hydrate-bearing sediments was stable. In this stable stage, the flow test lasted about 10 min. During the test, it is necessary to observe whether there is bubble overflow in the outlet water and judge whether the hydrate is decomposed in a large amount. The differential pressure measured at the stable stage was used to perform the permeability calculation. The measurements were repeated three times in each run, and the average value was used as the permeability of the hydrate-bearing sediments. For comparison, the intrinsic permeability of the sediment was also measured without the presence of hydrate during the same flow tests. Different from the runs with hydrate-bearing sediment, the hydrate-free sediment was firstly saturated by water before water flow testing. The experimental conditions and results are listed in Table 1.

2.3. Data Processing

In this study, Darcy’s law was used to calculate the permeability of water in porous media:
K = μ Q L A Δ p
where K is the effective permeability (m2); μ is the dynamic viscosity of the fluid (Pa·s); Q is the flow rate of fluid through the reactor (m3/s); A is the cross-sectional area of the reactor (m2); L is the effective length of the reactor (m); and Δp is the pressure difference between both ends of the reactor (Pa). Darcy’s law is applicable to laminar fluid, so the water volume rate of injected water in this study was kept at a low level (3.64 mL/min) during the flow test.
In addition, relative water permeability K r w is defined as
K r w = K H K 0
where K H is the effective water permeability of hydrate-bearing sediments, and K 0 is the intrinsic water permeability of hydrate-free sediments. It should be noted that the hydrate-bearing sediment was saturated by water before flow testing; a single water phase was flowable in the sediment during flow testing.
The amount of formed hydrate in the reactor was determined by gas consumption during hydrate formation. The gas consumption can be calculated by BWRS EOS based on the pressure change in the gas buffer tank [38]. Hydrate saturation in different runs is the volume ratio of hydrate to pore space. The hydrate saturation and corresponding relative permeability in each run is shown in Table 1.

3. Results and Discussions

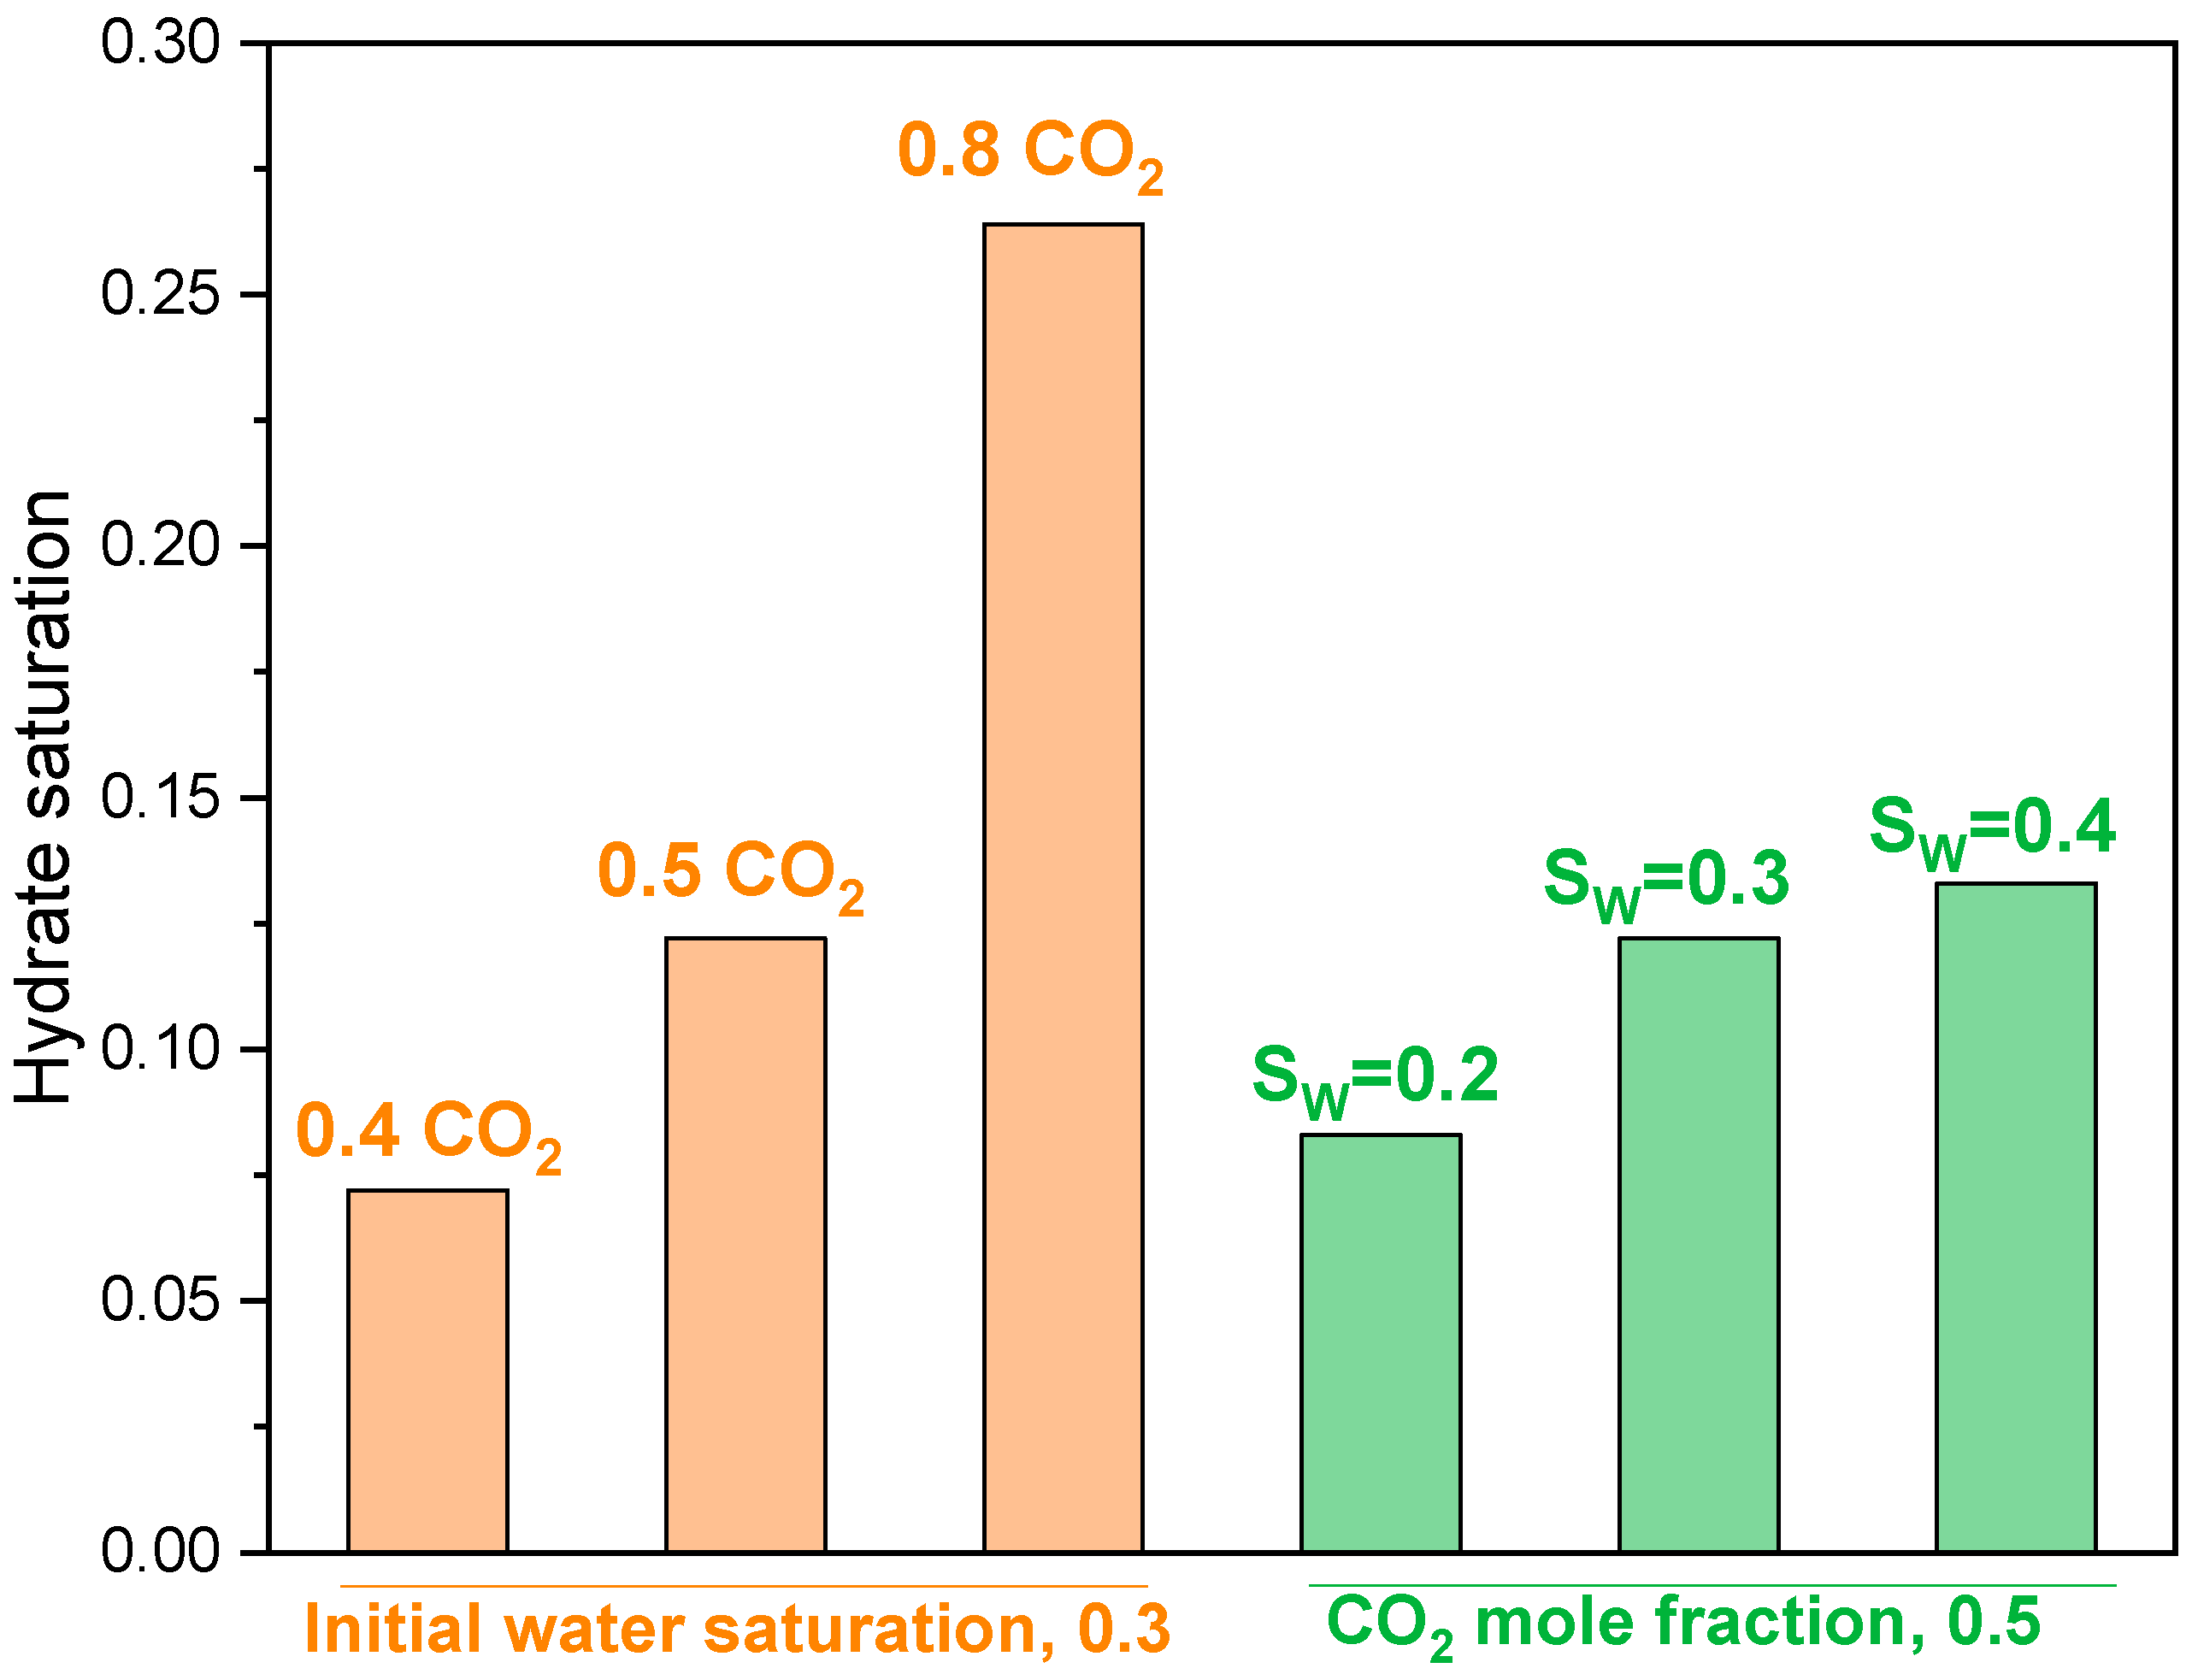
3.1. Hydrate Saturation

Hydrate saturation under different experimental conditions is shown in Figure 3. It can be seen from the figure that, when the mole fraction of CO2 is 50%, the obtained hydrate saturation increases with the increase in initial water saturation, but the increase amplitude is small. This is because, with the increase in water saturation, the distribution of water is relatively more concentrated, and the gas–water interface area decreases, which restricts the growth of hydrate. In addition, it can be seen that, when the initial water saturation is the same (SW = 0.3), the obtained hydrate saturation gradually increases with increasing CO2 content in the gas mixture (Run 2, Run 4 and Run 6). As shown in Figure 2, the equilibrium pressure of hydrate formation from 80% CO2 + 20% N2 and 40% CO2 + 60% N2 at 278.15 K is about 4.4 MPa and 9.8 MPa, respectively. When the N2 content is high, with the formation of hydrate, CO2 is gradually enriched in the hydrate phase and N2 is enriched in the gas phase, which leads to the gradual reduction in the driving force for hydrate formation, resulting in low hydrate saturation. When the concentration of CO2 in the gas is high, the formation process always maintains a relatively high driving force, so the amount of hydrate formation is relatively large. It can be seen from Table 1 that, when the CO2 content in Run 6 is 80%, the hydrate saturation reaches 0.264, almost twice that of Run 4 (50%). However, for all experimental groups with a CO2 content of 0.5, the obtained hydrate saturation is less than 0.14, and the difference is small. This shows that gas composition is the key factor affecting hydrate formation and transformation.
In this study, the initial driven force for hydrate formation was 1 MPa, which also restricted further hydrate formation. It is evident that higher formation pressure is conductive to obtain high hydrate saturation. However, for the CO2-N2 gas mixture, CO2 liquefication should be avoided during gas injection in the stage of hydrate preparation. The liquefication pressure of pure CO2 and 40% CO2 + 60% N2 gas mixture at 278.15 K is about 4 MPa and 5.76 MPa, respectively [32]. In Run 6, the suitable pressure for CO2-N2 injection ranges from 4.4 MPa to 5.76 MPa. Thus, the range of initial pressure of the injected gas mixture is very limited. We thought that it may be difficult to obtain high hydrate saturation from CO2-N2 gas mixture under mild experimental conditions, especially when the N2 content is high in the feed gas.

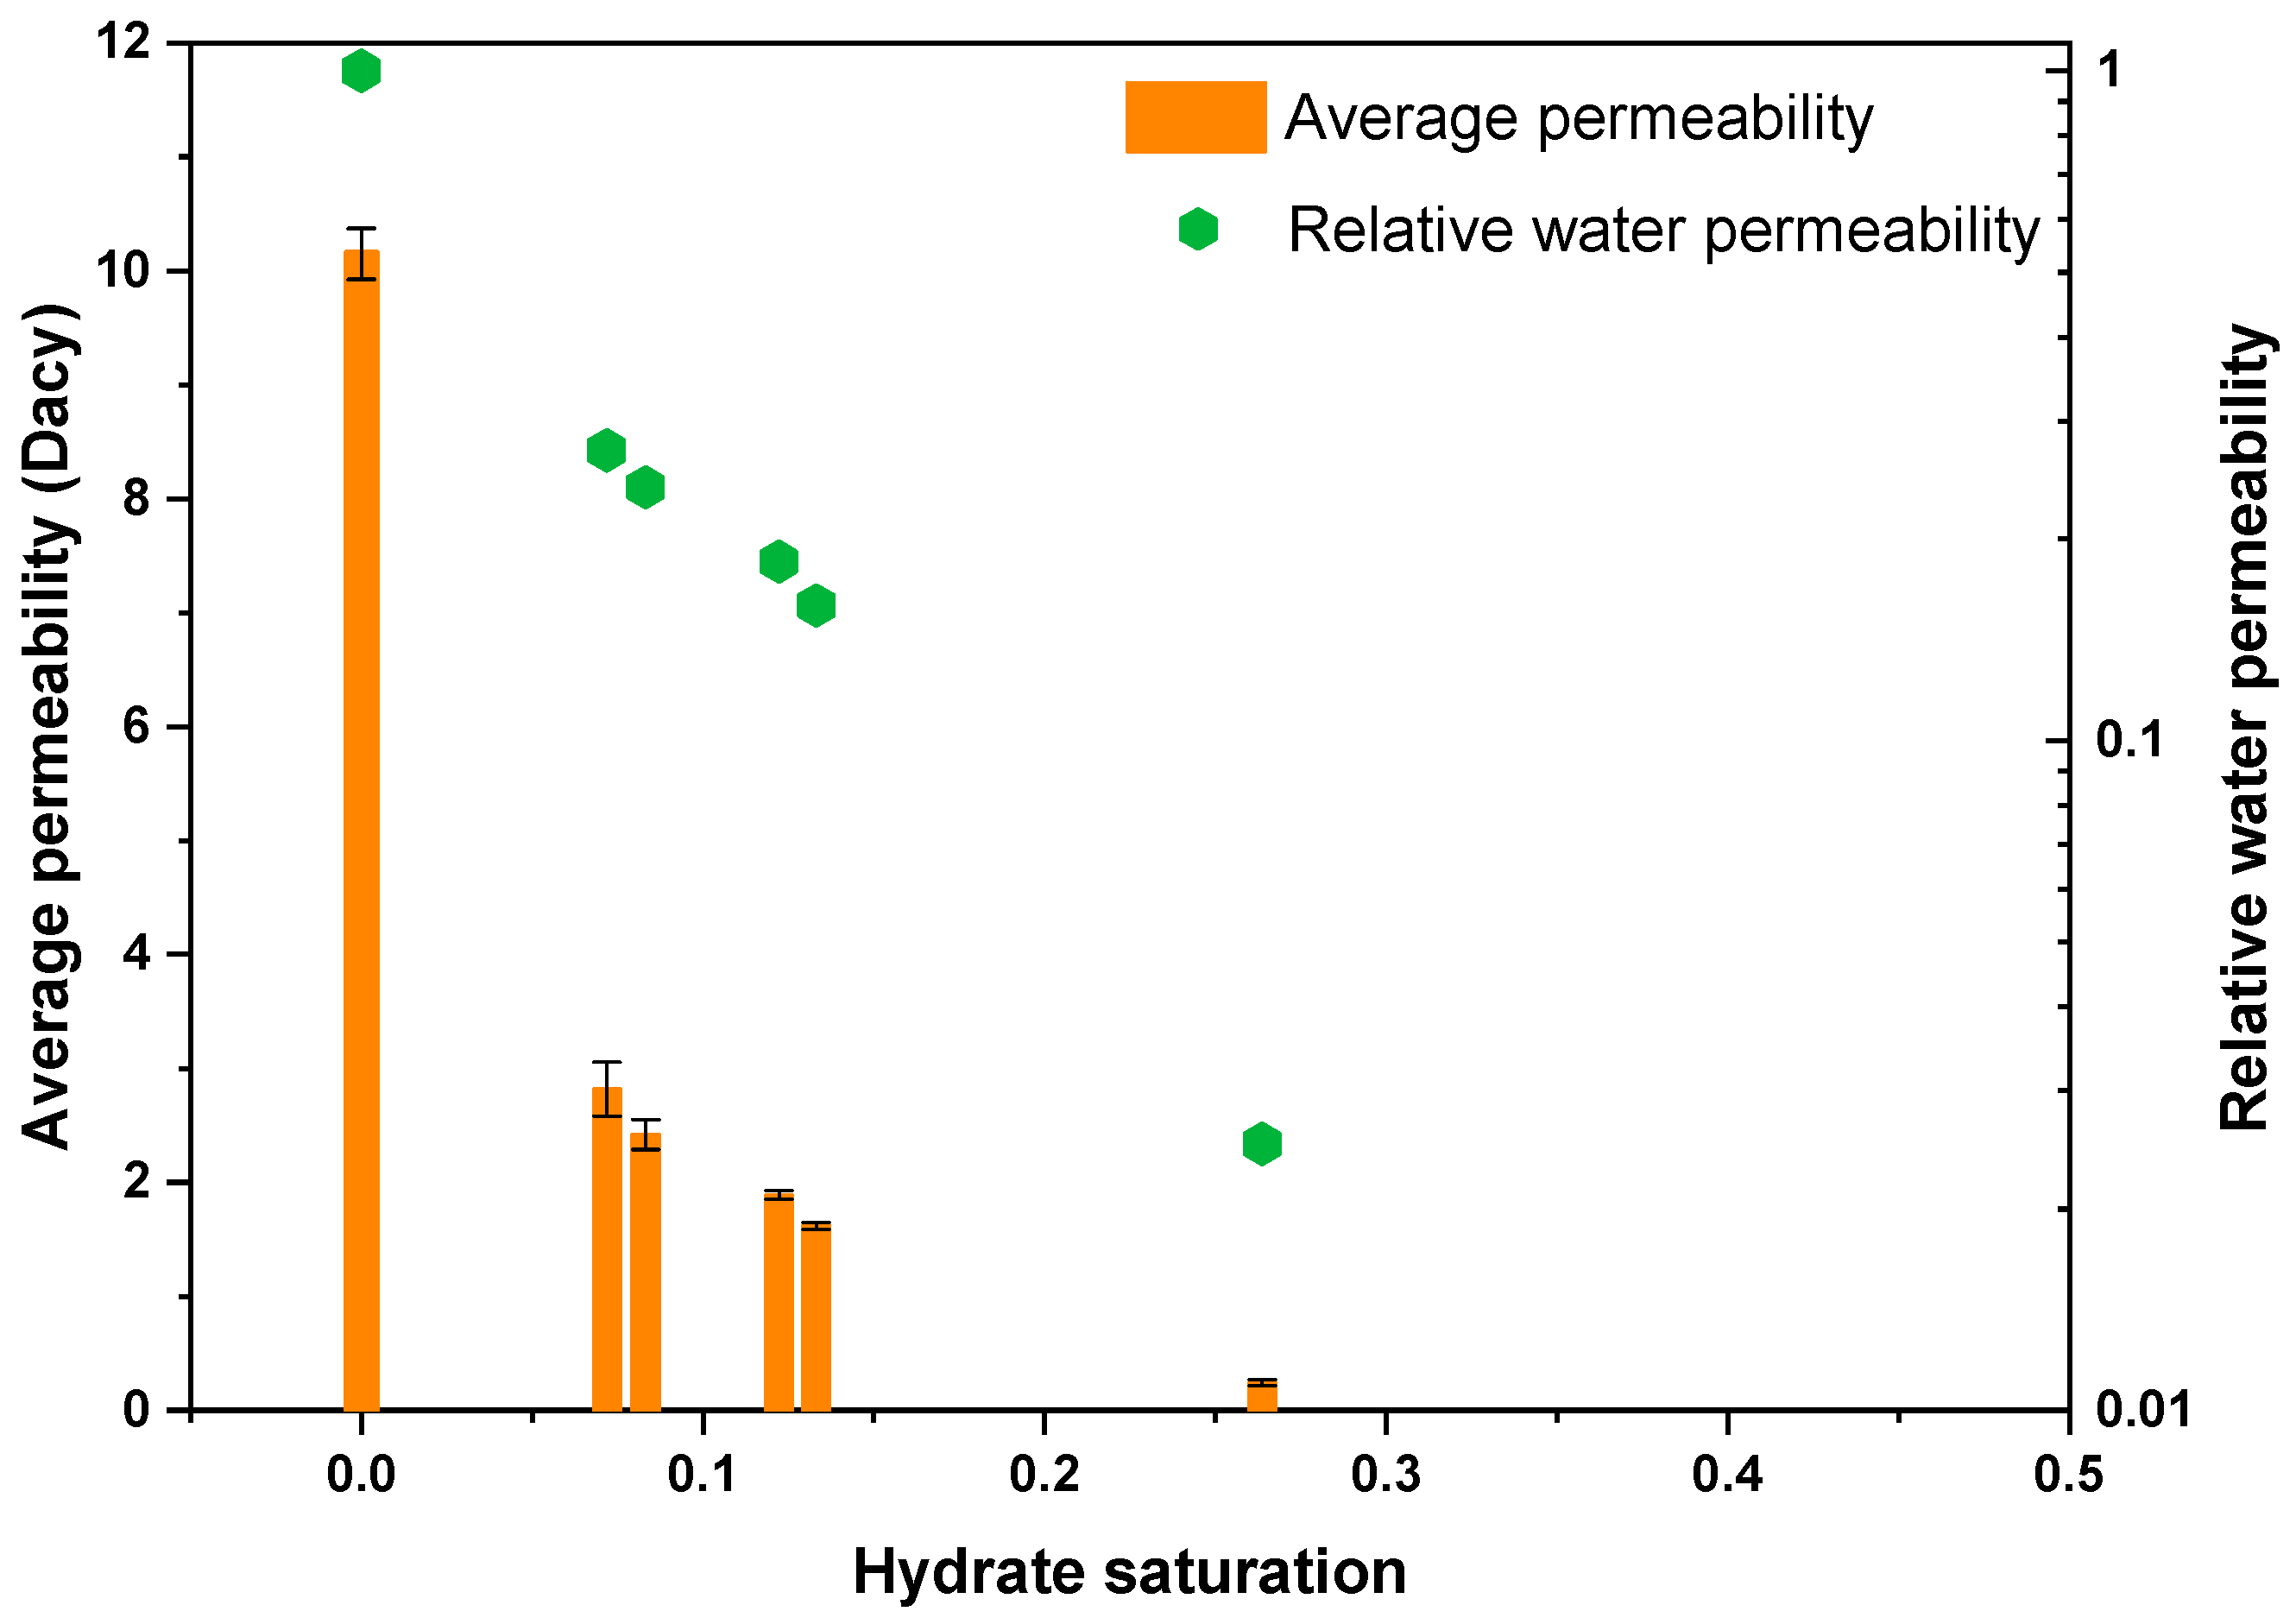
3.2. Permeability of Hydrate-Bearing Sediments

Figure 4 shows the change rule of temperature in the sand layer and the pressure difference between the inlet and outlet during water injection measurement (taking Run 6 as an example). It can be seen from the figure that the temperature in the sediment slightly fluctuates (±0.2 K) during water injection, and the temperature in the reservoir tends to be stable after about 19 min. Since there are almost no bubbles in the liquid collected at the outlet, temperature reduction caused by the decomposition of the hydrate can be ruled out. The fluctuation is caused by the fact that the temperature of the injected water is slightly lower than that in the reservoir. After 19 min, as shown in Figure 4a, when the temperature in the reservoir is stable, the pressure difference between the inlet and outlet also tends to be stable (Figure 4b), which indicates that the fluid flow process in the sediment tends to be stable. The average differential pressure between the inlet and outlet during this period is 101 kPa (Figure 4b); this figure was used to calculate the permeability of hydrate-bearing sediments.
The average permeability and relative permeability values calculated by each group of experiments are shown in Table 1 and Figure 5. The intrinsic permeability of the sand layer is 10.15 Darcy, but when there is hydrate in the sand layer, the permeability of the sand layer sharply decreases. Owing to the different hydrate saturations obtained from different initial gas compositions, the permeability of the sand layer shows a significant negative correlation with the CO2 mole fraction in the initial gas. In Run 2 (CO2 mole fraction, 0.5), the hydrate saturation is 0.072, but the permeability of the sand layer decreases to 2.82 Darcy and the relative permeability is 0.278. When the CO2 mole fraction reaches 0.8 (Run 6), the hydrate saturation in the sand layer reaches 0.264, and the permeability and relative permeability of the sand layer is 0.243 and 0.024 Darcy, respectively.
The permeability results have some implications for using CO2 + N2 injection for the purpose of NGH reservoir exploitation and reformation. When methane hydrate is extracted by injecting CO2 and nitrogen into the formation, if the CO2 content in the injection steam is high, it is easy to form hydrate with high saturation, sharply reducing the permeability of sediments, blocking the gas migration channel and limiting the migration of the injected gas. Therefore, in the process of NGH exploitation by CO2 + N2 injection, it is necessary to regulate the gas composition to make the gas spread more widely and improve production efficiency. When mixed gas is injected into the formation with the goal of reforming the methane hydrate reservoir, a high CO2 content is conducive to the formation of an artificial hydrate caprock, which can achieve a good plugging effect. Li et al. successfully used CO2 + N2 mixed gas (50–75% CO2) to build a relatively closed artificial hydrate cover above the methane hydrate [19].

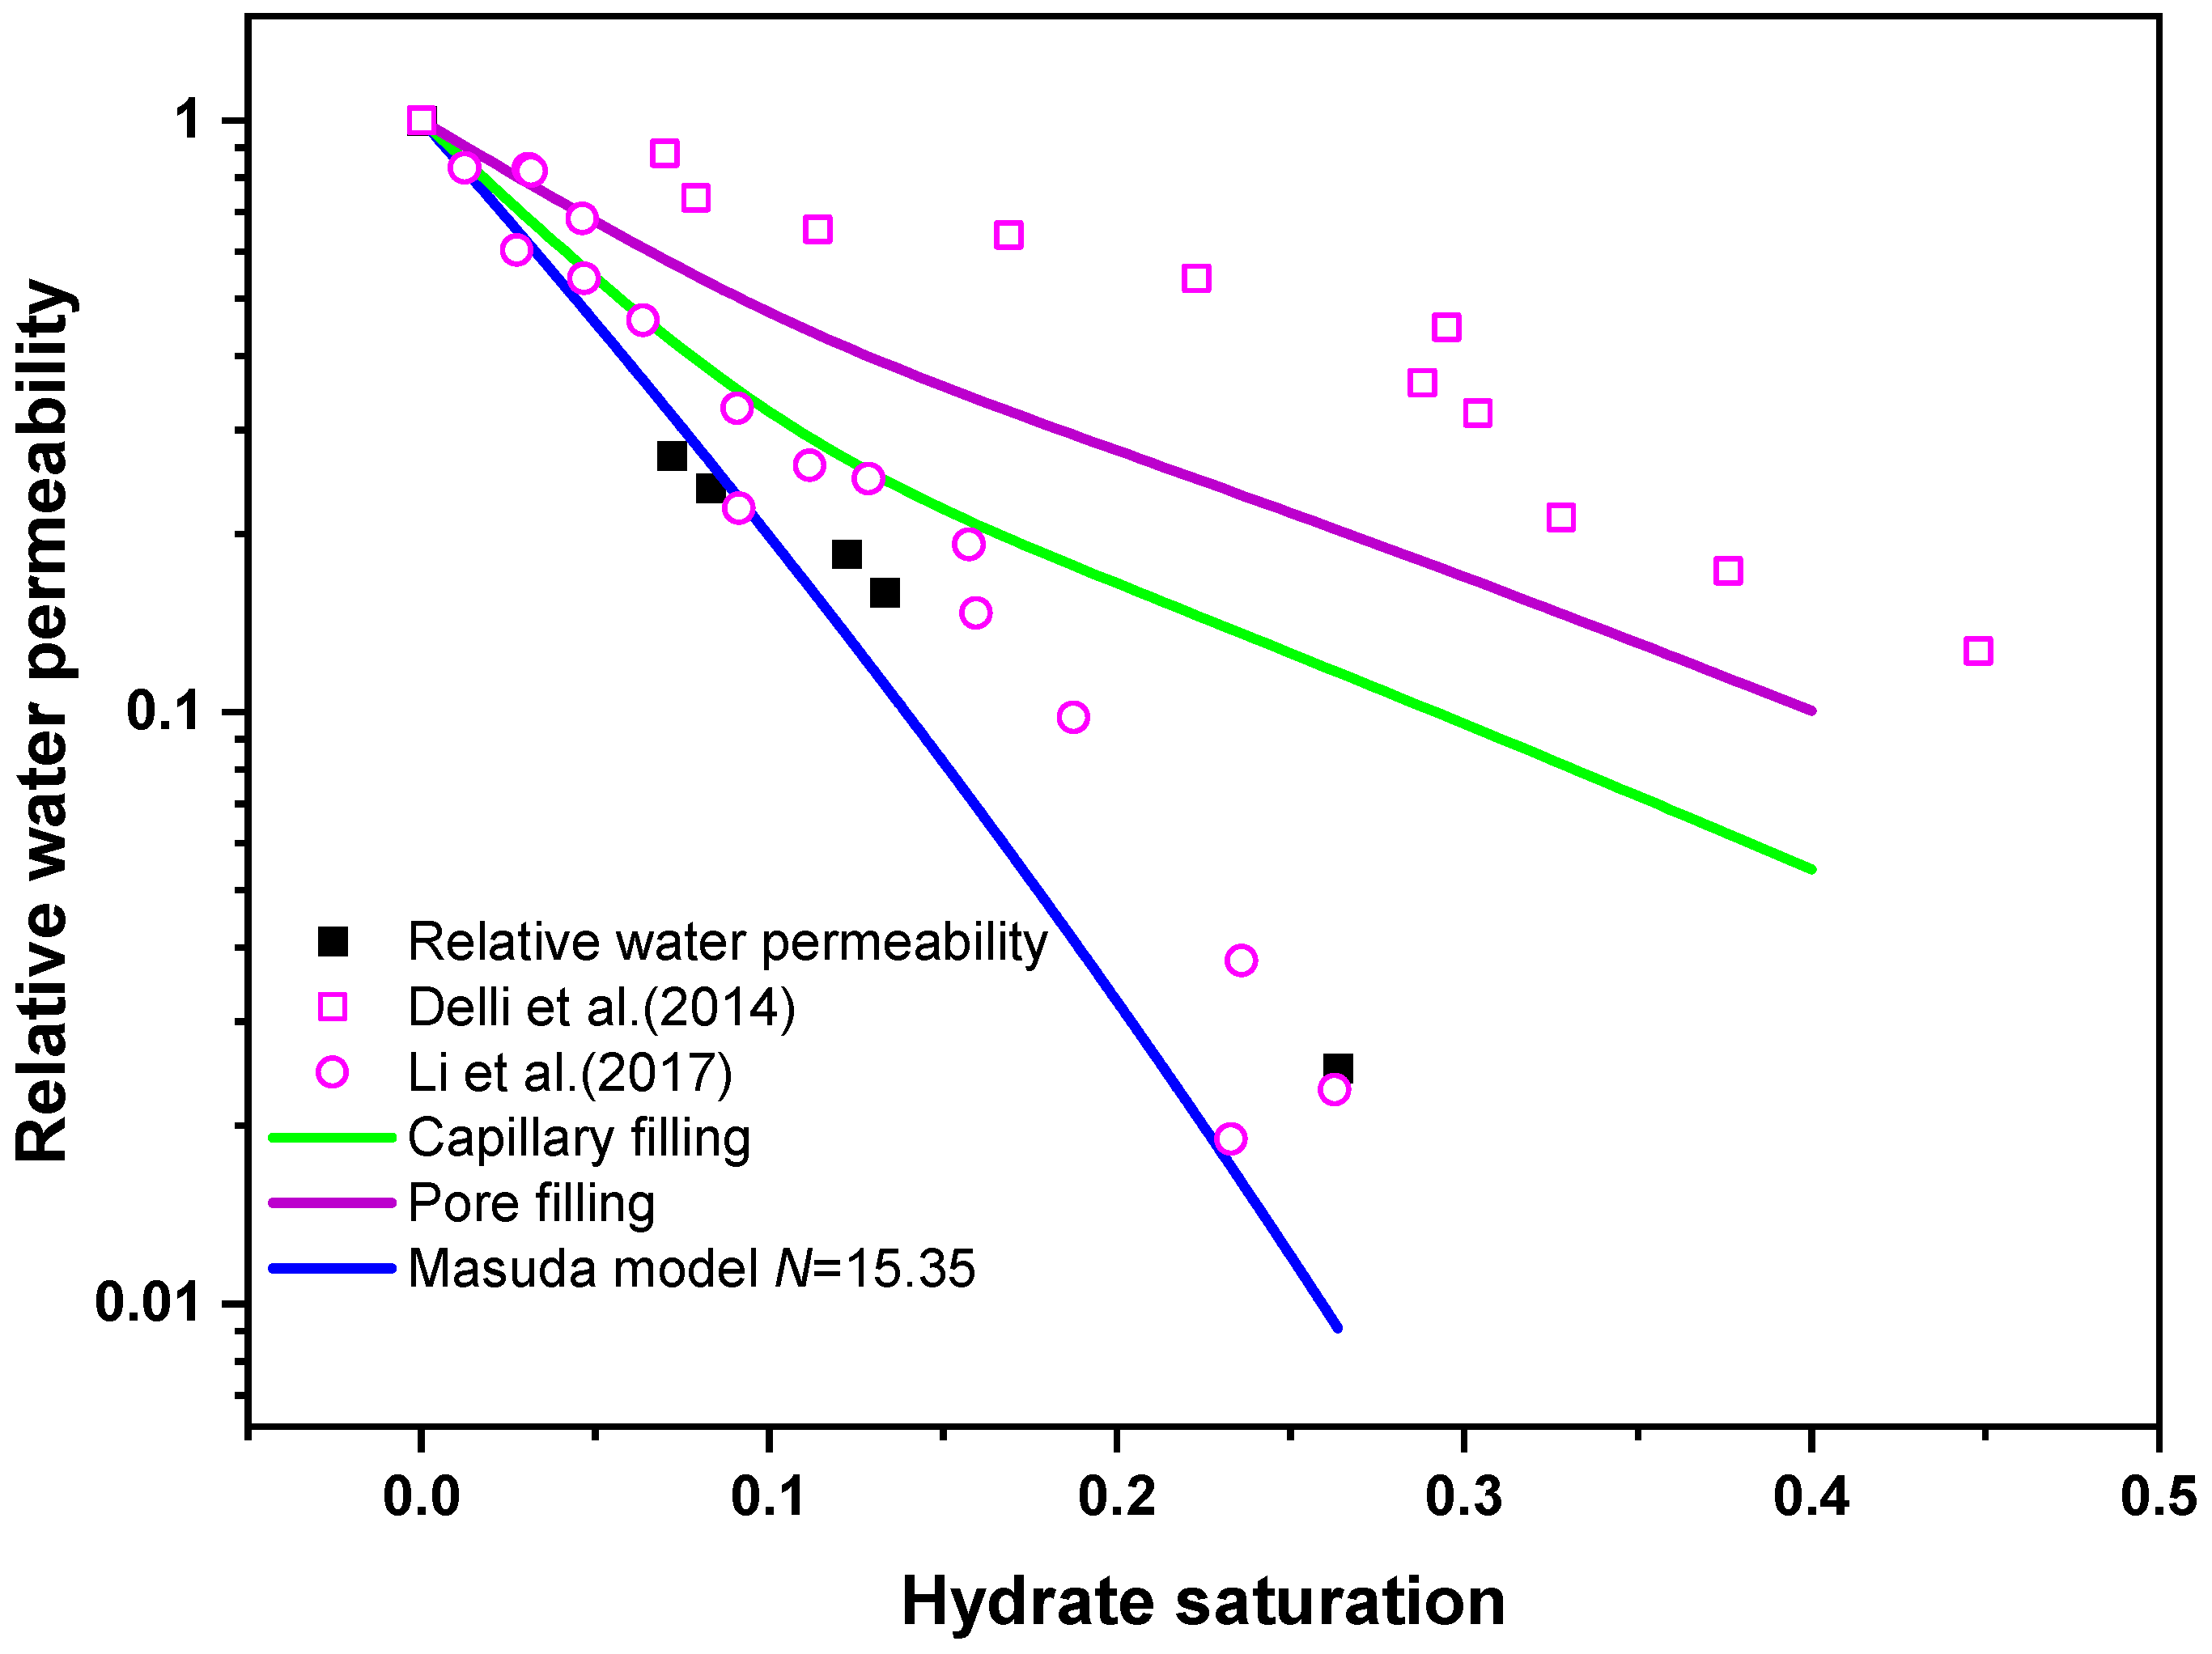
3.3. Comparison of Experimental Data and Prediction Model

Figure 6 shows the comparison between the measured relative permeability data of this experiment and the reported relative permeability of the sediments containing carbon dioxide hydrate and methane hydrate [26,27]. In both studies, water was used as the mobile phase in the process of permeability measurement. The permeability of carbon dioxide hydrate sediment samples is higher than the data measured under the same saturation in the current investigation [26], whereas the data on the permeability of the methane hydrate sediment are close to the hydrate permeability data in the current study [27]. The particle sizes of the sediments selected in the three experiments are obviously different, with average particle sizes of 129.75 μm (this work), 325.38 μm [27] and 720 μm [26]. The flow interface of pore channels in small particles is relatively small, so the occurrence of hydrate leads to a significant decrease in permeability. However, because of the relatively uniform particle size distribution, the distribution of hydrate in the pores may also be relatively uniform. When particles are smaller than a certain size, the impact of pore size becomes weak. In addition, this difference in permeability may be due to the different methods of synthesizing the hydrate-bearing sediments. Delli et al. used excessive free gas to synthesize hydrate samples [26], whereas Li et al. used excessive water to synthesize hydrate samples [27]. In the current experiment, the gas in the hydrate growth process is in an excessive state, but after hydrate growth is complete, water is injected to recrystallize the hydrate. The plugging characteristics of the hydrate samples synthesized by this method are similar to those obtained via the excessive water method. The hydrate properties in the actual environment are close to those of the hydrate samples synthesized by excessive water.
There are two main types of models describing the influence of hydrate morphology on permeability, the first is the capillary model (capillary-coating and capillary-filling model), and the other is the grain pack model (grain-coating and pore-filling model). By comparing the permeability data with the models, the occurrence form of hydrate in the pores can be determined. In this study, the relative permeability experimental data were compared with the capillary-filling model and the pore-filling model. It was found that the experimental data were smaller than the model prediction data and were relatively close to the pore-filling data. This shows that the hydrate synthesized in this experiment tends to occupy the pore center of sediments.
To describe the influence of hydrate saturation on permeability, Masuda et al. proposed a simple model [39]:
k r = 1 S H N
where SH is hydrate saturation and N is the hydrate saturation index. Because the expression of the Masuda model is simple and easy to write into a simulation program related to hydrate exploitation, this study used the Masuda model to fit the hydrate saturation and relative permeability data, and the fitting relationship is
k r = 1 S H 15.35
In the formula, N generally varies from 1 to 15. When considering the growth of hydrate at the pore throat, the value of N should be appropriately increased. The fitting result (N = 15.35) shows that the synthetic hydrate in this experiment tends to occupy the pore center of the hydrate, even blocking the pore throat, resulting in an exponential decrease in sediment permeability. It should be noted that only hydrate saturation is considered in the Masuda model, and N may be influenced by microscopic properties, such as pore structure, hydrate distribution and morphology. In this study, a blind kettle was used to prepare hydrates, and the morphological changes of hydrates could not be observed, which limits the understanding of the influence of CO2-N2 hydrate on sediment permeability. For the obtained saturation index N, a more accurate microscopic explanation cannot be temporarily given.
In order to accurately grasp the influence of hydrate on sediment permeability, visualization methods (such as CT) could be used to assist permeability measurement. These nondestructive methods can reveal the in situ hydrate morphologies and pore structures in the sediment based on the computed tomography. However, the obtained image cannot directly investigate the hydrate bearing sediments. The nondestructive visualization methods are always combined with the pore network model to simulate and calculate the flow properties of hydrate-bearing sediments. A pore network model can reproduce the topology of pores and throats obtained from CT imaging data via specific code. It can be used to predict the phase saturation (gas, water and hydrate), capillary pressures and permeability data of hydrate-bearing sediments. As reviewed by Gong et al. [40], the pore network model with the CT technique has successfully investigated the effects of pore structure and gas flow character on the permeability in the presence of solid hydrate with different morphologies.

4. Conclusions

CO2-N2 mixture injection was used for the exploitation and reformation of natural gas hydrate reservoirs. The permeability evolution of sediments in the presence of CO2-N2 hydrate after gas injection is very important. In this work, hydrate-bearing sediments were formed from a CO2-N2 mixture and the effects of CO2/N2 ratio and hydrate saturation on permeability were investigated. Several major conclusions can be drawn.
(1)
Gas composition is the key factor affecting hydrate formation and transformation. Hydrate saturation gradually increases with increasing CO2 mole fraction in the gas mixture. However, due to the decrease in driven force during hydrate formation, the obtained hydrate saturation data with different gas composition were limited in a narrow range.
(2)
The presence of hydrate formed from a CO2-N2 mixture leads to a sharp reduction in sediment permeability, which shows a significant negative correlation with the CO2 mole fraction in the initial gas. With regard to NGH reservoir exploitation and reformation, high CO2 content in the CO2-N2 injection is suitable for reformation of the hydrate reservoir, and high N2 content is conductive to exploitation of hydrate by CO2 replacement.
(3)
The pore-filling model underestimates the permeability of hydrate-bearing sediments formed from CO2-N2 gas. The fitted hydrate saturation index in the Masuda model is 15.35, slightly higher than the general values, which means that the formed hydrate tends to occupy the pore center, and even block the pore throat. Visual technologies are suggested to obtain the accurate morphologies of hydrate in sediments. The fitted model can be employed in numerical simulations related to hydrate exploitation by CO2-N2 injection. These results can be used as the basis for evaluation and adjustment of gas injection process in future works.

Author Contributions

Conceptualization, N.L. and J.K.; methodology, Z.F., H.M. and S.J.; validation, S.L. and Z.F.; formal analysis, N.L.; investigation, Z.F., H.M. and S.J.; resources, C.S.; data curation, N.L.; writing—original draft preparation, N.L. and Z.F.; writing—review and editing, J.K. and S.L.; visualization, S.J.; supervision, C.S.; project administration, N.L. and J.K. All authors have read and agreed to the published version of the manuscript.

Funding

This work was sponsored by Natural Science Foundation of Xinjiang Uygur Autonomous Region (2022D01B143), National Natural Science Foundation of China (Nos. 22008258, 52204061).

Institutional Review Board Statement

Not applicable.

Informed Consent Statement

Not applicable.

Data Availability Statement

The data that support the findings of this paper are available upon request.

Conflicts of Interest

The authors declare no conflict of interest.

References

  1. Sloan, E.D. Fundamental principles and applications of natural gas hydrates. Nature 2003, 426, 353–363. [Google Scholar] [CrossRef] [PubMed]
  2. Boswell, R.; Collet, T.S. Current perspectives on gas hydrate resources. Energy Environ. Sci. 2011, 4, 1206–1215. [Google Scholar] [CrossRef]
  3. Zhang, X.W.; Hu, T.; Pang, X.Q.; Hu, Y.; Wang, T.; Wang, E.Z.; Xu, Z.; Liu, X.H.; Wu, Z.Y. Evaluation of natural gas hydrate resources in the South China Sea by combining volumetric and trend-analysis methods. Petrol. Sci. 2022, 19, 37–47. [Google Scholar] [CrossRef]
  4. Yoneda, J.; Masui, A.; Konno, Y.; Jin, Y.; Egawa, K.; Kida, M.; Ito, T.; Nagao, J.; Tenma, N. Mechanical properties of hydrate bearing turbidite reservoir in the first gas production test site of the Eastern Nankai Trough. Mar. Pet. Geol. 2015, 66, 471–486. [Google Scholar] [CrossRef]
  5. Xu, Z.; Hu, T.; Pang, X.Q.; Wang, E.Z.; Liu, X.H.; Wu, Z.Y.; Chen, D.; Li, C.R.; Zhang, X.W.; Wang, T. Research progress and challenges of natural gas hydrate resource evaluation in the South China Sea. Petrol. Sci. 2022, 19, 13–25. [Google Scholar] [CrossRef]
  6. Feng, J.C.; Wang, Y.; Li, X.S. Hydrate dissociation induced by depressurization in conjunction with warm brine stimulation in cubic hydrate simulator with silica sand. Appl. Energy 2016, 174, 181–191. [Google Scholar] [CrossRef]
  7. Song, Y.; Cheng, C.; Zhao, J.; Zhu, Z.; Liu, W.; Yang, M.; Xue, K. Evaluation of gas production from methane hydrates using depressurization, thermal stimulation and combined methods. Appl. Energy 2015, 145, 265–277. [Google Scholar] [CrossRef]
  8. Ohgaki, K.; Takano, K.; Sangawa, H.; Matsubara, T.; Nakano, S. Methane exploitation by carbon dioxide from gas hydrates—Phase equilibria for CO2-CH4 mixed hydrate system. J. Chem. Eng. Jpn. 1996, 29, 478–483. [Google Scholar] [CrossRef]
  9. Park, Y.; Kim, D.Y.; Lee, J.W.; Huh, D.G.; Park, K.P.; Lee, J.; Lee, H. Sequestering carbon dioxide into complex structures of naturally occurring gas hydrates. P. Natl. Acad. Sci. USA 2006, 103, 12690–12694. [Google Scholar] [CrossRef]
  10. Koh, D.Y.; Kang, H.; Lee, J.W.; Park, Y.; Kim, S.J.; Lee, J.; Lee, J.Y.; Lee, H. Energy-efficient natural gas hydrate production using gas exchange. Appl. Energy 2016, 162, 114–130. [Google Scholar] [CrossRef]
  11. Kang, H.; Koh, D.Y.; Lee, H. Nondestructive natural gas hydrate recovery driven by air and carbon dioxide. Sci. Rep. 2014, 4, 6616. [Google Scholar] [CrossRef]
  12. Li, B.; Xu, T.; Zhang, G.; Guo, W.; Liu, H.; Wang, Q.; Qu, L.; Sun, Y. An experimental study on gas production from fracture-filled hydrate by CO2 and CO2/N2 replacement. Energy Convers. Manag. 2018, 165, 738–747. [Google Scholar] [CrossRef]
  13. Kan, J.; Sun, Y.; Dong, B.; Yuan, Q.; Liu, B.; Sun, C.; Chen, G. Numerical simulation of gas production from permafrost hydrate deposits enhanced with CO2/N2 injection. Energy 2021, 221, 119919. [Google Scholar] [CrossRef]
  14. Sun, J.; Ning, F.; Li, S.; Zhang, K.; Liu, T.; Zhang, L.; Jiang, G.; Wu, N. Numerical simulation of gas production from hydrate-bearing sediments in the Shenhu area by depressurising: The effect of burden permeability. J. Unconv. Oil Gas Resour. 2015, 12, 23–33. [Google Scholar] [CrossRef]
  15. Xie, Y.; Feng, J.; Sun, L.; Wang, J.; Hu, W.; Peng, B.; Wang, Y.; Wang, Y. Coupled simulation of hydrate-bearing and overburden sedimentary layers to study hydrate dissociation and methane Leakage. J. Mar. Sci. Eng. 2022, 10, 668. [Google Scholar] [CrossRef]
  16. Li, N.; Sun, Z.; Jia, S.; Sun, C.; Liu, B.; Yang, L.; Chen, G. A novel method to greatly increase methane hydrate exploitation efficiency via forming impermeable overlying CO2 cap. Energy Procedia 2019, 158, 5975–5981. [Google Scholar] [CrossRef]
  17. Sun, Z.F.; Li, N.; Jia, S.; Cui, J.; Yuan, Q.; Sun, C.; Chen, G. A novel method to enhance methane hydrate exploitation efficiency via forming impermeable overlying CO2 hydrate cap. Appl. Energy 2019, 240, 842–850. [Google Scholar] [CrossRef]
  18. Cui, J.L.; Sun, Z.F.; Kan, J.Y.; Jia, S.; Sun, C.; Chen, G.; Wang, X.H.; Yuan, Q.; Li, N. Study on the factors affecting the sealing performance and mechanical stability of CO2 hydrate cap during gas production from methane hydrate. J. Nat. Gas Sci. Eng. 2021, 93, 104050. [Google Scholar] [CrossRef]
  19. Li, N.; Jia, S.; Sun, Z.; Sun, C.; Chen, G.; Li, J. Exploitation of CH4 hydrate reservoir reformed by (CO2 + N2) gas injection. Chem. Ind. Eng. Prog. 2022, 41, 2356–2363. [Google Scholar]
  20. Konno, Y.; Yoneda, J.; Egawa, K.; Ito, T.; Jin, Y.; Kida, M.; Suzuki, K.; Fujii, T.; Nagao, J. Permeability of sediment cores from methane hydrate deposit in the Eastern Nankai Trough. Mar. Petrol. Geol. 2015, 66, 487–495. [Google Scholar] [CrossRef]
  21. Bei, K.; Xu, T.; Shang, S.; Wei, Z.; Yuan, Y.; Tian, H. Numerical modeling of gas migration and hydrate formation in heterogeneous marine sediments. J. Mar. Sci. Eng. 2019, 7, 348. [Google Scholar] [CrossRef] [Green Version]
  22. Kleinberg, R.L. Deep sea NMR: Methane hydrate growth habit in porous media and its relationship to hydraulic permeability, deposit accumulation, and submarine slope stability. J. Geophys. Res. 2003, 108, B10. [Google Scholar] [CrossRef]
  23. Zhao, J.; Liu, C.; Li, C.; Zhang, Y.; Bu, Q.; Wu, N.; Liu, Y.; Chen, Q. Pore-Scale Investigation of the Electrical Property and Saturation Exponent of Archie’s Law in Hydrate-Bearing Sediments. J. Mar. Sci. Eng. 2022, 10, 111. [Google Scholar] [CrossRef]
  24. Bu, Q.; Xing, T.; Li, C.; Zhao, J.; Liu, C.; Wang, Z.; Zhao, W.; Kang, J.; Meng, Q.; Hu, G. Effect of hydrate microscopic distribution on acoustic characteristics during hydrate dissociation: An insight from combined acoustic-CT detection study. J. Mar. Sci. Eng. 2022, 10, 1089. [Google Scholar] [CrossRef]
  25. Kumar, A.; Maini, B.; Bishnoi, P.R.; Clarke, M.; Zatsepina, O.; Srinivasan, S. Experimental determination of permeability in the presence of hydrates and its effect on the dissociation characteristics of gas hydrates in porous media. J. Petrol. Sci. Eng. 2010, 70, 114–122. [Google Scholar] [CrossRef]
  26. Delli, M.L.; Grozic, J.L.H. Experimental determination of permeability of porous media in the presence of gas hydrates. J. Petrol. Sci. Eng. 2014, 120, 1–9. [Google Scholar] [CrossRef]
  27. Li, G.; Wu, D.; Li, X.S.; Lv, Q.N.; Li, C.; Zhang, Y. Experimental measurement and mathematical model of permeability with methane hydrate in quartz sands. Appl. Energy 2017, 202, 282–292. [Google Scholar] [CrossRef]
  28. Li, C.; Li, C.; Zhao, Q.; Xu, H.; Feng, K.; Liu, X. Relation between relative permeability and hydrate saturation in Shenhu area, South China Sea. Appl. Geophys. 2014, 11, 207–214. [Google Scholar] [CrossRef]
  29. Dai, S.; Seol, Y. Water permeability in hydrate-bearing sediments: A pore-scale study. Geophy. Res. Lett. 2014, 41, 4176–4184. [Google Scholar] [CrossRef]
  30. Wang, J.; Zhao, J.; Zhang, Y.; Wang, D.; Li, Y.; Song, Y. Analysis of the influence of wettability on permeability in hydrate-bearing porous media using pore network models combined with computed tomography. J. Nat. Gas Sci. Eng. 2015, 26, 1372–1379. [Google Scholar] [CrossRef]
  31. Wang, J.; Zhao, J.; Zhang, Y.; Wang, D.; Li, Y.; Song, Y. Analysis of the effect of particle size on permeability in hydrate-bearing porous media using pore network models combined with CT. Fuel 2016, 163, 34–40. [Google Scholar] [CrossRef]
  32. Wang, J.; Zhao, J.; Yang, M.; Li, Y.; Liu, W.; Song, Y. Permeability of laboratory-formed porous media containing methane hydrate: Observations using X-ray computed tomography and simulations with pore network models. Fuel 2015, 145, 170–179. [Google Scholar] [CrossRef]
  33. Hassanpouryouzband, A.; Yang, J.; Tohidi, B.; Chuvilin, E.; Istomin, V.; Bukhanov, B.; Cheremisin, A. CO2 capture by injection of flue Gas or CO2−u2 mixtures into hydrate reservoirs: Dependence of CO2 capture efficiency on gas hydrate reservoir conditions. Environ. Sci. Technol. 2018, 52, 4324–4330. [Google Scholar] [CrossRef]
  34. Pandey, J.S.; Khan, S.; Karcz, A.P.; Solms, N. Chemically modifed hydrate swapping and hydrate stability during multistage CO2-N2 injection schemes. Fuel 2021, 299, 120711. [Google Scholar] [CrossRef]
  35. Niu, M.; Wu, G.; Yin, Z.; Sun, Y.; Liu, K.; Chen, D. Effectiveness of CO2-N2 injection for synergistic CH4 recovery and CO2 sequestration at marine gas hydrates condition. Chem. Eng. J. 2021, 420, 129615. [Google Scholar] [CrossRef]
  36. Niu, M.; Yin, Z.; Sun, Y.; Fang, W.; Chen, G.; Chen, D. CH4 hydrate production coupled with CO2 sequestration and hydrate restoration employing depressurization assisted by CO2-N2 injection at marine conditions. Chem. Eng. J. 2023, 456, 140981. [Google Scholar] [CrossRef]
  37. Chen, G.J.; Guo, T.M. A new approach to gas hydrate modelling. Chem. Eng. J. 1998, 71, 145–151. [Google Scholar]
  38. Starling, K.E.; Han, M.S. Thermo data refined for LPG-14. mixtures. Hydrocarb. Process. 1972, 51, 129–132. [Google Scholar]
  39. Masuda, Y.; Naganawa, S.; Ando, S.; Sato, K. Numerical calculation of gas production performance from reservoirs containing natural gas hydrates. SPE J. 1997, 29, 201–210. [Google Scholar]
  40. Gong, G.J.; Zhao, G.J.; Pang, W.X.; Yang, M.J.; Chen, B.B.; Zheng, J.N. Review of hydrate-bearing sediment permeability for natural gas hydrate exploitation: Measurement and application development. J. Petrol. Sci. Eng. 2023, 220, 111217. [Google Scholar] [CrossRef]
Figure 1. Schematic of experimental apparatus.
Jmse 11 00376 g001
Figure 2. The data of the hydrate phase equilibrium.
Jmse 11 00376 g002
Figure 3. Hydrate saturation under different experimental conditions.
Jmse 11 00376 g003
Figure 4. Temperature and differential pressure during permeability measurement: (a) temperature change during water injection, (b) differential pressure change during the stable water-injection stage.
Jmse 11 00376 g004
Figure 5. Permeability of hydrate-bearing sediments formed from CO2 + N2 gas.
Jmse 11 00376 g005
Figure 6. Comparison of experimental data with theoretical permeability models [26,27].
Jmse 11 00376 g006
Table 1. Experimental conditions and results.
RunInitial Water Saturation (SW)CO2 Mole FractionInitial Pressure (MPa)Hydrate SaturationAverage Permeability (Darcy)Relative Water
Permeability
1///010.151.000
20.30.410.80.0722.820.278
30.20.58.60.0832.420.238
40.30.58.60.1221.890.186
50.40.58.60.1331.620.160
60.30.85.40.2640.2430.024
Disclaimer/Publisher’s Note: The statements, opinions and data contained in all publications are solely those of the individual author(s) and contributor(s) and not of MDPI and/or the editor(s). MDPI and/or the editor(s) disclaim responsibility for any injury to people or property resulting from any ideas, methods, instructions or products referred to in the content.

