Article

Assessing the Fishing Impact on the Marine Ecosystem of Guishan Island in the Northeastern Waters of Taiwan Using Ecopath and Ecosim

1
Fisheries Research Institute, Ministry of Agriculture, 199, Heyi Road, Keelung 202008, Taiwan
2
Institute of Marine Affairs and Resource Management, National Taiwan Ocean University, Keelung 202301, Taiwan
3
George Chen Shark Research Center, National Taiwan Ocean University, Keelung 202301, Taiwan
4
Center of Excellence for the Oceans, National Taiwan Ocean University, Keelung 202301, Taiwan
*
Author to whom correspondence should be addressed.
J. Mar. Sci. Eng. 2023, 11(12), 2368; https://doi.org/10.3390/jmse11122368
Submission received: 4 November 2023 / Revised: 3 December 2023 / Accepted: 12 December 2023 / Published: 15 December 2023
(This article belongs to the Topic Conservation and Management of Marine Ecosystems)

Abstract

:
The northeastern waters of Guishan Island constitute one of the crucial fishing grounds for coastal trawl fishery in Taiwan and have been exploited for many decades. To construct the marine ecosystem and to examine the interactions among trophic levels of fisheries resources in the waters of Guishan Island, historical catch, catch composition, biological information, fishing effort, environmental data such as sea surface temperature, salinity, and nutrients were analyzed using Ecopath with Ecosim. The results indicated that the longline and drift net fisheries have a very minor incidental catch of cetaceans, with a fishing mortality (F) of 0.01 year−1 and an exploitation rate (E) of 0.03. The F and E were 0.308 year−1 and 0.617 for small skates and rays, and were 0.261 year−1 and 0.580, respectively, for small sharks. The F and E of the dolphinfish, Coryphaena hippurus, an important pelagic species, were 0.411 year−1 and 0.245, respectively. Fisheries had negative impact on major commercial species except the dolphinfish and the oil fish, Lepidocybium spp., which benefited from the reduction of their predators or competitors. The keystone species of the Guishan Island marine ecosystem is phytoplankton, which has the lowest trophic level and great biomass, and is an important energy source of the ecosystem. The influences of zooplankton and anchovy rank as second and third, respectively, with regard to the keystone species in the ecosystem due to their great biomass. Regarding the biomass of less abundant species, carangids had the highest influence followed by hairtail due to their feeding habits. The results of simulations using Ecosim indicated that the hairtail, small sharks, skates and rays, mackerels, and marine eels will benefit if fishing efforts are reduced by 30%. On the other hand, the biomass of phytoplankton, zooplankton, demersal benthivores, and shrimps will decrease due to the increase in the biomass of their predators.

1. Introduction

Taiwan is located in the shared boundary of the East and the South China Sea; the complicated habitats and current systems contribute to the high biodiversity of its surrounding waters. The Guishan Island is located in the northeastern waters of Taiwan which the Kuroshio Current passes, and the surrounding upwelling brings rich nutrients. The high biodiversity of fishery resources, including shrimps, crabs, cattle fishes, squids, sea breams, and tile fishes, is due to the high primary production and rich nutrients in this area. Thus, this area is one of the most important fishing grounds for coastal trawl fishery in Taiwan. Additionally, this area is one of the best dolphin-watching areas due to the high occurrence of cetaceans. The trawl fishery is based in the Tahsi fishing port, while dolphin-watching vessels is based in Wushi port (Figure 1).
According to the Taiwan Fisheries Year Book [1], the major fisheries in this area include the bottom trawl, torch light, gill net, hand line, mid-water trawl, and longline. High biodiversity is found in this region, and the major economic species include the black pomfret, Parastromateus niger, skipjack, Katsuwonus pelamis, yellowfin tuna, Thunnus albacares, sergestid shrimp, Sergia lucens, crimson seabream, Dentex tumifrons, black seabream, Spondyliosoma cantharus, bigeye, Priacanthus macracanths, hairtail, Trichiurus lepturus, pomfrets, narrowbarred mackerel, Scomberomorus commerson, cuttle fishes, squids, etc. However, due to the increase in fishing pressure in recent decades, the coupling of the catch of economic species decreased, with smaller sized fish at catch provoking coastal fishery management by the local government [2]. The Fisheries Agency, Taiwan, has implemented management measures which included prohibiting trawl and gillnet fishing within 3 miles from the coast and seasonal closure for trawl fishery that reduced the fishing effort. The yield of these areas decreased from 42,990 tons in 2000 to 28,476 tons in 2008.
Conventional single species’ stock assessments, such as production models [3,4] and yield per recruit models [5], did not take account of the interactions among species. Hence, several multispecies’ stock assessment methods taking account of the interactions among marine species based on single species models have been developed since late 1970s [6], i.e., multispecies production models (MSP, [7]), multispecies virtual population analysis [8], and multispecies bioenergetics models (MSBE, [9,10,11]). In addition, ecosystem-based assessment packages which can simulate the interactions among species in an ecosystem such as Ecopath with Ecosim [12] and NETWRK [13] have also been developed. Many more input parameters required for these packages resulted in higher uncertainty of the output [14].
Ecopath with Ecosim (EwE) is a package which is used to simulate the marine ecosystem mechanism and population dynamics based on the concept of predator–prey interactions [12,15]. Regarding the energy equilibrium condition, Ecosim can be used to simulate the variation of biological parameters at different fishing pressures. In addition, Ecospace can be further used to conduct the simulations of spatial dynamics, which is useful for marine protected area planning. Ecopath with Ecosim has been used by several authors for ecosystem-based assessments and fishery management [14]. For example, it has been used for simulations on the impact of removing large sharks in marine ecosystems [16], and simulating the impact of reducing the fishing effort of large sharks on other species in the pelagic ecosystem of the North Pacific [17]. Resource management based on an ecosystem approach has been used in the Northeastern Atlantic [18]. However, despite the work by Lin et al. [19,20] and Liu et al. [21] on small-scale coral reefs or estuaries in the coastal waters of Taiwan, this approach has never been used to assess the fishery impact on a large-scale marine ecosystem in Taiwan waters. Thus, how the Taiwanese fishery affects the marine ecosystem and its structure is still unknown.
In the waters of Guishan Island, a single species’ stock assessment approach (virtual population analysis) has been applied on the bigeye, Priacanthus macrocanthus [2]. However, due to the complex and multispecies’ targeting nature of the coastal and offshore fisheries in this area, conventional single-species’ stock assessment and management may not be appropriate for describing the impact of these fisheries [22]. Thus, this study aims to assess the fishery impact on the marine ecosystem by using the Ecopath and Ecosim approach by constructing the marine ecosystem and examining the interactions among trophic levels of the resources of fisheries in the waters of Guishan Island. It is hoped that the results derived from this study can provide useful information for better managing the fishery resources in this region.

2. Materials and Methods
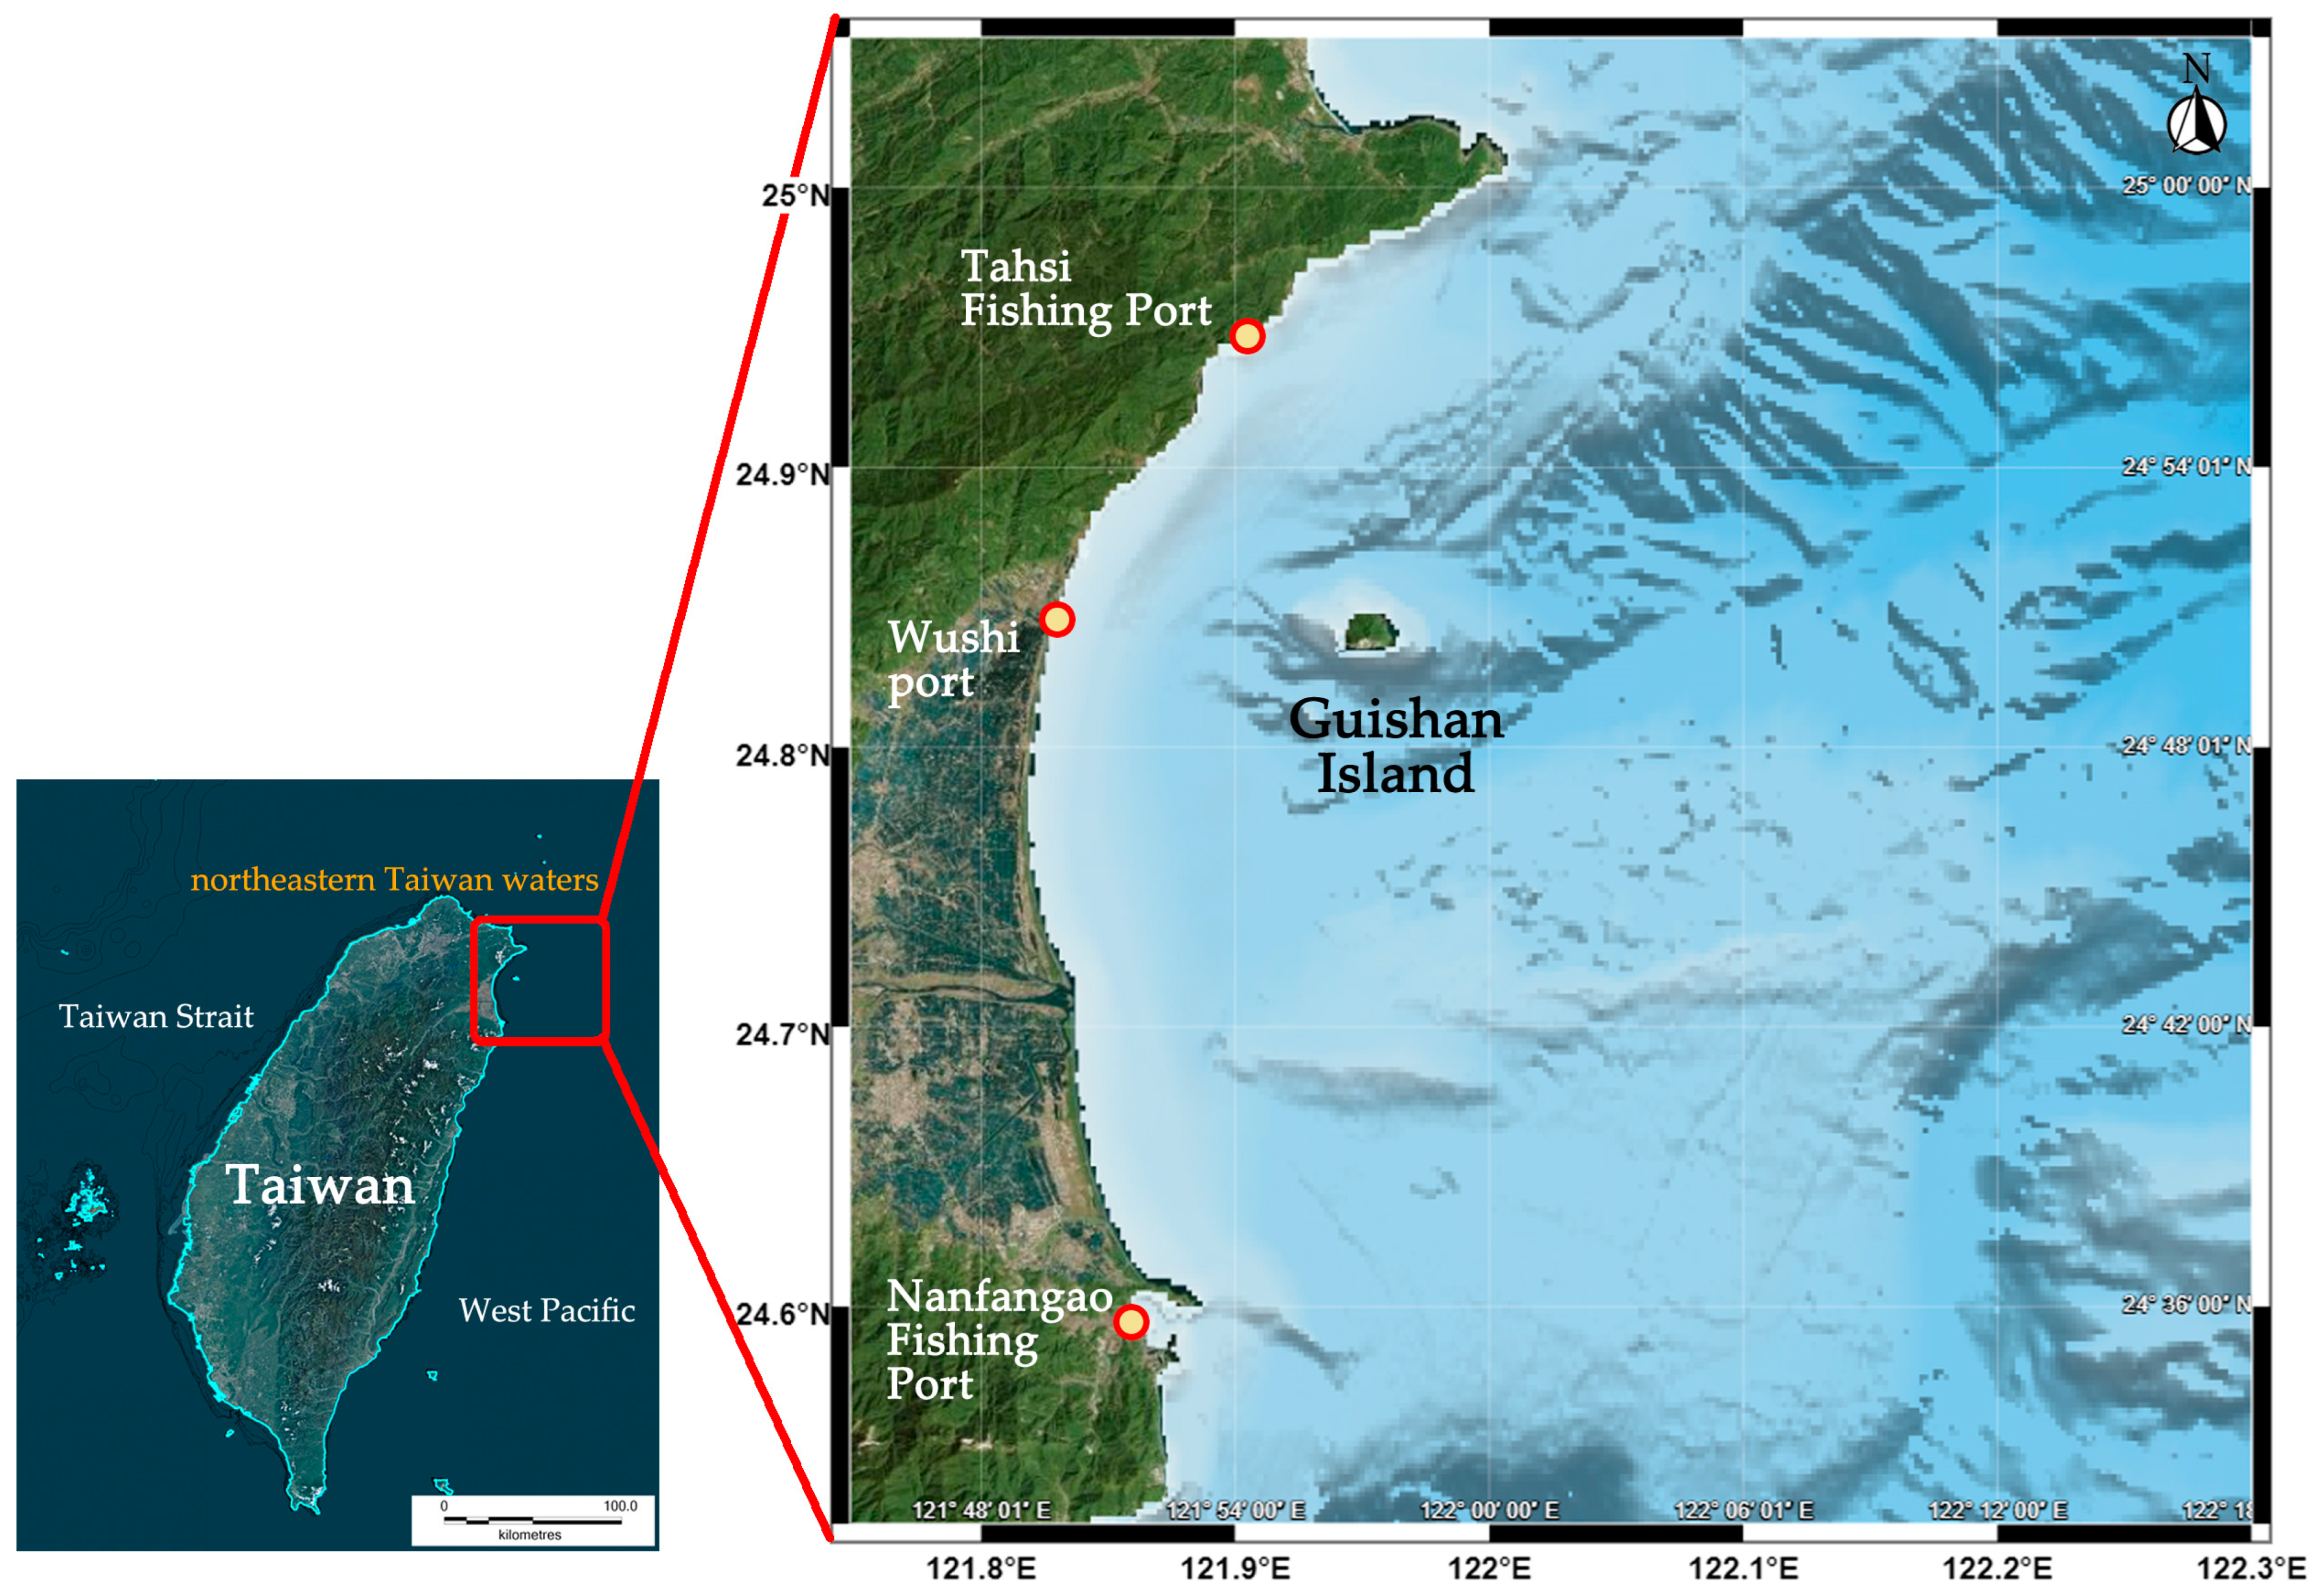
2.1. Data Source

Fishery data and biological information were obtained from the sampling vessels operating in the waters of Guishan Island (Figure 1). Catch of commercial species and trash fish were collected from sales records at Tahsi fish market, northeastern Taiwan. The species identification, species composition, condition factor, stomach content, maturation condition, and feeding cycle followed the methods mentioned by Wang et al. [23].

2.2. Ecopath Model Structure

Ecopath with Ecosim 6.20 (EwE 6.20) [24] was used to analyze the biological and biomass data of marine organisms in Guishan Island waters. EwE is a modelling package that is used to estimate the energy transfer in a freshwater or marine ecosystem and can simulate the fishery impact on marine ecosystems. The model is based on the mass-balanced principle assumption, where the production of an animal species/group (Pi) and its immigration (Ii) in year i equals predatory loss (M2i), non-predatory mortality (M0i), harvest (Yi), and the sum of emigration (Ei) [25].
Production + immigration = predatory losses + non-predatory mortality + harvest + emigration
P i B i × B i + I i = M 2 i + M 0 i × B i + Y i + E i
where Bi is the biomass of species i in the study area, Pi/Bi is the production per unit biomass of species i, Ecopath assumes a mass balanced ecosystem, and Pi/Bi equals the total mortality of species i.
M 0 i = P i × 1 E E i B i , where M0i is other natural mortality of species i and EEi is utility rate of species i, which can be expressed as follows:
E E i = Y i + E i + B A i + B i × M 2 i P i , where EEi is the proportion utilized by other species in the ecosystem or fisheries for specie i.
M 2 i = j = 1 n Q i × D C j , i B j , where M2i is the mortality from predation for species i.
Q j B j is the predation rate of predator j.
Ii and Ei are the immigration and emigration rate of species i; the net immigration rate is the difference of these two values. Ii and Ei are assumed to be the same for all scenarios in simulations; thus, the net immigration rate was 0.

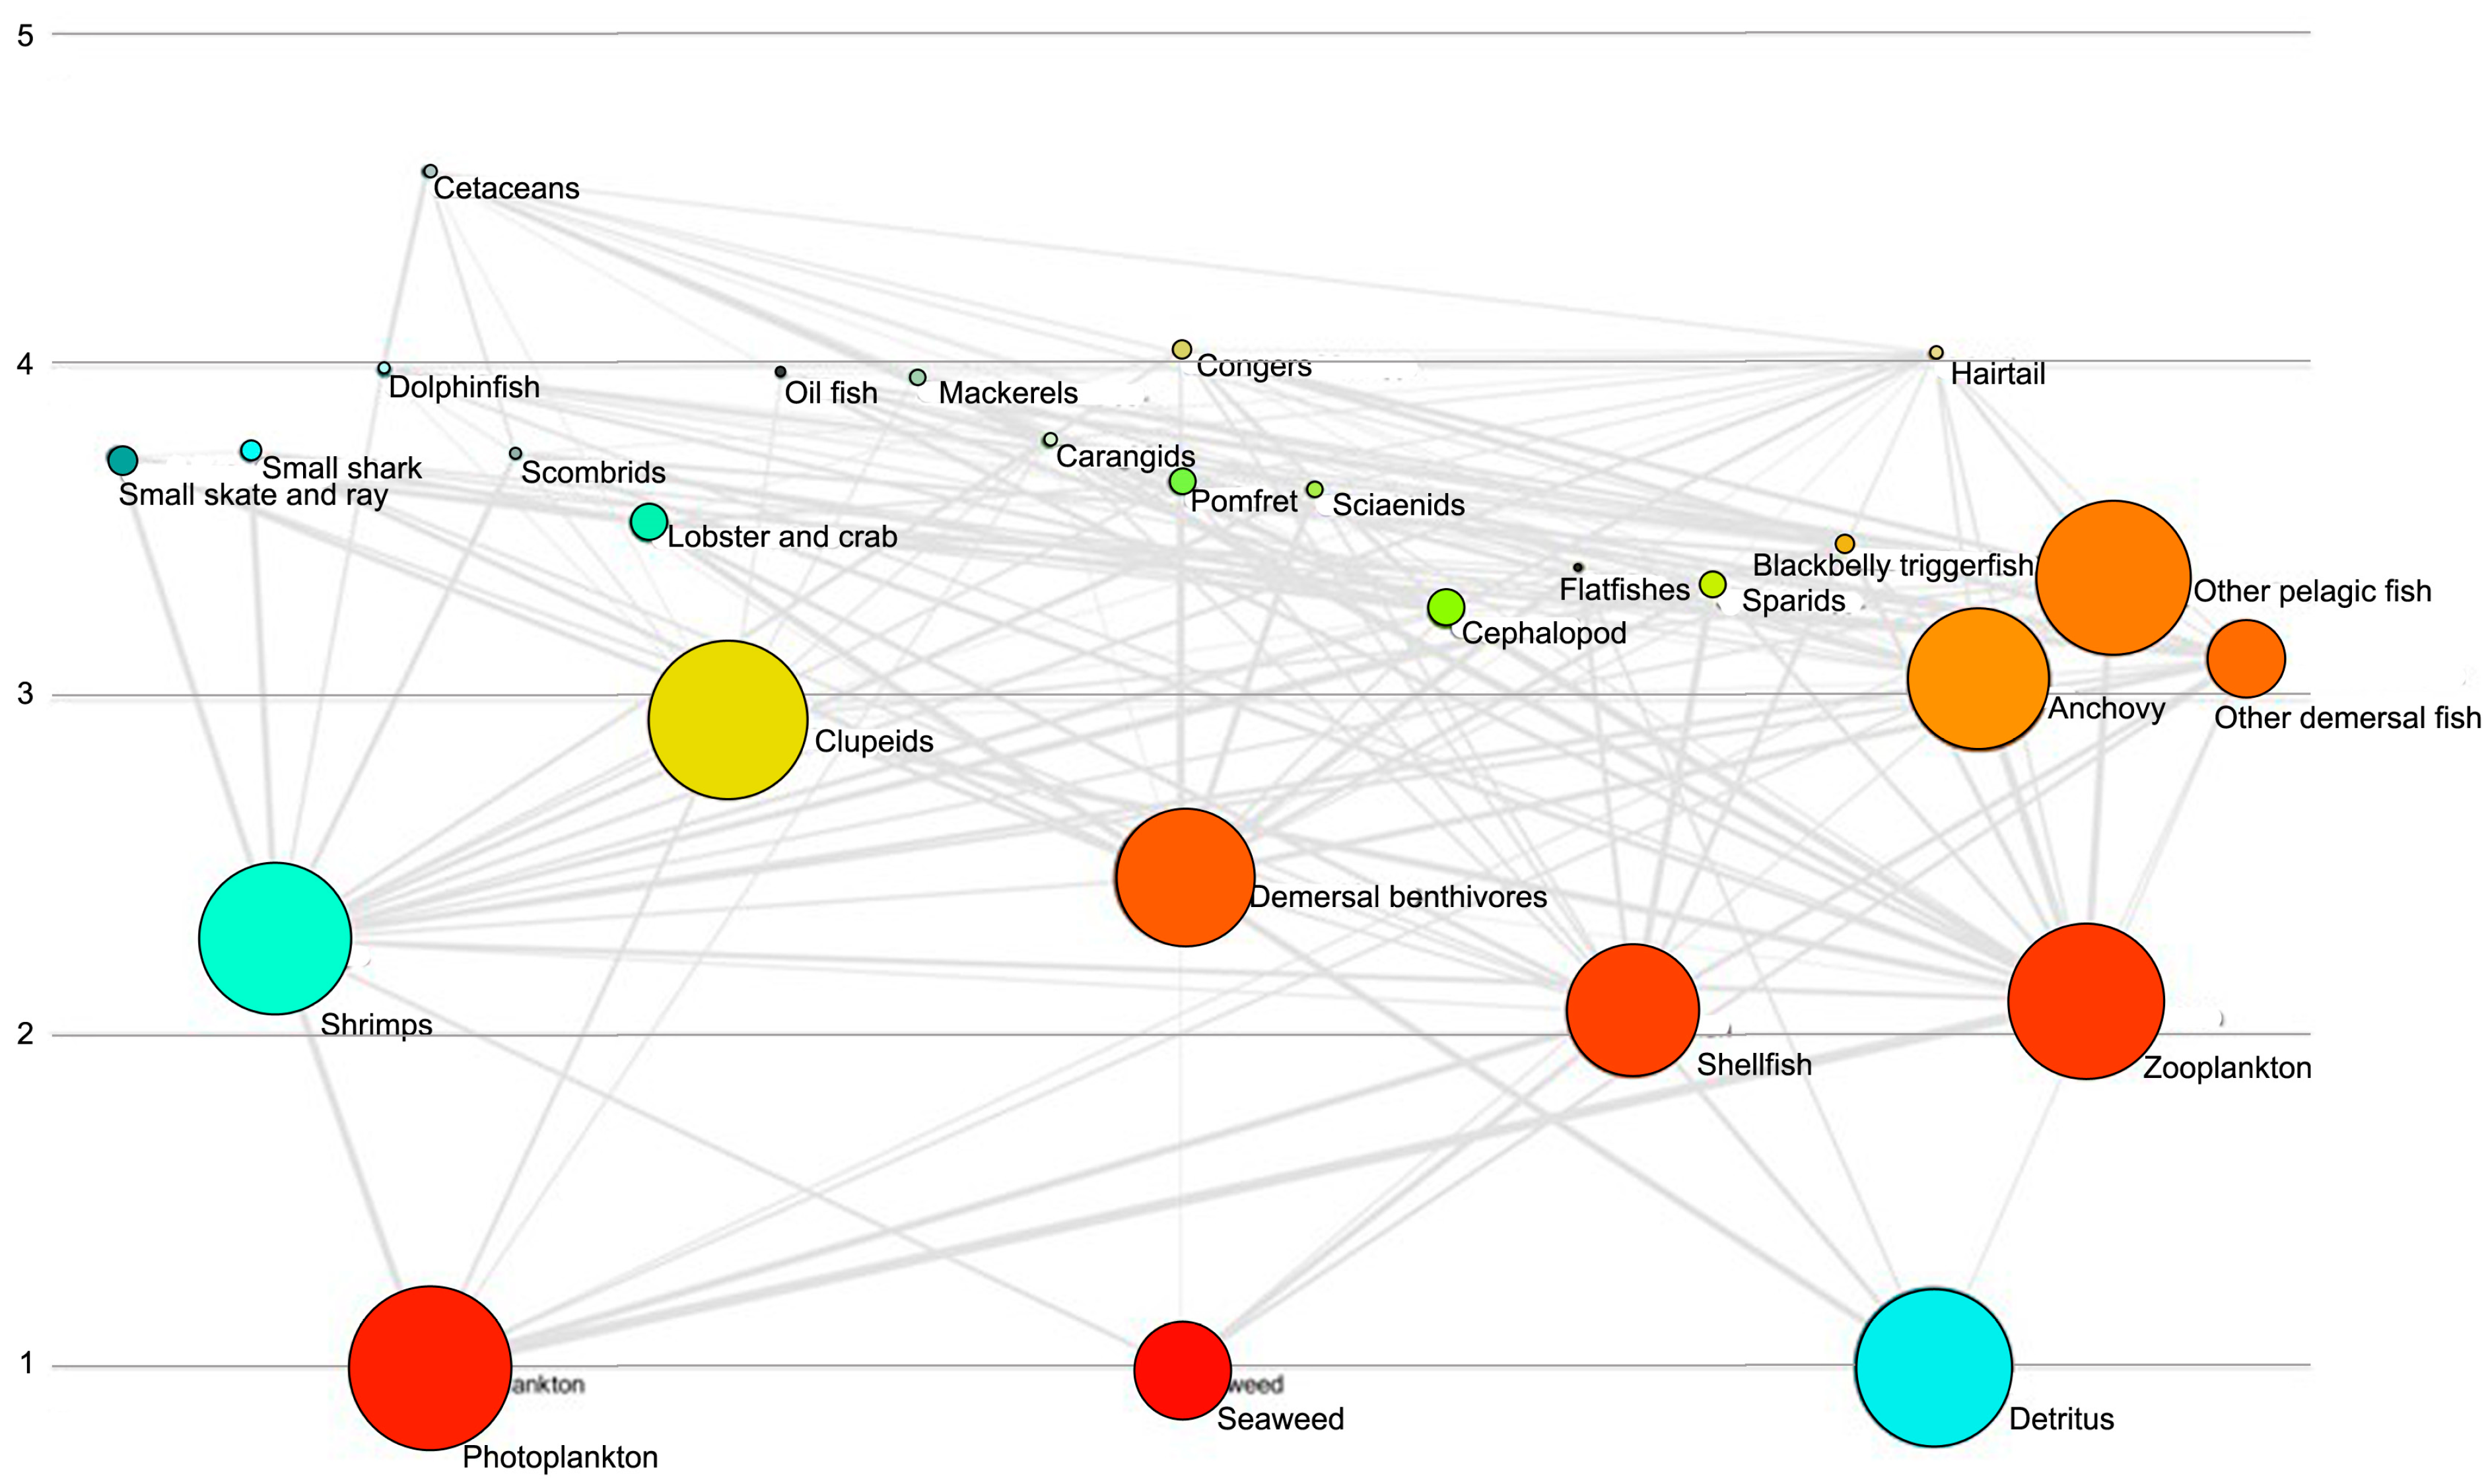
2.3. Estimation of Trophic Levels

Pauly et al. [26] mentioned that the decreases in trophic levels in global marine ecosystems were due to overfishing. To understand the variation of population structure of marine ecosystem of Guishan Island waters, the trophic level of each species/group was estimated by weighting the catch of each species/group [27]:
T L i = 1 + j T L j × D C i , j
where DCi,j represents the proportion in weight of prey for species i in the stomach of predator j, TLi represents the trophic level of predator i, the trophic level of primary producer was set as 1, and TLj represents the trophic level of prey j for predator i.
Omnivory index (OI) represents the variation of trophic level of the prey for predator i. When the trophic level of prey was the same OI = 0, OI increased with the diversity of trophic levels of prey. OI can be expressed as O I i = j = 1 n T L j T L i 1 2 D C i , j [28].

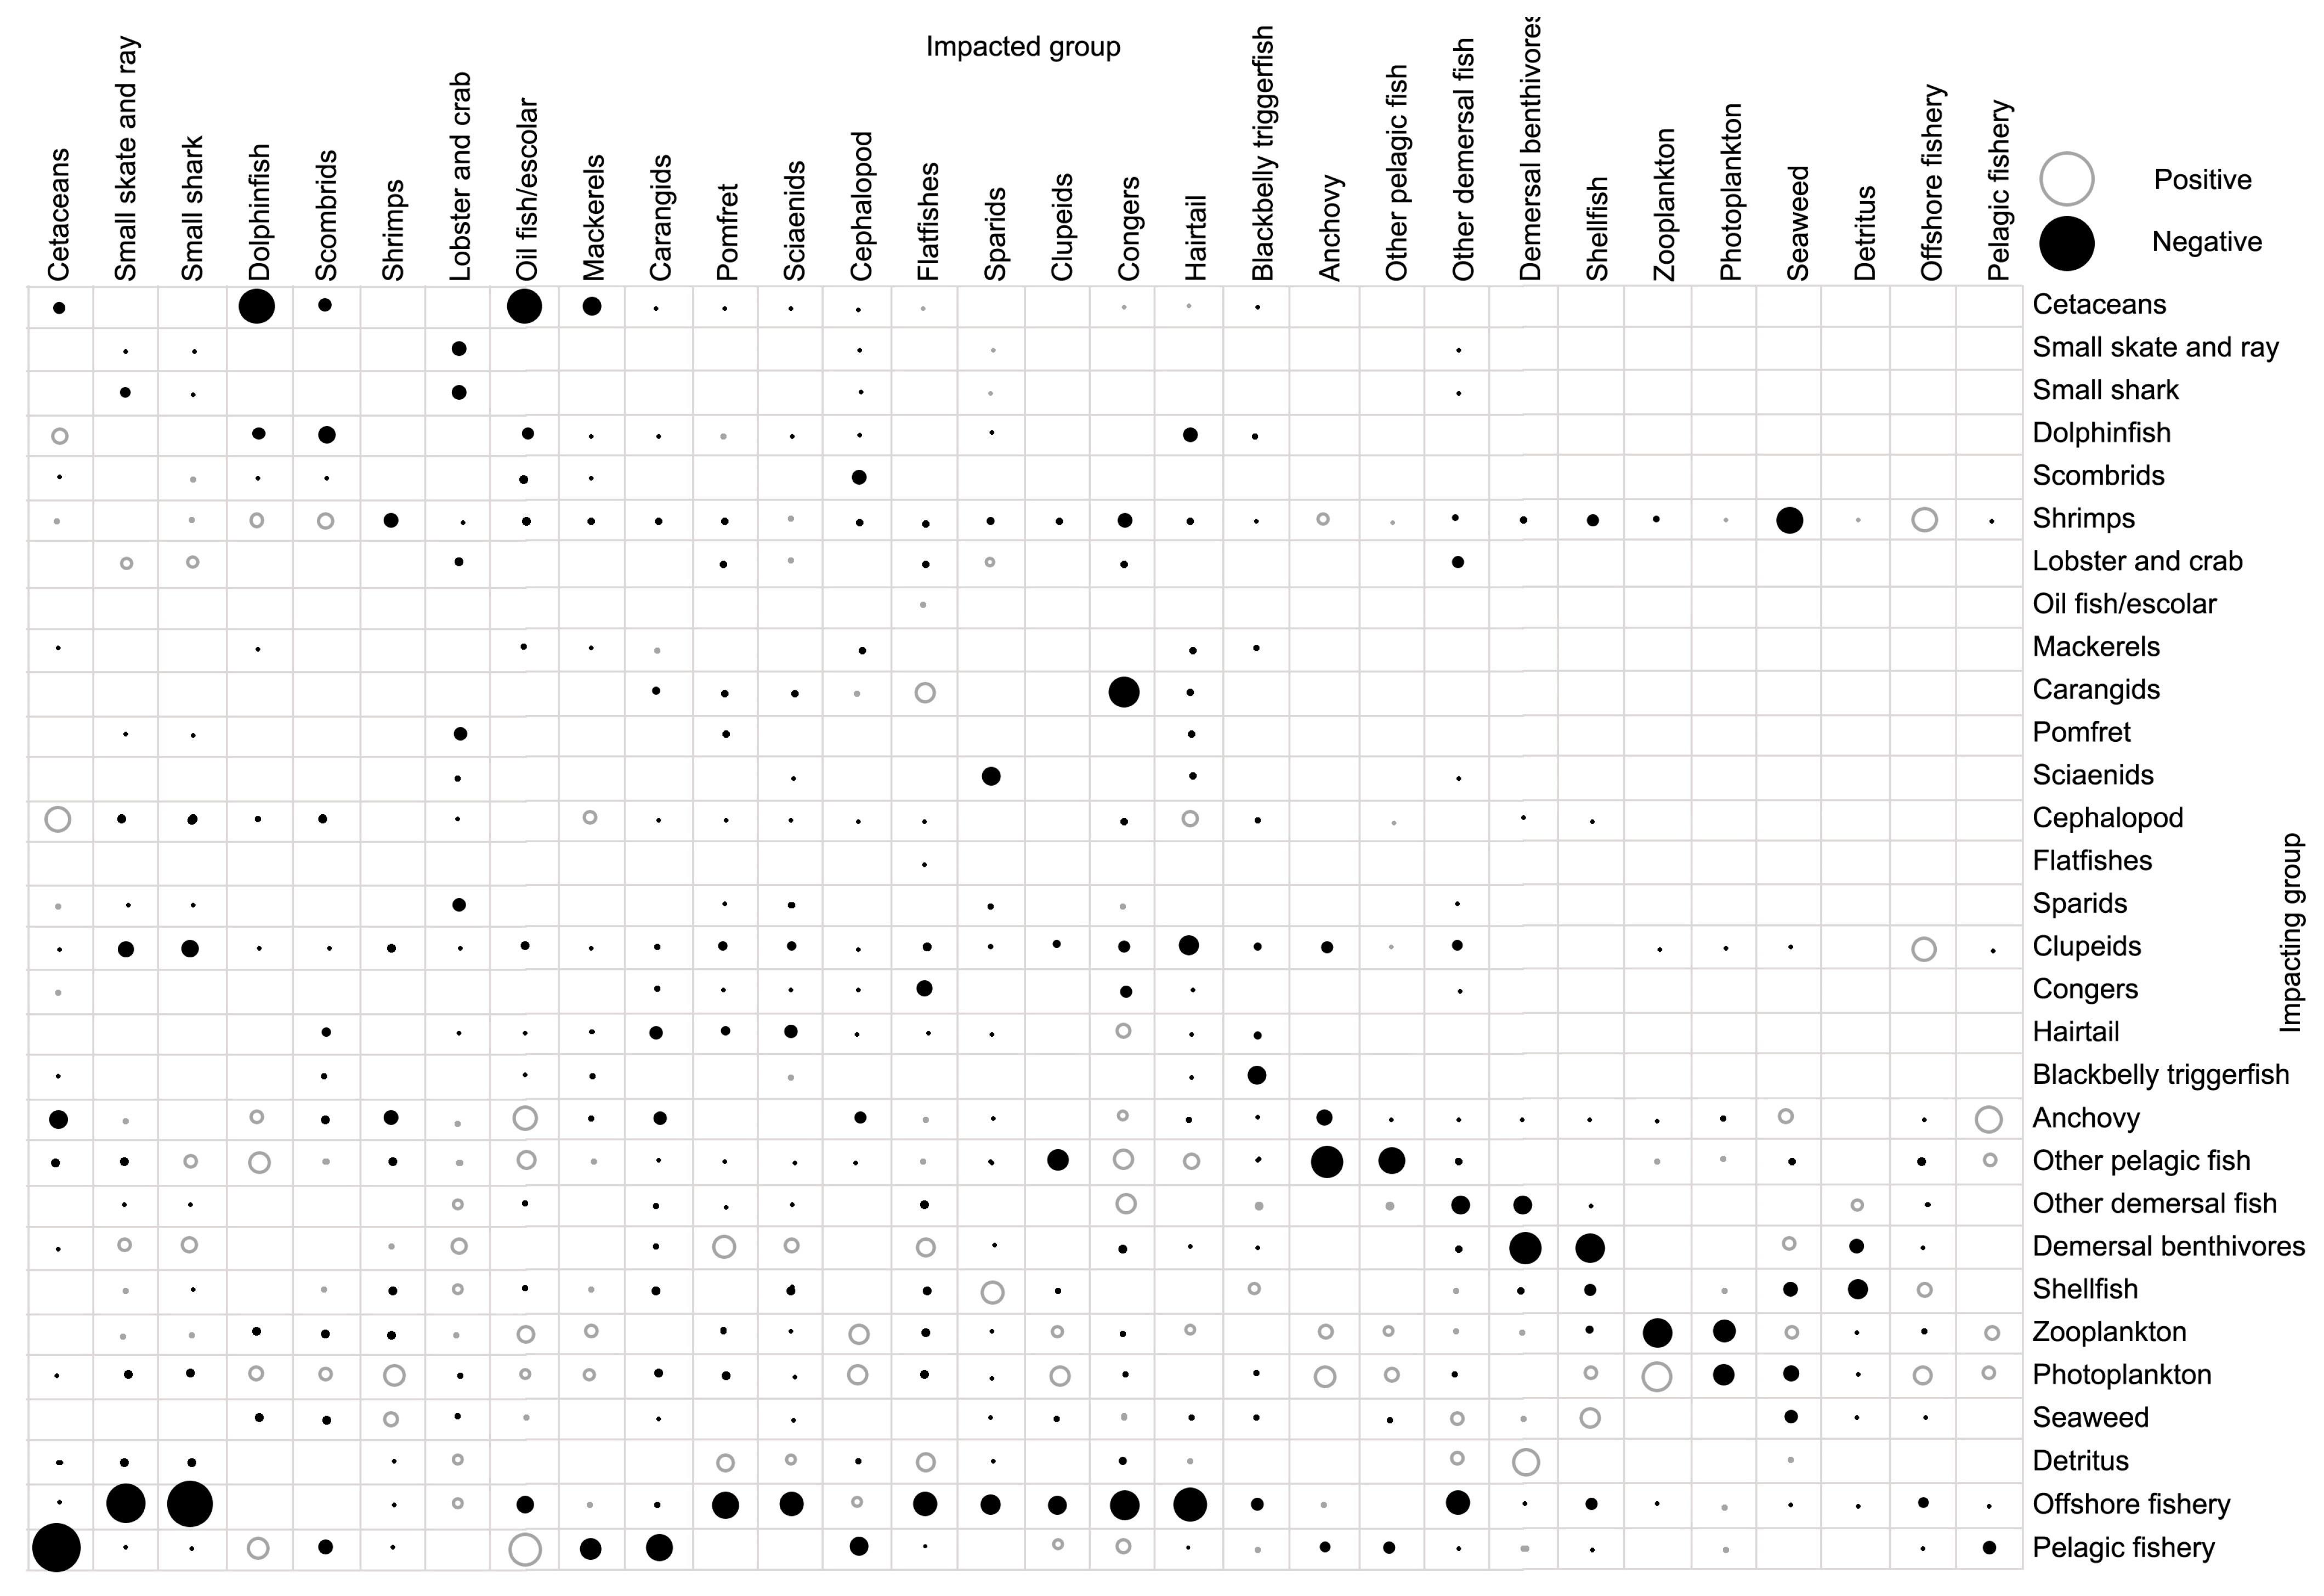
2.4. Mixed Trophic Impact (MTI)

Ulanowicz and Puccia’s [29] matrix was used to estimate the mixed trophic impact (MTI) in Ecopath. The MTI represents the direct impact of species i on species j through predation minus the overall impact from other species on species j by predation. MTI was expressed as follows:
M T I i , j = D C i , j F C i , j
where MTIi,j is the MTI of species i on species j, DCi,j is the direct impact from species i on species j by consumption, and FCi,j is the overall impact from other species on species j by consumption.

2.5. Keystone Species Identification

Keystone species is the species in an ecosystem that plays an important role in the food web of an ecosystem through predator–prey relation [30,31]. The overall mixed trophic impact and keystone index derived from Ecopath were used to identify the keystone species in the ecosystem.
The overall mixed trophic impact (εi) can be expressed as follows:
ε i = j i n m i j 2
where mi,j is the relative impact of a slight increase in biomass of impacting group i on biomass of impacted group j.
The keystone index was estimated based on the following method [31]:
K S i = ε i P i , KSi is the keystone species index 1.
P i = B i B j , where Pi is the proportion of the biomass of species i to the summary of biomass of all species.

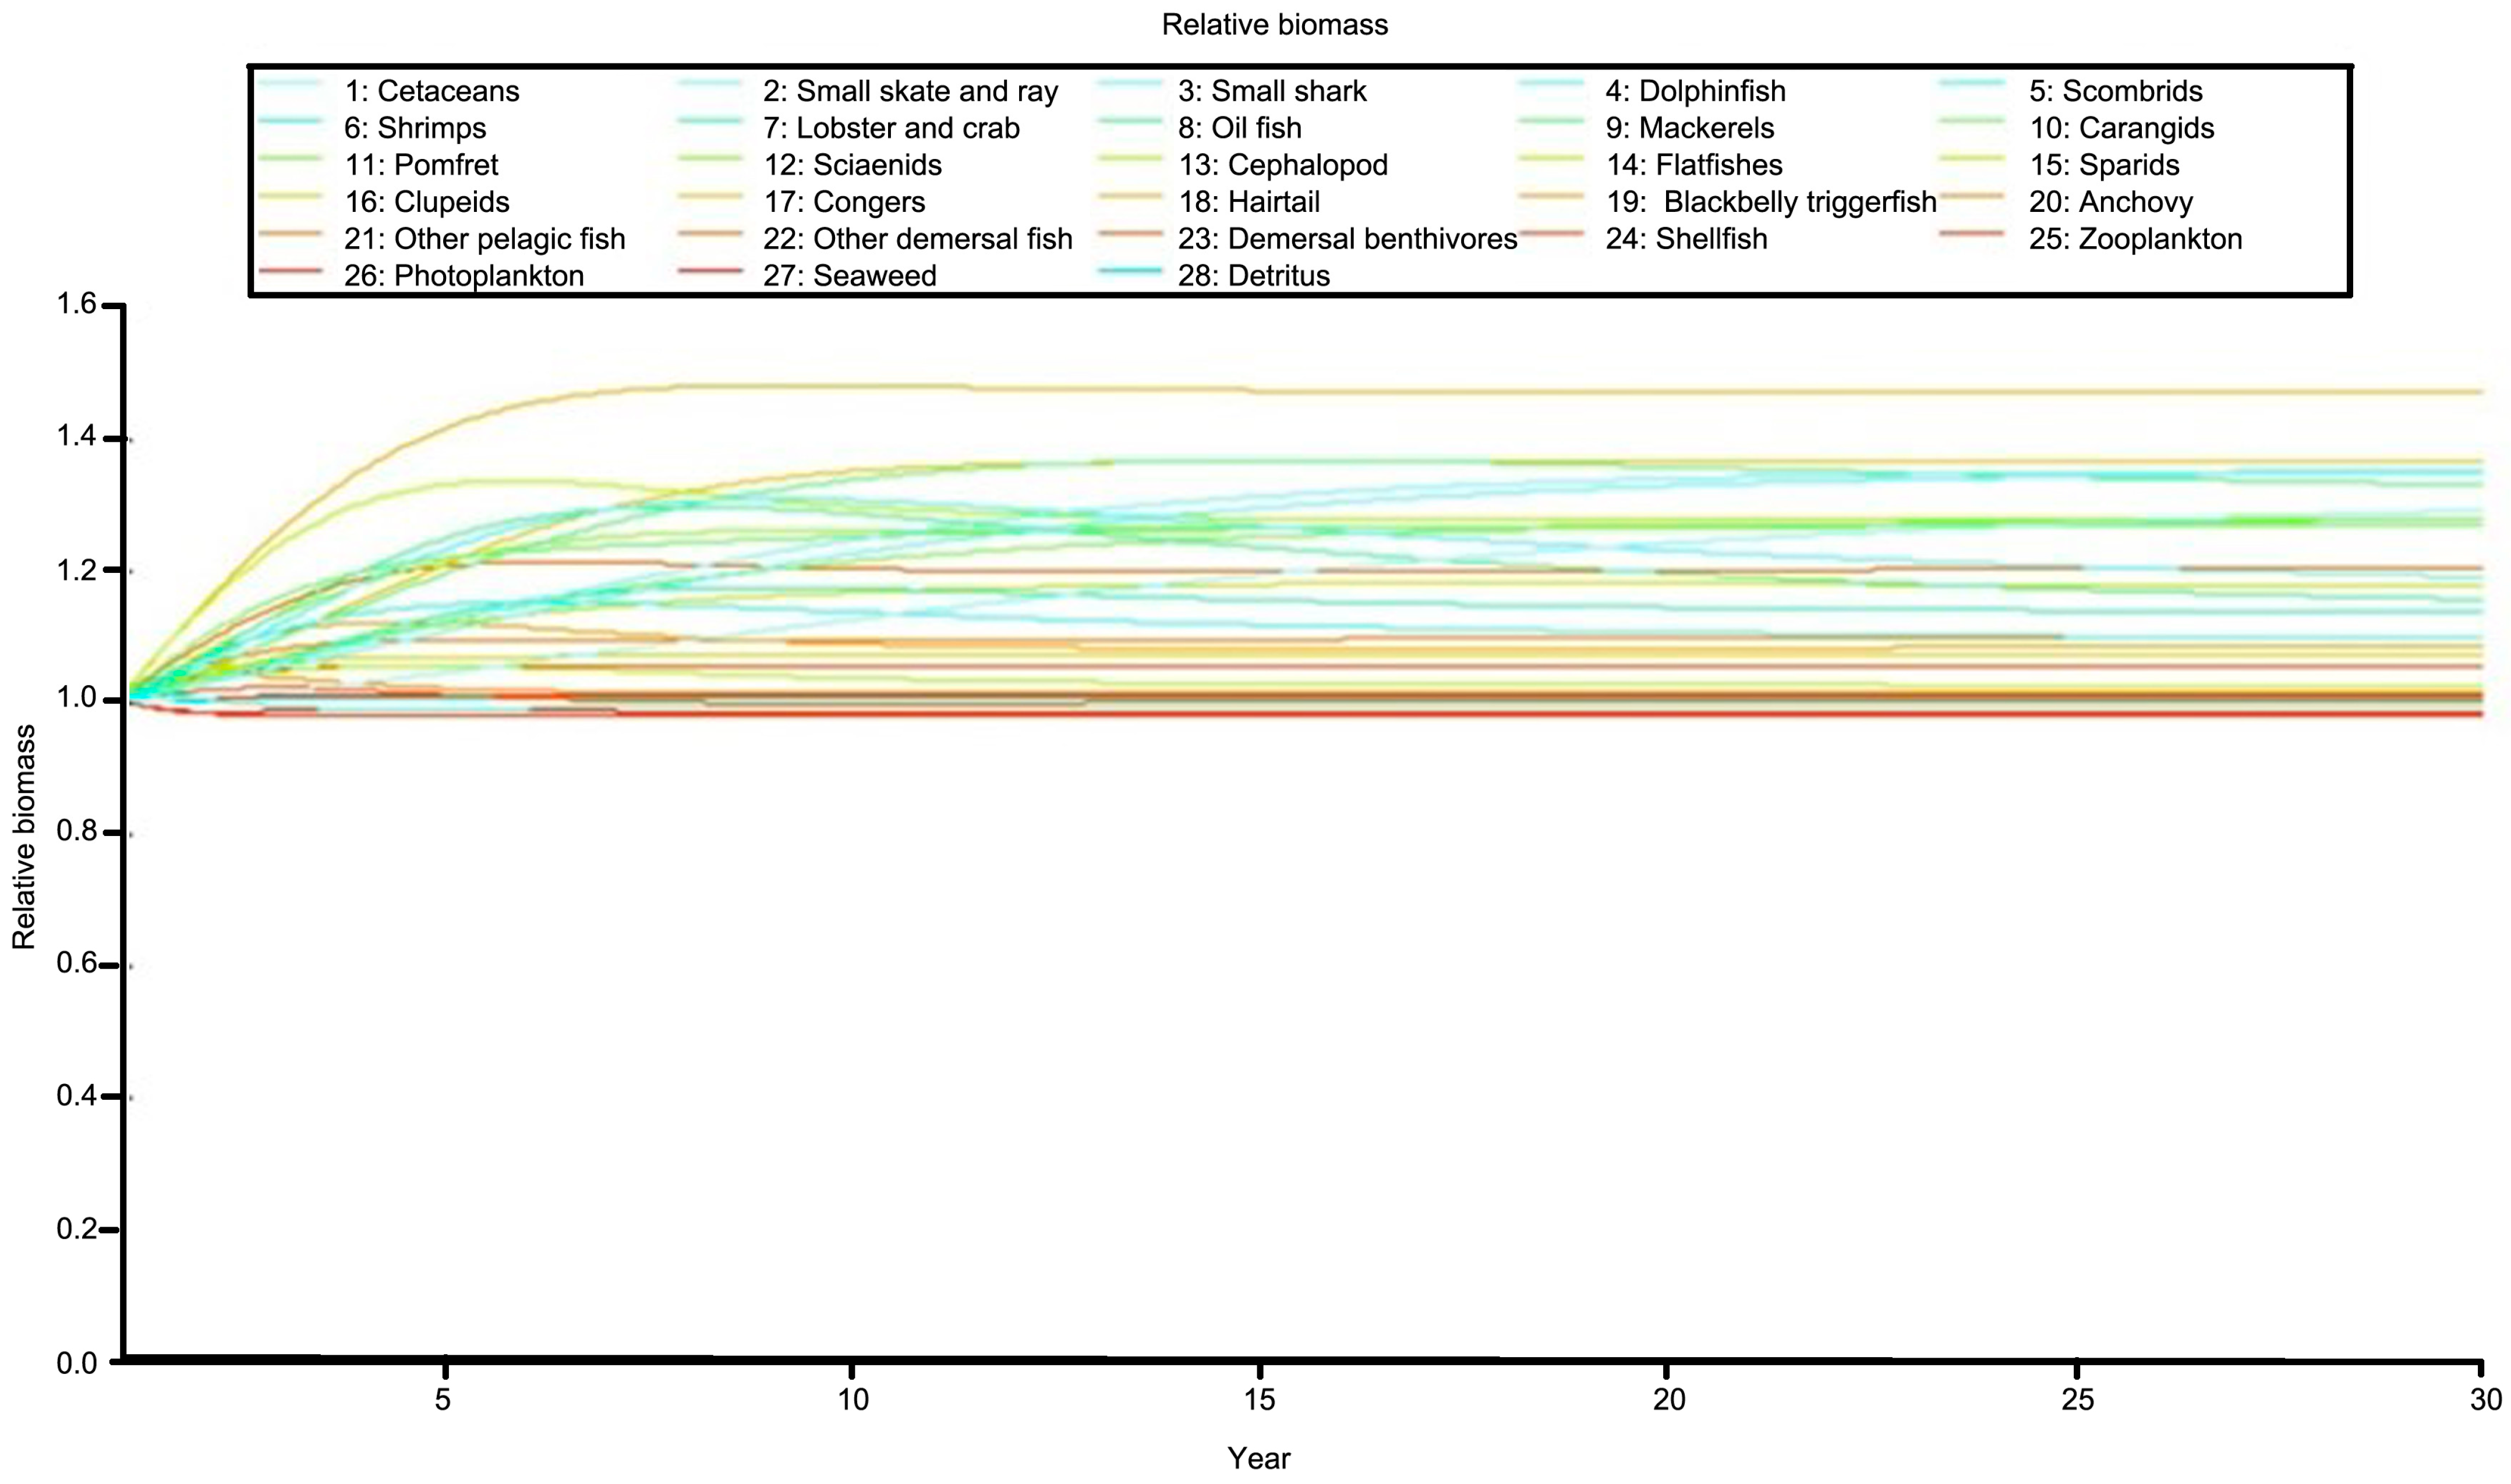
2.6. Simulations of Management Measures and Fishing Pressures Using Ecosim

After construing the ecosystem of Guishan Island by using Ecopath, Ecosim was used to simulate the impact on the ecosystem from various management measures. We used Ecosim to simulate the impact of management measures with the reduction of 10%, 20%, and 30% fishing effort for the subsequent 30 years. The core formula of Ecosim is as follows:
d B i d t = g i j Q j i j Q i j + I i M 0 i + F i + e i × B i
d B i d t is the change of biomass of species i in time t,
g i = P i Q i , where gi is the net growth efficiency of species i, which equals the ratio of the production and predatory rate of species i.
Fi is the fishing mortality of species i.

2.7. Model Construction

Based on the literature review, sampling vessel records, daily sales records of fish market, and Taiwan FishBase [32], a total of 28 species/functional groups were included in the model building. The ecosystem model’s constructions are as follows:

2.7.1. Cetaceans

Small-size dolphins were the major cetaceans in the study area, including the spinner dolphin (Stenella longirostris), common bottlenose dolphin (Tursiops truncates), striped dolphin (Stenella coeruleoalba), etc. [33]. The biomass (B) of this group was set as 3.125 × 10⁻³ ton/km2 [33]. Production per biomass (P/B) was set as 0.32 year−1; predation rate (Q/B) was set as 18.37 year−1 [34]. The major prey of this group, based on their stomach analysis, were small fishes and cephalopods [35,36,37].

2.7.2. Small Skates and Rays

The small demersal skates and rays, such as the sepia stingray (Urolophus aurantiacus) and sharpspine skate (Okamejei acutispina), comprised the majority in this group. The P/B was set as 0.50, Q/B was 2.50, and EE was 0.67 for this group. The major prey of this group were demersal seashells, demersal benthivores, and shrimps.

2.7.3. Small Sharks

The sharks with a maximum size less than 100 cm TL are defined as small sharks, including the whitespotted bamboo shark (Chiloscyllium plagiosum) and Japanese spurdog (Squalus japonicas), which are demersal species. The P/B was set as 0.45, Q/B was 2.25, and EE was 0.58 for this group. Their prey are similar to that of skates and rays and mainly comprised demersal benthivores and shrimps. The skates and rays, and small sharks were mainly caught by bottom trawl or bottom longline fishery.

2.7.4. Dolphinfish

Two dolphinfish species were found in this marine ecosystem: common dolphinfish (Coryphaena hippurus) and Pompano dolphinfish (C. equiselis). The former comprised the majority in the study area. The P/B was set as 1.681, Q/B was 8.48, and EE was 0.85. Smallpelagic fishes, zooplanktons, shrimps, and scombrids were their prey.

2.7.5. Scombrids

The spotted chub mackerel (Scomber australasicus) and chub mackerel (S. japonicus) were the dominant species, and the former comprises 60~80% of the catch of the Taiwanese mackerel purse seiner fishery [38]. The P/B was set as 3.37, Q/B was 32.57, and EE was 0.99 for this group. The major prey for this group were cephalopods, zooplanktons, and small fishes.

2.7.6. Shrimps

The majority of this group comprised sergestid shrimp (Sergia lucens) and other shrimps, which were caught by middle-water or bottom trawlers. The P/B was set as 10, Q/B was 40, and EE was 0.99. The major prey for this group was phytoplankton.

2.7.7. Lobsters and Crabs

This group included the spiny lobster (Panulirus penicillatus), Japanese spiny lobster (P. japonicas), and swimming crab (Portunus sanguinolentus), which were caught by the trap net. The P/B was set as 1.09, Q/B was 6.54, and EE was 0.70.

2.7.8. Oil Fish/Escolar

The two major species were oil fish (Ruvettus pretiosus) and escolar (Lepidocybium flavobrunneum), which were the bycatch of demersal longline fishery. These species inhabited at the depth of 200–400 m with high swimming ability and mainly fed on crustaceans, cephalopods, and small fishes. The P/B was set as 2.0, Q/B was 10.0, and EE was 0.90.

2.7.9. Mackerels

This group included the skipjack (Katsuwonus pelamis), Indo-Pacific king mackerel (Scomberomorus guttatus), narrow-barred Spanish mackerel (S. commerson), Japanese Spanish mackerel (S. niphonius), etc. The major prey items for this group were small fishes, cephalopods, demersal benthivores, and shrimps. The P/B was set as 0.80, Q/B was 4.00, and EE was 0.90.

2.7.10. Carangids

This group included the bluefin trevally (Caranx melampygus), greater yellowtail (Seriola dumerili) and other species in Carangidae. The major prey items were demersal benthivores, shrimps, and zooplanktons for this group. The P/B was set as 1.79, Q/B was 7.14, EE was 0.95.

2.7.11. Pomfret

This group included the silver pomfret (Pampus argenteus), black pomfret, and other butterfish. The P/B was set as 0.57, Q/B was 2.85, and EE was 0.95. Their major prey item was zooplankton.

2.7.12. Sciaenids

This group included the large yellow croaker (Larimichthys crocea), small yellow croaker (L. polyactis), and other species of Sciaenidae. The P/B value was set as 1.5, Q/B was 7.5, and EE was 0.95.

2.7.13. Cephalopods

This group included the species Octopodidae, Sepiidae, and Loliginidae. The major prey of this group was phytoplankton, and this group was the major prey of several high-trophic level species. The P/B was set as 2.5, Q/B was set as 25, and EE was set as 0.99.

2.7.14. Flatfishes

This group included fivespot flounder (Pseudorhombus pentophthalmus), shortheaded tonguesole (Cynoglossus kopsii), and olive wide-eyed flounder (Engyprosopon macroptera). These species have weak swimming ability and feed on demersal crustaceans. The P/B was set as 2.5, Q/B was 10, and EE was 0.95.

2.7.15. Sparids

This group includes the red seabream (Pagrus major), Crimson seabream (Dentex tumifrons), and longfinned bullseye (Cookeolus japonicas), etc. The species in this group have high commercial value and are carnivorous or omnivorous. Their major prey items were crustaceans and demersal benthivores. The P/B was set as 0.80, Q/B was 4.00, and EE was 0.95.

2.7.16. Clupeids

The major species of this group included the red-eye round herring (Etrumeus teres), spotted sardinella (Amblygaster sirm), and other pilchard species. These small coastal species fed on shrimps, sea algae, and larvae. The P/B was set as 2.00, Q/B was 10.00, and EE was 0.99.

2.7.17. Congers

This group included congers such as the daggertooth pike conger (Muraenesox cinereus). The major prey of this group was other fishes, crustaceans, and demersal benthivores. P/B was set as 1.00, Q/B was set as 5.00, and EE was set as 0.85.

2.7.18. Hairtail

Hairtail, including Trichiurus lepturus and T. japonicas, are the important commercial species in this area. They have diel movement behavior and mainly feed on small fishes and crustaceans. The P/B was set as 2.50, Q/B was 12, and EE was 0.95.

2.7.19. Blackbelly Triggerfish

This group included mudbank filefish (Paramonacanthus sulcatus) and other file fish that mainly fed on zooplankton. The P/B was set as 2.5, Q/B was 12, and EE was 0.95.

2.7.20. Anchovy

This group included Engraulis japonicas and Encrasicholina spp. in Engraulidae. These species mainly feed on crustaceans, zooplankton, and phytoplankton. The P/B was set as 3, Q/B was 15, and EE was 0.99.
The remaining species/group in this marine ecosystem included other pelagic fishes, demersal fishes, zooplanktons, phytoplankton, sea weeds, demersal benthivores, shellfish, and detritus. After referencing parameters used in similar marine ecosystems, the P/B ratio for phytoplankton was set as 400, while the P/B and Q/B ratios for zooplankton were set as 50 and 200, respectively [11,24]. The information regarding the biomass, production (catch), and consumption (stomach contents) of 28 species/functional groups collected from the literature were used as the input parameters in Ecopath with Ecosim for analysis (Table 1). The pedigree analysis in Ecopath was used to estimate the uncertainty of input parameters.

3. Results and Discussion

The output of Ecopath and Ecosim for the ecosystem model in the waters of Guishan Island developed in this study was described as follows:

3.1. Trophic Position

In the Guishan Island marine ecosystem model developed in this study using Ecopath, trophic positions (TP) were determined based on the analysis of stomach contents and the literature review. Cetaceans occupied the highest trophic position with a value of 4.59, while demersal elasmobranchs, including small sharks (3.75) and skates and rays (3.73), held intermediate positions. Among teleost species, hairtail and congers exhibited the highest TP at 4.05, followed by dolphin fish at 4.0. The trophic positions of other teleost species ranged from 3.06 for anchovy to 3.98 for oil fish/escorla. Crustaceans displayed varying TP values, ranging from 2.06 for seashells to 3.53 for lobster (Table 1 and Figure 2).

3.2. Biomass Estimate

Based on the biological and stomach content information, the biomass of skates and rays, and small sharks estimated from Ecopath were 0.032 ton/km2 and 0.038 ton/km2, respectively. The estimated biomass of pelagic species ranged from 0.001 ton/km2 for oil fish to 0.012 ton/km2 for dolphinfish. While the estimated biomass of other teleost species ranged from 0.001 ton/km2 for flat fish to 5.12 ton/km2 for clupeids, the biomass of shrimp was 3.935 ton/km2 and that of crabs and lobsters was 0.127 ton/km2, while the biomass of cephalopods was 0.114 ton/km2 and that of demersal benthivores was 2.645 ton/km2. The biomass estimates of zooplankton, phytoplankton, and sea grass were 4.55 ton/km2 4.740 ton/km2 and 0.842 ton/km2, respectively (Table 1).

3.3. Fishing Mortality, Exploitation Rate, and Predation Mortality

Although all cetaceans have been included on the list of conservation animals in Taiwan since 1993 [39], incidental catches still occur through longline and drift net fisheries, resulting in a low fishing mortality (F) and exploitation rate (E) of 0.010 and 0.031 year−1, respectively. Compared with fishes, cetaceans have life history characteristics of late maturity and small numbers of offspring. Although the F and E were low compared with other animals in the ecosystem, a continuous monitoring of the abundance is needed.
Fishermen mentioned that cetaceans will not only prey on fish with a high economic value in this area, but also cause a decline in fish populations. However, Ecosim results in this study showed that after the introduction of strict bans on fishing and bycatch of cetaceans, the biomass of cetaceans will increase significantly, but it will not have a great impact on other fish populations due to its small number of abundance compared with other animals. The variations of marine mammal resources in this ecosystem may not have a great impact on the balance of the ecosystem, but the economic impact on fishermen still requires further study.
The F and E were estimated to be 0.308 year−1 and 0.617 for skates and rays, and 0.261 year−1 and 0.580 for small sharks. Most species of this group had a low economic impact and were treated as trash fish in the past; however, some fishing vessels started to target these species due to the increase in their sales price in recent years. The F and E of dolphinfish, a high-commercial-value species, were estimated to be 0.411 year−1 and 0.245. The hairtail and flat fish had the highest F and E of 1.640 year−1 and 0.656, and 1.433 year−1 and 0.573, respectively, while crabs and lobsters had the lowest F and E of 0.172 year−1 and 0.158 (Table 2). The estimated inter-species/group predatory mortality in the Guishan Island marine ecosystem is showed in Table 3.
The predatory mortality (PR) of dolphinfish mainly resulted from cetaceans, and PR was estimated to be 1.018 year−1, that of scombrids was 1.989 year−1, oil fish/escorla was 1.265 year−1, and it was 0.262 year−1 for mackerels. The PR of other teleost species ranged from 0.372 year−1 for sparids to 0.779 year−1 for carangids. The highest PR occurred in anchovy at 2.084 year−1, shrimps at 8.898 year−1, and 1.711 year−1 for demersal benthivores (Table 2).

3.4. Trophic Impact and Keystone Species

Negative trophic impact on keystone species from fisheries was identified in the analysis (Figure 3). Pelagic fisheries such as longline and drift net fisheries had a strong negative trophic impact on cetaceans. On the other hand, the demersal fisheries such as bottom longline and bottom trawl fisheries had a strong negative trophic impact on demersal skates and rays, and small sharks. In addition, fishing also causes a great trophic impact on mackerels, hairtail, sparids, and carangids. However, positive trophic impacts resulting from the removal of predators were observed for dolphinfish and oil fish/escorla (Figure 3). Cetaceans exhibited a negative impact on prey species such as dolphinfish, mackerel, and oil fish/escorla but had a mild impact on other teleost species. The increase in shrimp biomass was noted to benefit predators like dolphinfish and mackerels. Phytoplankton and sea grass showed positive impacts due to a decrease in their predators, while zooplankton displayed similar effects (Figure 3). The increase in predators had a negative impact on shrimps but benefitted other species with higher trophic levels. The increase in the biomass of anchovy can provide more food for other teleost fishes and thus have a positive impact on these species and result in the increase of catch (Figure 3).
Phytoplankton, despite its low trophic position, emerged as the top keystone species in the Guishan Island marine ecosystem, being the major source of primary production with an abundant biomass. Zooplankton and anchovy were identified as the second keystone species, contributing significantly to the ecosystem with their ample biomass. Carangids and hairtail, despite their lower biomasses, exerted a higher influence due to their wide trophic breadth and substantial food intake (Table 4).

3.5. Primary Production Required for Fisheries

Harvesting high-trophic-level species such as cetaceans, dolphinfish, oil fish/escorla, and mackerels not only reduces the top-down control of the other species in the ecosystem but also necessitates more primary production to sustain fisheries. Simulations indicated that harvesting 1 kg cetacean requires 10,604 kg of primary production. Although the incidental catch of cetaceans was rare, their primary production requirement constituted only 0.01% of the gross primary production. Dolphinfish, hairtail, and mackerels required 302, 317, and 272 kg primary production, respectively, comprising 0.05%, 0.18%, and 0.07% of the gross primary production. Anchovy and clupeids had the highest requirements at 2.00% and 2.51% of the gross primary production (Table 5).

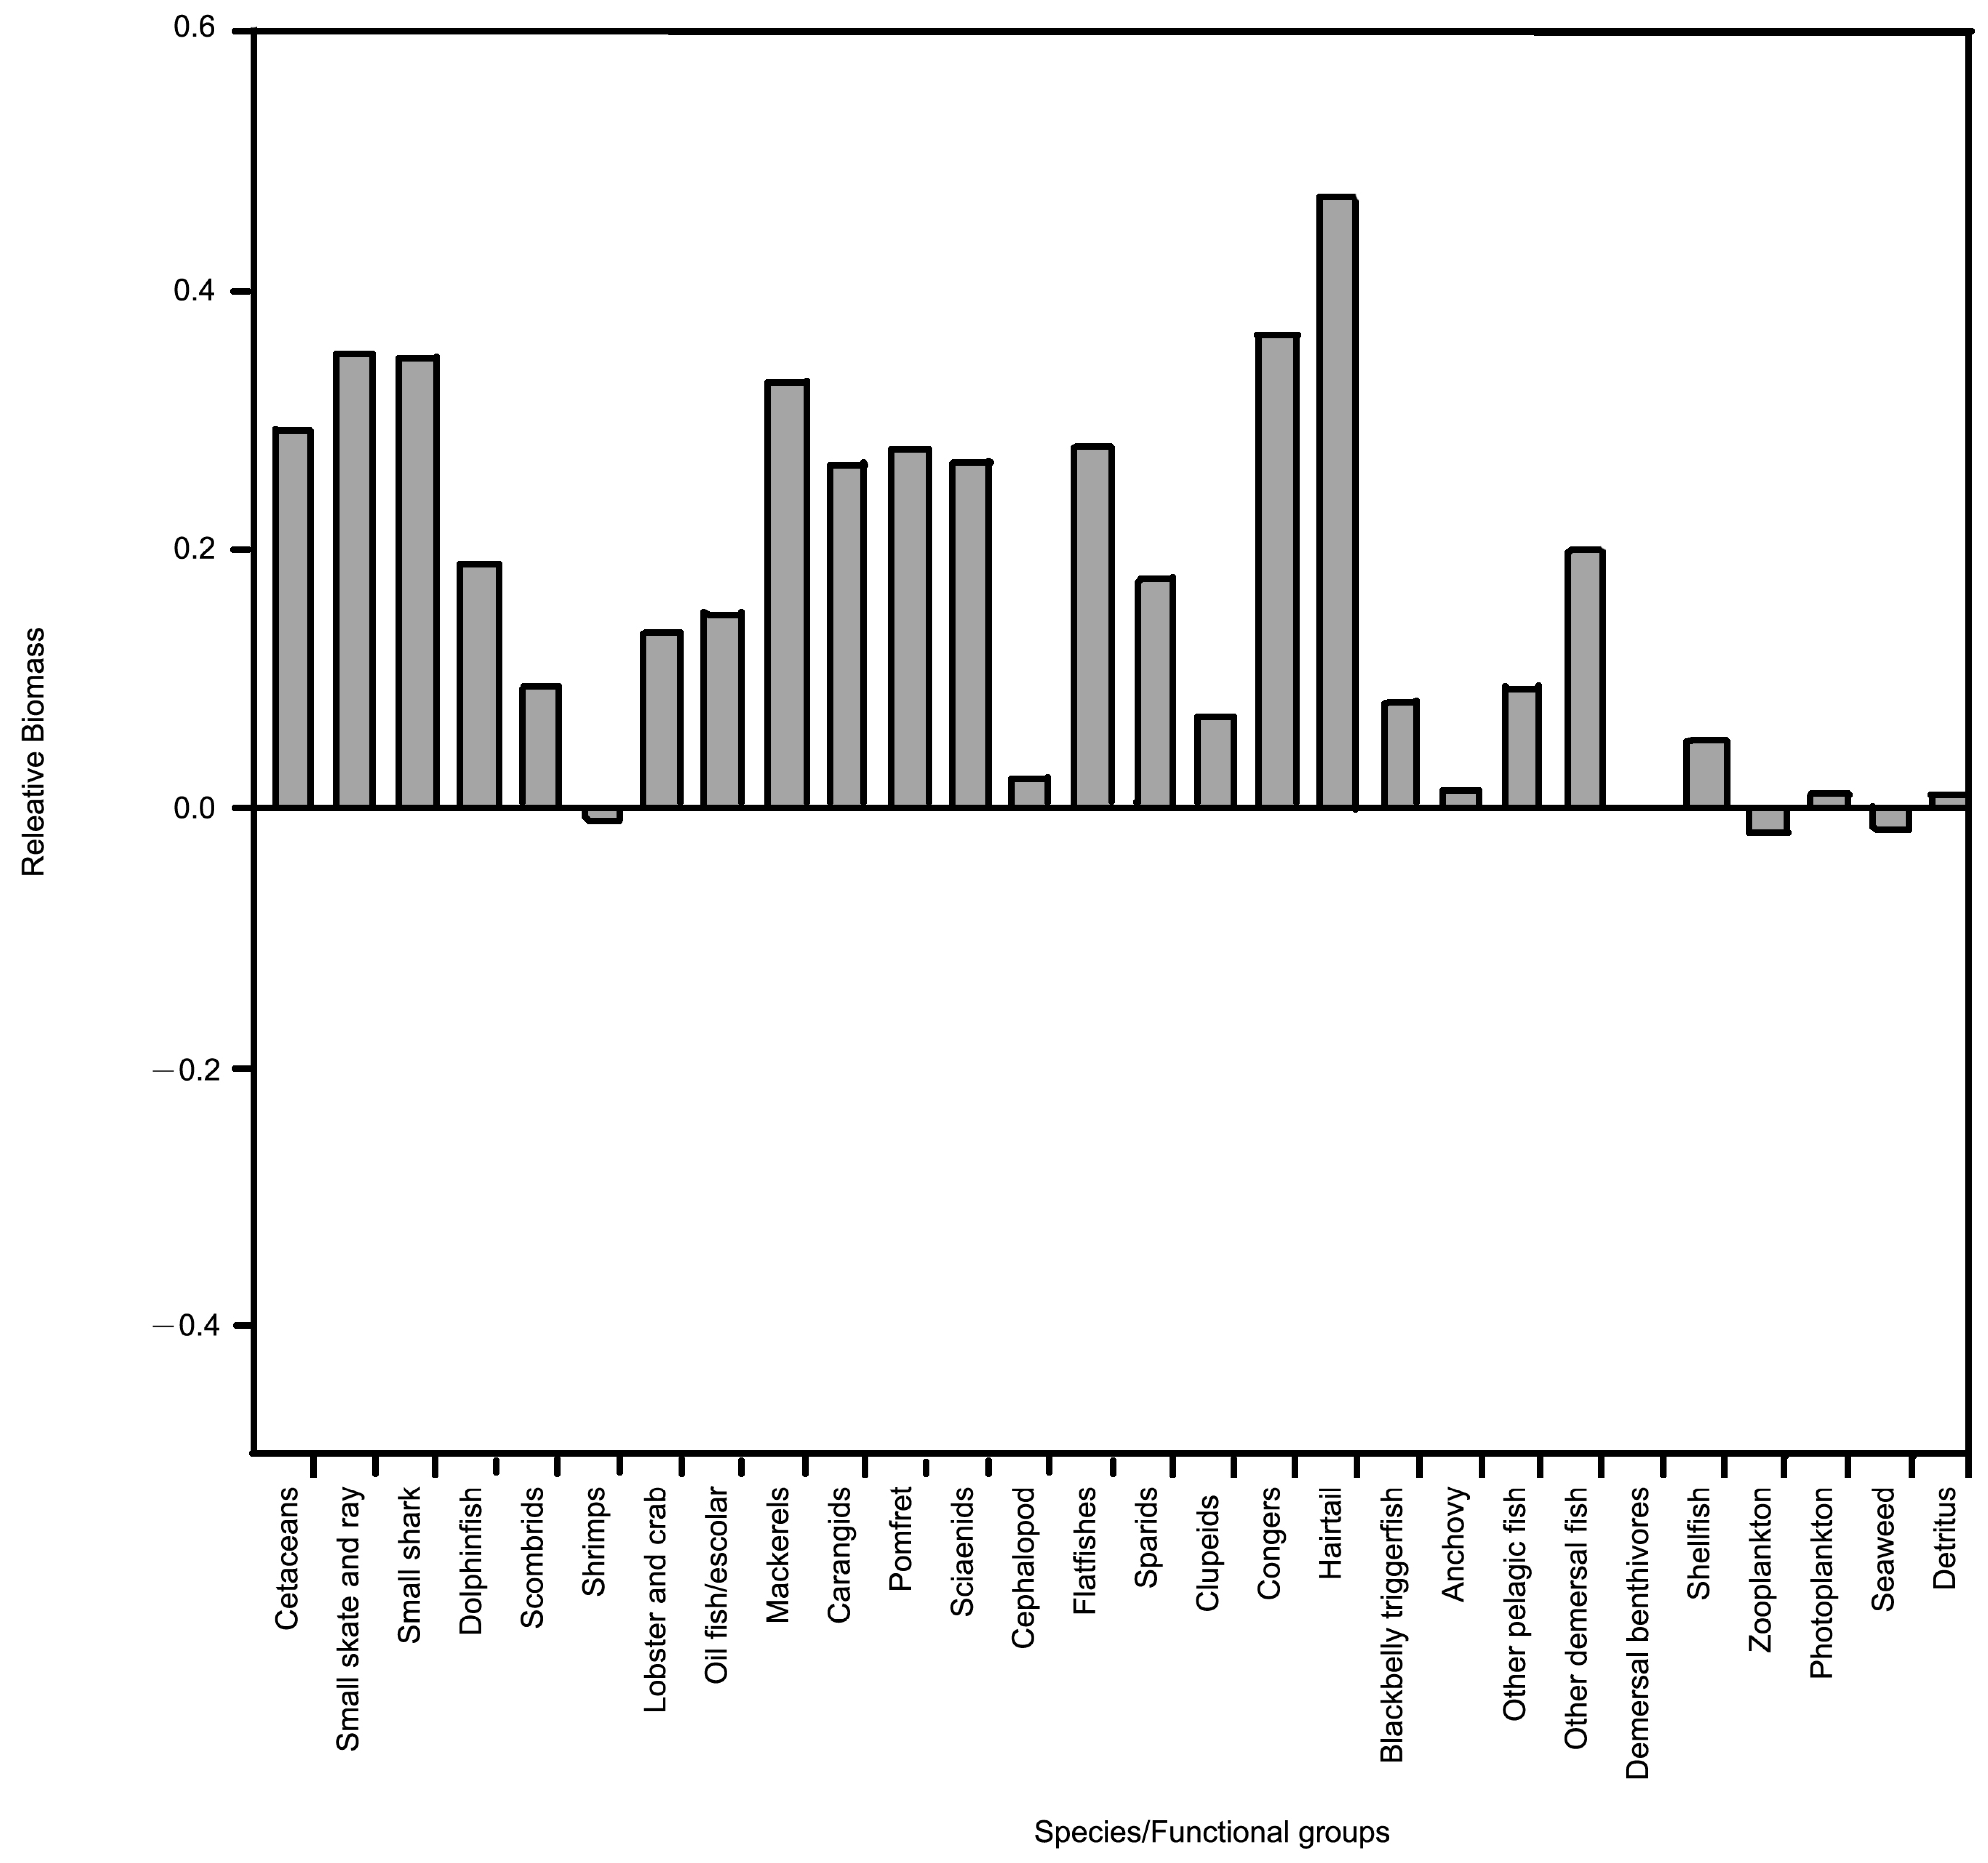
3.6. Simulations with Reduction of Fishing Effort

Ecosim results with 10%, 20%, and 30% reduction of fishing effort for subsequent 30 years indicated similar results but the former two management measures did not lead to a significant increase in the resource levels of various species within this ecosystem, while simulations with a 30% reduction in fishing effort showed increased biomass for most species, particularly a 47% increase for hairtail and a 30% increase for small sharks, skates, and rays. Conversely, species at lower trophic levels, such as zooplankton, demersal benthivores, and shrimps, experienced decreased biomass due to the increase in their predator’s biomass (Figure 4 and Figure 5). In our 30-year simulations, the high trophic species, such as cetaceans, small skates and rays, small sharks, and dolphinfishs, were benefited from reduced fishing effort. The biomass of these functional groups increased greatly; however, the biomass of their main prey—scombrids, anchovy, and cephalopods—increased only to a very limited extent. The result suggested that a strong top-down control in Guishan Island marine ecosystem. Predators often play a crucial role in marine ecosystems due to predation. If large amount predators are removed, it can lead to changes in the biomass, and habitat of all related species in the ecosystem due to trophic cascade effect [15,16].

3.7. Model Uncertainty

Dame and Christian [14] suggested that the ecosystem-based analyses should consider the following uncertainties: (1) natural variations of input parameters, such as biomass of species/group or stomach content (consumption); (2) sampling methods, such as different selectivity of fishing gears may cause errors in biomass estimation; (3) model construction, such as that single species or aggregated functional group may cause its influence to be enhanced or dispersed [40]; (4) basic assumptions of ecological network analysis (ecological network analysis; ENA). For example, ecological network analysis research usually assumes that the ecosystem is in a steady state [41], which is not realistic. However, only a few studies of ENA have considered the uncertainty in model construction and analysis (Baird et al., 1998; Christian and Luczkovich, 1999) [42,43]. The pedigree analysis indicated that the biomass had the highest uncertainty, and a lower uncertainty was found for the input parameters of higher-trophic-level species (Table 6). Although input parameter uncertainties were not fully addressed in this study, the use of Ecosim to simulate the impact of biomass and energy changes provides a dynamic perspective. This approach can make up for the insufficiencies of Ecopath, which assumes a steady-state ecosystem (Walters et al., 1997) [22].
Pinnegar et al. [44] and Coll et al. (2006) [45] used principal component and cluster analysis to analyze the biological parameters of each species in a marine ecosystem and aggregated them into groups, and removed species that had a small impact on the entire ecosystem. This method can effectively reduce the uncertainty in the construction method of the ecological network model. However, in this study, due to the lack of species-specific biological information, mackerels, cephalopods, other surface fish, and other demersal fish were aggregated as functional groups without being based on multivariate analysis. In addition, the input parameters for some species were obtained from Fishbase or the literature, which might not represent the actual values in the study area. Future studies should focus on collecting more biological information on each species/group, particularly those of lower trophic levels, to improve the results of analyses.

4. Conclusions

This study aimed to construct the ecosystem structure of the waters of Guishan Island, incorporating 28 major species/functional groups using Ecopath with Ecosim. Fisheries were found to have a negative impact on major commercial species, with the exception of dolphinfish and oil fish, Lepidocybium spp., which benefitted from the reduction in their predators or competitors. Keystone species in this ecosystem were identified as phytoplankton, zooplankton, and anchovy, owing to their abundant biomass and significance as crucial food sources of many species in the ecosystem. It was observed that reducing the fishing effort could potentially increase the biomass of species occupying higher trophic positions in the ecosystem.
It is important to note that the analysis did not include trash fish caught by trawl fishery as bycatch, which comprises under-size individuals of many commercial species and non-commercial species. The growing proportion of trash fish in the area in recent years [23] underscores the need for a further investigation. Subsequent studies should focus on examining the composition of trash fish, estimating their abundance, and incorporating these data into simulations to enhance the accuracy of results.

Author Contributions

Conceptualization, K.-M.L. and C.-P.C.; methodology, C.-P.C.; software, C.-P.C.; validation, C.-P.C., K.-M.L. and K.-Y.S.; formal analysis, C.-P.C.; investigation, K.-M.L.; data curation, C.-P.C. and K.-Y.S.; writing—original draft preparation, C.-P.C.; writing—review and editing, K.-M.L.; supervision, K.-M.L.; funding acquisition, K.-M.L. All authors have read and agreed to the published version of the manuscript.

Funding

This research was funded by the National Science Council of Taiwan, grant number NSC 99-2621-M-019-002 and NSC 101-2621-M-019.

Institutional Review Board Statement

Ethical review and approval were not applicable as this study did not involve experiments on humans or animals.

Data Availability Statement

Data are contained within the article.

Conflicts of Interest

The authors declare no conflict of interest. The funders had no role in the design of this study; in the collection, analyses, or interpretation of data; in the writing of the manuscript; or in the decision to publish the results.

References

  1. Taiwan Fisheries Year Book; Fisheries Agency, Ministry of Agriculture: Taipei, Taiwan, 2023. Available online: https://www.fa.gov.tw/list.php?theme=FS_AR&subtheme= (accessed on 10 August 2023).
  2. Liu, K.M.; Cheng, Y.L. Virtual population analysis of the big eye, Priacanthus macracanthus in the northeastern Taiwan waters. Fish. Res. 1999, 41, 243–254. [Google Scholar] [CrossRef]
  3. Schaefer, M.B. Some aspects of the dynamics of populations important to the management of the commercial marine fisheries. Inter-Am. Trop. Tuna Comm. Bull. 1954, 1, 23–56. [Google Scholar]
  4. Schaefer, M.B. Some considerations of population dynamics and economics in relation to the management of the commercial marine fisheries. J. Fish. Board Can. 1957, 14, 669–681. [Google Scholar] [CrossRef]
  5. Beverton, R.J.H.; Holt, S.J. On the Dynamics of Exploited Fish Populations; facsimile reprint, 1993; Chapman and Hall: London, UK, 1957; 240p. [Google Scholar]
  6. Latour, R.J.; Brush, M.J.; Bonzek, C.F. Toward ecosystem-based fisheries management: Strategies for multispecies modeling and associated data requirements. Fisheries 2003, 28, 10–22. [Google Scholar] [CrossRef]
  7. May, R.M.; Beddington, J.R.; Clark, C.W.; Holt, S.J.; Laws, R.M. Management of multispecies fisheries. Science 1979, 205, 267–277. [Google Scholar] [CrossRef]
  8. Sparre, P. Introduction to multispecies virtual population analysis. ICES Mar. Sci. Symp. 1991, 193, 12–21. [Google Scholar]
  9. Brandt, S.B.; Hartman, K.J. Innovative approaches with bioenergetics models–future application to fish ecology and management. Trans. Am. Fish. Soc. 1993, 122, 731–735. [Google Scholar] [CrossRef]
  10. Durbin, A.G.; Durbin, E.G. Effects of menhaden predation on plankton populations in Narragansett Bay, Rhode Island. Estuaries 1998, 21, 449–465. [Google Scholar] [CrossRef]
  11. Luo, J.; Hartman, K.J.; Brandt, S.B.; Cerco, F.C.; Rippetoe, T.H. A spatially-explicit approach for estimating carrying capacity: An application for the Atlantic menhaden (Brevoortia tyrannus) in Chesapeake Bay. Estuaries 2001, 24, 545–556. [Google Scholar] [CrossRef]
  12. Christensen, V.; Pauly, D. ECOPATH II—A software for balancing steady-state ecosystem models and calculating network characteristics. Ecol. Model. 1992, 61, 169–185. [Google Scholar] [CrossRef]
  13. Ulanowicz, R.E. Quantitative methods for ecological network analysis. Comput. Biol. Chem. 2004, 28, 321–339. [Google Scholar] [CrossRef]
  14. Dame, J.K.; Christian, R.R. Uncertainty and the use of network analysis for ecosystem-based fishery management. Fisheries 2006, 31, 331–341. [Google Scholar] [CrossRef]
  15. Pauly, D.; Christensen, V.; Walters, C. Ecopath, Ecosim, and Ecospace as tools for evaluating ecosystem impact of fisheries. ICES J. Mar. Sci. 2000, 57, 697–706. [Google Scholar] [CrossRef]
  16. Stevens, J.D.; Bonfil, R.; Dulvy, N.K.; Walker, P.A. The effects of fishing on sharks, rays, and chimaeras (chondrichthyans), and the implications for marine ecosystems. ICES J. Mar. Sci. 2000, 57, 476–494. [Google Scholar] [CrossRef]
  17. Kitchell, J.F.; Essington, T.E.; Boggs, C.H.; Schindler, D.E.; Walters, C.J. The role of sharks and longline fisheries in a pelagic ecosystem of the Central Pacific. Ecosystems 2002, 5, 202–216. [Google Scholar] [CrossRef]
  18. Frid, C.; Paramor, O.; Scott, C. Ecosystem-based fisheries management: Progress in the NE Atlantic. Mar. Policy 2005, 29, 461–469. [Google Scholar] [CrossRef]
  19. Lin, H.J.; Shao, K.T.; Hwang, J.S.; Lo, W.T.; Cheng, I.J.; Lee, L.H. A trophic model for Kuosheng Bay in northern Taiwan. J. Mar. Sci. Technol. 2004, 12, 424–432. [Google Scholar] [CrossRef]
  20. Lin, H.J.; Shao, K.T.; Jan, R.Q.; Chen, C.P.; Hsieh, H.L.; Hsieh, L.Y.; Hsiao, Y.T. A trophic model for the Danshuei River estuary, a hypoxic estuary in northern Taiwan. Mar. Pollut. Bull. 2007, 54, 1789–1800. [Google Scholar] [CrossRef]
  21. Liu, P.J.; Shao, K.T.; Jan, R.Q.; Fan, T.Y.; Wong, S.L.; Hwang, J.S.; Chen, J.P.; Chen, C.C.; Lin, H.J. A trophic model of fringing coral reefs in Nanwan Bay, southern Taiwan suggests overfishing. Mar. Environ. Res. 2009, 68, 106–117. [Google Scholar] [CrossRef] [PubMed]
  22. Walters, C.; Christensen, V.; Pauly, D. Structuring dynamic models of exploited ecosystems from trophic mass-balance assessments. Rev. Fish Biol. Fish. 1997, 7, 139–172. [Google Scholar] [CrossRef]
  23. Wang, S.B.; Ou, J.C.; Chang, J.J.; Liu, K.M. Characteristics of the trash fish generated by bottom trawling in surrounding waters of Guei-Shan Island, northeastern Taiwan. J. Fish. Soc. Taiwan 2007, 34, 379–395. [Google Scholar] [CrossRef]
  24. Christensen, V.; Walters, C.J.; Pauly, D. Ecopath with Ecosim: A Users’ Guide; Fisheries Centre, University of British Columbia: Vancouver, BC, Canada, 2005; 154p. [Google Scholar]
  25. Christensen, V.; Walters, C.J. Ecopath with Ecosim: Methods, capabilities and limitations. Ecol. Model. 2004, 172, 109–139. [Google Scholar] [CrossRef]
  26. Pauly, D.; Christensen, V.; Dalsgaard, J.; Froese, R.; Torres, F., Jr. Fishing down marine food webs. Science 1998, 279, 860–863. [Google Scholar] [CrossRef] [PubMed]
  27. Odum, W.; Heald, E. The Detritus-Based Food Web of an Estuarine Mangrove Community, 1st ed.; Academic Press: New York, NY, USA, 1975; 265p. [Google Scholar]
  28. Pauly, D.; Soriano-Bartz, M.L.; Palomares, M.L.D. Improved construction, parametrization and interpretation of steady-state ecosystem models. In Trophic Models of Aquatic Ecosystems; Christensen, V., Pauly, D., Eds.; International Union for Conservation of Nature: Gland, Switzerland, 1993; Volume 26, pp. 1–13. [Google Scholar]
  29. Ulanowicz, R.; Puccia, C. Mixed trophic impacts in ecosystems. Coenoses 1990, 5, 7–16. [Google Scholar]
  30. Power, M.E.; Tilman, D.; Estes, J.A.; Menge, B.A.; Bond, W.J.; Mills, L.S.; Daily, G.; Castilla, J.C.; Lubchenco, J.; Paine, R.T. Challenges in the quest for keystones: Identifying keystone species is difficult—But essential to understanding how loss of species will affect ecosystems. BioScience 1996, 46, 609–620. [Google Scholar] [CrossRef]
  31. Libralato, S.; Christensen, V.; Pauly, D. A method for identifying keystone species in food web models. Ecol. Model. 2006, 195, 153–171. [Google Scholar] [CrossRef]
  32. Shao, K.T. The Fish Database of Taiwan. 2023. Available online: https://fishdb.sinica.edu.tw/ (accessed on 15 August 2023).
  33. Yeh, C.C. Fauna, Distribution and Habitat Features of Cetaceans in Coastal Waters of Southeastern Taiwan. Master Thesis, National Taiwan University, Taiwan, 2001; 100p. [Google Scholar]
  34. Benoit-Bird, K.J. Prey caloric value and predator energy needs: Foraging predictions for wild spinner dolphins. Mar. Biol. 2004, 145, 435–444. [Google Scholar] [CrossRef]
  35. Chou, L.S.; Bright, A.M.; Yeh, S.Y. Stomach contents of dolphins (Delphinus delphis and Lissodelphis borealis) from north Pacific Ocean. Zool. Stud. 1995, 34, 206–210. [Google Scholar]
  36. Pauly, D.; Trites, A.W.; Capuli, E.; Christensen, V. Diet composition and trophic levels of marine mammals. ICES J. Mar. Sci. 1998, 55, 467–481. [Google Scholar] [CrossRef]
  37. Blanco, C.; Salomón, O.; Raga, J.A. Diet of the bottlenose dolphin (Tursiops truncatus) in the western Mediterranean Sea. J. Mar. Biol. Assoc. UK 2001, 81, 1053–1058. [Google Scholar] [CrossRef]
  38. Chen, K.Y. Population Fluctuation of the Spotted Mackerel (Scomber australasicus) in the Northeastern Waters off Taiwan. Master Thesis, National Taiwan Ocean University, Taiwan, 2005; 54p. [Google Scholar]
  39. Anon. Wildlife Conservation Act; Ministry of Agriculture: Taiwan, China, 1993. [Google Scholar]
  40. Paine, R.T. Food webs: Road maps of interactions or grist for theoretical development? Ecology 1988, 69, 1648–1654. [Google Scholar] [CrossRef]
  41. Whipple, S.J.; Link, J.S.; Garrison, L.P.; Fogarty, M.J. Models of predation and fishing mortality in aquatic ecosystems. Fish Fish. 2000, 1, 22–40. [Google Scholar] [CrossRef]
  42. Baird, D.; Luczkovich, J.; Christian, R.R. Assessment of spatial and temporal variability in ecosystem attributes of the St Marks National Wildlife Refuge, Apalachee Bay, Florida. Estuar. Coast. Shelf Sci. 1998, 117, 329–349. [Google Scholar] [CrossRef]
  43. Christian, R.R.; Luczkovich, J.J. Organizing and understanding a winter’s seagrass foodweb network through effective trophic levels. Ecol. Model. 1999, 117, 99–124. [Google Scholar] [CrossRef]
  44. Pinnega, J.K.; Blanchard, J.L.; Mackinson, S.; Scott, R.D.; Duplisea, D.E. Aggregation and removal of weak-links in food-web models: System stability and recovery from disturbance. Ecol. Model. 2005, 184, 229–248. [Google Scholar] [CrossRef]
  45. Coll, M.; Palomera, I.; Tudela, S.; Sardà, F. Trophic flows, ecosystem structure and fishing impacts in the South Catalan Sea, Northwestern Mediterranean. J. Mar. Syst. 2003, 59, 63–96. [Google Scholar] [CrossRef]
Figure 1. Study area of Guishan Island waters, northeastern Taiwan.
Jmse 11 02368 g001
Figure 2. The flow diagram of the food web derived from the marine ecosystem model of the Guishan Island, northeastern Taiwan.
Jmse 11 02368 g002
Figure 3. The trophic and fishery impacts on species/functional group derived from the marine ecosystem model of the Guishan Island. Larger size of circles indicates larger impact.
Jmse 11 02368 g003
Figure 4. The 30-year trend of relative biomass of species/functional group in the marine ecosystem of the Guishan Island derived from simulations of 30% deduction in fishing effort.
Jmse 11 02368 g004
Figure 5. The changes in relative biomass of species/functional groups in the marine ecosystem of the Guishan Island derived from simulations of 30% deduction in fishing effort.
Jmse 11 02368 g005
Table 1. The input parameters and output of 28 species/functional groups from Ecopath for the Guishan Island marine ecosystem modeling.
Species/Functional GroupTPBiomassProductionConsumptionEE
Cetaceans4.590.000.3218.370.03
Small skate and ray3.730.030.502.500.67
Small shark3.750.040.452.250.58
Dolphinfish4.000.011.688.480.85
Scombrids3.740.013.3732.570.99
Shrimps2.283.9410.0040.000.99
Lobster and crab3.530.131.096.540.70
Oil fish/escolar3.980.002.0010.000.90
Mackerels3.970.010.804.000.90
Carangids3.780.021.797.140.95
Pomfret3.660.060.572.850.95
Sciaenids3.630.021.507.500.95
Cephalopod3.270.112.5025.000.99
Flatfishes3.400.002.5010.000.95
Sparids3.350.060.804.000.95
Clupeids2.945.112.0010.000.99
Congers4.050.021.005.000.85
Hairtail4.040.012.5012.000.95
Blackbelly triggerfish3.470.022.5012.000.95
Anchovy3.063.463.0015.000.99
Other pelagic fish3.374.492.5012.000.95
Other demersal fish3.130.542.0010.000.95
Demersal benthivores2.472.642.0010.000.95
Shellfish2.062.523.0015.000.95
Zooplankton2.104.5550.00200.000.95
Photoplankton1.004.74400.000.000.50
Seaweed1.000.84100.000.000.50
Detritus1.005.00 0.02
Table 2. Estimated species/functional group specific total mortality, fishing mortality, predatory mortality, other mortality, and exploitation rate in the Guishan Island marine ecosystem.
Species/Functional GroupMortalityFishing MortalityPredation MortalityOther MortalityExploitation Rate
Cetaceans0.3200.0100.0000.3100.031
Small skate and ray0.5000.3080.0270.1650.617
Small shark0.4500.2610.0000.1890.580
Dolphinfish1.6810.4111.0180.2520.245
Scombrids3.3701.3471.9890.0340.400
Shrimps10.0001.0028.8980.1000.100
Lobster and crab1.0900.1720.5910.3270.158
Oil fish/escolar2.0000.5351.2650.2000.267
Mackerels0.8000.4580.2620.0800.573
Carangids1.7900.9220.7790.0900.515
Pomfret0.5700.3330.2080.0290.585
Sciaenids1.5000.7960.6290.0750.531
Cephalopod2.5001.0761.3990.0250.430
Flatfishes2.5001.4330.9420.1250.573
Sparids0.8000.3880.3720.0400.485
Clupeids2.0000.7671.2130.0200.384
Congers1.0000.3040.5460.1500.304
Hairtail2.5001.6400.7350.1250.656
Blackbelly triggerfish2.5000.7221.6530.1250.289
Anchovy3.0000.8862.0840.0300.295
Other pelagic fish2.5000.7321.6430.1250.293
Other demersal fish2.0001.0730.8270.1000.537
Demersal benthivores2.0000.1891.7110.1000.095
Shellfish3.0000.7032.1470.1500.234
Table 3. Estimated inter-species/functional group predatory mortality in the Guishan Island marine ecosystem.
Impacting/Impacted12345678910111213
1Small skate and ray 0.03
2Dolphinfish1.02
3Scombrids1.03 0.52
4Shrimps 0.010.0100.010.92 000.010.07
5Lobster and crab 0.130.14 0.130.01
6Oil fish/escolar1.27
7Mackerels0.26
8Carangids0.04 0.11 00.030.08
9Pomfret0.01 0.03 00.010.02
10Sciaenids0.03 0.09 00.030.06
11Cephalopod0.160.070.080.170.37 0.010.10.10.010.01
12Flatfishes 0.04
13Sparids0.01 0.03 00.010.02 0.26
14Clupeids0 00 000 0.01
15Congers 0.55
16Hairtail0.29 0.29 00.05
17Blackbelly triggerfish0.15 0.23 0.030.25
18Anchovy0 00.01 000 00.02
19Other pelagic fish0 0.010.01 000 00.04
20Other demersal fish 0.010.020 0.38 00.060.05
21Demersal benthivores 0.010.010 0.16 00.030.020.11
22Shellfish 00 0.08 00.010.01
23Zooplankton 00.017.96 000 00.44
24Photoplankton 19.08 0
25Seaweed 32.21
Impacting/Impacted141516171819202122232425
1Small skate and ray
2Dolphinfish
3Scombrids 0.44
4Shrimps00.011.69000.012.961.560.170.990.48
5Lobster and crab0.010.17 0.01
6Oil fish/escolar
7Mackerels
8Carangids 0.070.45
9Pomfret 0.020.12
10Sciaenids 0.060.36
11Cephalopod 0.120.19
12Flatfishes0.1 0.8
13Sparids 0.020.02
14Clupeids 0 1.2
15Congers
16Hairtail 0.1
17Blackbelly triggerfish
18Anchovy 0.19000.01 1.770.08
19Other pelagic fish 0.15000.01 1.360.06
20Other demersal fish00 0.070.010.01 0.2
21Demersal benthivores00.02 000.01 0.620.74
22Shellfish00.04 000.03 0.431.54
23Zooplankton 0.017.31 00.018.045.390.060.09 18.18
24Photoplankton 2.1 0.780.52 3.19174
25Seaweed 2.910.970.4613.45
Table 4. The keystone index and relative total impact of the species/functional group in the Guishan Island marine ecosystem.
Species/Functional GroupKeystone IndexKeystone Index #2Relative Total Impact
Cetaceans−0.04643.9821.000
Small skate and ray−0.8112.2020.172
Small shark−0.7372.2040.204
Dolphinfish−0.5152.9190.340
Scombrids−0.7512.9790.197
Shrimps−0.2520.7310.706
Lobster and crab−0.5231.8990.335
Oil fish/escolar−1.6623.1560.0242
Mackerels−0.9572.4790.123
Carangids−0.2173.1250.675
Pomfret−0.7831.9870.184
Sciaenids−0.4902.7600.361
Cephalopod−0.4082.0590.436
Flatfishes−1.8212.5780.0168
Sparids−0.6422.1400.254
Clupeids−0.2920.5950.671
Congers−0.4882.7110.362
Hairtail−0.3393.1440.510
Blackbelly triggerfish−0.9712.2350.119
Anchovy−0.2430.7890.709
Other pelagic fish−0.2630.6710.702
Other demersal fish−0.4571.3390.395
Demersal benthivores−0.2610.8760.663
Shellfish−0.4130.7430.465
Zooplankton−0.2470.6820.729
Photoplankton−0.1950.7200.828
Seaweed−0.5331.0760.335
Table 5. The species/functional group specific primary productivity and trophic position (TP) required to support the sustainability of Guishan Island marine ecosystem.
Species/Functional GroupNo. of PathsTPPPRPPR/CatchPPR/TotPP (%)
Cetaceans29,5204.590.3310,604.190.01
Small skate and ray2023.732.73273.230.08
Small shark4043.752.93293.280.09
Dolphinfish74514.001.53302.230.05
Scombrids1143.742.27271.760.07
Shrimps32.2825.656.510.79
Lobster and crab683.532.78127.260.09
Oil fish/escolar74123.980.06236.000.00
Mackerels72723.971.31233.370.04
Carangids31763.783.08219.760.09
Pomfret2023.663.52185.800.11
Sciaenids3693.632.52168.170.08
Cephalopod633.279.5377.510.29
Flatfishes1403.400.1791.730.01
Sparids1403.352.79130.150.09
Clupeids212.9481.2720.712.51
Congers40704.051.63254.050.05
Hairtail31764.045.71317.350.18
Blackbelly triggerfish983.470.8455.750.03
Anchovy53.0665.0121.212.00
Other pelagic fish213.37113.5234.563.50
Other demersal fish503.1327.8847.900.86
Demersal benthivores122.476.5813.150.20
Shellfish62.0611.316.390.35
PPR: primary production, PPR/catch: primary production required per catch (kg), PPR/TotPP (%): primary production required per gross primary production (%).
Table 6. Pedigree of biomass (B), production (P/B), predation (Q/B), consumption, and catch of Guishan Island marine ecosystem derived from Ecopath. The larger value indicates lower uncertainty.
Group/Functional GroupBiomassProductionPredationConsumptionCatch
1Cetacean46764
2Small skate and ray13454
3Small shark13454
4Dolphin fish17466
5Scombrids13444
6Shrimps13334
7Lobster and crab13334
8Oil fish/escolar13434
9Mackerels13434
10Carangids13434
11Pomfret13434
12Sciaenids13434
13Cephalopod13434
14Flatfishes13434
15Sparids13434
16Clupeids13434
17Congers13434
18Hairtail13434
19Blackbelly triggerfish13434
20Anchovy13434
21Other pelagic fish13434
22Other demersal fish13434
23Demersal benthivores13434
24Shellfish33334
25Zooplankton1323
26Photoplankton13
27Seaweed13
28Detritus1
Disclaimer/Publisher’s Note: The statements, opinions and data contained in all publications are solely those of the individual author(s) and contributor(s) and not of MDPI and/or the editor(s). MDPI and/or the editor(s) disclaim responsibility for any injury to people or property resulting from any ideas, methods, instructions or products referred to in the content.

