Article

Evaluating the Detection of Oceanic Mesoscale Eddies in an Operational Eddy-Resolving Global Forecasting System

1
National Marine Environmental Forecasting Center (NMEFC), Beijing 100081, China
2
Key Laboratory of Marine Hazards Forecasting, National Marine Environmental Forecasting Center (NMEFC), Beijing 100081, China
3
Ministry of Education Key Laboratory for Earth System Modeling, Tsinghua University, Beijing 100084, China
4
Ministry of Natural Resources, Beijing 100812, China
*
Authors to whom correspondence should be addressed.
J. Mar. Sci. Eng. 2023, 11(12), 2343; https://doi.org/10.3390/jmse11122343
Submission received: 2 October 2023 / Revised: 15 November 2023 / Accepted: 4 December 2023 / Published: 12 December 2023
(This article belongs to the Special Issue Advance in Circulation and Internal Wave Dynamics)

Abstract

:
In this study, a global analysis and forecasting system at 1/12° is built for operational oceanography at the National Marine Environmental Forecasting Center (NMEFC) by using the NEMO ocean model (NMEFC-NEMO). First, statistical analysis methods are designed to evaluate the performance of sea level anomaly (SLA) forecasting. The results indicate that the NMEFC-NEMO performs well in SLA forecasting when compared with the Mercator-PSY4, Mercator-PSY3, UK-FOAM, CONCEPTS-GIOPS and Bluelink-OceanMAPS forecasting systems. The respective root-mean-squared errors (RMSEs) of NMEFC-NEMO (Mercator PSY4) are 0.0654 m (0.0663 m) and 0.0797 m (0.0767 m) for the lead times of 1 and 7 days. The anomaly correlation coefficients between forecasting and observations exceed 0.8 for the NMEFC-NEMO and Mercator-PSY4 systems, suggesting that the accuracy of SLA predicted using NMEFC-NEMO is comparable to Mercator PSY4 and superior to other forecasting systems. Moreover, the global spatial distribution of oceanic eddies are effectively represented in NMEFC-NEMO when compared to that in the HYCOM reanalysis, and the detection rate reaches more than 90% relative to HYCOM reanalysis. Regarding the strong eddies in the Kuroshio region, the NMEFC-NEMO reproduces the characteristic for anticyclonic and cyclonic eddies merging and splitting alternatively. As for the detective eddies in the Gulf Stream, NMEFC-NEMO effectively represents the spatial distribution of mesoscale eddies from different seasons. The amplitude of oceanic eddies, including both cyclones and anticyclones, were much stronger on 1 July 2019 than 1 January 2019. Overall, NMEFC-NEMO has a superior performance in SLA forecasting and effectively represents the oceanic mesoscale eddies for operational oceanography.

1. Introduction

Mesoscale eddies, which typically have a spatial scale of 10–100 km and a temporal scale of several days to several months, are mainly characterized by rotating water loops in the ocean [1,2,3]. Mesoscale eddies, like cyclones and anticyclones in weather systems, carry considerable kinetic energy, and are important dynamical processes in physical oceanography [4]. Mesoscale eddies not only affect the horizontal and vertical distribution of sea temperature, salinity and current [5,6,7], but also play a significant role in the kinetic energy transport and dissipation [8,9,10,11]. The sea water properties, including temperature, salinity and mass fields, can be modified by the moving eddies [12]. These changes in the thermophysical properties of seawater can disrupt the sound speed and further affect the underwater acoustic transmission. Consequently, eddy movements also have a significant influence on the diving and floating of the navy’s submarines [13,14,15].
Mesoscale eddies are active in global oceans, and thus many studies have been performed on the spatial–temporal characteristics of mesoscale eddies by using observational data, or of numerical simulation results by using different criteria for eddy identification [16,17,18,19]. Over the past two decades, there have been much research and discussion on automatic eddy detection and identification algorithms, along with their geometrical characteristics. Based on physical parameter approximation and flow variability characteristics, some scholars have divided the automated eddy identification algorithms into three categories: (1) the physical parameter method, such as the Okubo–Weiss method [20] and wavelet method [21]; (2) the closed sea level anomaly (SLA) criterion method [22]; and (3) the vector geometry criterion method [23]. Liu [24] and Chelton [1] have suggested that the closed SLA criterion method performs better than the other two eddy detection methods.
From 2009 to 2019, in the coordination and promotion of GODAE OceanView (GOV) [25,26], global operational ocean forecasting systems developed significantly around the world, with a focus on spatial resolution and data assimilation methods. In 2019, GOV was renamed OceanPredict to emphasize the science and development network for ocean prediction within an overall operational oceanography context. Over the past few years, the National Marine Environmental Forecasting Center (NMEFC) also made great efforts to develop a sophisticated system. During China’s 12th Five-Year Plan Period, a global operational oceanography forecasting system at the 1/4° eddy-permitting resolution was built at the NMEFC by using MOM4, abbreviated as NMEFC-MOM4. To achieve the global forecasting ability of ocean mesoscale phenomena such as eddies, NMEFC then developed the new generation global forecasting system at 1/12°, the eddy-resolving resolution, based on the NEMO ocean model and LIM3 sea ice model (hereinafter referred to as NMEFC-NEMO). The detection of mesoscale eddies from the forecasting system can provide technical service support for disaster management practices [27], naval operations [28], ship routing [29] and marine fisheries [30].
The ability to capture the spatial–temporal variability of oceanographic characteristics of mesoscale eddies using the forecasting systems at 1/12° is always vastly superior to that of the 1/4° eddy-permitting forecasting systems [31]. Some studies have shown that the NMEFC-NEMO effectively represents the ocean state against observations [32,33]. However, the performance of oceanic eddy detection in the eddy-resolving system, NMEFC-NEMO, remains unknown; thus, in the present study, we focus on assessing NMEFC-NEMO’s oceanic eddy detection ability.
The remainder of this paper is organized as follows. In Section 2, we briefly describe the datasets employed here, and the detection methods based on the closed SLA criterion. Section 3 first presents the scientific assessment of the NMEFC-NEMO forecasting products against SLA observations, followed by the results of NMEFC-NEMO’s performance evaluation in oceanic eddy detection. Finally, Section 4 provides the summary and conclusions.

2. Data and Methods

2.1. Observation and Reanalysis Data

GOV focuses on different scientific problems by setting up different task teams. The Intercomparison and Validation Task Team (IV-TT) was established in 2010 to coordinate and promote scientific validation and intercomparison activities among operational centers. Its activities include the sharing of common approaches and observed data for the evaluation of operational oceanographic systems under a unified framework. More details on the Class-4 Intercomparison project and IV-TT can be found in the previous studies [34,35]. The observed sea level anomalies used for SLA validation in the present study is collected and quality-revised by the UK Met Office, an IV-TT member. The data, consisting of the Jason-1, Jason-2, Cryosat and AltiKa, are originally from the Collected Localization Satellites (CLSs), Archiving, Validation and Interpretation of Satellite Oceanographic data (AVISO) level 3 daily along-track satellite altimeters, with about 60,000–80,000 points number per day.
The HYCOM 1/12° reanalysis data, used to compare with NMEFC-NEMO’s detected mesoscale eddies, were obtained from https://data.hycom.org/datasets (accessed on 16 January 2021).

2.2. Forecasting Products

NMEFC-NEMO uses the global tri-polar grids, which can remove the spherical coordinate singularity of the geographical North Pole. The global resolution is 1/12° in the horizontal direction, and there are 75 vertical layers with a 1 m resolution in the upper surface and a resolution of about 100–450 m in the deep ocean. By using the assimilation scheme of LESTKF (Local Error Subspace Transform Kalman Filter [36,37,38]), these observational datasets, including the satellite remote sensing of sea surface temperature, sea surface altimeter from AVISO and temperature–salinity profile information from Argo floats, are assimilated into the ocean model to provide an initial condition for the NMEFC-NEMO forecasting system. NMEFC-NEMO operationally runs daily with the NCEP Global Forecasting System (GFS) atmospheric forcing. The forecasting products, including sea temperature, salinity, sea surface height and ocean mixed layer, are provided daily and posted on the NMEFC home page.
Other forecasting products for intercomparison include Mercator-PSY3, Mercator-PSY4, Bluelink-OceanMAPS, UK-FOAM and CONCEPTS-GIOPS. Under the framework of GOV IV-TT, all the abovementioned forecasting fields are sourced from the USGODAE server (http://199.9.2.160/pub/outgoing/GODAE_class4/, accessed on 30 April 2020). Mercator-PSY3 (1/4°, eddy permitting) and Mercator-PSY4 (1/12°, eddy resolving), created by Mercator Océan (Toulouse, France), comprise the state-of-the-art ocean model NEMO [39] and LIM2 [40,41,42]. Next, the Bluelink global Ocean Model Analysis and Prediction System (Bluelink-OceanMAPS [43,44], Shizuoka, Japan), developed by the Australian Bureau of Meteorology (ABM), was constructed with the MOM4 [45] numerical model at 1° global resolution, and increasing smoothly to 1/10° in the region around Australia. The UK Met Office developed the Forecast Ocean Assimilation Model (UK-FOAM [46,47]). The Global Ice Ocean Prediction System (GIOPS), part of the Canadian Operational Network of Coupled Environmental Prediction Systems (CONCEPTS), was implemented at the Canadian Meteorological Center (CMC). Both FOAM and GIOPS were configured with the NEMO and CICE models at a 1/4° eddy-permitting resolution. Table 1 shows the details of the basic information of the forecasting systems.
The period of all the datasets used in this study is from 1 January 2019 to 31 December 2019.

2.3. SLA Evaluation Method

To quantitatively evaluate the SLA performance of NMEFC-NEMO, we first use the statistics to better present the SLA’s accuracy against the observations with the root-mean-squared error (RMSE) and anomaly correlation (AC). The formulas for these are as follows:
RMSE = 1 N i = 1 N ( M i ( x , y ) O i ( x , y ) ) 2
AC = i = 1 N ( M ( x , y ) M ( x , y ) ) ( O ( x , y ) O ( x , y ) ) i = 1 N ( M ( x , y ) M ( x , y ) ) 2 i = 1 N ( O ( x , y ) O ( x , y ) ) 2
where x , y are the longitude and latitude dimensions, respectively; M ( x , y ) and O ( x , y ) are the, respectively, numerical simulation or forecasting and observations at ( x , y ) ; N represents the total number of elements along the two dimensions; and M ( x , y ) and O ( x , y ) denote the mean value for N elements along the two dimensions.

2.4. Mesoscale Eddy Detection Algorithm

For the mesoscale eddy detection, the closed SLA criterion suggested by Liu [24] and Chelton [1] is adopted here since it performs better than other methods. If a grid point has an SLA value greater than (less than) its four nearest neighbor points, then it is considered as the local maximum (minimum). We search the closed contours of the SLA for anticyclonic (cyclonic) eddies from the local maximum (minimum). The SLA search interval is set to 1 cm, which is configured well to resolve eddies [1]. Four constraints are included in this algorithm:
(1)
The associated regions include at least 8 to 1000 grid points.
(2)
The height difference (in meters) between the eddy center and its outermost closed contour line should be between 1 and 150 cm.
(3)
The cyclones (anticyclones) contain at least one local minimum (maximum) value.
(4)
The distance of any pair of points within the connected region must be less than the 800 km.
The value of the averaged outermost closed SLA contour line of a cyclone (anticyclone) is marked as the h 0 , the minimum average for a cyclone is marked as the h min , and the maximum average for a anticyclone is marked as the h max . The amplitude of a cyclone (anticyclone) is defined as the absolute difference between h 0 and h min ( h max ).

3. Results

The performance of the predicted SLA in the forecasting system will likely affect the eddy detection result. Since our study mainly focuses on forecasting results, and the method used here is based on the closed SLA criterion, in this section, we will firstly evaluate the SLA predictability of NMEFC-NEMO with IV-TT Class-4 metrics; then, we present the results of detection mesoscale eddies of NMEFC-NEMO.

3.1. NMEFC-NEMO SLA Evaluation

We evaluate the NMEFC-NEMO SLA forecasting products by comparing with the observation referred in Section 2.1. The sea level anomaly (SLA) for each forecasting system is provided in the separate Class-4 netCDF file. Figure 1 demonstrates the SLA forecasting accuracy from each operational institution by comparing it with the along-track altimeters in the sense of RMSE. Figure 1a shows the RMSE SLA as a function of forecasting leading days, where the dotted circle is the mean value of RMSE, the vertical line is the 95% value and the rectangular box is the interquartile range. Figure 1b presents the time series of RMSE for 1-day forecasting from 1 January 2019 to 31 December 2019.
For all forecasting products used in this study, it is clear that the RMSE of SLA increases with the forecasting lead time (Figure 1a), which may be because the errors will accumulate as the forecasting lead time increases. In addition, the RMSE results of Mercator PSY4 are 0.0663 m and 0.0767 m for the lead times of 1 and 7 days, respectively. As for NMEFC-NEMO, the RMSEs are 0.0654 m and 0.0797 m for the lead times of 1 and 7 days, respectively (Table 2), which shows that the SLA forecasting accuracy of NMEFC-NEMO is comparable to the Mercator-PSY4. For the 1–7-day forecasting lead times of RMSEs of UK-FOAM, Bluelink-OceanMAPS, CONCEPTS-GIOPS and Mercator-PSY3, the results are slightly higher than NMEFC-NEMO and Mercator-PSY4. From the time series of the RMSE for 1-day forecasting, presented in Figure 1b, the RMSE variability of NMEFC-NEMO during the 1-year period in 2019 is similar to that of Mercator-PSY4, and slightly less than those of the other forecasting systems.
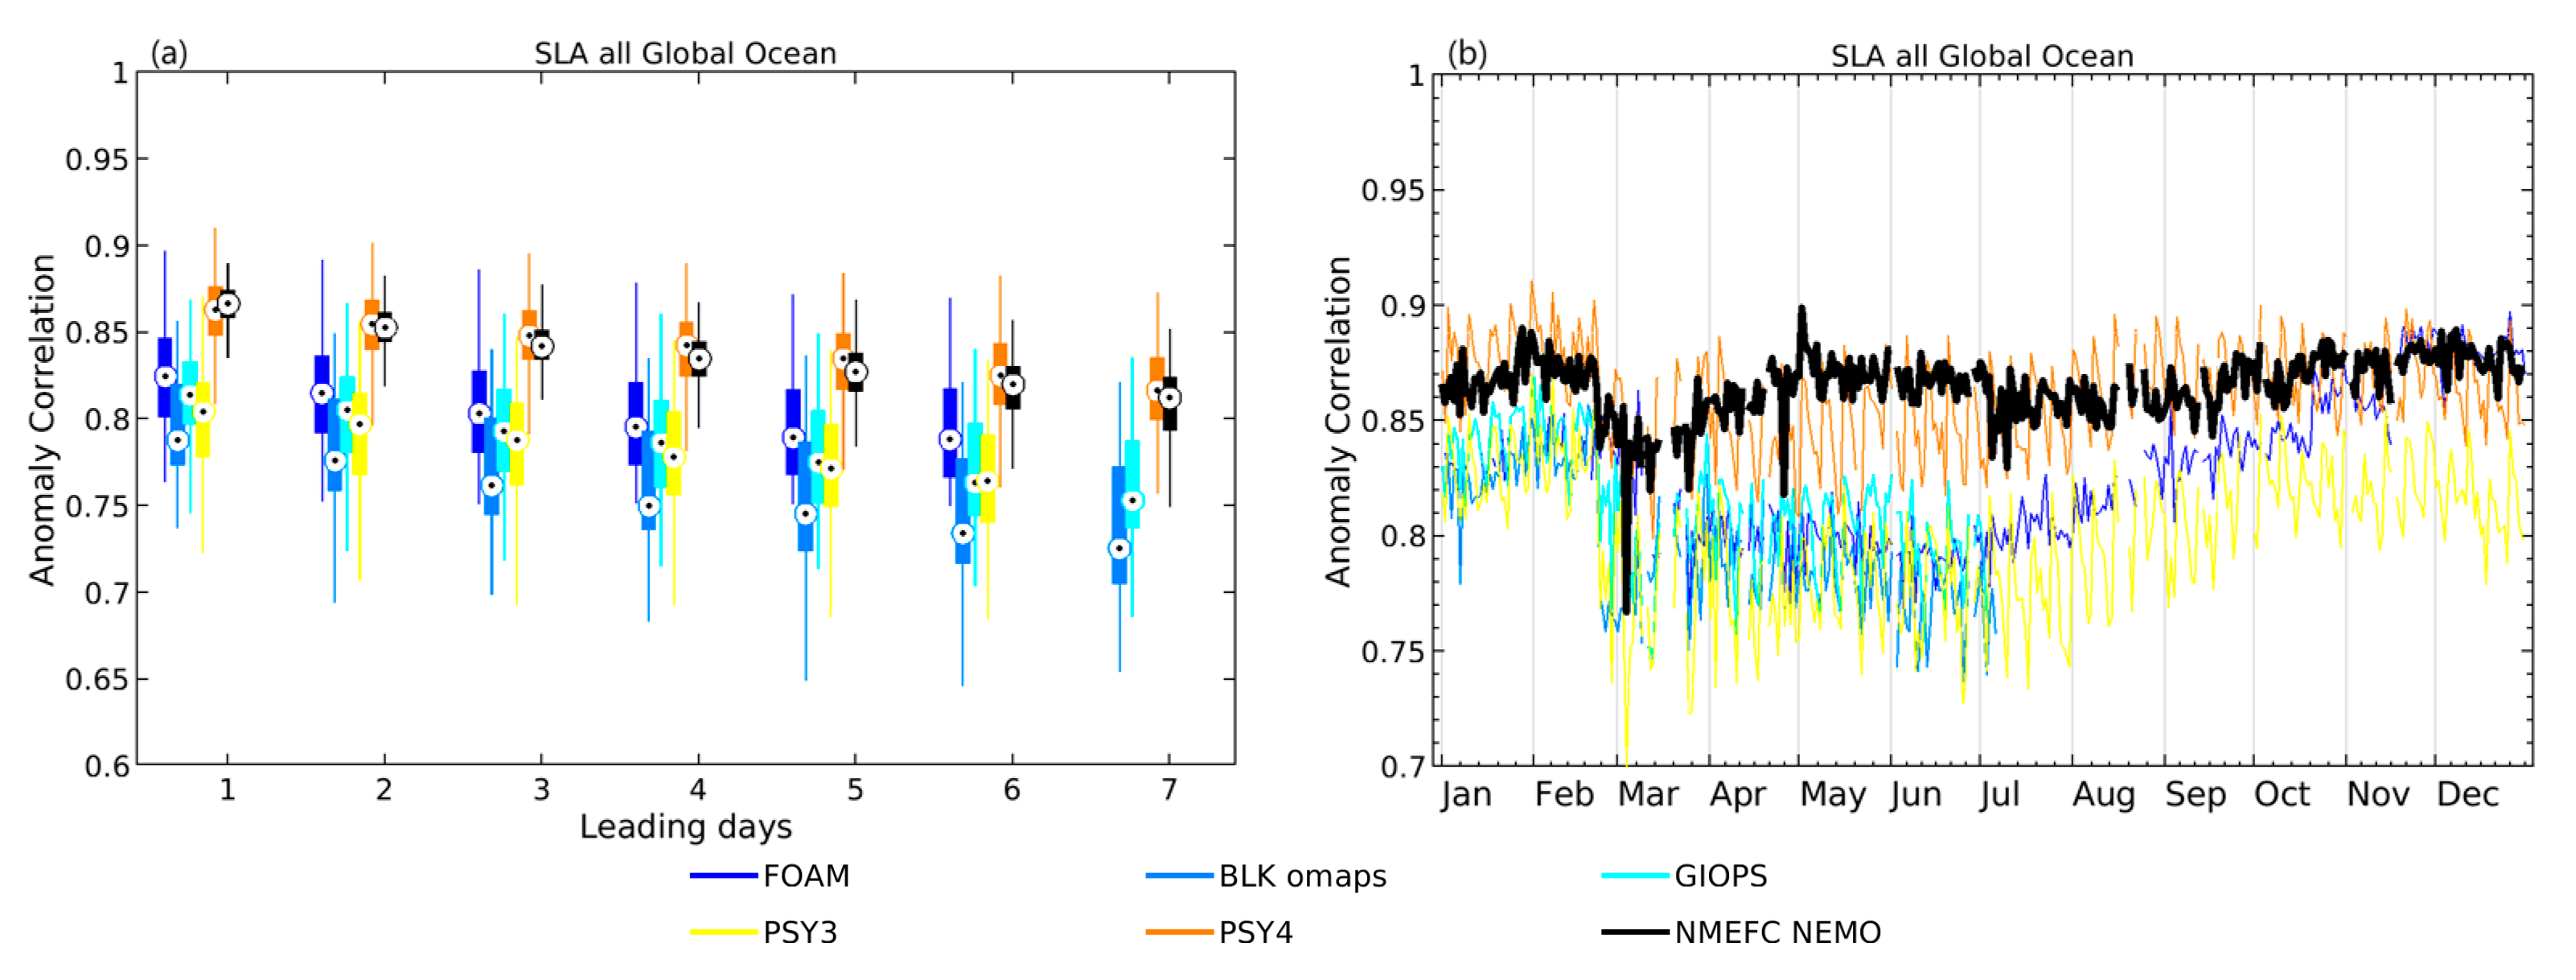
The anomaly correlation between SLA forecasting products and the along-track altimeters, which is also an effective evaluation metric to verify the forecasting performance, is presented in Figure 2. The closer the value of correlation coefficient is to 1, the better the forecasting performance will be. Figure 2a shows the SLA RMSE as a function of forecasting lead time. Figure 2b is the time series of SLA RMSE for 1-day forecasting in 2019. From Figure 2a, we can see that as the forecasting lead time increases, the correlation coefficients are gradually decreased due to the associated accumulated error (Figure 1a). The value of correlation coefficients ranging 0.8–1.0 indicates a higher degree of correlation. In terms of AC, the results all exceed 0.8 for the NMEFC-NEMO and Mercator-PSY4 systems with the lead times of 1–7 days. The coefficients obtained from UK-FOAM and CONCEPTS-GIOPS are close and slightly higher than 0.8 with the lead times of 1–3 days, then decrease to below 0.8 in the following forecast lead time. The Bluelink-OceanMAPS and Mercator-PSY3, which have Acs in the range of 0.7–0.8, show a lower degree of correlation. Consequently, from the above Figure 1 and Figure 2 and Table 1, the NMEFC-NEMO has higher accuracy in SLA forecasting.
NMEFC-NEMO has a model configuration similar to that of PSY4: both of them are based on the state-of-the-art ocean model NEMO and sea ice model LIM (albeit different version), and they have the same horizontal resolution in 1/12°. For SLA assimilation, the satellite altimeter data are absorbed in their unique data assimilation system. This is likely the reason that NMEFC-NEMO and PSY4 have a similar performance in SLA prediction.

3.2. Evaluation of the Detection of Mesoscale Eddies

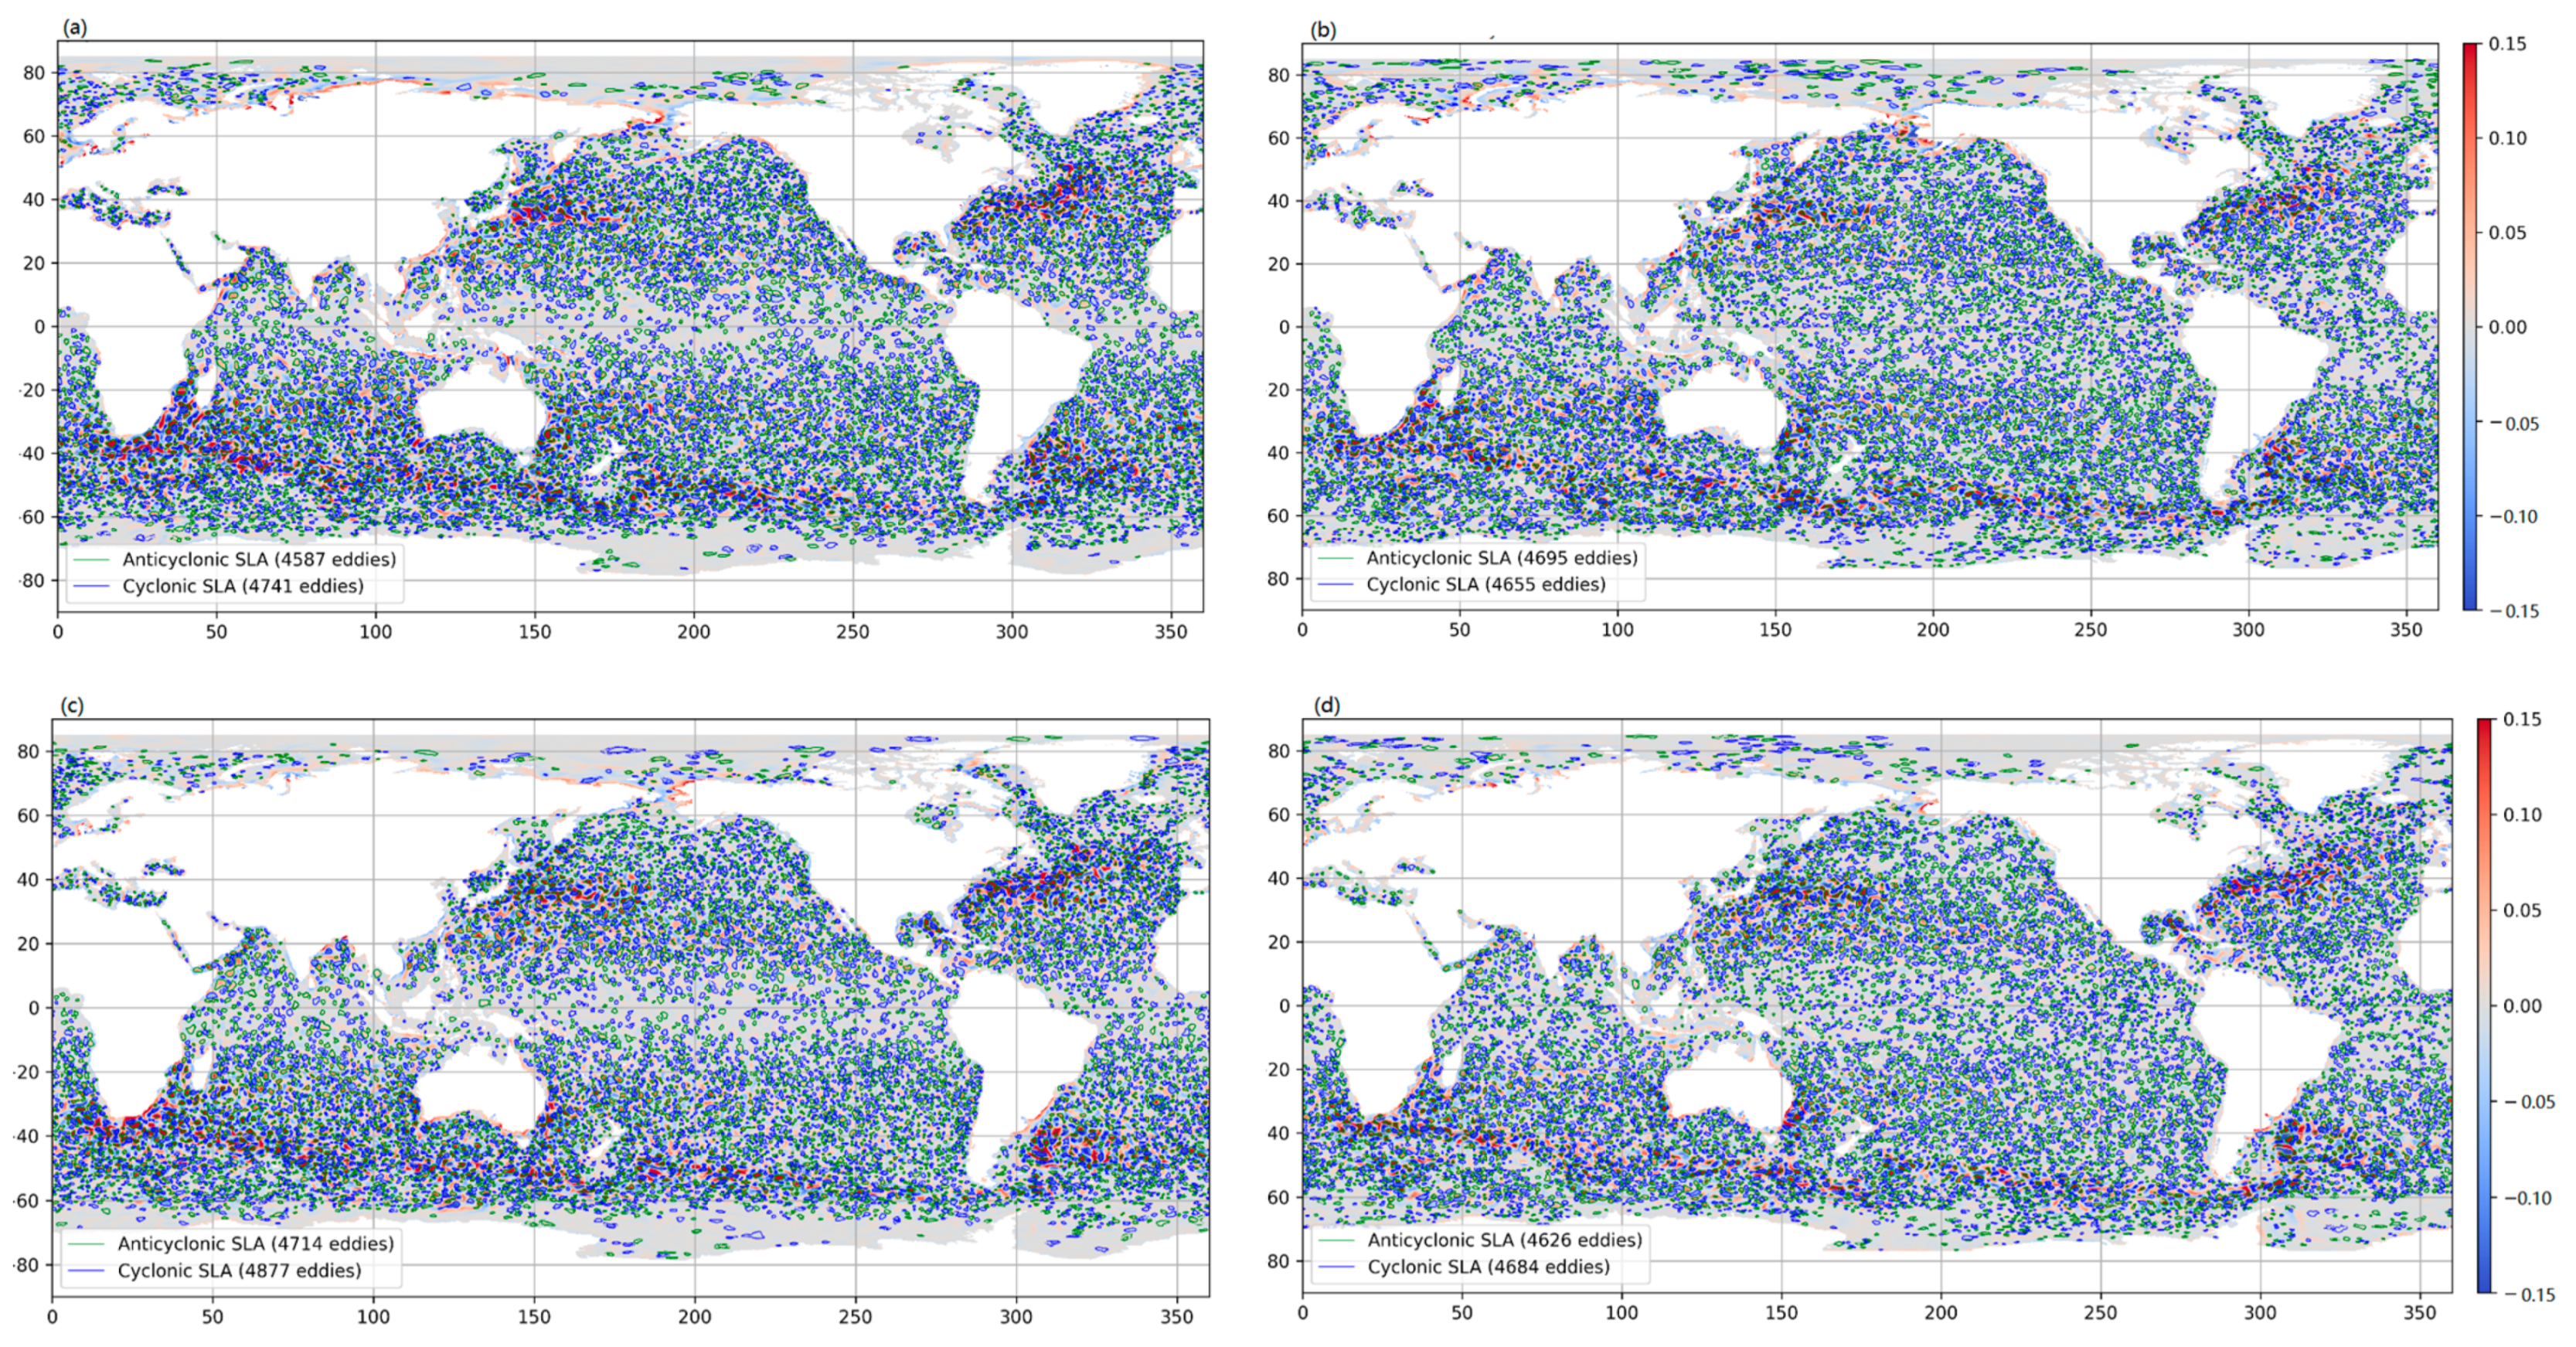
Since NMEFC-NEMO performs well in SLA forecasting, we next focus on the mesoscale eddy detection of the NMEFC-NEMO forecasting system. For example, the map of global eddy detection are taken at different times and in different seasons. The results obtained from the NMEFC-NEMO analysis and HYCOM reanalysis on 1 January 2019 and 1 July 2019 are shown in Figure 3. From these four figures, we can see that the global distribution of oceanic eddies are effectively represented in NMEFC-NEMO when compared to the HYCOM reanalysis. The oceanic eddies are quite active in the mid-latitude regions, such as the Gulf Stream, Kuroshio Extension and West Wind Drift region, also known as the Antarctic Circumpolar Current. However, it should be noted that there are slightly more eddies detected in the NMEFC-NEMO along the equator, which may be due to the excessive vertical mixing there. As described in the previous studies, the vertical mixing of vorticity is responsible for the two-to-three fold amplification of vertical mesoscale flux [48,49]. NMEFC-NEMO also effectively reproduces characteristics of the global distribution of oceanic eddies for the forecast lead times of 1–7 days relative to HYCOM reanalysis, but the number of eddies detected differs slightly (Table 3 and Table 4). The number of eddy identification from HYCOM reanalysis is greater than that of NMEFC-NEMO, except for the anticyclonic eddy detection in analysis day (L0). For the forecast leading 1-day, the number of anticyclonic (cyclonic) eddies is reduced by 12% (9%) against analysis day on 1 January 2019, and then slightly increases as the forecasting lead time increases (Table 3). On 1 July 2019, the detection number for anticyclonic (cyclonic) is reduced by 7% (4%) against analysis for the forecast of 1 day (Table 4). In general, the NMEFC-NEMO’s eddy detection rate against HYCOM reanalysis still exceeds 90%.
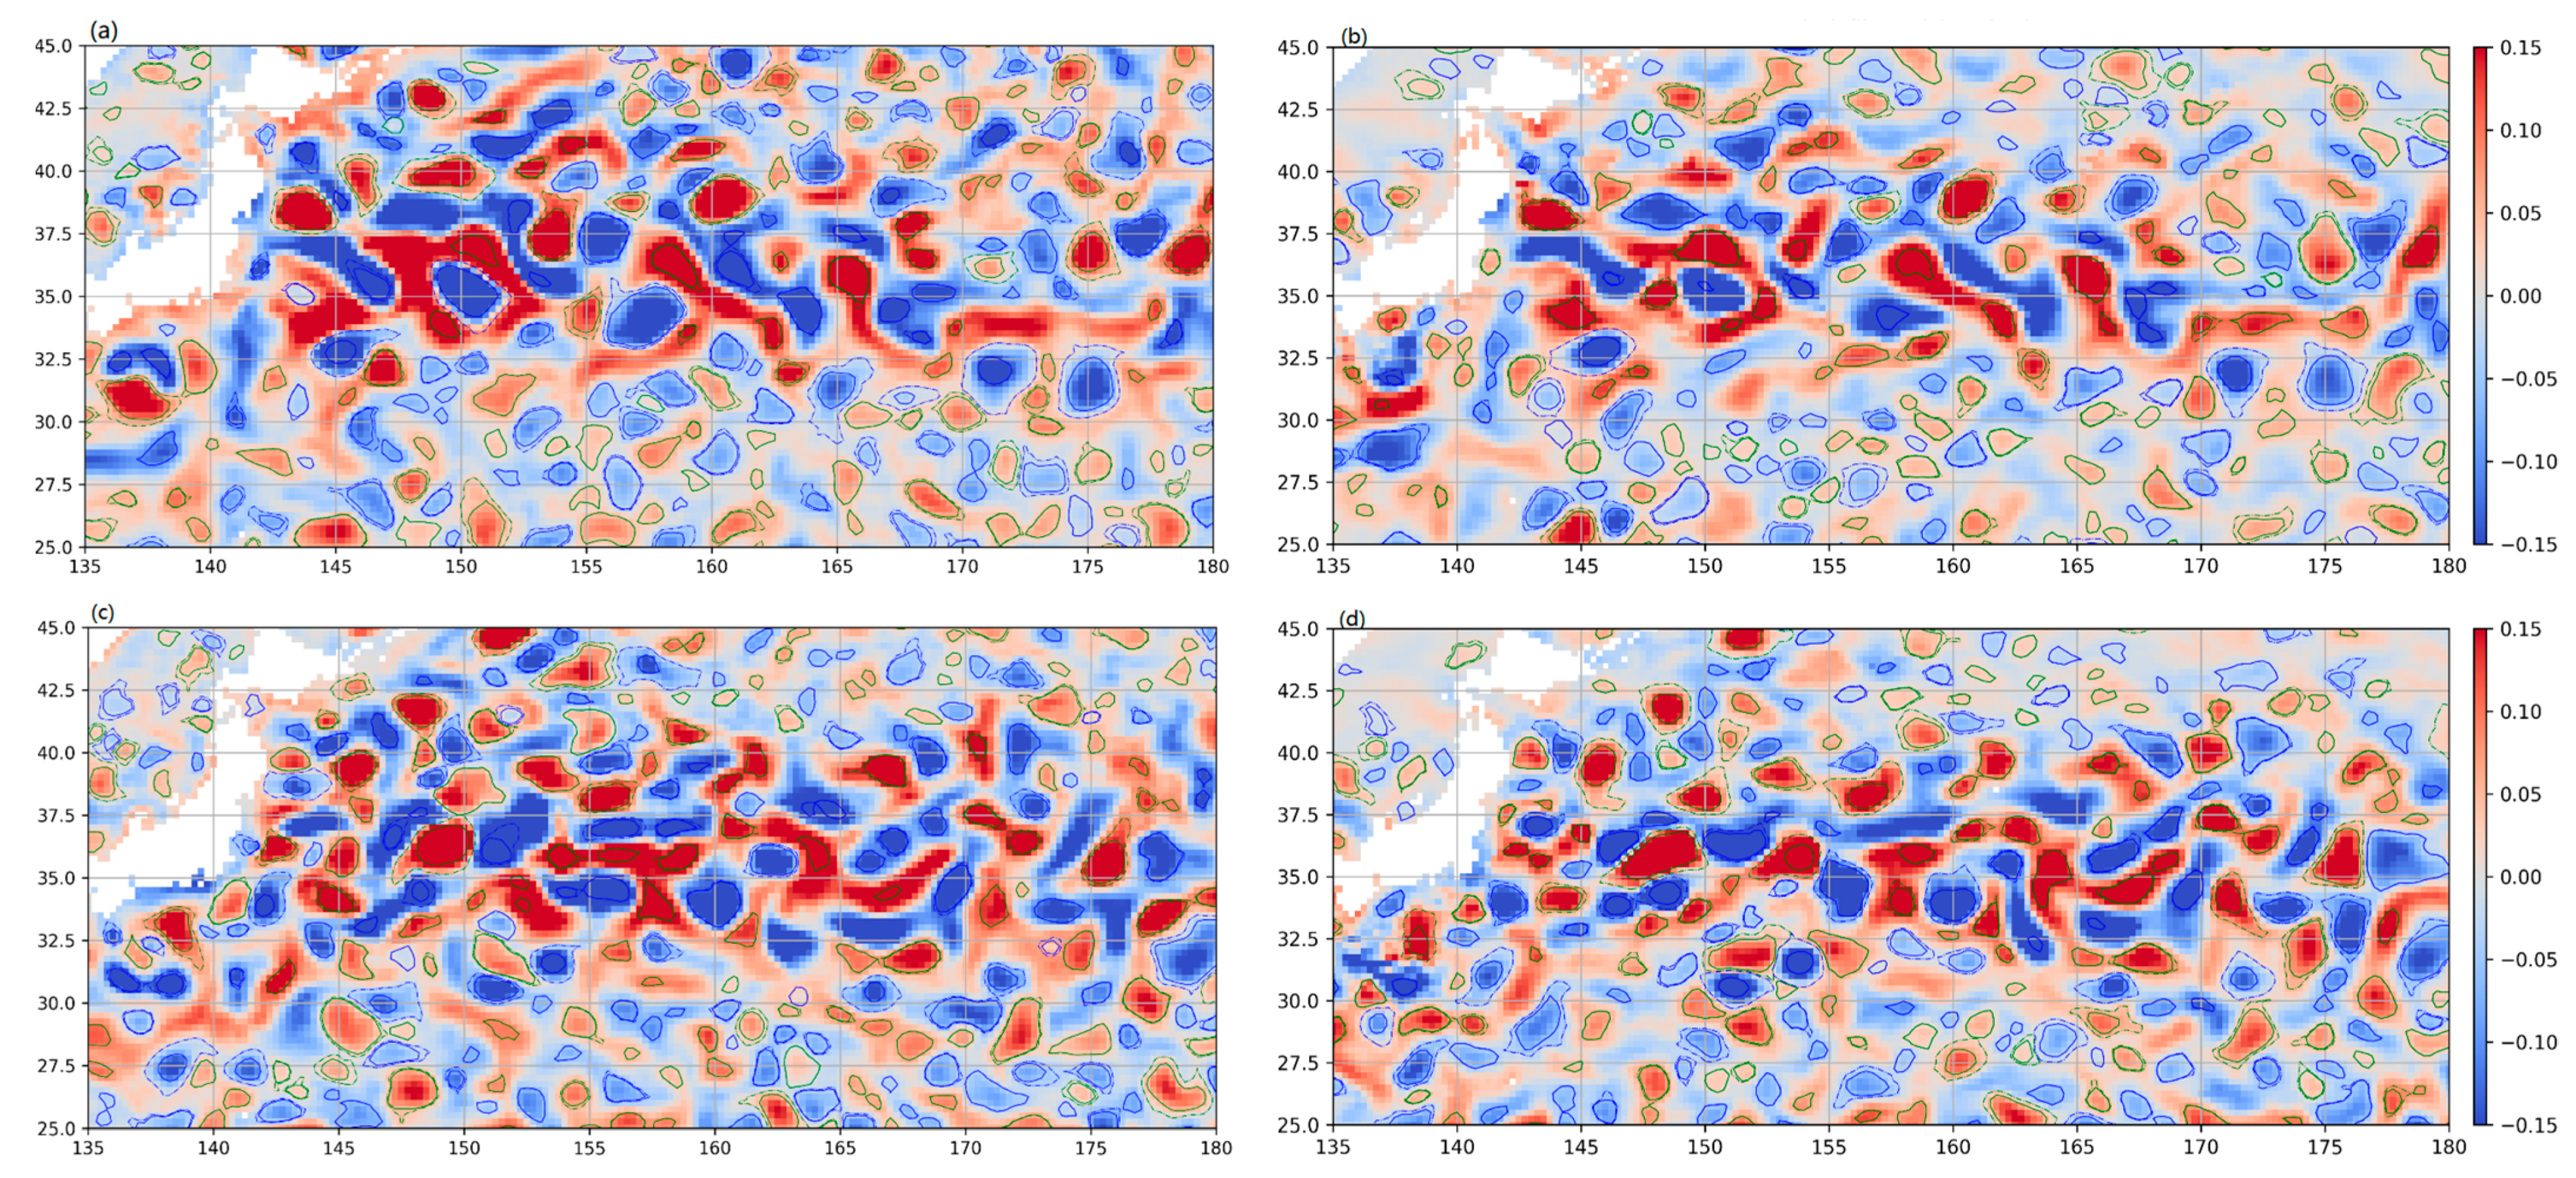
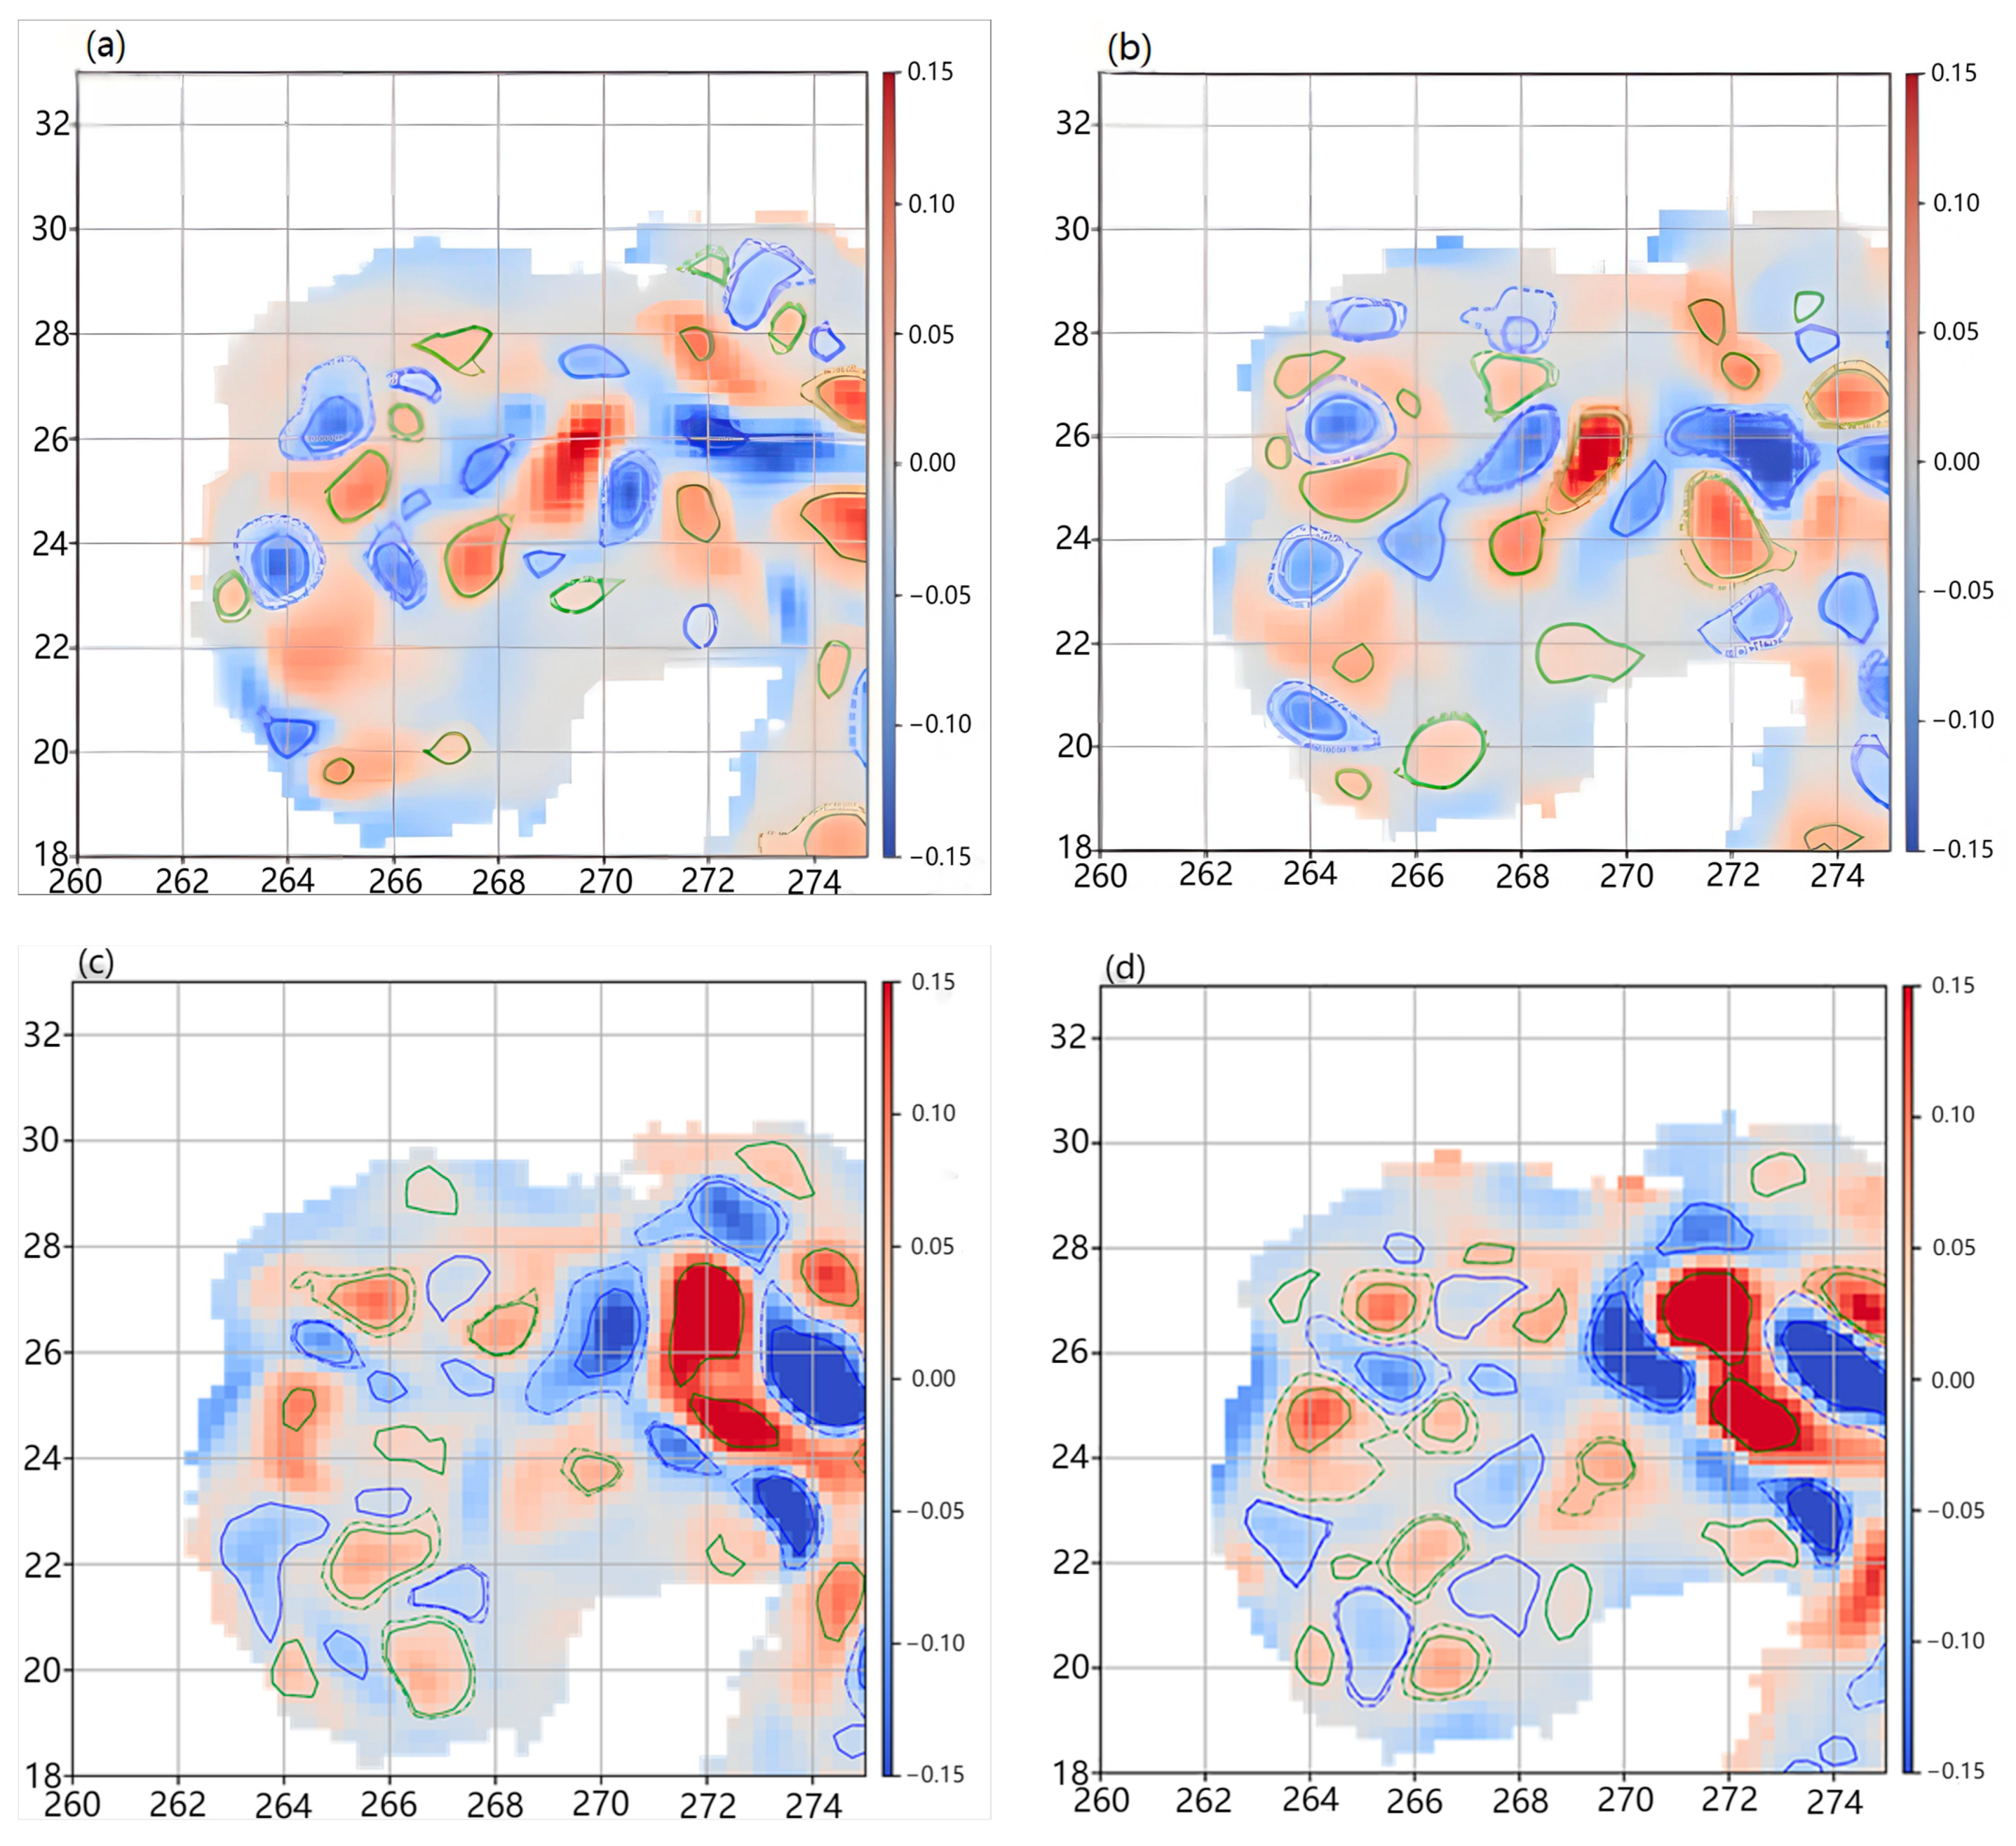
Since the Kuroshio Extension and Gulf Stream are two typical regions with strong mesoscale eddies, they are selected to further illustrate the ability of the NMEFC-NEMO to represent oceanic eddies. The map of oceanic eddies and their geometrical characteristics of the NMEFC-NEMO agree better with the HYCOM reanalysis, albeit with a slightly weaker magnitude. In Figure 4, the Kuroshio Extension currents are clearly flowing from west to east along about 35° N, as identified via the NMEFC-NEMO 24 h forecasting and HYCOM reanalysis results. NMEFC-NEMO also reproduces the characteristics for anticyclonic and cyclonic eddies merging and splitting alternatively in the Kuroshio Extension. As for the oceanic detection in the Gulf Stream, NMEFC-NEMO effectively represents the spatial distribution of eddies on 1 January 2019 and 1 July 2019, albeit with slight differences in the location and size of minority eddies. Finally, Figure 5 and Figure 6 show that the amplitude of oceanic eddies, both cyclones and anticyclones, are much stronger on 1 July 2019 than 1 January 2019.
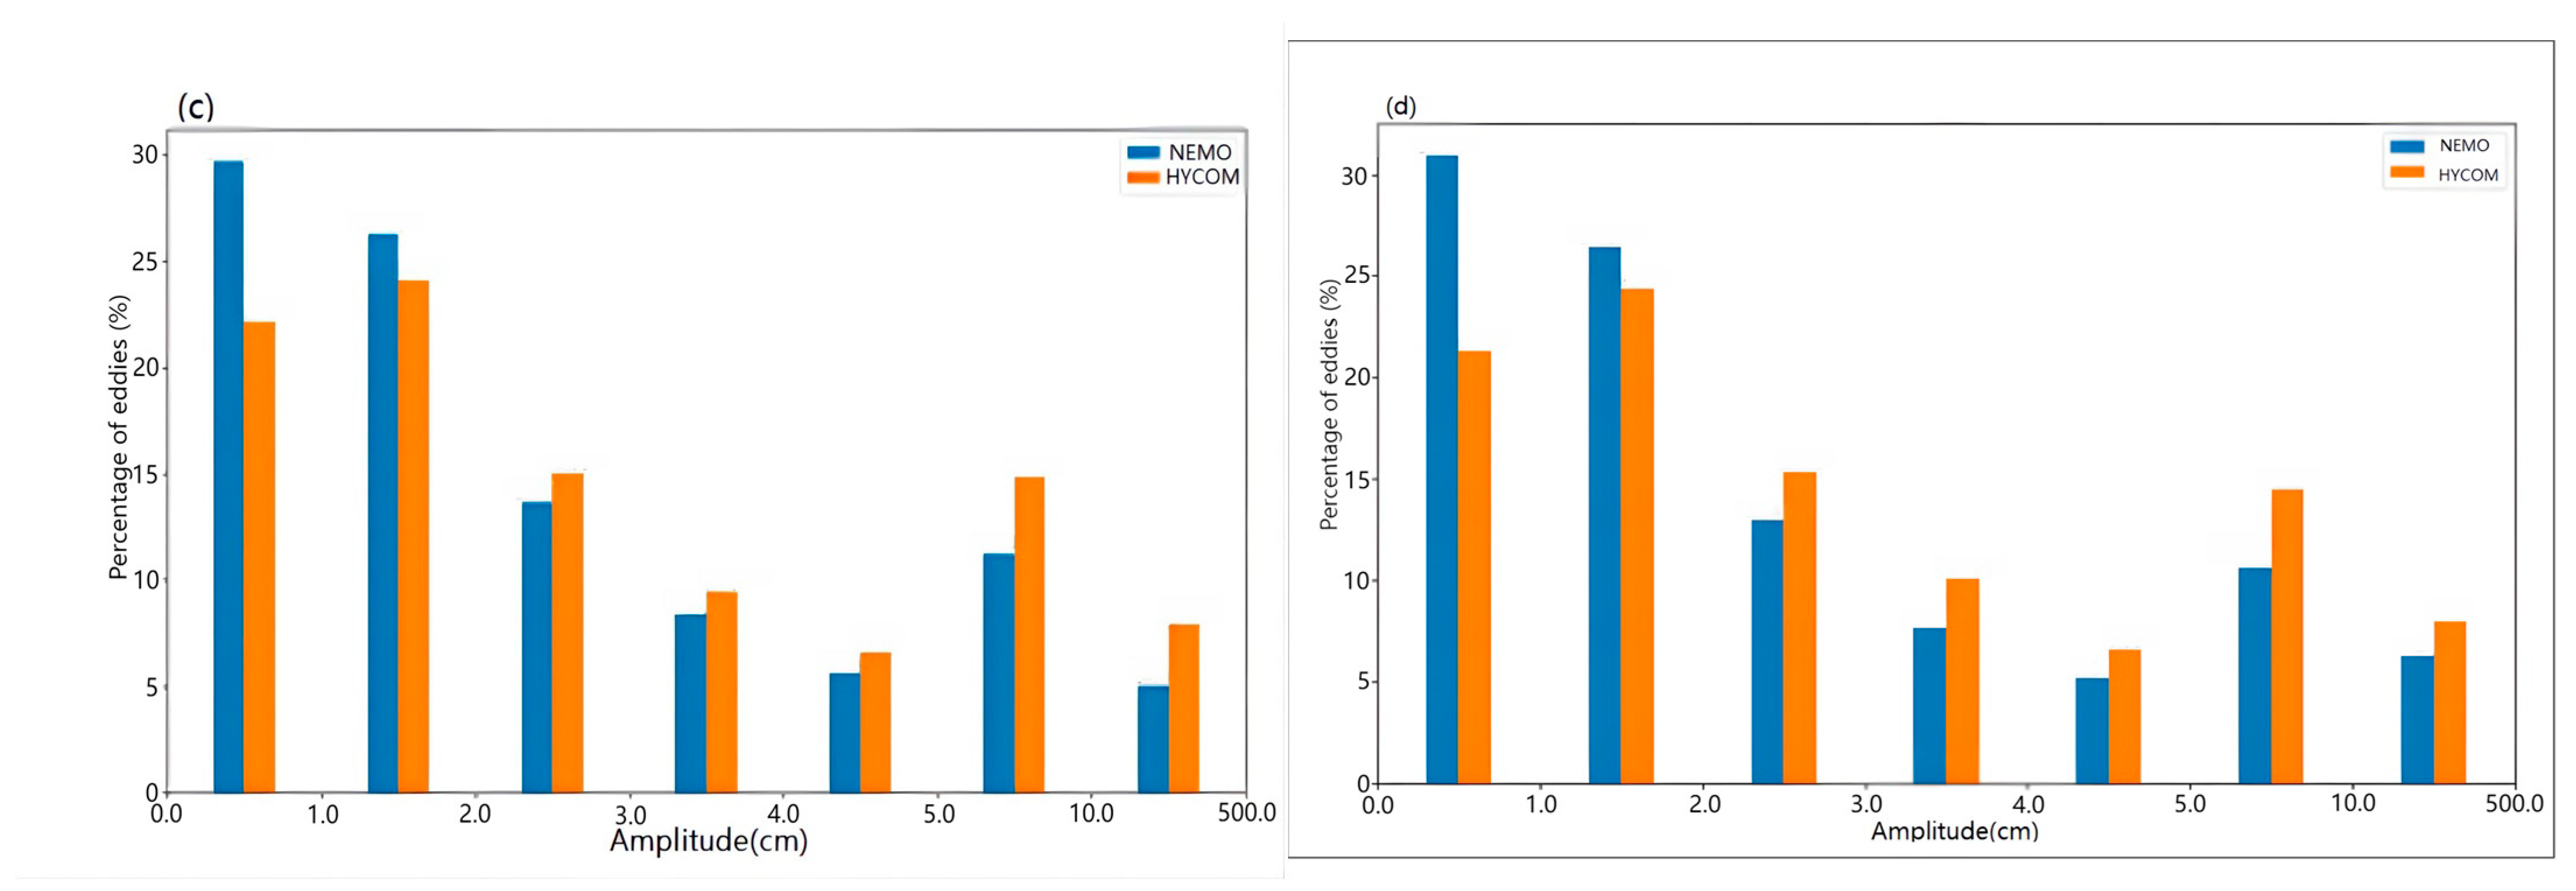
The strength of the anticyclonic (cyclonic) eddies is determined by its magnitude, as defined in Section 2. Some statistics are available for the strength of these eddies, which are, respectively, detected using NMEFC-NEMO and HYCOM reanalysis in January and July 2019 (Figure 5). For both anticyclonic and cyclonic eddies, the percentage of these weaker mesoscale eddies (amplitude of less than 2 cm) exceeds that of the HYCOM reanalysis. For the stronger mesoscale eddies (amplitude of more than 3 cm), the percentage of HYCOM reanalysis is slightly higher than that of NMEFC-NEMO.

4. Conclusions

In this paper, the qualitative and quantitative evaluation of the detection of eddies in the NMEFC-NEMO based on the closed SLA criterion method is carried out. The SLA forecasting performance of NMEFC-NEMO is evaluated against observations through comparison with the Mercator-PSY4, Mercator-PSY3, UK-FOAM, CONCEPTS-GIOPS and Bluelink-OceanMAPS forecasting systems. The results show that the SLA RMSE of NMEFC-NEMO is similar to that of Mercator PSY4 and slightly lower than the other forecasting systems. As for the anomaly correlation between SLA forecasting products and along-track observations, the AC results exceed 0.8 for the NMEFC-NEMO and Mercator-PSY4 systems, which indicates that the NMEFC-NEMO has a higher accuracy in SLA forecasting. Next, the global quantitative analysis for eddy detection is presented according to the closed SLA criterion method. The distribution global of oceanic eddies is effectively represented in NMEFC-NEMO compared to the HYCOM reanalysis, and the detection rate of NMEFC-NEMO exceeds 90% against HYCOM reanalysis. Finally, the spatial distributions of eddies in the Kuroshio and Gulf Stream regions are conducted in the two typical regions with strong mesoscale eddies, and the characteristics of anticyclonic and cyclonic eddies merging and splitting frequently in the Kuroshio Extension are reproduced via the NMEFC-NEMO forecasting products. In the Gulf Stream region, the NMEFC-NEMO shows a spatial pattern resembling that of the HYCOM reanalysis at different times and in different seasons.
As described above, NMEFC-NEMO very effectively represents the distribution of eddies. However, the cause for the decreasing number of eddy detection for the forecast of 1 day, followed by a slightly upward trend for the other forecast lead times in January 2019, remains unknown, and additional analysis is needed. This study merely evaluated the number and intensity of eddies, which is insufficient for us to understand the NMEFC-NEMO’s eddy detection ability. In the future, we will further evaluate the other parameters of eddies, such as life spans. In the next stage of our research, we also plan to use different observed and reanalyzed datasets and detected methods.

Author Contributions

Conceptualization, Y.Q. and H.M.; validation, H.M.; formal analysis, H.M. and X.H.; investigation, Q.Y.; resources, L.W., Y.Z. and J.X.; data curation, Q.Y. and Y.Z.; writing—original draft preparation, H.M. and Y.Q.; writing—review and editing, L.W. and X.W.; visualization, X.H.; supervision, L.W., X.W. and Y.W.; project administration, Y.W.; funding acquisition, L.W. and Y.Q. All authors have read and agreed to the published version of the manuscript.

Funding

This research was funded by the National Basic Research Program of China (grant number 2021YFC3101504 and 2021YFC3101501), and the National Natural Science Foundation of China (grant number 42176030).

Institutional Review Board Statement

Not applicable.

Informed Consent Statement

Not applicable.

Data Availability Statement

The observed sea level anomalies, consisting of the Jason-1, Jason-2, Cryosat and AltiKa, are obtained from CLS AVISO website. The operational forecasting products, including Mercator-PSY4, Mercator-PSY3, UK-FOAM, CONCEPTS-GIOPS and Bluelink-OceanMAPS, are sourced from USGODAE server at http://199.9.2.160/pub/outgoing/GODAE_class4/ (accessed on 30 April 2020).

Acknowledgments

We thank all the associated institutes or organizations for providing ocean forecasting products (Mercator-PSY4, Mercator-PSY3, UK-FOAM, CONCEPTS-GIOPS, Bluelink-OceanMAPS and HYCOM reanalysis), as well as the observed sea level anomalies from AVISO. A special thanks to Yishuang Liang and Mingqing Wang for their discussions and programs. Y.Q (Yinghao Qin) expresses his most heartfelt gratitude to his wife Lin Wang, the mother of Huhu and Tutu, whom he loves more than anything in the world. Thanks for her eternal love, encouragement and support in finishing his portion of contribution to this paper.

Conflicts of Interest

The authors declare no conflict of interest.

References

  1. Chelton, D.B.; Schlax, M.G.; Samelson, R.M. Global observations of nonlinear mesoscale eddies. Prog. Oceanogr. 2011, 91, 167–216. [Google Scholar] [CrossRef]
  2. Zhang, Z.; Wang, W.; Qiu, B. Oceanic mass transport by mesoscale eddies. Science 2014, 345, 322–324. [Google Scholar] [CrossRef] [PubMed]
  3. Lian, Z.; Sun, B.; Wei, Z.; Wang, Y. Comparison of Eight Detection Algorithms for the Quantification and Characterization of Mesoscale Eddies in the South China Sea. J. Atmos. Ocean. Technol. 2019, 36, 1361–1380. [Google Scholar] [CrossRef]
  4. Chen, G.; Gan, J.; Xie, Q.; Chu, X.; Wang, D.; Hou, Y. Eddy heat and salt transports in the South China Sea and their seasonal modulations. J. Geophys. Res. 2012, 117, C05021. [Google Scholar] [CrossRef]
  5. Nan, F.; He, Z.; Zhou, H.; Wang, D. Three long-lived anticyclonic eddies in the northern South China Sea. J. Geophys. Res. 2011, 116, C05002. [Google Scholar] [CrossRef]
  6. Klein, P.; Lapeyre, G. The oceanic vertical pump induced by mesoscale and submesoscale turbulence. Annu. Rev. Mar. Sci. 2009, 1, 351–375. [Google Scholar] [CrossRef] [PubMed]
  7. Chaigneau, A.; Eldin, G.; Dewitte, B. Eddy activity in the four major upwelling systems from satellite altimetry (1992–2007). Prog. Oceanogr. 2009, 83, 117–123. [Google Scholar] [CrossRef]
  8. Roemmich, D.; Gilson, J. Eddy transport of heat and thermocline waters in the North Pacific: A key to interannual/decadal climate variability? J. Phys. Oceanogr. 2001, 31, 675–687. [Google Scholar] [CrossRef]
  9. Qiu, B.; Chen, S. Eddy-induced heat transport in the subtropical North Pacific from Argo, TMI, and altimetry measurements. J. Phys. Oceanogr. 2005, 35, 458–473. [Google Scholar] [CrossRef]
  10. Yang, G.; Yu, W.; Yuan, Y.; Zhao, X.; Wang, F.; Chen, G.; Liu, L.; Duan, Y. Characteristics, vertical structures, and heat/salt transports of mesoscale eddies in the southeastern tropical Indian Ocean. J. Geophys. Res. Ocean. 2015, 120, 6733–6750. [Google Scholar] [CrossRef]
  11. Waite, A.M.; Stemmann, L.; Guidi, L.; Calil, P.H.R.; Hogg, A.M.C.; Feng, M.; Thompson, P.A.; Picheral, M.; Gorsky, G. The wineglass effect shapes particle export to the deep ocean in mesoscale eddies. Geophy. Res. Lett. 2016, 43, 9791–9800. [Google Scholar] [CrossRef]
  12. Yang, X.; Xu, G.; Liu, Y.; Sun, W.; Dong, C. Multi-Source Data Analysis of Mesoscale Eddies and Their Effects on Surface Chlorophyll in the Bay of Bengal. Remote Sens. 2020, 12, 3485. [Google Scholar] [CrossRef]
  13. Jian, Y.J.; Zhang, J.; Liu, Q.S.; Wang, Y.F. Effect of mesoscale eddies on underwater sound propagation. Appl. Acoust. 2008, 70, 432–440. [Google Scholar] [CrossRef]
  14. Sandalyuk, N.V.; Bosse, A.; Belonenko, T.V. The 3-D structure of mesoscale eddies in the Lofoten Basin of the Norwegian Sea: A composite analysis from altimetry and in situ data. J. Geophys. Res. Ocean. 2020, 125, e2020JC016331. [Google Scholar] [CrossRef]
  15. Sandalyuk, N.V.; Belonenko, T.V. Three-dimensional structure of the mesoscale eddies in the Agulhas Current region from hydrological and altimetry data. Russ. J. Earth Sci. 2020, 21, 5. [Google Scholar] [CrossRef]
  16. Chen, G.; Wang, D.; Hou, Y. The features and interannual variability mechanism of mesoscale eddies in the Bay of Bengal. Cont. Shelf Res. 2012, 47, 178–185. [Google Scholar] [CrossRef]
  17. Henrick, R.; Jacobson, M.; Siegmann, W.; Clark, J. Use of analytical modeling and limited data for prediction of mesoscale eddy properties. J. Phys. Oceanogr. 1979, 9, 65–78. [Google Scholar] [CrossRef]
  18. Lin, X.; Dong, C.; Chen, D.; Liu, Y.; Yang, J.; Zou, B.; Guan, Y. Three-dimensional properties of mesoscale eddies in the South China Sea based on eddy-resolving model output. Deep Sea Res. Part I 2015, 99, 46–64. [Google Scholar] [CrossRef]
  19. Dandapat, S.; Chakraborty, A. Mesoscale eddies in the Western Bay of Bengal as observed from satellite altimetry in 1993–2014: Statistical characteristics, variability and three-dimensional properties. IEEE J. Sel. Top. Appl. Earth Obs. Remote Sens. 2016, 9, 5044–5054. [Google Scholar] [CrossRef]
  20. Henson, S.A.; Thomas, A.C. A census of oceanic anticyclonic eddies in the Gulf of Alaska. Deep Sea Res. Part I 2008, 55, 163–176. [Google Scholar] [CrossRef]
  21. Doglioli, A.M.; Blanke, B.; Speich, S.; Lapeyre, G. Tracking coherent structures in a regional ocean model with wavelet analysis: Application to Cape Basin eddies. J. Geophys. Res. 2007, 112, C05043. [Google Scholar] [CrossRef]
  22. Faghmous, J.H.; Frenger, I.; Yao, Y.; Warmka, R.; Lindell, A.; Kumar, V. A daily global mesoscale ocean eddy dataset from satellite altimetry. Sci. Data 2015, 2, 150028. [Google Scholar] [CrossRef] [PubMed]
  23. Nencioli, F.; Dong, C.; Dickey, T.; Washburn, L.; McWilliams, J. A vector geometry–based eddy detection algorithm and its application to a high-resolution numerical model product and high-frequency radar surface velocities in the Southern California Bight. J. Atmos. Ocean. Technol. 2010, 27, 564–579. [Google Scholar] [CrossRef]
  24. Liu, Y.; Chen, G.; Sun, M.; Liu, S.; Tian, F. A parallel SLA-based algorithm for global mesoscale eddy identification. J. Atmos. Ocean. Technol. 2016, 33, 2743–2754. [Google Scholar] [CrossRef]
  25. Bell, M.J.; Schiller, A.; Le Traon, P.Y.; Smith, N.R.; Dombrowsky, E.; Wilmer-Becker, K. An introduction to GODAE OceanView. J. Oper. Oceanogr. 2015, 8, 2–11. [Google Scholar] [CrossRef]
  26. Martin, M.J.; Balmaseda, M.; Bertino, L.; Brasseur, P.; Brassington, G.; Cummings, J. Status and future of data assimilation in operational oceanography. J. Oper. Oceanogr. 2015, 8, 28–48. [Google Scholar] [CrossRef]
  27. Ali, M.M.; Sinha, P.; Jain, S.; Mohanty, U.C. Impact of sea surface height anomalies on cyclone track. Nat. Preced. 2007. [Google Scholar] [CrossRef]
  28. Jacobs, G.A.; Woodham, R.; Jourdan, D.; Braithwaite, J. GODAE applications useful to navies throughout the world. Oceanography 2009, 22, 182–189. [Google Scholar] [CrossRef]
  29. Davidson, F.J.M.; Allen, A.; Brassington, G.B.; Breivik, P.; Daniel, M.; Kamachi, S.; Sato, B.; King, F. Applications of GODAE ocean current forecasts to search and rescue and ship routing. Oceanography 2009, 22, 176–181. [Google Scholar] [CrossRef]
  30. Arur, A.; Krishnan, P.; George, G.; Goutham Bharathi, M.P.; Kaliyamoorthy, M.; Hareef Baba Shaeb, K.; Joshi, A.K. The influence of mesoscale eddies on a commercial fishery in the coastal waters of the Andaman and Nicobar Islands, India. Int. J. Remote Sens. 2014, 35, 6418–6443. [Google Scholar] [CrossRef]
  31. Hurlburt, H.E.; Brassington, G.B.; Drillet, Y.; Kamachi, M.; Benkiran, M.; Bourdalle-Badie, R.; Chassignet, E.; Jacobs, G.; Galloudec, O.; Lellouche, J.-M.; et al. High-resolution global and basin-scale ocean analyses and forecasts. Oceanography 2009, 22, 110–127. [Google Scholar] [CrossRef]
  32. Mo, H.E.; Qin, Y.H.; Zu, Z.Q.; Zhang, Y. Evaluation of the global ocean forecast system in NMEFC with the IV-TT class4 metrics. J. Phys. Conf. Ser. 2023, 2486, 012026. [Google Scholar] [CrossRef]
  33. Zhang, Y.; Mo, H.E.; Qin, Y.H.; Zu, Z.Q. Preliminary validation for an eddy-resolving Global Ocean Forecasting System–NMEFC-NEMO. J. Phys. Conf. Ser. 2023, 2486, 012030. [Google Scholar] [CrossRef]
  34. Ryan, A.G.; Regnier, C.; Divakaran, P.; Spindler, T.; Mehra, A.; Smith, G.C.; Davidson, F.; Hernandez, F.; Maksymczuk, J.; Liu, Y. GODAE Ocean View Class 4 forecast verification framework: Global ocean inter-comparison. J. Oper. Oceanogr. 2014, 8 (Suppl. S1), 98–111. [Google Scholar]
  35. Divakaran, P.; Brassington, G.B.; Ryan, A.G.; Regnier, C.; Spindler, T.; Mehra, A.; Hernandez, F.; Smith, G.C.; Liu, Y.; Davidson, F. GODAE OceanView Inter-comparison for the Australian Region. J. Oper. Oceanogr. 2015, 8 (Suppl. 1), s112–s126. [Google Scholar] [CrossRef]
  36. Nerger, L.; Tang, Q.; Mu, L. Efficient ensemble data assimilation for coupled models with the Parallel Data Assimilation Framework: Example of AWI-CM. Geosci. Model Dev. 2020, 13, 4305–4321. [Google Scholar] [CrossRef]
  37. Nerger, L.; Hiller, W. Software for Ensemble-based Data Assimilation Systems-Implementation Strategies and Scalability. Comput. Geosci. 2013, 55, 110–118. [Google Scholar] [CrossRef]
  38. Nerger, L.; Hiller, W.; Schröter, J. PDAF—The Parallel Data Assimilation Framework: Experiences with Kalman Filtering. In Use of High Performance Computing in Meteorology; World Scientific: Reading, UK, 2005; pp. 63–83. [Google Scholar] [CrossRef]
  39. Madec, G.; NEMO-team. NEMO Ocean Engine, version 3.6 stable; Note Du Pôle De Modélisation De L’institut Pierre-Simon Laplace (IPSL): Guyancourt, France, 2017; Volume 27, ISSN 1288-1619. [Google Scholar] [CrossRef]
  40. Fichefet, T.; Maqueda, M.A.M. Sensitivity of a global sea ice model to the treatment of ice thermodynamics and dynamics. J. Geophys. Res. 1997, 102, 12609–12646. [Google Scholar] [CrossRef]
  41. Vancoppenolle, M.; Fichefet, T.; Goosse, H. Simulating the mass balance and salinity of Arctic and Antarctic sea ice. 2. Sensitivity to salinity processes. Ocean Model. 2009, 27, 54–69. [Google Scholar] [CrossRef]
  42. Bouillon, S.; Maqueda, M.A.M.; Legat, V.; Fichefet, T. An elastic-viscous-plastic sea ice model formulated on Arakawa B and C grids. Ocean Model. 2009, 27, 174–184. [Google Scholar] [CrossRef]
  43. Oke, P.R.; Brassington, G.B.; Griffin, D.A.; Schiller, A. The Bluelink Ocean Data Assimilation System (BODAS). Ocean Model. 2008, 21, 46–70. [Google Scholar] [CrossRef]
  44. Brassington, G.B. OCEAN Model Analysis and Prediction System (OCEANMAPS): Operational ocean forecasting based on near real-time satellite Altimetry and Argo. ESA Spec. Publ. 2006, 614, 109. [Google Scholar]
  45. Griffies, S.M.; Harrison, M.J.; Pacanowski, R.C.; Rosati, A. A Technical Guide to MOM4; Ocean Group Technical Report; Geophysical Fluid Dynamics Laboratory (GFDL): Princeton, NJ, USA, 2004; Volume 5, p. 371. [Google Scholar]
  46. Bell, M.J.; Forbes, R.M.; Hines, A. Assessment of the FOAM global data assimilation system for real-time operational ocean forecasting. J. Mar. Syst. 2000, 25, 1–22. [Google Scholar] [CrossRef]
  47. Mignac, D.; Martin, M.; Fiedler, E.; Blockley, E.; Fournier, N. Improving the Met Office’s Forecast Ocean Assimilation Model (FOAM) with the assimilation of satellite-derived sea-ice thickness data from CryoSat-2 and SMOS in the Arctic. Q. J. R. Meteor. Soc. 2022, 148, 1144–1167. [Google Scholar] [CrossRef]
  48. Luneva, M.V.; Clayson, C.A.; Dubovikov, M.S. Effects of mesoscale eddies in the active mixed layer: Test of the parametrisation in eddy resolving simulations. Geophys. Astrophys. Fluid Dyn. 2015, 109, 281–310. [Google Scholar] [CrossRef]
  49. Schneider, N.; Müller, P. Sensitivity of the surface equatorial ocean to the parameterization of vertical mixing. J. Phys. Oceanogr. 1994, 24, 1623–1640. [Google Scholar] [CrossRef]
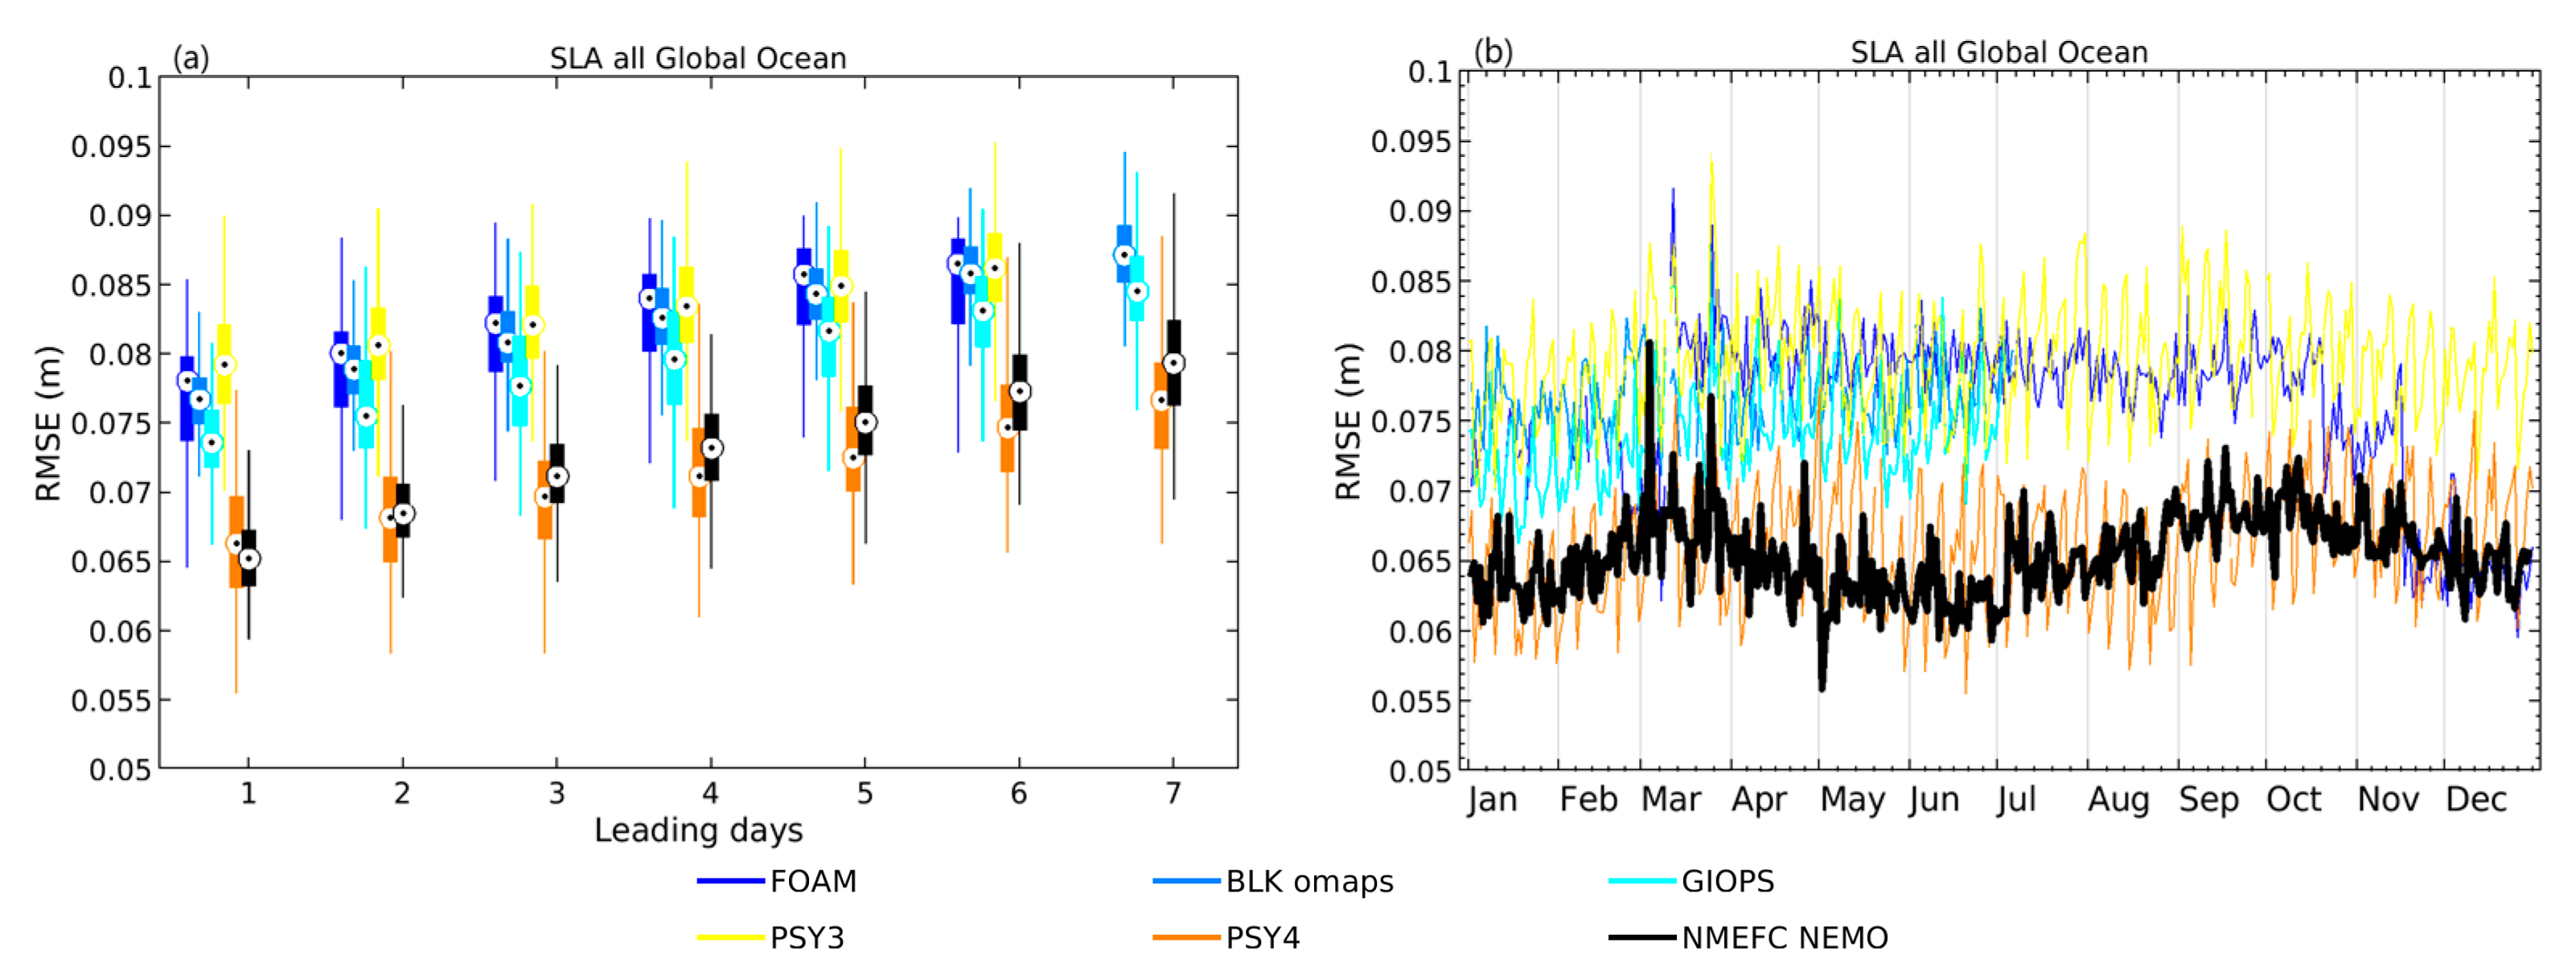
Figure 1. Evaluation of SLA forecasting products from Mercator-PSY3, Mercator-PSY4, Bluelink-OceanMAPS, UK-FOAM and CONCEPTS-GIOPS against along-track altimeters in the sense of RMSE (unit: m). (a) RMSE of SLA as a function of forecasting leading days. The dotted circle is the mean value of RMSE, vertical line is the 95% value and rectangular box is the interquartile range. (b) Time series of RMSE as a function of leading 1-day forecasting from 1 January 2019 to 31 December 2019.
Jmse 11 02343 g001
Figure 2. The same as Figure 1, but for the anomaly correlation (AC) as the evaluation metric. (a) AC of SLA as a function of forecasting leading days. The dotted circle is the mean value of AC, vertical line is the 95% value and rectangular box is the interquartile range. (b) Time series of AC as a function of leading 1-day forecasting from 1 January 2019 to 31 December 2019.
Jmse 11 02343 g002
Figure 3. Map of global eddy detection obtained from HYCOM reanalysis (a,c) and NMEFC-NEMO analysis (b,d) on 1 January 2019 (a,b) and 1 July 2019 (c,d). The areas surrounded by green (blue) lines are anticyclonic (cyclonic) eddies. The colored parts indicate the SLA (units: m).
Jmse 11 02343 g003
Figure 4. Results of eddy detection in the Kuroshio Extension area using HYCOM reanalysis (a,c) and NMEFC-NEMO 24 h forecasting (b,d) on 1 January 2019 (a,b) and 1 July 2019 (c,d). The areas surrounded by green (blue) lines are anticyclonic (cyclonic) eddies. The colored parts indicate the SLA (unit: m).
Jmse 11 02343 g004
Figure 5. Statistical distribution diagram of the strength of the anticyclonic and cyclonic eddies from NMEFC-NEMO and HYCOM reanalysis in January (a,b) and July 2019 (c,d).
Jmse 11 02343 g005aJmse 11 02343 g005b
Figure 6. Eddy detection results of the Gulf Stream from HYCOM reanalysis (a,c) and NMEFC-NEMO 24 h forecasting (b,d) on 1 January 2019 (a,b) and 1 July 2019 (c,d). The areas surrounded by green (blue) lines are anticyclonic (cyclonic) eddies.
Jmse 11 02343 g006
Table 1. Basic information of the forecasting systems for intercomparison.
Forecasting SystemsOcean ModelSea Ice ModelHorizontal ResolutionVertical Resolution
FOAMNEMOv3.2CICEv4.11/4°75
BLK omapsMOM4 Global-2° regional-1/10° (90° E–180° E, 16° N–75° S)51
GIOPSNEMOv3.1CICEv4.01/4°50
PSY3NEMOv3.1LIM2_EVP1/4°50
PSY41/12°
NMEFC-NEMONEMOv3.6LIM31/12°75
Table 2. RMSE of SLA from different forecasting systems (unit: m).
Forecasting
System
L1L2L3L4L5L6L7
UK-FOAM0.07610.07820.08080.08260.08470.0863
Bluelink-OceanMAPS0.07680.07920.08120.08290.08450.0860.0873
CONCEPTS-GIOPS0.07420.07630.07810.07980.08140.0830.0847
Mercator-PSY30.07930.08080.08230.08370.0850.0863
Mercator-PSY40.06630.06810.06990.07170.07340.07510.0767
NMEFC-NEMO0.06540.06870.07140.07350.07540.07750.0797
Explanations: L1–L7, respectively, represent the forecasting lead times of 1–7 days.
Table 3. Statistics for NMEFC-NEMO and HYCOM eddy detection numbers on 1 January 2019.
Forecasting
System
Eddy TypeL0L1L2L3L4L5L6L7
NMEFC-NEMOAnticyclonic46954138417042084201419642274293
Cyclonic46554244422342764253427243014333
HYCOM reanalysisAnticyclonic45874519447844894511456045064518
Cyclonic47414749464547604813478247124773
Explanations: L0 represents the analysis day before forecast run, and L1–L7, respectively, represent the forecasting lead times of 1–7 days.
Table 4. Statistics for NMEFC-NEMO and HYCOM eddy detection numbers on 1 July 2019.
Forecasting
System
Eddy TypeL0L1L2L3L4L5L6L7
NMEFC-NEMOAnticyclonic46264309431443494316434144214418
Cyclonic46844509454745054490450144784478
HYCOM reanalysisAnticyclonic47144728468647564666470047144772
Cyclonic48774871488549314925493049264974
Explanations: L0 represents the analysis day before forecast run, and L1–L7, respectively, represent the forecasting lead times of 1–7 days.
Disclaimer/Publisher’s Note: The statements, opinions and data contained in all publications are solely those of the individual author(s) and contributor(s) and not of MDPI and/or the editor(s). MDPI and/or the editor(s) disclaim responsibility for any injury to people or property resulting from any ideas, methods, instructions or products referred to in the content.