Article

A New Ocean Rock Mass Rating and Its Application to Determine the Ultimate Bearing Capacity of an Offshore Wind Monopile Foundation

1
School of Civil Engineering, Southeast University, Nanjing 211189, China
2
Department of Architecture and Civil Engineering, City University of Hong Kong, Tat Chee Avenue, Kowloon, Hong Kong 999077, China
3
Shanghai Investigation, Design & Research Institute Co., Ltd., Shanghai 200434, China
4
Department of Geotechnical Engineering, College of Civil Engineering, Tongji University, Shanghai 200092, China
*
Author to whom correspondence should be addressed.
J. Mar. Sci. Eng. 2023, 11(12), 2310; https://doi.org/10.3390/jmse11122310
Submission received: 12 November 2023 / Revised: 4 December 2023 / Accepted: 4 December 2023 / Published: 6 December 2023
(This article belongs to the Topic Wind, Wave and Tidal Energy Technologies in China)

Abstract

:
Offshore wind power is a new trend in renewable energy development. However, during the operation of offshore wind turbines, the rock-socketed monopile foundation is subjected to long-term cyclic loads, which will cause the seawater to erode the rock around the monopile foundation and reduce the ultimate end-bearing capacity. There is no suitable rock mass classification for evaluating the quality of marine bedrock and no theoretical method for accurately calculating the ultimate end-bearing capacity of the monopile foundation. Therefore, based on the existing rock mass classification, an ocean rock mass classification (OMR) that is applicable to marine bedrock is proposed. The ratings of four geological indices (R1, R2, R3, and R4) in the OMR classification are reset by the analysis hierarchy process and modified according to the geological conditions of marine bedrock. Then, an accelerated test of seawater erosion is used over 60 days to simulate seawater erosion for up to 12 years to determine the adjustment factor for the effect of time, Ft, in the OMR classification. Based on the OMR classification, a theoretical calculation method of the ultimate end-bearing capacity of the offshore wind monopile foundation under the overall sliding failure mode of rock mass is proposed. The theoretical calculation method was employed for offshore wind engineering, and the reliability of the theoretical calculation and three-dimensional numerical simulation was validated. The results show that the theoretical and numerical results for the ultimate end-bearing capacity without seawater erosion are similar to the measured results, with a relative error of less than 9%. The theoretical results are always larger than the numerical results, with a relative error of less than 7%. Finally, the theoretical and numerical results were used to guide the design and construction of an offshore wind turbine. The offshore wind turbine has been operating for 8 years, and its displacement is 15.3 mm, which is less than the numerical result of 16.94 mm.

1. Introduction

With the prominence of social and environmental issues, such as energy scarcity, environmental pollution, and climate warming, clean energy, such as hydropower, nuclear power, wind power, and solar power, is developing rapidly. Among them, wind power, as a clean and renewable energy, is part of the focus of renewable energy development, and its proportion in the energy structure represents a rising trend. It is estimated that wind power will meet more than 20% of global electricity demands by 2050 [1,2]. Wind power can be categorized into onshore and offshore wind power. Compared with onshore wind power, offshore wind power has the advantages of higher power generation, more stable operation, and a lower land occupation rate. According to statistics, the developable and utilizable reserves of offshore wind energy in China have reached 750 million KW [3,4,5,6,7,8], with huge development potential.
The research data show that the foundation investment accounts for 20–30% of the cost of an offshore wind turbine, which results in higher costs for offshore wind power than onshore wind power [9]. Therefore, selecting the suitable type of foundation for the offshore wind turbine is the key to the development of offshore wind power. Currently, the main foundation forms used for offshore wind turbines include gravity base foundations, monopile foundations, tripod foundations, jacket (lattice structure) foundations, and floating foundations [2,10,11]. Among them, the monopile foundation has a simple structure, convenient construction, and strong foundation adaptability, which is especially suitable for shallow and medium water depths and ocean areas with good holding layers. For the monopile foundations, rock-socketed pile foundations are commonly employed, in which the monopile foundations are buried in the rock to utilize the bedrock to increase the bearing capacity.
However, offshore wind turbines encounter some problems when using monopile foundations. In the operation phase of offshore wind turbines, the monopile foundation is subjected to the long-term action of cyclic dynamic loads, such as wind turbine loads, wave loads, and wind loads [4,5,12]. The pile-rock contact surface is damaged and continuously separated, and the seawater further erodes the rock around the monopile foundation. This has a significant impact on the safety and long-term stability of the foundation for an offshore wind turbine, as illustrated in Figure 1.
The seawater erosion will degrade the quality of the marine bedrock. However, the commonly used engineering rock mass classifications in rock engineering consider the influence of groundwater but cannot reflect the deterioration effect of rocks by seawater erosion. Some researchers attempted to propose rock mass classifications applicable to marine bedrock [13,14]. Zhang et al. [13] established a comprehensive index to reflect the rock mass quality in sea reefs by taking into account the mechanical properties of rocks, the structural types of rock masses, the developmental characteristics of structural surfaces, the weathering conditions, and groundwater. Liu and Dang [14] proposed M-IRMR for undersea deposits based on the RMR. They modified four rating indices according to the characteristics of undersea deposits and added two engineering rating indices for the M-IRMR. Cheng et al. [15] used two rock mass classifications to evaluate the load-bearing behavior of the offshore wind monopile foundations. These original rock mass classifications are unsuitable for evaluating the quality of the marine bedrock because the effect of time of seawater erosion on the deterioration of rock properties is not considered. Zhang et al. [16] pointed out that in recent offshore wind turbine foundation designs, the evaluation is typically assessed without considering seawater erosion. It is recommended to adjust the original rock mass classification and consider the effect of time of the seawater erosion.
Meanwhile, the calculation of the ultimate bearing capacity of the monopile foundation only considers the uniaxial compressive strength of the rock in a pure water saturation state, ignoring the effect of time of environmental elements (seawater) on the deterioration of the physical and mechanical properties of rocks. However, researchers indicated that the weakening effect of environmental elements, especially water, on the structural surfaces and mechanical properties of rocks is significant [12,17,18,19]. Hu et al. [19] analyzed the mechanical properties of rocks in different moisture states through physical property tests, uniaxial compression tests, and triaxial compression tests. It was noted that water has a effect of time on the strength of rocks. Zhang et al. [12] comprehensively investigated the deterioration effects of pressurized seawater on three types of rocks. The experimental results suggested that the seawater had negligible deterioration on the granite specimens and had a greater effect on the mechanical properties of the sandstone and tuff.
To sum up, the existing rock mass classifications cannot accurately reflect the quality of the marine bedrock and its deterioration pattern with time. The existing methods for calculating the ultimate bearing capacity of a monopile foundation also neglect the effect of time of seawater on the deterioration of the rock’s physico-mechanical properties. The inapplicable rock mass classification and inaccurate calculation method of ultimate bearing capacity lead to large deviations in the design of the bearing capacity of the monopile foundation, which causes large safety hazards in the construction and operation of offshore wind turbines.
Therefore, based on the existing rock mass classification, the rating of each classification index is modified by considering the geological conditions of offshore wind monopile foundations. According to the accelerated test of seawater erosion, the influence of time on rock mass quality after seawater erosion is analyzed. The rock mass classification applicable to the marine bedrock at the end of the monopile foundations for offshore wind turbines is proposed, which is defined as the ocean rock mass rating (OMR). Based on the OMR classification, the theoretical calculation method of the ultimate end-bearing capacity of the offshore wind monopile foundation is proposed. Finally, the proposed calculation method of the ultimate end-bearing capacity is applied to offshore wind engineering, and the reliability of the proposed method was validated by three-dimensional (3D) numerical simulation. The theoretical and numerical results are used to guide the design and construction of the offshore wind engineering.

2. Ocean Rock Mass Rating System

Rock mass classification plays an important role in evaluating rock quality. There are many rock mass classifications, such as the rock mass rating (RMR) [20,21], rock mass quality Q-system (Q) [22], geological strength index (GSI) [23,24], and the basic quality system (BQ) [25,26]. These classifications assess the rock mass quality by obtaining the parameters of rocks and engineered rock masses by using rock mechanical tests and engineering geological field investigations [27]. However, the existing rock mass classifications cannot reflect the influence of seawater on the rock mass quality, and the effect of time of seawater erosion is ignored. The existing rock mass classification requires modification to make it applicable to the evaluation of the marine bedrock.

2.1. Determination of Evaluation Indexes

As a comprehensive rock mass classification that considers multiple factors, the RMR classification is the most widely used due to its reliability and practicality in rock quality evaluation [28,29,30,31,32]. Celada et al. [33] modified the RMR classification and proposed the RMR14 classification. RMR14 refines the rating of the structural surface conditions and introduces the alterability index, Id2, which characterizes the resistance of the rock to softening and disintegration when in contact with water. The Id2 index is helpful for the RMR14 classification to evaluate the rock mass quality in water-rich subsurface rock engineering, especially for marine rock engineering. However, RMR14 is mainly used to focus on underground rock tunneling engineering, and the environmental medium of the marine bedrock is different from the tunnel surrounding rock, resulting in the considerations and rating of the classification indices of RMR14 not being applicable to the quality evaluation of marine bedrock. Therefore, an ocean rock mass rating (OMR) classification applicable to the marine bedrock at the end of monopile foundations for offshore wind turbines is proposed by modifying the RMR14 classification.
The OMR classification includes five rating indices: the strength of intact rock (R1), the structural integrity of rock mass (R2), the discontinuities condition (R3), intact rock alterability (R4), and an adjustment factor for the effect of time (Ft). Since the OMR classification is used to evaluate the quality of the marine bedrock, the groundwater conditions are not considered.

2.2. Modification of Geological Indices

The five rating indices in the OMR classification from R1 to R4 are geological indices, and Ft is the adjustment factor for the effect of time. In order to adapt to the requirements of the OMR classification, it is necessary to modify the R1, R2, R3, and R4 indices and reset the ratings of the four indices based on the RMR14 classification and the conditions of the marine bedrock.

2.2.1. Resetting Ratings of Geological Indices in OMR Classification

The four geological indices considered in the OMR classification accounted for 15, 40, 20, and 10 points in the RMR14 classification, respectively. However, the impact of these four geological indices on the quality of the marine bedrock is quite different from that of tunnel rock. Long-term seawater–rock interactions are prevalent in marine rock engineering, and rock strength and disintegration resistance are more important to the quality of the marine bedrock. The structural integrity of the rock mass and discontinuities condition mainly influence the efficiency of seawater erosion. Therefore, the ratings of R1 and R4 should be higher than those of R2 and R3. Besides, the OMR classification neglects groundwater conditions, making the sum of the four geological indices less than 100 points. In summary, the rating of the four geological indices is reset according to the characteristics of marine rock engineering based on the analysis hierarchy process (AHP).
The AHP can be used to deal with complex problems by categorizing the decision-relevant elements into a structure of the goal, criteria, and options [34,35]. It is easy to employ, integrates the contributions of multiple factors, does not require additional quantitative information, and has been widely used in the design and modification of rock mass classifications. For the determination of the weights of the four geological indices for OMR classification, an AHP structure is established, as shown in Figure 2. The AHP structure can be divided into three layers: the goal layer, the criteria layer, and the options layer. In this study, the AHP is used to assess the quality of marine bedrock, which is the goal layer. The four geologic indicators included in the OMR classification, which comprise the criteria layer, are used to determine judgment matrix A based on the importance of each criterion in the goal layer. Finally, the synthetic weight of each criterion on the goal is calculated based on judgment matrix A and is used to select the best result in the options layer.
Each criterion in the criteria layer has a different weight for the goal layer. In other words, R1, R2, R3, and R4 have different impacts on the quality of the marine bedrock. Judgment matrix A [Equation (1)] can be constructed by citing the nine-point rating scale proposed by Sttay [36,37] (Table 1). In the OMR classification, the ratings of the strength of intact rock, R1, and the ratings of intact rock alterability, R4, are considered equally important. R1 and R4 are slightly more important than the ratings of the structural integrity of rock mass, R2, and moderately more important than the ratings of the discontinuities condition, R3. The weights of the R1~R4 indices are computed based on matrix A, as listed in Table 2. By modifying the obtained weights, it can be found that R1, R2, R3, and R4 account for 35, 20, 10, and 35 points in OMR classification, respectively.
A = 1 2 3 1 0.5 1 2 0.5 1 / 3 0.5 1 1 / 3 1 2 3 1
The statistical validation of the AHP analysis for the OMR classification is performed, and the consistency index (CI) and consistency ratio (CR) are calculated as follows [37]:
C I = λ max n n 1
C R = C I R I
where λmax is the largest eigenvalue of judgment matrix A, n is the size of matrix A, and RI is the random consistency index based on the size of comparison matrix A [37]. If CR is less than 0.10, the AHP analysis is reasonable, and the results can be accepted.
The results of the statistical validation of the above AHP analysis are presented in Table 3. It can be found that the CR is less than 0.10, which implies the AHP analysis of the OMR classification is acceptable. The ratings of the four geological indices in the OMR classification are 35, 20, 10, and 35 points, respectively.
The ratings of the four geological indices in the OMR classification are reset according to the impact on the quality of the marine bedrock. However, the ratings of these four geological indices are determined by the parameters that are easily accessible for tunnel engineering but difficult in offshore wind engineering. Therefore, the four geological indices are further modified to enable convenient utilization in offshore wind engineering.

2.2.2. Rating Modification of the Strength of Intact Rock R1

According to the RMR14 classification, there is a stepwise correspondence between the saturated uniaxial compressive strength, σc, and the rating index, R1. The rating method jumps, which will cause changes in the score. In practice, linear interpolation is usually used to determine the R1. Therefore, the correspondence between σc and R1 can be refined by the continuum regression approach [38]. It is worth noting that the rating for R1 in the OMR classification has increased from 15 to 35 points. The regression results are presented in Equation (4) and Figure 3.
R 1 = 0.98 σ c 0.65
When it is inconvenient to obtain the saturated uniaxial compressive strength in offshore wind engineering, the point load test can be used to determine the point load strength index of the rock, Is(50), which can be converted to σc. The conversion relationship between the two is as follows [25]:
σ c = 22.82 I s ( 50 ) 0.75
where Is(50) is the point load strength index of a standard specimen with a diameter of 50 mm.
The R1 indices modified for continuity refinement are listed in Table 4. In engineering practice, if Table 4 does not include the obtained σc and Is(50), Equations (4) and (5) can be utilized for the determination of R1.

2.2.3. Rating Modification of Structural Integrity of Rock Mass R2

The RMR14 classification determines the structural integrity of rock mass based on the number of discontinuities, dn, but in some rock engineering (especially offshore wind engineering), the acquisition of the dn of the excavation surface is extremely difficult. Since the construction of offshore wind turbines requires drilling holes to investigate the geological conditions of the marine bedrock, the RQD is the most accessible index for the structural integrity of the rock mass, which does not require additional experimental tests. The original RMR classification applies the RQD to evaluate the structural integrity of rock mass. In RMR classification, the rating of RQD is divided into five intervals, showing a jumping characteristic similar to the strength index described above. According to the quality evaluation of the marine bedrock, the R2 index accounts for 20 points in the OMR classification. Therefore, the continuous regression approach is adopted to modify the rating of R2 in the OMR classification based on the RQD, as shown in Figure 4. The continuity equation between RQD and R2 index is as follows:
R 2 = 0.187 RQD + 1.298
In order to express the relationship between RQD and R2 in terms of a simple linear relationship, the detailed modification values of the R2 index are listed in Table 5. The ratings of the R2 of RQD not covered in Table 5 can be calculated using Equation (6).

2.2.4. Rating Modification of Discontinuities Condition R3

Zhang et al. [12] demonstrated (experimentally) that seawater erosion in the discontinuities of the rock mass is significant. In the OMR classification, strength deterioration caused by seawater erosion is usually expressed by R1 and R5, and the effect of time regarding seawater erosion on the discontinuities is represented by Ft. Therefore, the discontinuous condition R3 has a relatively low percentage of 10 points in the OMR classification. The RMR14 classification refines the rating of the discontinuities with four factors, including continuity, roughness, infilling, and weathering, each of which is rated by five points. For the marine bedrock, the continuity of the discontinuities is difficult to access due to the limitations of drilling investigations. Therefore, a modified evaluation of the ratings of the discontinuities, R3, is presented in Table 6.

2.2.5. Rating Modification of Intact Rock Alterability R4

The RMR14 classification introduces an index for evaluating intact rock alterability, which matches the characteristics of the marine bedrock. This index is represented by R4 in the OMR classification, which highlights the fact that the rock is heavily softened and disintegrated by seawater. For offshore wind engineering with aggressive media (seawater), the rating of R4 is taken as 35 points and is as important as rock strength, R4. The rating of R4 is based on a stepwise rating, and a continuity refinement equation is used instead of a stepwise rating approach to obtain Figure 5 and Equation (7). The results of the modified evaluation of the ratings of intact rock alterability, R4, are presented in Table 7. The ratings of R4 corresponding to Id2 that are not listed in Table 7 can be calculated by using Equation (7).
R 4 = 0.35 I d 2

2.3. Determination of Adjustment Factor for the Effect of Time Ft

The monopile foundations for offshore wind turbines must be able to resist the cycling loads of wind and water to which the offshore wind turbine is subjected over a typical design life of at least 25 years [39]. Such a long period of continuous action will make the pile-rock contact surface continuously separate. The seawater will gradually erode the rock around the monopile foundation, which will have a significant impact on the safety and long-term stability of the offshore wind turbine. Therefore, the deterioration of the marine bedrock during the long-term operation phase should be sufficiently considered at the design stage. The adjustment factor for the effect of time, Ft, in the OMR classification can reflect the deterioration pattern of the marine bedrock over time.
However, the erosion time of the offshore wind monopile foundation is usually more than decades, and it is impractical to perform seawater erosion tests under the same environmental conditions due to the huge time and economic costs. Thus, it is necessary to conduct accelerated tests for seawater erosion. The accelerated test shortens the test period by enhancing the test conditions while keeping the failure mechanism unchanged. This test method improves efficiency and reduces cost, which has been widely used in geological engineering [40,41,42,43,44].
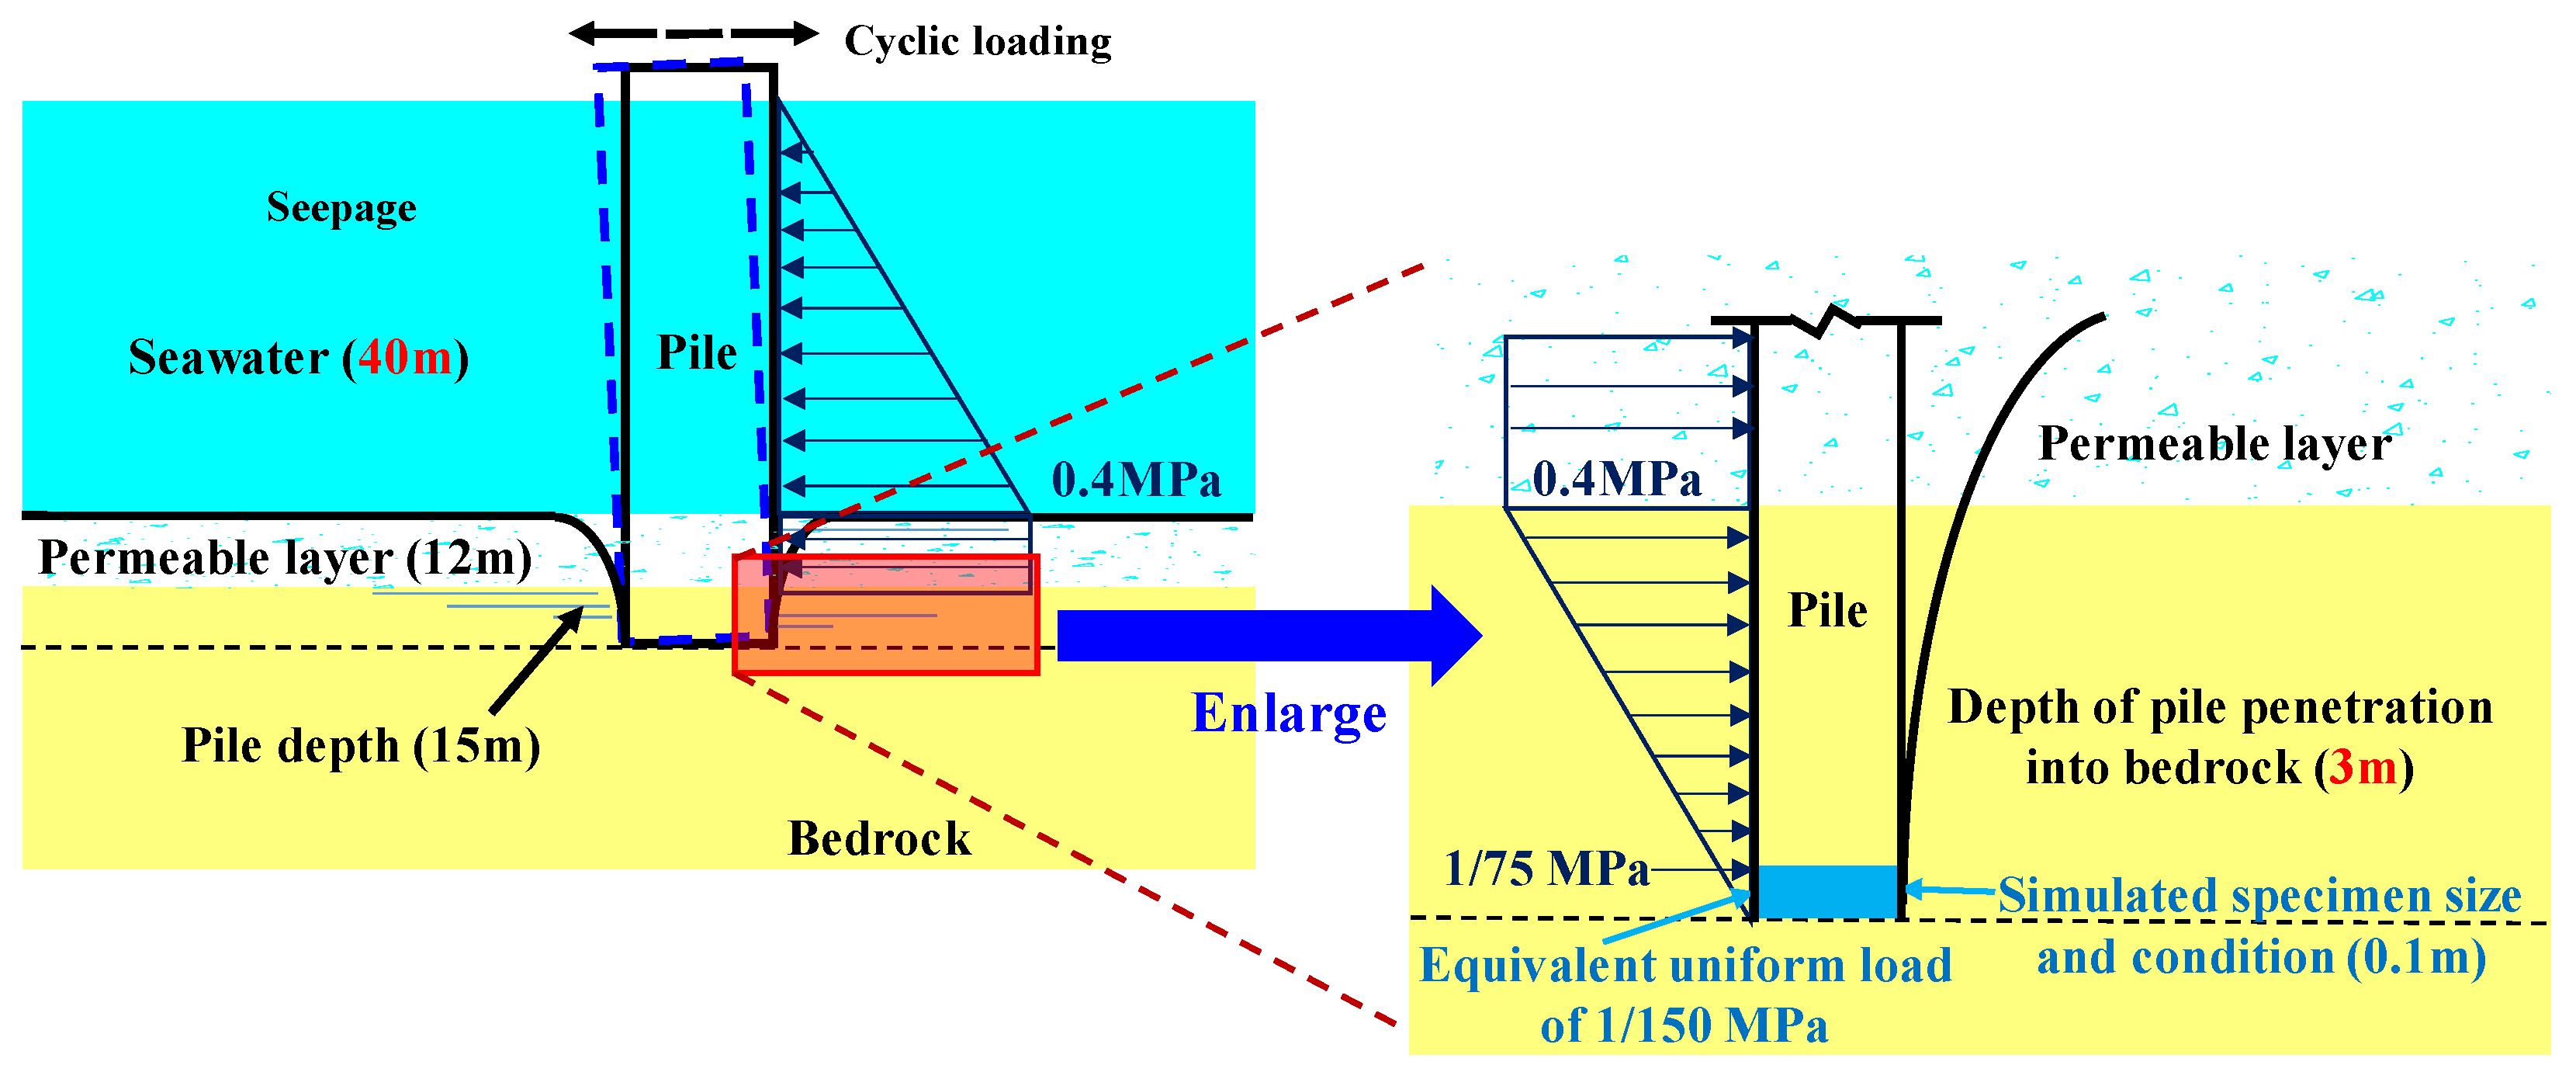
In order to rationally design the accelerated test of seawater erosion, mechanical analysis of the marine bedrock for an offshore wind monopile foundation is required. Figure 6 simulates the force condition of the monopile foundation. The seawater depth in the offshore wind engineering area is generally less than 40 m, so the seawater depth is considered to be 40 m. The depth of the monopile foundation is 10 m, of which 8 m is the permeable layer and 2 m is the bedrock layer. The 8 m permeable layer consists of submarine sediments, silt, and highly weathered rock layers, which can transmit a water pressure of 0.4 MPa. The 2 m bedrock layer is a weakly weathered rock layer, and its water pressure decreases linearly from 0.4 MPa to 0 MPa.
The rock specimen, seawater, and equipment for the accelerated test of seawater erosion are shown in Figure 7. Three common types of seabed bedrock represented by granite, tuff, and sandstone were tested (namely plutonic, volcanic, and sedimentary rocks). These rocks are manufactured into specimens with a height of 100 mm and a diameter of 50 mm. From Figure 6, it can be calculated that the pressure exerted on the rock specimen decreases linearly from 1/75 MPa to 0 MPa, which corresponds to a uniform load of 1/150 MPa. The seawater was taken from Fujian, China, and there was no inland freshwater or domestic sewage injection in the area, which is relatively close to the quality of the water under offshore conditions, totaling about 27 L of seawater. Seawater environments at different depths can be simulated using a deep-water simulation system (Figure 7c), which can apply pressures from 0 to 0.7 MPa. Considering that the offshore wind turbine is usually operated for decades and taking into account the test conditions, experimental time, and geological conditions of the marine bedrock, the test pressure was set to be 0.5 MPa. Therefore, the acceleration factor is 75, which is calculated by 0.5/(1/150). Rock specimens are immersed for 3, 7, 15, 30, 45, and 60 days to simulate seawater erosion for 225, 525, 1125, 2250, 3375, and 4500 days. This implies that the accelerated test can simulate up to more than 12 years of seawater erosion. After the preset time has been reached, the rock specimens are removed immediately to test the physico-mechanical parameters and evaluate the discontinuity conditions. Finally, the OMR ratings of the rock specimens after different erosion times are determined, as listed in Table 8. The Ft rating is determined by the difference between the OMR rating after seawater erosion and the OMR in the natural state. Deviation indicates the variation between the OMR after the seawater erosion and the natural state.
It can be found that at the initial stage of the accelerated test (3 d–15 d), the OMR ratings of the three rock types decreased rapidly with an increase in time, whereas, at the later stage of the accelerated test (45 d–60 d), the OMR ratings stabilized. Among the three rock types, plutonic rock is the least affected by seawater erosion because of its dense structure. Its OMR rating after 60 days of accelerated test simulation decreases by only 8.51%. For the sedimentary rock, the deterioration of the rock by seawater erosion is the most significant due to high porosity. Its OMR rating decreases by 38.46% after 60 days of the accelerated test. The effect of seawater on volcanic rock is intermediate between the two rock types above, with a decrease in OMR rating of 15.61% after 60 days of the accelerated test. It is worth noting that the variation in Ft with time shows a roughly logarithmic trend, so the quantitative correlations between Ft and time for the three rock types can be fitted with Equation (8) based on the accelerated test results in Table 8.
F t = k log b ( t + 1 )
where t is the time simulated by the accelerated test in days. k and b are two fitting parameters related to the rock types. Figure 8 presents the fitting results of Ft and time for three rock types.
Figure 8 indicates that the logarithmic form fits the quantitative correlations between Ft and t well, with a high R2. Moreover, this fitting correlation ensures that Ft is 0 at the natural state and stabilizes at the end. Based on the quantitative correlations between Ft and t, the Ft ratings of offshore wind turbines over a 15-year period are given in Table 9. For times longer than 15 years and the times not included in the table, the corresponding Ft ratings can be estimated using the fitted quantitative correlations in Figure 8.
There are different quantitative correlations for Ft and t for different rock types because only three typical rocks of the three rock types (plutonic rock, volcanic rock, and sedimentary rock) were tested, and not all of the rocks of the three rock types are included. It is not enough to construct reasonable correlations between k, b, and rock type, which deserves further study. However, it is sufficiently competent for engineering applications. By combining the results in Table 4, Table 5, Table 6, Table 7, Table 8 and Table 9, the OMR classification applicable to the marine bedrock of monopile foundations for offshore wind turbines is proposed in Table A1, which is presented in Appendix A.
In Table 10, the rating indices in the rock mass classification and the respective advantages of the OMR, RMR14, and RMR classification are compared. It can be found that the RMR14 and RMR classifications are more suitable for overland geological engineering, such as for tunnels and slopes. The OMR classification applies to the marine bedrock of an offshore wind foundation without considering the groundwater conditions. Meanwhile, the OMR classification can reflect the effect of time regarding seawater erosion, which is the key to its applicability to marine bedrock.

3. Ultimate End-Bearing Capacity of Offshore Wind Monopile Foundation

With the development of offshore wind engineering in open and deep oceans, the foundation is subjected to higher loads, resulting in a larger diameter regarding the commonly used rock-socketed monopile foundation. The bearing capacity of the rock-socketed monopile foundation consists of the friction around the pile and the resistance at the end. At present, the standards have low subfactors for calculating the ultimate end-bearing capacity of the monopile foundations. There is a considerable safety reserve in the design, and the excessive bearing capacity surplus is unfavorable to the economy of engineering. Therefore, a reasonable calculation of the ultimate end-bearing capacity of the monopile foundation is of great significance to reduce the waste of resources and cost under the premise of satisfying a safety reserve. Based on the OMR classification, the calculation of the ultimate end-bearing capacity of the offshore wind monopile foundation is proposed, which considers the effect of time regarding the sea on the deterioration of bedrock quality.

3.1. Theoretical Calculation of Ultimate End-Bearing Capacity for a Monopile Foundation

When the ratio of the rock-socketed depth to the diameter of the monopile foundation is small, the failure pattern of the rock mass at the end of the monopile foundation is overall sliding, which produces a sliding wedge, as shown in Figure 9 [5,45,46]. Zhang and Einstein [46] proposed a method for calculating the ultimate end-bearing capacity of rock mass based on the two-dimensional (2D) Hoek-Brown strength criterion, which considers the effect of the self-weight of rock and permeable layers above the monopile foundation end. The expression of the Hoek-Brown strength criterion is given in Equation (9) [23,47].
σ 1 = σ 3 + σ c ( m b σ 3 σ c + s ) a
where σ1 and σ3 are the major and minor principal stresses. Mb, s, and a are the rock mass parameters. The relationship between rock mass parameters and OMR classification is discussed in Section 3.2.
Figure 9 shows the failure model of the bedrock at the end of the monopile foundation based on the Hoek-Brown strength criterion. The hs and hr are the heights of the overlying soil and bedrock, respectively; qs is the self-weight of the overlying rock and soil layer; d is the pile diameter; and qmax is the ultimate end-bearing capacity. Considering the influence of the self-weight stress of the overlying rock and soil layer, the calculation procedure for the ultimate end-bearing capacity of the monopile foundation is as follows.
According to the overall sliding failure analysis, wedge B is in a passive stress state, so the minor principal stress is the self-weight of the overlying rock and soil layer qs. When wedge B reaches the ultimate failure state, its major principal stress σ1B is horizontal and satisfies Equation (10).
σ 1 B = q s + ( m b σ c q s + s σ c 2 ) a
where wedge A is in the active stress state, the qmax is the major principal stress, and the minor principal stress, σ3A, is in the horizontal direction. When wedge A reaches the ultimate failure state, its major and minor principal stresses satisfy Equation (11).
q max = σ 3 A + ( m b σ c σ 3 A + s σ c 2 ) a
Based on the boundary continuity condition, σ3A = σ1B, the ultimate end-bearing capacity of the monopile foundation can be calculated as per Equation (12).
q max = q s + ( m b σ c q s + s σ c 2 ) a + [ m b σ c q s + m b σ c ( m b σ c q s + s σ c 2 ) a + s σ c 2 ] a

3.2. Determination of Rock Mass Parameters based on OMR Classification

The rock mass parameters mb, s, and a are the important factors for determining the ultimate end-bearing capacity of the monopile foundations. mb is a dimensionless empirical parameter for the different rock masses. s reflects the degree of fragmentation of the rock mass. Hoek et al. [48] determined the rock mass parameters mb, s, and a based on the geological strength indicator (GSI), as expressed in Equation (13).
m b = exp ( GSI 100 28 14 D ) m i s = exp ( GSI 100 9 3 D ) a = 0.5 + 1 6 [ exp ( GSI / 15 ) exp ( 20 / 3 ) ]
where mi is a parameter reflecting the softness or hardness of the rock, which can be obtained from the empirical table [49,50,51]. D is a parameter reflecting the extent of disturbance of the surrounding rock caused by the effects of blasting and stress relief [48,52]. The monopile foundation is constructed by a machine, and D can be selected as 0.5 for the marine bedrock.
The GSI classification considers only the structural conditions of rock mass and ignores the rock strength and the effect of time regarding seawater erosion, resulting in an inaccurate ultimate end-bearing capacity of monopile foundations calculated from the rock mass parameters determined by GSI. It is recommended to determine the rock mass parameters based on the OMR classification.
Zhang et al. [38] systematically proposed a quantitative correlation between RMR14 and GSI based on the studies on the correlations of basic classified indices.
RMR 14 = 0.910 GSI + 18 . 933
The OMR classification inherits the indices of the RMR14 classification except for the groundwater condition, with a total rating of 100 points. The OMR classification modifies the ratings of the indices based on the RMR14 classification and adds an adjustment factor for the effect of time to make it applicable to the marine bedrock. Moreover, the quantitative correlation [38] between RMR14 and GSI also neglects the groundwater condition, so OMR can directly replace RMR14 in Equation (14) to obtain the following equation.
OMR = RMR 14 OMR = 0.910 GSI + 18 . 933
Ultimately, the rock mass parameters mb, s, and a can be determined based on the OMR classification as follows:
m b = exp ( OMR 109.933 25.48 12.74 D ) m i s = exp ( OMR 109.933 8.19 2.73 D ) a = 0.5 + 1 6 [ exp ( OMR 18.933 13.65 ) exp ( 20 3 ) ]

4. Application in Practical Engineering

The theoretical calculation method of the ultimate end-bearing capacity of the monopile foundation was applied to an offshore wind farm on the southeast coast of China. The reliability of the theoretical calculation method and the 3D numerical simulation were validated by in situ tests. The theoretical and numerical results were used to guide the design and construction of offshore wind engineering.

4.1. Engineering Background

The offshore wind farm is located on the southeast coast of China, with an average water depth of about 40 m at the site. The map of the location of this site is shown in Figure 10a. It is proposed to build 5.0~7.5 MW offshore wind turbines, the foundations of which will adopt a rock-socketed monopile foundation with a diameter, d, of 2 m. Typical borehole surveys show approximately 12 m of permeable layers, including 2 m of marine sediments, 5 m of silt, and 5 m of silty clay and sandstone. The rock layers below the permeable layer are bedrock layers, including tuff and weakly weathered granite. The rock-socketed depth of the monopile foundation is 3 m, and the holding layer is tuff. The tuff is evaluated according to the OMR classification, with an original rating of 65 points. For the convenience of theoretical calculation and numerical simulation, the rock layers are divided into permeable and bedrock layers, and their geological parameters are listed in Table 11.

4.2. In Situ Test and 3D Numerical Simulation

The in situ test was conducted at the location of the offshore wind turbine No. 32. The test pile was a 45 m long cast pile with a diameter of 2 m, a wall thickness of 28 mm, and a concrete grade of C35. The ultimate bearing capacity was tested by using the rapid load maintenance method using the CH-24000 YG270-2300×8 and CH-32000 YG270-2300×8 load boxes, the JCQ-503C static load meter, and the CYB-10S pressure transducer. The actual ultimate end-bearing capacity of the monopile foundation can be obtained from the in situ tests, with the test pile shown in Figure 10b. The test result indicates that the measured ultimate end-bearing capacity, Pm, is 58,659 KN. It is worth noting that the measured ultimate end-bearing capacity includes both the lateral friction resistance and the end-bearing capacity.
The numerical simulation was carried out using the 3D explicit finite difference program FLAC3D. In order to improve the computational efficiency, the geotechnical layers are considered semi-infinite objects, and the following assumptions are made [53,54]:
  • The monopile and geotechnical layers are homogeneous, continuous isotropic materials.
  • The model is fixed vertically to all nodes at the bottom, while the front, back, left, and right sides are fixed normally to all nodes.
  • The pile-permeable layer and the pile-bedrock layer contact surfaces are smooth, which is the ideal contact surface for interfacial occlusion.
  • Monopile is an elastic material, while the geotechnical layers are elastoplastic materials, the constitutive relation of which follows the Hoek-Brown criterion.
  • The effect of time on the ultimate end-bearing capacity of the monopile foundation is expressed by the reduction in the rock mass parameters.
According to the geological conditions listed in Table 11 and the parameters of the test pile, one-half of the semi-infinite monopile object is used to establish the numerical model (one-to-one) for the actual situation, as shown in Figure 10c. The numerical model is meshed with 15,000 cells and 15,300 nodes. The monopile is set in the center of the model, and the boundary conditions are consistent with the in situ test. Based on the q-s curve of the numerical simulation (Figure 11), the q value of the displacement plunge can be converted into the numerical simulated ultimate bearing capacity, Pn. For this test pile, its numerical simulated ultimate end-bearing capacity, Pn, is 53,380 KN.

4.3. Validation for the Theoretical Calculation Method and 3D Numerical Simulation

In order to validate the reliability of the theoretical calculation method and the numerical simulation, the theoretical and numerical results at different times are compared, as presented in Figure 12, where the effect of the times on the theoretical and numerical results is reflected by the variation in the OMR ratings. The OMR ratings of the tuff for different times are 65 (0 years), 59 (0.5 years), 57 (3 years), 56 (8 years), and 55 (15 years). The theoretical results were obtained by using Equation (12). The differences between the measured ultimate end-bearing capacity of the test pile and the theoretical and numerical results were also compared at the beginning (t = 0). It can be found that the theoretical calculation and numerical simulation results for the ultimate end-bearing capacity without seawater erosion are very similar to the measured results, with a relative error of less than 9%. The measured results are larger than the theoretical and numerical results because the measured ultimate end-bearing capacity includes lateral friction resistance. Moreover, both the theoretical and numerical ultimate end-bearing capacities show a logarithmic decrease with time. The ultimate end-bearing capacity decreases by approximately 30% over a period of 15 years. The theoretical results are always larger than the numerical results, with a relative error of less than 7%. The theoretical and numerical results were obtained by using two different methods. The average relative error of 7% between them indicates that the theoretical and numerical results are sufficiently similar. The numerical simulation results are biased in favor of safety. Moreover, both theoretical and numerical results of the ultimate end-bearing capacity with time show a rapid decrease followed by a gentle decrease, and the trends are almost the same. To sum up, Figure 12 indicates that the theoretical calculation method and the numerical simulation of the offshore wind monopile foundation are reliable.

4.4. Performance of Offshore Wind Monopile Foundations after Long-Term Operation

From the above analysis, the theoretical calculation method and established numerical model are reliable and reasonable, which can be used to reflect the variation in the ultimate end-bearing capacity and deformation characteristics during the operation of offshore wind engineering. Moreover, the theoretical calculation method and numerical model consider the effect of time regarding seawater erosion, which can be used to evaluate the performance of the offshore wind monopile foundation after long-term operation.
Figure 13 and Figure 14 show the plastic zone and displacement of offshore wind monopile foundations during normal operation. The numerical simulation results indicate that plastic zones similar to sliding wedges can be found on both edges of the bottom of the monopile foundation, which is consistent with the theoretical analysis in Figure 9. With the increase in operation time, the plastic zone is enlarged. The displacement occurs mainly at the bottom of the monopile foundations and increases slightly with time. The theoretical and numerical results are used to guide the design and construction of this offshore wind engineering. This offshore wind engineering project has been operating normally for 8 years, and the detected displacement is 15.3 mm, which is slightly smaller than the numerical simulation results.

5. Conclusions

In this study, an ocean rock mass classification (OMR) system applicable to the marine bedrock of the offshore wind monopile foundation is proposed, from which the ultimate end-bearing capacity of an offshore wind monopile foundation is calculated. Our conclusions are drawn as follows:
  • Based on the RMR14 classification, the OMR classification is proposed with full consideration of the factors affecting the quality of marine bedrock. The ratings of four geological indices (R1, R2, R3, and R4) in the OMR classification are reset to 35, 20, 10, and 35 points, respectively, based on the AHP analysis. R1, R2, and R4 can also be continuously modified according to the geological conditions of the offshore wind monopile foundation. It is worth noting that the OMR classification does not apply to all marine bedrock. The OMR classification is only suitable for the marine bedrock of an offshore wind foundation, where the pile socket depth is within two times the pile diameter, with plutonic, volcanic, and sedimentary rock types.
  • The adjustment factor for the effect of time, Ft, was determined based on the decrease in OMR ratings in the accelerated test of seawater erosion. The 60-day accelerated test can simulate seawater erosion for up to 12 years, and the results show that seawater erosion has the least effect on plutonic rocks and the largest effect on sedimentary rocks. The quantitative correlation between Ft and time can be expressed uniformly by Equation (8).
  • Based on the overall sliding failure mode of the rock mass, the theoretical calculation method of the ultimate end-bearing capacity of the offshore wind monopile foundation is obtained. The rock mass parameters therein are determined by the OMR classification, making the calculation method applicable to marine bedrock and can reflect the effect of time regarding seawater erosion.
  • The theoretical calculation method for the ultimate end-bearing capacity was employed in an offshore wind engineering project. The offshore wind monopile foundation was numerically modeled in 3D. The in situ test indicates that the theoretical and numerical results are similar to the measured results, with a relative error of less than 9%, which implies that the theoretical calculation method and numerical model are reliable.
  • This offshore wind engineering project was constructed based on theoretical and numerical results. The offshore wind foundation has been operating for 8 years, and its displacement is 15.3 mm, which is less than the numerical result of 16.94 mm.
The OMR classification considers the geological conditions of marine bedrock and the effect of time regarding seawater erosion. The theoretical calculation method based on the OMR classification can accurately determine the ultimate end-bearing capacity of the offshore wind power monopile foundation and guide the design and construction of offshore wind engineering projects. However, only three rock types have been subjected to the accelerated test of seawater erosion; thus, we did not cover all types of marine bedrock. Accelerated tests of more rock types are expected to validate and modify the proposed OMR classification, especially for other rocks belonging to plutonic, volcanic, and sedimentary rock types.

Author Contributions

Conceptualization, Q.Z.; methodology, Y.S. and X.G.; software, X.W. and X.G.; validation, Y.S. and Y.L.; formal analysis, C.Z.; investigation, Y.S. and Y.L.; resources, Q.Z.; data curation, C.Z. and X.W.; writing—original draft preparation, Y.S. and X.G.; writing—review and editing, Q.Z.; visualization, C.Z. and X.G.; supervision, Q.Z.; project administration, Q.Z.; funding acquisition, Q.Z. All authors have read and agreed to the published version of the manuscript.

Funding

This research was funded by the National Natural Science Foundation of China, grant numbers 41972277 and 42277158.

Institutional Review Board Statement

Not applicable.

Informed Consent Statement

Not applicable.

Data Availability Statement

Data are contained within the article.

Conflicts of Interest

Author Yifeng Lin was employed by the company: Shanghai Investigation, Design & Research Institute Co., Ltd., Shanghai 200434, China. The remaining authors declare that the research was conducted in the absence of any commercial or financial relationships that could be construed as a potential conflict of interest.

Appendix A

At the design stage of monopile foundations for offshore wind turbines, the physical and mechanical parameters of the marine bedrock and the discontinuity conditions are tested to determine the R1, R2, R3, and R4 indices. Based on the design life of the offshore wind turbine and the type of the marine bedrock, the effect of time on the quality of the marine bedrock is determined as Ft. Finally, the five indices are added together to obtain the OMR rating, which determines the quality of the marine bedrock and guides the design and construction of offshore wind turbines. The detailed ratings for the indices of the OMR classification are summarized in Table A1.
Table A1. Complete rating for OMR classification.
ParametersRatings
R1σc (MPa)>250175100755037.525151<1
Rating352819.516121085.510
Continuous rating equation R 1 = 0.98 σ c 0.65
R2RQD (%)100959082.57562.55037.5250
Rating20191816.5151310.5861
Continuous rating equation R 2 = 0.187 RQD + 1.298
R3RoughnessVery roughRoughSmoothSlickensided
Rating42.510
InfillingHard infillingSoft infilling
<5 mm>5 mm<5 mm>5 mm
Rating3110
WeatheringUnweatheredModerately weatheredHighly weatheredDecomposed
Rating320.50
R4Id2 (%)100908070605040302010
R4 rating3531.52824.52117.51410.573.5
Continuous rating equation R 4 = 0.35 I d 2
FtErosion time0 years3 years6 years9 years12 years15 years
Plutonic rock0−5−5.5−6−6−6
Continuous rating equation F t = 0.69 log 0.38 ( t + 1 ) *
Volcanic rock0−8−9−9.5−9.5−10
Continuous rating equation F t = 0.89 log 0.46 ( t + 1 ) *
Sedimentary rock0−15−16.5−17−17.5−18
Continuous rating equation F t = 0.61 log 0.75 ( t + 1 ) *
OMR rating OMR = R 1 + R 2 + R 3 + R 4 + F t
* t in the equations denote the erosion time in days.

References

  1. Premalatha, M.; Abbasi, T.; Abbasi, S.A. Wind energy: Increasing deployment, rising environmental concerns. Renew. Sustain. Energy Rev. 2014, 31, 270–288. [Google Scholar] [CrossRef]
  2. Wu, X.; Hu, Y.; Li, Y.; Yang, J.; Duan, L.; Wang, T.; Adcock, T.; Jiang, Z.; Gao, Z.; Lin, Z. Foundations of offshore wind turbines: A review. Renew. Sustain. Energy Rev. 2019, 104, 379–393. [Google Scholar] [CrossRef]
  3. Huang, H.; Hu, Z.; Dai, W.; Xin, J.; Shi, W. Development status and trend of offshore wind power. Energy Energy Conserv. 2020, 6, 51–53. [Google Scholar]
  4. Zhang, C. Study on the Degradation of Rock Mechanical Properties and Erosion of Mesostructures by Seawater. Master’s Thesis, Southeast University, Nanjing, China, 2021. [Google Scholar]
  5. Liu, J. The Deterioration of Granite by Seawater and Study on Its Effect on the End Bearing Capacity of Rock-Socketed Piles. Master’s Thesis, Southeast University, Nanjing, China, 2018. [Google Scholar]
  6. Hu, H.; Hu, Z.; Zhong, K.; Xu, J.; Wu, P.; Zhao, Y.; Zhang, F. Long-term offshore wind power prediction using spatiotemporal kriging: A case study in China’s Guangdong Province. Energy Explor. Exploit. 2020, 38, 703–722. [Google Scholar] [CrossRef]
  7. Li, Y.; Huang, X.; Tee, K.F.; Li, Q.; Wu, X.-P. Comparative study of onshore and offshore wind characteristics and wind energy potentials: A case study for southeast coastal region of China. Sustain. Energy Technol. Assess. 2020, 39, 100711. [Google Scholar] [CrossRef]
  8. Chen, Y.; Lin, H. Overview of the development of offshore wind power generation in China. Sustain. Energy Technol. Assess. 2022, 53, 102766. [Google Scholar] [CrossRef]
  9. Gasch, R.; Twele, J. Wind Power Plants: Fundamentals, Design, Construction and Operation; Springer Science & Business Media: Berlin/Heidelberg, Germany, 2011. [Google Scholar]
  10. Jiang, P. Study on Several Problems of Offshore Wind Farm Wind Turbine Foundation Design. Master’s Thesis, Dalian University of Technology, Dalian, China, 2012. [Google Scholar]
  11. Byrne, B.W.; Houlsby, G.T. Foundations for offshore wind turbines. Philos. Trans. R. Soc. Lond. Ser. A Math. Phys. Eng. Sci. 2003, 361, 2909–2930. [Google Scholar] [CrossRef]
  12. Zhang, Q.; Zhang, C.; Lin, Y.; Li, Y.; Shen, Y.; Pei, Y. Experimental study on deterioration of bedrock strength and P-wave velocity by pressurized seawater. Geomech. Geophys. Geo-Energy Geo-Resour. 2023, 9, 121. [Google Scholar] [CrossRef]
  13. Zhang, Y.; Hu, X.; Wang, X.; Hu, H. Research on rock mass quality classification system of sea reefs as bridge foundation. J. Eng. Geol. 2010, 18, 431. [Google Scholar]
  14. Liu, Z.; Dang, W. Rock quality classification and stability evaluation of undersea deposit based on M-IRMR. Tunn. Undergr. Space Technol. 2014, 40, 95–101. [Google Scholar] [CrossRef]
  15. Cheng, Y.; Zhou, Y.; Chu, W.; Su, Z. Load-bearing Behavior of Offshore Rock Socketed Monopile Foundation Regarding Different Rock Mass Classification. In Proceedings of the Journal of Physics: Conference Series; IOP Publishing: Bristol, UK, 2022; p. 12088. [Google Scholar]
  16. Zhang, Q.; Zhang, C.; Lin, Y.; Li, Y.; Shen, Y.; Pei, Y. Study on Meso-Structural Evolution of Bedrock Beneath Offshore Wind Turbine Foundation in Pressurized Seawater. J. Mar. Sci. Eng. 2023, 11, 2260. [Google Scholar] [CrossRef]
  17. Risnes, R.; Haghighi, H.; Korsnes, R.; Natvik, O. Chalk–fluid interactions with glycol and brines. Tectonophysics 2003, 370, 213–226. [Google Scholar] [CrossRef]
  18. Heggheim, T.; Madland, M.; Risnes, R.; Austad, T. A chemical induced enhanced weakening of chalk by seawater. J. Pet. Sci. Eng. 2005, 46, 171–184. [Google Scholar] [CrossRef]
  19. Hu, K.; Feng, Q.; Wang, X. Experimental research on mechanical property of phyllite tunnel surrounding rock under different moisture state. Geotech. Geol. Eng. 2017, 35, 303–311. [Google Scholar] [CrossRef]
  20. Bieniawski, Z.T. Engineering classification of jointed rock masses. Civil Eng. S. Afr. 1973, 15, 335–343. [Google Scholar]
  21. Bieniawski, Z.T. Engineering Rock Mass Classifications: A Complete Manual for Engineers and Geologists in Mining, Civil, and Petroleum Engineering; John Wiley and Sons: New York, NY, USA, 1989. [Google Scholar]
  22. Barton, N.; Lien, R.; Lunde, J. Engineering classification of rock masses for the design of tunnel support. Rock Mech. 1974, 6, 189–236. [Google Scholar] [CrossRef]
  23. Hoek, E. Strength of rock and rock masse. ISRM News J. 1994, 2, 4–16. [Google Scholar]
  24. Hoek, E.; Kaiser, P.; Bawden, W. Support of Underground Excavations in Hard Rock; A. A Balkema: Rotterdam, The Netherlands, 1995. [Google Scholar]
  25. GB/T 50218-2014; Standard for Engineering Classification of Rock Mass. Standardization Administration of China: Beijing, China, 2014.
  26. Wu, A.; Zhao, W.; Zhang, Y.; Fu, X. A detailed study of the CHN-BQ rock mass classification method and its correlations with RMR and Q system and Hoek-Brown criterion. Int. J. Rock Mech. Min. Sci. 2023, 162, 105290. [Google Scholar] [CrossRef]
  27. Zhang, Q.; Shen, Y.; Pei, Y.; Wang, X.; Wang, M.; Lai, J. Determination of Integrity Index Kv in CHN-BQ Method by BP Neural Network Based on Fractal Dimension D. Fractal Fract. 2023, 7, 546. [Google Scholar] [CrossRef]
  28. Naithani, A.K. RMR-A system for characterizing rock mass classification: A case study from Garhwal Himalaya, Uttarakhand. J. Geol. Soc. India 2007, 70, 627. [Google Scholar]
  29. Rose, A.; DiGioia, A.; Hirany, A. Use of Rock Mass Rating (RMR) to Estimate Rock Properties For Laterally Loaded, Rock-Socketed Transmission Line Foundations. In Proceedings of the ARMA US Rock Mechanics/Geomechanics Symposium, Washington, DC, USA, 7–10 July 2001; p. ARMA–01-1223. [Google Scholar]
  30. Santos de Alencar, A.T.; Galindo Aires, R.Á.; Melentijevic, S. Bearing capacity of foundation on rock mass depending on footing shape and interface roughness. Geomech. Eng. 2019, 18, 391–406. [Google Scholar] [CrossRef]
  31. Bieniawski, Z. The geomechanics classification in rock engineering applications. In Proceedings of the ISRM Congress, Montreux, Switzerland, 2–8 September 1979; p. ISRM–4CONGRESS-1979-1117. [Google Scholar]
  32. Bieniawski, Z. Tunnel DESIGN by Rock Mass Classifications; A. A Balkema: Rotterdam, The Netherlands, 1979; Volume 79. [Google Scholar]
  33. Celada, B.; Tardáguila, I.; Varona, P.; Rodríguez, A.; Bieniawski, Z. Innovating tunnel design by an improved experience-based RMR system. In Proceedings of the World Tunnel Congress, Iguassu Falls, Brazil, 9–4 May 2014; pp. 1–9. [Google Scholar]
  34. Köken, E.; Top, S.; Özarslan, A. Assessment of rock aggregate quality through the analytic hierarchy process (AHP). Geotech. Geol. Eng. 2020, 38, 5075–5096. [Google Scholar] [CrossRef]
  35. Ishizaka, A.; Labib, A. Analytic hierarchy process and expert choice: Benefits and limitations. OR Insight 2009, 22, 201–220. [Google Scholar] [CrossRef]
  36. Saaty, T.L. What is the Analytic Hierarchy Process? Springer: Berlin/Heidelberg, Germany, 1988. [Google Scholar]
  37. Saaty, T.L. Decision making with the analytic hierarchy process. Int. J. Serv. Sci. 2008, 1, 83–98. [Google Scholar] [CrossRef]
  38. Zhang, Q.; Huang, X.; Zhu, H.; Li, J. Quantitative assessments of the correlations between rock mass rating (RMR) and geological strength index (GSI). Tunn. Undergr. Space Technol. 2019, 83, 73–81. [Google Scholar] [CrossRef]
  39. Şahin, A.D. Progress and recent trends in wind energy. Prog. Energy Combust. Sci. 2004, 30, 501–543. [Google Scholar] [CrossRef]
  40. Wang, L. Accelerated Experimental Study on Permeability for Broken Mudstone with Mass Loss. Ph.D. Thesis, China University of Mining and Technology, Xuzhou, China, 2014. [Google Scholar]
  41. Escobar, L.A.; Meeker, W.Q. A review of accelerated test models. Stat. Sci. 2006, 21, 552–577. [Google Scholar] [CrossRef]
  42. Fereidooni, D.; Khajevand, R. Utilization of the accelerated weathering test method for evaluating the durability of sedimentary rocks. Bull. Eng. Geol. Environ. 2019, 78, 2697–2716. [Google Scholar] [CrossRef]
  43. Molina, E.; Cultrone, G.; Sebastián, E.; Alonso, F. Evaluation of stone durability using a combination of ultrasound, mechanical and accelerated aging tests. J. Geophys. Eng. 2013, 10, 35003. [Google Scholar] [CrossRef]
  44. Akin, M.; Özsan, A. Evaluation of the long-term durability of yellow travertine using accelerated weathering tests. Bull. Eng. Geol. Environ. 2011, 70, 101–114. [Google Scholar] [CrossRef]
  45. Zhang, Q.; Liu, J.; Dai, G.; Gong, W. Calculation methods for ultimate end bearing capacity of large diameter rock-socketed piles. J. Southeast Univ. (Nat. Sci. Ed.) 2018, 48, 118–124. [Google Scholar]
  46. Zhang, L.; Einstein, H.H. End bearing capacity of drilled shafts in rock. J. Geotech. Geoenviron. Eng. 1998, 124, 574–584. [Google Scholar] [CrossRef]
  47. Hoek, E.; Wood, D.; Shah, S. A modified Hoek–Brown failure criterion for jointed rock masses. In Proceedings of the Rock Characterization: ISRM Symposium, Eurock’92, Chester, UK, 14–17 September 1992; pp. 209–214. [Google Scholar]
  48. Hoek, E.; Carranza-Torres, C.; Corkum, B. Hoek-Brown criterion–2002 edition. In Proceedings of the NARMS-TAC, Toronto, ON, Canada, 7–10 July 2002; pp. 267–273. [Google Scholar]
  49. Zhu, H.; Zhang, Q.; Zhang, L. Review of research progresses and applications of Hoek-Brown strength criterion. Chin. J. Rock Mech. Eng. 2013, 32, 1945–1963. [Google Scholar]
  50. Hoek, E.; Brown, E.T. Practical estimates of rock mass strength. Int. J. Rock Mech. Min. Sci. 1997, 34, 1165–1186. [Google Scholar] [CrossRef]
  51. Marinos, P.; Hoek, E. Estimating the geotechnical properties of heterogeneous rock masses such as flysch. Bull. Eng. Geol. Environ. 2001, 60, 85–92. [Google Scholar] [CrossRef]
  52. Hoek, E.; Brown, E. The Hoek–Brown failure criterion and GSI–2018 edition. J. Rock Mech. Geotech. Eng. 2019, 11, 445–463. [Google Scholar] [CrossRef]
  53. Mu, R.; Pu, S.; Huang, Z.; Li, Y.; Zheng, P.; Liu, Y.; Liu, Z.; Zheng, H. Determination of ultimate bearing capacity of uplift piles in combined soil and rock masses. Rock Soil Mech. 2019, 40, 2825. [Google Scholar]
  54. Pu, S.; Zhu, Z.; Song, W. A method for calculating the ultimate bearing capacity of uplift piles in combined soil and rock mass. Eur. J. Environ. Civ. Eng. 2022, 26, 2158–2183. [Google Scholar] [CrossRef]
Figure 1. Schematic diagram of seawater erosion of the rock around a monopile foundation in the operation phase.
Jmse 11 02310 g001
Figure 2. AHP structure for determining OMR classification weights.
Jmse 11 02310 g002
Figure 3. Continuity modification of the ratings of the strength of intact rock, R1, in OMR classification.
Jmse 11 02310 g003
Figure 4. Continuity modification of the ratings of the structural integrity of rock mass, R2, in OMR classification.
Jmse 11 02310 g004
Figure 5. Continuity modification of the ratings of intact rock alterability, R4, in OMR classification.
Jmse 11 02310 g005
Figure 6. Schematic diagram of the force on marine bedrock for offshore wind monopile foundations.
Jmse 11 02310 g006
Figure 7. Specimens and equipment for accelerated seawater erosion tests: (a) rock specimens; (b) seawater; (c) deep-water simulation system.
Jmse 11 02310 g007
Figure 8. Quantitative correlations between the adjustment factor for the effect of time, Ft, and erosion time, t, for three rock types.
Jmse 11 02310 g008
Figure 9. Overall sliding failure pattern of rock mass at the end of the monopile foundation [5,39,40].
Jmse 11 02310 g009
Figure 10. Site location and illustration of site test piles and the numerical model: (a) map of the location of the offshore wind farm; (b) test pile for in situ tests; (c) three-dimensional numerical simulation model.
Jmse 11 02310 g010
Figure 11. q-s curve for test pile obtained by numerical simulation.
Jmse 11 02310 g011
Figure 12. Comparison of the theoretical and numerical results for ultimate end-bearing capacity.
Jmse 11 02310 g012
Figure 13. Plasticity zones of offshore wind monopile foundations at different times, where the monopile diameter is 2 m, the permeable layer is 12 m, and the rock-socketed depth is 3 m: (a) original stage; (b) after 8 years; (c) after 15 years.
Jmse 11 02310 g013
Figure 14. Displacements of offshore wind monopile foundations at different times, where the monopile diameter is 2 m, the permeable layer is 12 m, and the rock-socketed depth is 3 m: (a) original stage; (b) after 8 years; (c) after 15 years.
Jmse 11 02310 g014
Table 1. Modified Saaty’s nine-point rating scale [36,37].
Importance LevelScale
Equal1
Weak or slightly considerable2
Moderate3–4
Strong5–6
Very Strong7–8
Extreme9
Importance of comparing two elements after exchanging orderInverse of 1–9
Table 2. AHP analytical results of OMR classification.
Rating Index in OMR ClassificationWeight (%)One Hundred Percent System
Ratings of the strength of intact rock R135.07135
Ratings of the structural integrity of rock mass R218.92520
Ratings of discontinuities condition R310.93310
Ratings of intact rock alterability R435.07135
Table 3. Statistical validation of AHP analysis for the OMR classification.
Consistency Test Results
Maximum Eigenvalue λmaxCIRICRConsistency Test
4.010.0030.8820.0040.004 < 0.10 (pass)
Table 4. Modified evaluation of R1 in OMR classification.
σc (MPa)>250175100755037.525151<1
R1 rating352819.516121085.510
Table 5. Modified evaluation of R2 in OMR classification.
RQD (%)100959082.57562.55037.5250
R2 rating20191816.5151310.5861
Table 6. Modified evaluation of R3 in OMR classification.
ParametersRatings
R3RoughnessVery RoughRoughSmoothSlickensided
42.510
InfillingHard infillingSoft infilling
<5 mm>5 mm<5 mm>5 mm
3110
WeatheringUnweatheredModerately weatheredHighly weatheredDecomposed
320.50
Table 7. Modified evaluation of R4 in OMR classification.
Id2 (%)100908070605040302010
R4 rating3531.52824.52117.51410.573.5
Table 8. OMR ratings and adjustment factors for the effect of time, Ft, for three rock types after accelerated tests for seawater erosion.
Rock TypesRating ItemNatural State3 d7 d15 d30 d45 d60 d
225 d *525 d *1125 d *2250 d *3375 d *4500 d *
Plutonic rock
(Granite)
OMR76.574.573.17271.770.670.5
Ft0−2.0−3.4−4.5−4.8−5.9−6.0
Deviation0%−2.68%−4.65%−6.25%−6.69%−8.36%−8.51%
Volcanic rock
(Tuff)
OMR71.168.86664.162.461.661.5
Ft0−2.3−5.1−7.0−8.7−9.5−9.6
Deviation0%−3.34%−7.73%−10.92%−13.94%−15.42%−15.61%
Sedimentary rock
(Sandstone)
OMR6359.455.348.947.845.845.5
Ft0−3.6−7.7−14.1−15.2−17.2−17.5
Deviation0%−6.06%−13.92%−28.83%−31.80%−37.55%−38.46%
* Erosion time simulated by the accelerated test.
Table 9. Adjustment factor for the effect of time, Ft, in OMR classification.
Erosion Time0 Years3 Years6 Years9 Years12 Years15 Years
Ft ratingPlutonic rock0−5−5.5−6−6−6
Volcanic rock0−8−9−9.5−9.5−10
Sedimentary rock0−15−16.5−17−17.5−18
Table 10. Comparison of the OMR, RMR14, and RMR classifications.
Rock Mass ClassificationRating Indices in Rock Mass ClassificationAdvantages
OMRRatings of the strength of intact rock: R1
  • It is suitable for the marine bedrock of an offshore wind foundation.
  • The effect of time of seawater erosion is considered.
  • The rating indices are continuous.
Ratings of the structural integrity of rock mass: R2
Ratings of the discontinuities condition: R3
Ratings of intact rock alterability: R4
Adjustment factor for effect of time: Ft
RMR14Ratings of the strength of intact rock: R1
  • It can take into account the effects of engineering factors such as the initial ground stress field and the excavation method.
  • It is well suited for the quality assessment of the surrounding rock in tunnels.
Ratings of the density of discontinuities: R2
Ratings of the discontinuities condition: R3
Ratings of the water condition: R4
Ratings of intact rock alterability: R5
Adjustment factor for tunnel axis orientation: F0
Adjustment factor for excavation method: Fe
Adjustment factor for stress-strain behavior: Fs
RMRRatings of the strength of intact rock: R1
  • It is simple and easy to use and has been validated in a large number of geological engineering projects.
  • The correlations between RMR and other rock mass classifications have been proposed by many researchers.
Ratings of RQD: R2
Ratings of the spacing of discontinuities: R3
Ratings of the discontinuities condition: R4
Ratings of the groundwater condition: R5
Assessment of joint orientation
Table 11. Parameters of geotechnical layers for offshore wind foundations.
hr (m)γ (KN/m3)σc (MPa)miOMRE (GPa)
Permeable layer1219.9105303
Bedrock (tuff)323.46086540
Disclaimer/Publisher’s Note: The statements, opinions and data contained in all publications are solely those of the individual author(s) and contributor(s) and not of MDPI and/or the editor(s). MDPI and/or the editor(s) disclaim responsibility for any injury to people or property resulting from any ideas, methods, instructions or products referred to in the content.

