Article

A Geographic Information System (GIS)-Based Investigation of Spatiotemporal Characteristics of Pirate Attacks in the Maritime Industry

1
Navigation College, Jimei University, Xiamen 361021, China
2
Division of Logistics and Transportation, Shenzhen International Graduate School, Tsinghua University, Shenzhen 518055, China
3
Division of Business and Hospitality Management, College of Professional and Continuing Education, The Hong Kong Polytechnic University, Hong Kong, China
4
Faculty of Business and Management, Beijing Normal University-Hong Kong Baptist University United International College (UIC), Zhuhai 519000, China
5
Centre for Earth Observation Science, St. John’s College, University of Manitoba, Winnipeg, MB R3T 2N2, Canada
6
School of Architecture and Urban Planning, Shenzhen University, Shenzhen 518060, China
7
Zhejiang Scientific Research Institute of Transport, Hangzhou 311305, China
8
Department of Civil and Environmental Engineering, Florida A&M University-Florida State University, Tallahassee, FL 32310, USA
*
Authors to whom correspondence should be addressed.
J. Mar. Sci. Eng. 2023, 11(12), 2295; https://doi.org/10.3390/jmse11122295
Submission received: 8 October 2023 / Revised: 28 November 2023 / Accepted: 28 November 2023 / Published: 3 December 2023
(This article belongs to the Section Ocean Engineering)

Abstract

:
Maritime transportation is vital for the movement of cargo between different continents and distant locations but can be disrupted by the frequent occurrence of pirate attacks. Based on the pirate attacks from July 1994 to December 2019, a spatial analysis of pirate attacks using a Geographic Information System (GIS) was conducted in the present study using the data available for tankers, dry bulk carriers, container vessels, general cargo vessels, and tugs. The adoption of the kernel density analysis was intended to identify the spatial pattern of global pirate attacks. The research results demonstrated that the pirate attacks showed a clustering pattern and were mostly associated with areas experiencing economic depression, a high unemployment rate, and social unrest. Accordingly, spatiotemporal hot spot analysis was carried out to recognize the changing directions of cold spots and hot spots over a period of time. The waters off Somalia, the Strait of Malacca, the Philippines, the Bay of Bengal, the Gulf of Guinea, and the northwest of South America were found to be the common locations of pirate attacks. The cold and hot spots of pirate attacks on the three key vessel types, including tankers, dry bulk carriers, and container vessels, were found to be similar. When considering the same area, the trends of cold and hot spots of different vessel types being attacked were substantially different. This study can provide a useful guideline for the International Maritime Organization and other relevant organizations in the world to design and implement targeted strategies to combat and mitigate pirate attacks. Additionally, the introduction of a GIS may help to envision the spatial and temporal distribution of pirate attacks and to explore the characteristics of pirate behaviors at sea and the patterns of piracy.

1. Introduction

Pirates are of the same nature as robbers on land, except that pirates specialize in robbing different vessels at sea. Pirates have existed for a very long time, which can be traced back to the era of ship navigation. After the 16th century, with the development of the maritime industry, commercial development of the coastal areas was often infested with pirates. With the advent of the industrial age, naval forces were strengthened, and coastal patrols were given wide attention. Pirates significantly shifted from a criminal organization capable of competing with national naval power to a criminal gang that can only hijack ships. Pirates almost disappeared for a long time after the late 18th and early 19th centuries. However, in modern armed pirate attacks, the purpose of pirates is no longer simply to rob the cargo on the vessel but to blackmail the ship’s owners with the ship and cargo or even to kidnap hostages to achieve the purpose of ransom [1,2].
In economic globalization, as the main mode of transportation in international trade, maritime transport undertakes the vital task of international cargo transportation. Maritime transport has undertaken more than 90% of international trade transport volumes, playing an indispensable role in international trade [3]. As such, a safe and smooth delivery of cargo to the destination port is essential for international trade [4]. As China’s economy opens and has grown worldwide since 1978, China’s dependence on maritime transportation and sea lanes is increasing, which leads to maritime safety becoming especially important [5]. At present, sea lanes are facing both common and unexpected security threats. As an unexpected security threat, pirate attacks have always been an adverse factor influencing normal operations, threatening the safety of personnel and cargo in maritime transport [6]. As such, relevant maritime stakeholders are actively exploring measures to deal with pirate attacks and try to mitigate pirate attacks or minimize the damage suffered from attacks. Despite the fact that a considerable volume of pirate incidents have been investigated, such as 195 pirate incidents identified globally in 2020, which is a 20% rise over 2019, and generated 135 crew being kidnapped [7]. Shipping firms consumed an additional $1.53 billion in fuel costs in 2012 to prevent pirate attacks [8]. Thus, by analyzing the spatial and temporal features of pirate incidents and investigating the regularity of pirate incidents, the present study can provide valuable insights for the International Maritime Organization (IMO), policymakers, and governments to combat piracy activities. Furthermore, the present research will assist maritime transport operators in minimizing the risk of pirate attacks, effectively combating and minimizing the damages caused by pirate attacks, and ensuring the protection of cargo and personnel onboard vessels.
The past scientific studies in this area mainly concentrated on the prevention and forecasting of piracy and merely conduct a thorough analysis, particularly focusing on whether pirate incidents are successful [7,9,10,11]. Also, the majority of the past research studies mainly inclined toward a general evaluation of features and changes of piracy, the effect of piracy on maritime business, anti-piracy laws and programs, the risk of maritime piracy, and the economic impacts of piracy [7]. To address the existing research gaps, the current study aims to perform kernel density analysis and identify the spatial distribution of pirate attacks across the globe. It is concluded that the spatial patterns of piracy present aggregated patterns in certain regions rather than a uniform distribution around the world. On this basis, the hot spot analysis method aims to identify the locations of pirate attacks’ hot spots and cold spots. Also, spatiotemporal hot spot analysis is executed to determine the variation trends of hot spots and cold spots over time. The major contribution of this paper is to introduce a geographic information system (GIS) to envision the spatial and temporal distribution of pirate attacks and to explore the characteristics of pirate behaviors at sea and the patterns of piracy.
In general, this paper consists of five main sections. Section 2 reviews the most relevant literature, mainly focusing on studies related to piracy and GIS. Section 3 presents the sources of data and approaches used in this paper. Section 4 describes the results, whereas Section 5 highlights future research directions and addresses some concluding remarks.

2. Literature Review

2.1. Research on Piracy

Several studies have investigated maritime piracy in the literature. The past research studies mainly focused on the characteristics of pirate attacks, factors that influence piracy, and measures to deal with pirate attacks, to name a few.
Nwokedi et al. [12] used the piracy data collected by the International Maritime Bureau for a total of 10 years from 2011 to 2020 that occurred worldwide and performed the evaluation of these data using the MATLAB software. Empirical probability statistics were adopted to analyze the empirical probability coefficients of attacks on vessels of different kinds in various waters and assess the casualty impacts of pirate attacks. The results showed that the most vulnerable sea areas for pirate attacks are Southeast Asian and African waterways. The three main types of vessels facing the highest risk of pirate attacks were found to be product tankers, chemical tankers, and bulk carriers. As for the impacts of pirate attacks on the crew, it was found that crew members could be taken hostage and kidnapped for ransom, of which the probability of the former is five times that of the latter [12]. Marchione et al. [13] examined global data gathered by the National Geospatial-Intelligence Agency on piracy incidents worldwide by employing the methods originally developed to detect disease contagion. The time series models were used to assess the temporal and spatial distribution of piracy incidents. The results indicated that pirate attacks were clustered in time and space. Locations where pirate attacks occurred were associated with an increased probability of having more pirate attacks in the vicinity in the following period [13]. Focusing on piracy in the Gulf of Guinea, Denton et al. [14] investigated the impact of state military strength and regime type on piracy incidents, adopting piracy data from 2000 to 2016, integrated with an empirical analysis approach. The results revealed that strong governance and regimes could be effective in reducing the incidence of piracy attacks.
Phayal et al. [15] investigated the impact of inter-state security on maritime crime and analyzed the reasons behind it based on the original geocoded dataset on maritime piracy (MPELD). The study reflected that the conflict between states influenced the choice of location for maritime crime. Criminals used the maritime borders between states as a hiding place. They used the controversial nature of the location to avoid receiving strikes from regime forces. Fan et al. [16] investigated the relationship between naval power and piracy activities using a two-stage analysis method and a Nash game theory model. Based on the construction of a Bayesian network in the first stage, a sensitivity analysis was conducted in the second phase. The findings confirmed that the main factors influencing the probability of piracy are the season to which the time node belongs and whether there is a naval convoy.
Sandkamp et al. [17] explored the negative economic consequences of piracy, and the conclusion was drawn that the export volume of goods on routes affected by piracy decreased, and some maritime cargoes were diverted to alternative modes of transport. In addition, this study provided a theoretical basis for vessels to avoid piracy attacks and re-plan their routes. Divine Caesar et al. [18] pointed out that stakeholders in the maritime industry should be concerned about piracy and take measures to mitigate the economic impact of piracy and the adverse effects on the safety of maritime practitioners. Furthermore, Rosnani et al. [19] explored the effect of maritime security issues on inter-state cooperation in Southeast Asia. As piracy, maritime terrorism, and criminal trade have caused more serious problems, maritime transportation has been adversely affected. The authors suggested that the Association of Southeast Asian Nations (ASEAN) countries should collaborate to combat non-traditional crimes.

2.2. Applications of GIS

GIS, which is a major spatial analysis technology, has been widely used in the field of criminology. More specifically, with the development of GIS, researchers use ArcGIS10.6 software to achieve visualization, which is used to study the spatial and temporal distribution of events. GIS technology was employed by Dong et al. [20] to foster the analysis of 298 young men’s activity paths on the day of violent attacks. The study also investigated the impact of the environment and time on violent assaults. The results showed that the chance of violent attacks rised during the time that people were in an open location, engaged in unstructured activities, and without a guardian, and the degree of increasing assaults varied with time [20]. Martins Filho et al. [21] applied GIS to compile the study variables and adopted spatial regression analysis to examine the relationship between school performance and violent crimes. The findings revealed that better school performance facilitated the suppression of lethal violent activities. Rosa et al. [22] integrated the multi-criteria decision analysis (MCDA) model and GIS, and proposed a GIS-MCDA framework to generate the characteristics of street robbery data. The study area was divided according to the vulnerability level, and the Dominance-based Rough Set Approach (DRSA) was used. The results showed that social interaction features, street robbery, and bus stops were statistically and spatially correlated. Using homicide cases in the State of Pernambuco, Brazil, between 2016 and 2019, combined with a GIS database, Silva et al. [23] explored the spatial characteristics of homicide cases by adopting ordinary least squares regression, geographically weighted regression (GWR), and the Global and Local Moran’s Index. The results highlighted that there was a spatial dependence on the homicide rate in certain locations of the considered study area. Stassen et al. [24] considered the characteristics and tendency of environmental and wildlife crimes (EWCs) in Sweden, combining spatial statistical methods and GIS to perform a temporal and spatial examination of EWCs. The results showed that the number of EWCs increased after 2006 and gradually stabilized. The severity of EWCs was not completely consistent in different regions. EWCs occurring in urban areas were minor, while accessible rural and remote rural areas encountered more serious crimes. This was interpreted as being somewhat related to the difference in the cost of violating environmental laws. Sukhija et al. [25] conducted data clarity and pre-processing based on the crime data gathered from the Commissioner of Police of Gurgaon, Haryana. GIS, combined with supervised learning and an unsupervised classifier, was further used to realize the visualization of crime hot spots, and the modified K-nearest neighbor (KNN) algorithm was applied to identify crime hot spots. From these studies, it can be found that the spatial and temporal distribution characteristics of crime events may be clearly and intuitively revealed from a geographical perspective by using geographical data analysis technology. GIS technology has been widely used in the field of criminology, and the application of the technology is becoming more and more mature, which can provide effective technical means for analyzing the temporal and spatially changing characteristics of crime incidents.
Although the existing studies on pirate attacks have made some progress in many aspects, there is a lack of research on the combination of temporal and spatial characteristics of pirate attacks from a geographical perspective. In order to fill the gap, this study adopts research methods of GIS, including Kernel density analysis, hot spot analysis, and spatiotemporal hot spot analysis, to investigate the spatial distribution of pirate attacks and find out the location of cold spots and hot spots and the cold or hot spot trends of pirate attacks.

3. Research Methods and Data

3.1. Data Source

This study was designed to provide a detailed investigation of the pirate attacks that happened worldwide from July 1994 to December 2019. The research data were based on the IMO statistics available. A total of 7280 pirate attacks were identified, among which 3595 could not be further analyzed by the temporal and spatial pirate attack characteristics of various vessel types via GIS due to the lack of the time of pirate attacks, the latitude and longitude that integrate the area where the pirate attacks occurred, and the type of vessel attacked by pirates. To this end, the records with missing data were removed accordingly. A total of 3685 records of pirate attacks with valid and complete information were gathered. Among them, the types of vessels that suffered the most pirate attacks were tankers, dry bulk vessels, container vessels, general cargo vessels, and tugs, which can be seen in Table 1. These five kinds of ships involved in pirate attacks accounted for 90.50% of the total valid data, which was of representative significance. As a result, this study specifically focused on the data collected for the above five types of vessels that suffered from pirate attacks and investigated the temporal and spatial distribution of pirate attacks that occurred on different vessel types through GIS.

3.2. Research Methods

3.2.1. Kernel Density Analysis

Kernel density analysis is an approach that adopts the kernel function to estimate the quantity value per unit area based on polyline elements or points that are suitable for an individual polyline or point on a smooth cone surface. Each point is covered with a smooth surface. In the circular neighborhood, the surface value is highest at the point and reduces progressively with the increase in distance from the point. The surface value is assumed to be zero at the location at which the distance from a given point is exactly equivalent to the search radius. The kernel function is based on the quadratic kernel mathematical relationship described in Silverman’s work [26]. The kernel density at the center of the grid is the sum of the densities within the window [27]. The kernel density function can be presented as follows: [28].
f x = 1 n h d i = 1 n K x x i h
where f x is the assessment of the intensity of the spatial point pattern evaluation at location x ; x i is viewed i th event; K is the kernel density value; h is the threshold value; n is the number of points within the threshold range; d is the dimensionality of the data.
Kernel density analysis can be adopted to compute the density of pirate attack occurrences. The results reflect the degree of clustering of pirate attacks in space and can be useful to identify the main areas where pirate attacks occur.

3.2.2. Hot Spot Analysis

We used the Getis-Ord Gi* statistical approach to recognize cold and hot spots. Hot spot analysis was carried out in the current study according to the data collected for the selected five ship types subjected to pirate attacks. The clustering position and characteristics of the events were judged by obtaining the p-value and z-score. The statistical estimations behind the Getis-Ord Gi* method are as follows [29]. The Getis-Ord local statistics can be expressed as:
G i * = j = 1 n ω i , j x j X ´ j = 1 n ω i , j S n j = 1 n ω i , j 2 j = 1 n ω i , j 2 n 1
where x j is the attribute value of pirate attack event element j ; ω i , j is the spatial weight of pirate attack event elements i and j ; and n is the total number of pirate attack event elements. The X and S components are calculated according to the coming mathematical relationships.
X ´ = j = 1 n x j n
S = j = 1 n x j 2 n X ´ 2
The G i * statistics essentially represents the z-score, and no further computation is required. The null hypothesis in the context of this study states that pirate attack events have complete spatial randomness. Z-scores, indicating multiples of the standard deviation, reveal clustering tendencies - higher positives for hot spots and lower negatives for cold spots. Extreme z-scores typically align with minimal p-values, which represent the probability of a spatial pattern emerging randomly. Sufficiently small p-values suggest rejecting the null hypothesis. Usually, 90%, 95%, or 99% confidence degrees are selected for spatial statistical analyses, in which a 99% confidence degree is the most conservative, indicating the unwillingness to reject the null hypothesis. The critical values of p-values and z-scores at various confidence levels are given in Table 2.

3.2.3. Spatiotemporal Hot Spot Analysis

Spatiotemporal hot spot analysis was employed to recognize the clustering movement of pirate attacks. Getis-Ord Gi* statistics values are calculated for individual bins using the neighborhood time step and neighborhood distance parameter values, and trend tests are performed based on the Mann–Kendall analysis to assess cold or hot spot trends. Cold spot or hot spot trends are divided into eight categories, including new, continuous, strengthening, persistent, gradually reducing, dispersed, uncertain, and traditional cold or hot spots, whose definitions are shown in Table 3.
The Mann–Kendall statistics are computed based on the rank correlation analysis of bin counts or values and their time series. A comparison between first and second period values assigns +1 for an increase, −1 for a decrease, and 0 for no change. These results are summed, with an expected sum of 0 implying no trend. Variance in the bin time series and the sum of association periods and observations help determine statistical significance against the expected sum (0). The direction of the time series for every bin is measured along with the related z-score and p-value. Small p-values recognize statistically significant trends. The positive and negative z-scores are relevant to the increase or decrease of bar values, with positive z-scores showing an increase in bar values and negative z-scores indicating a decrease in bar values.

4. Result Analysis

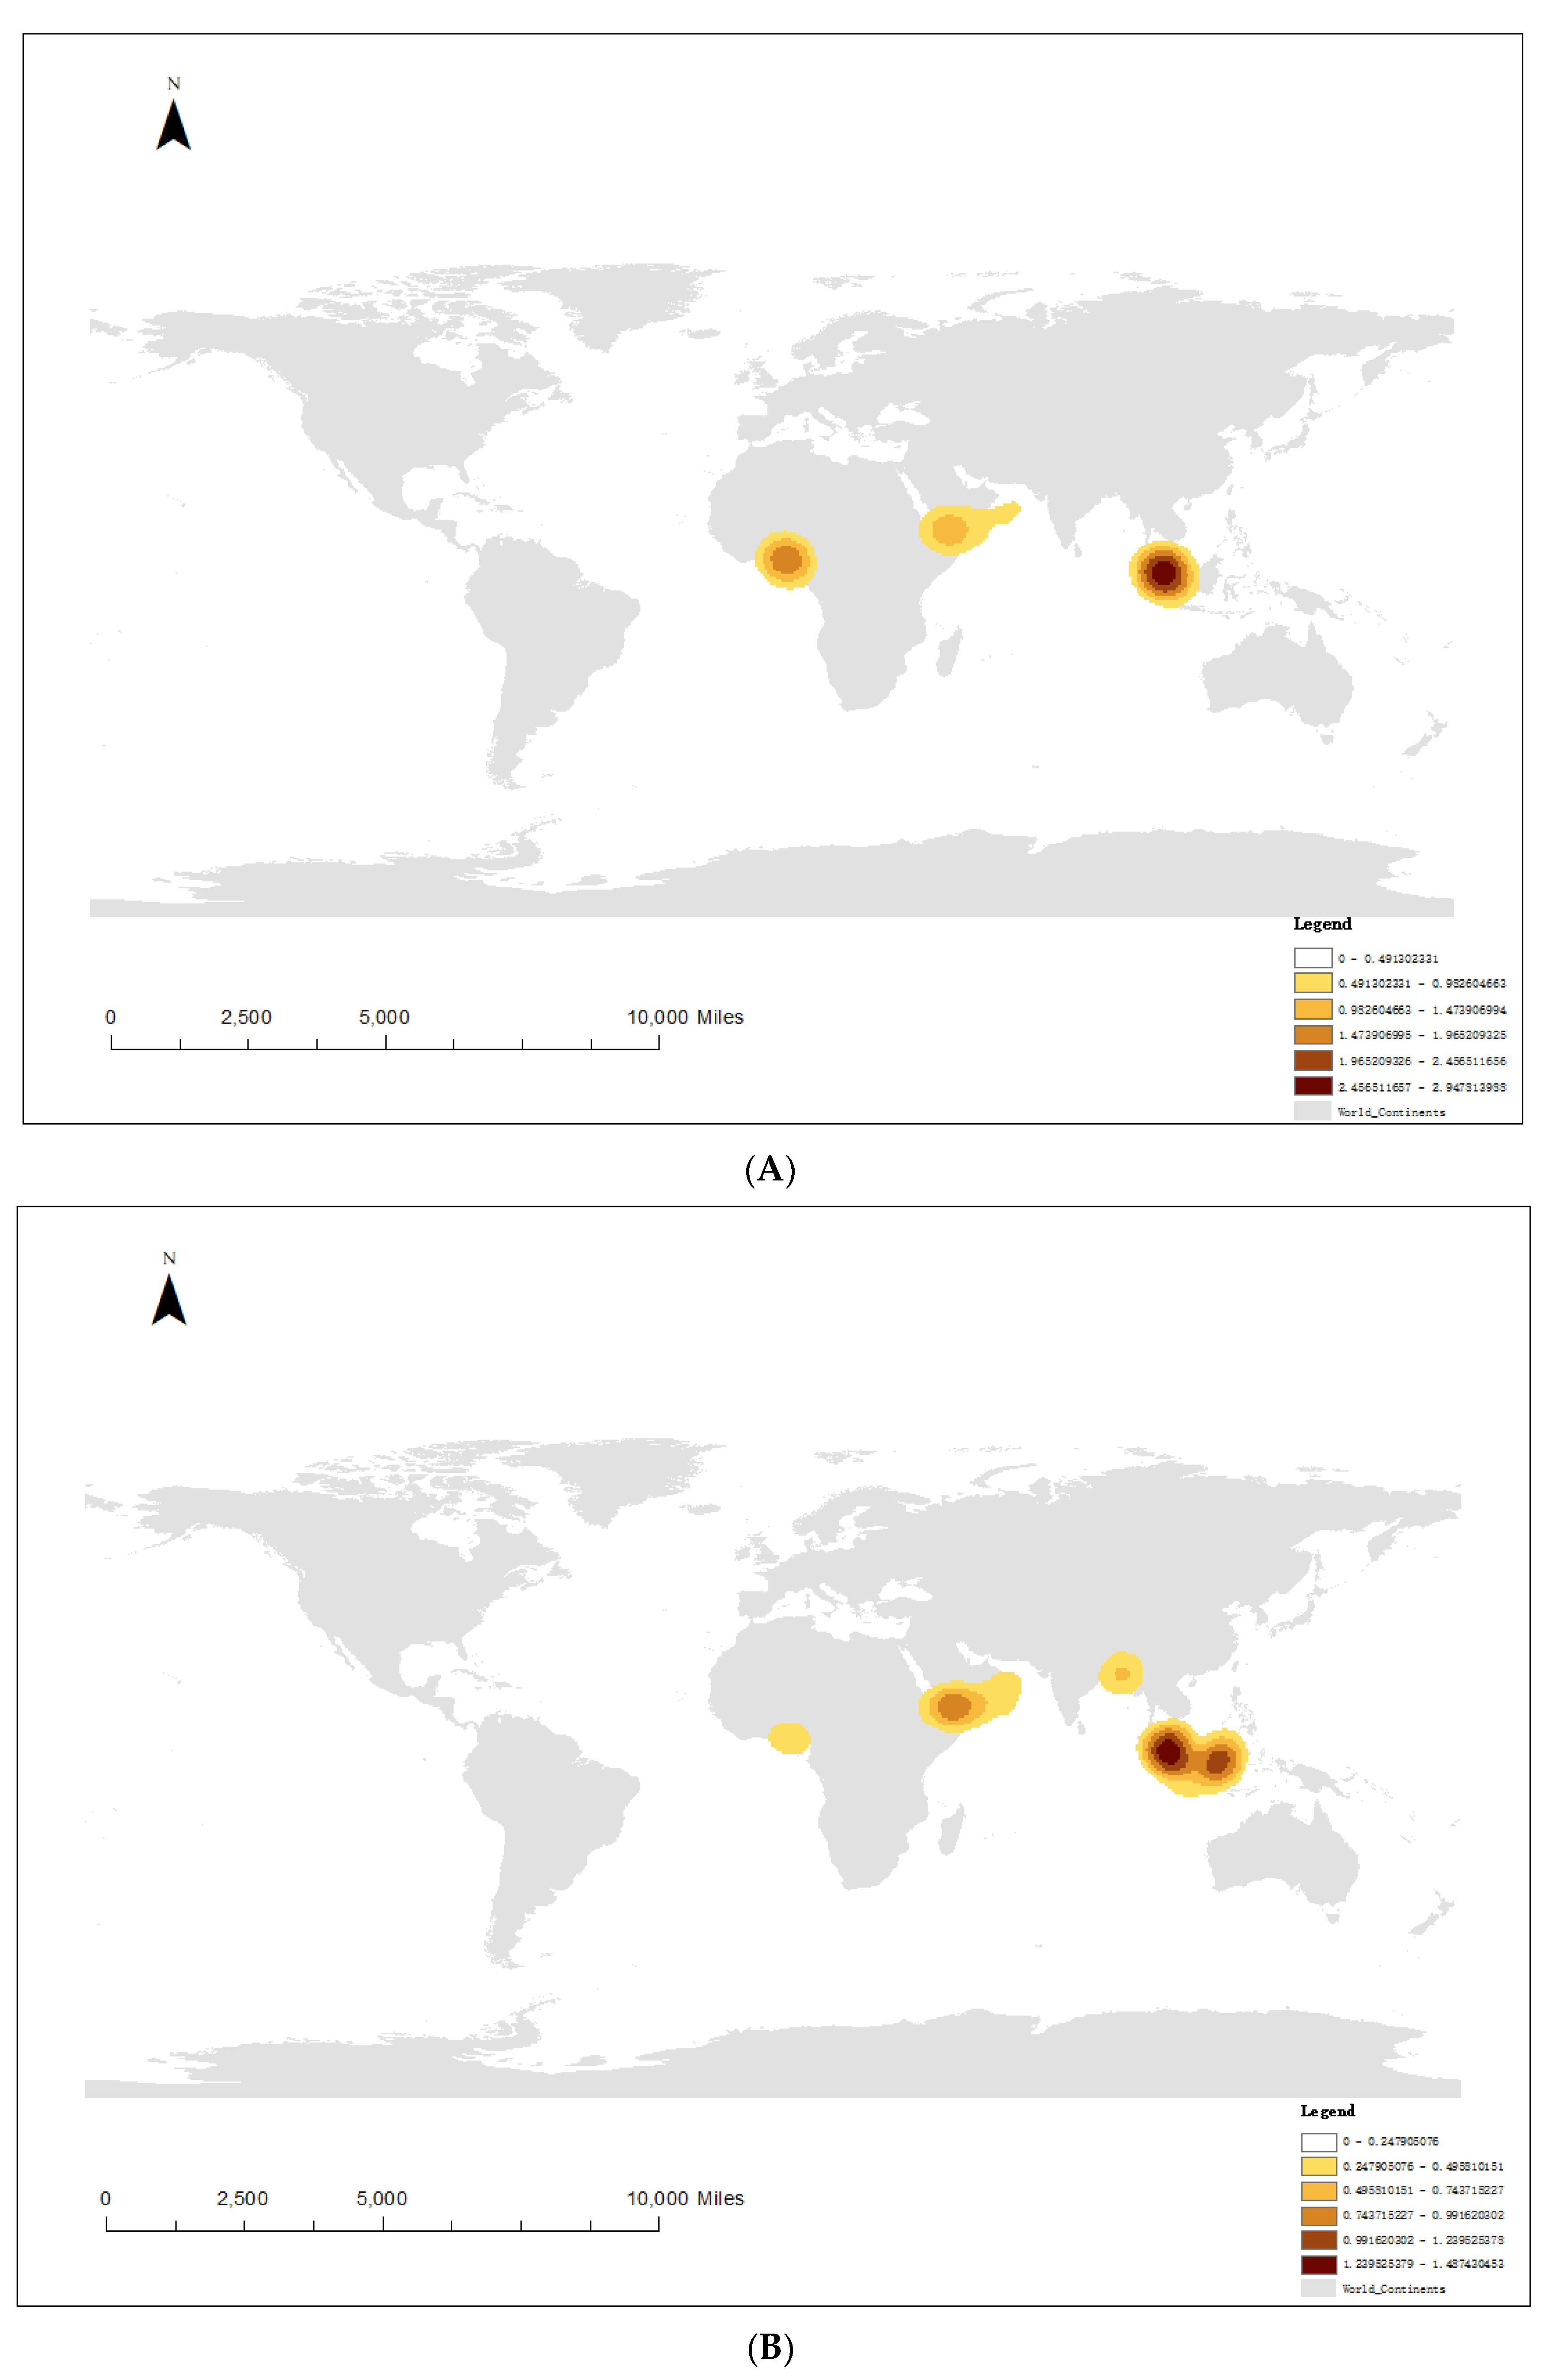
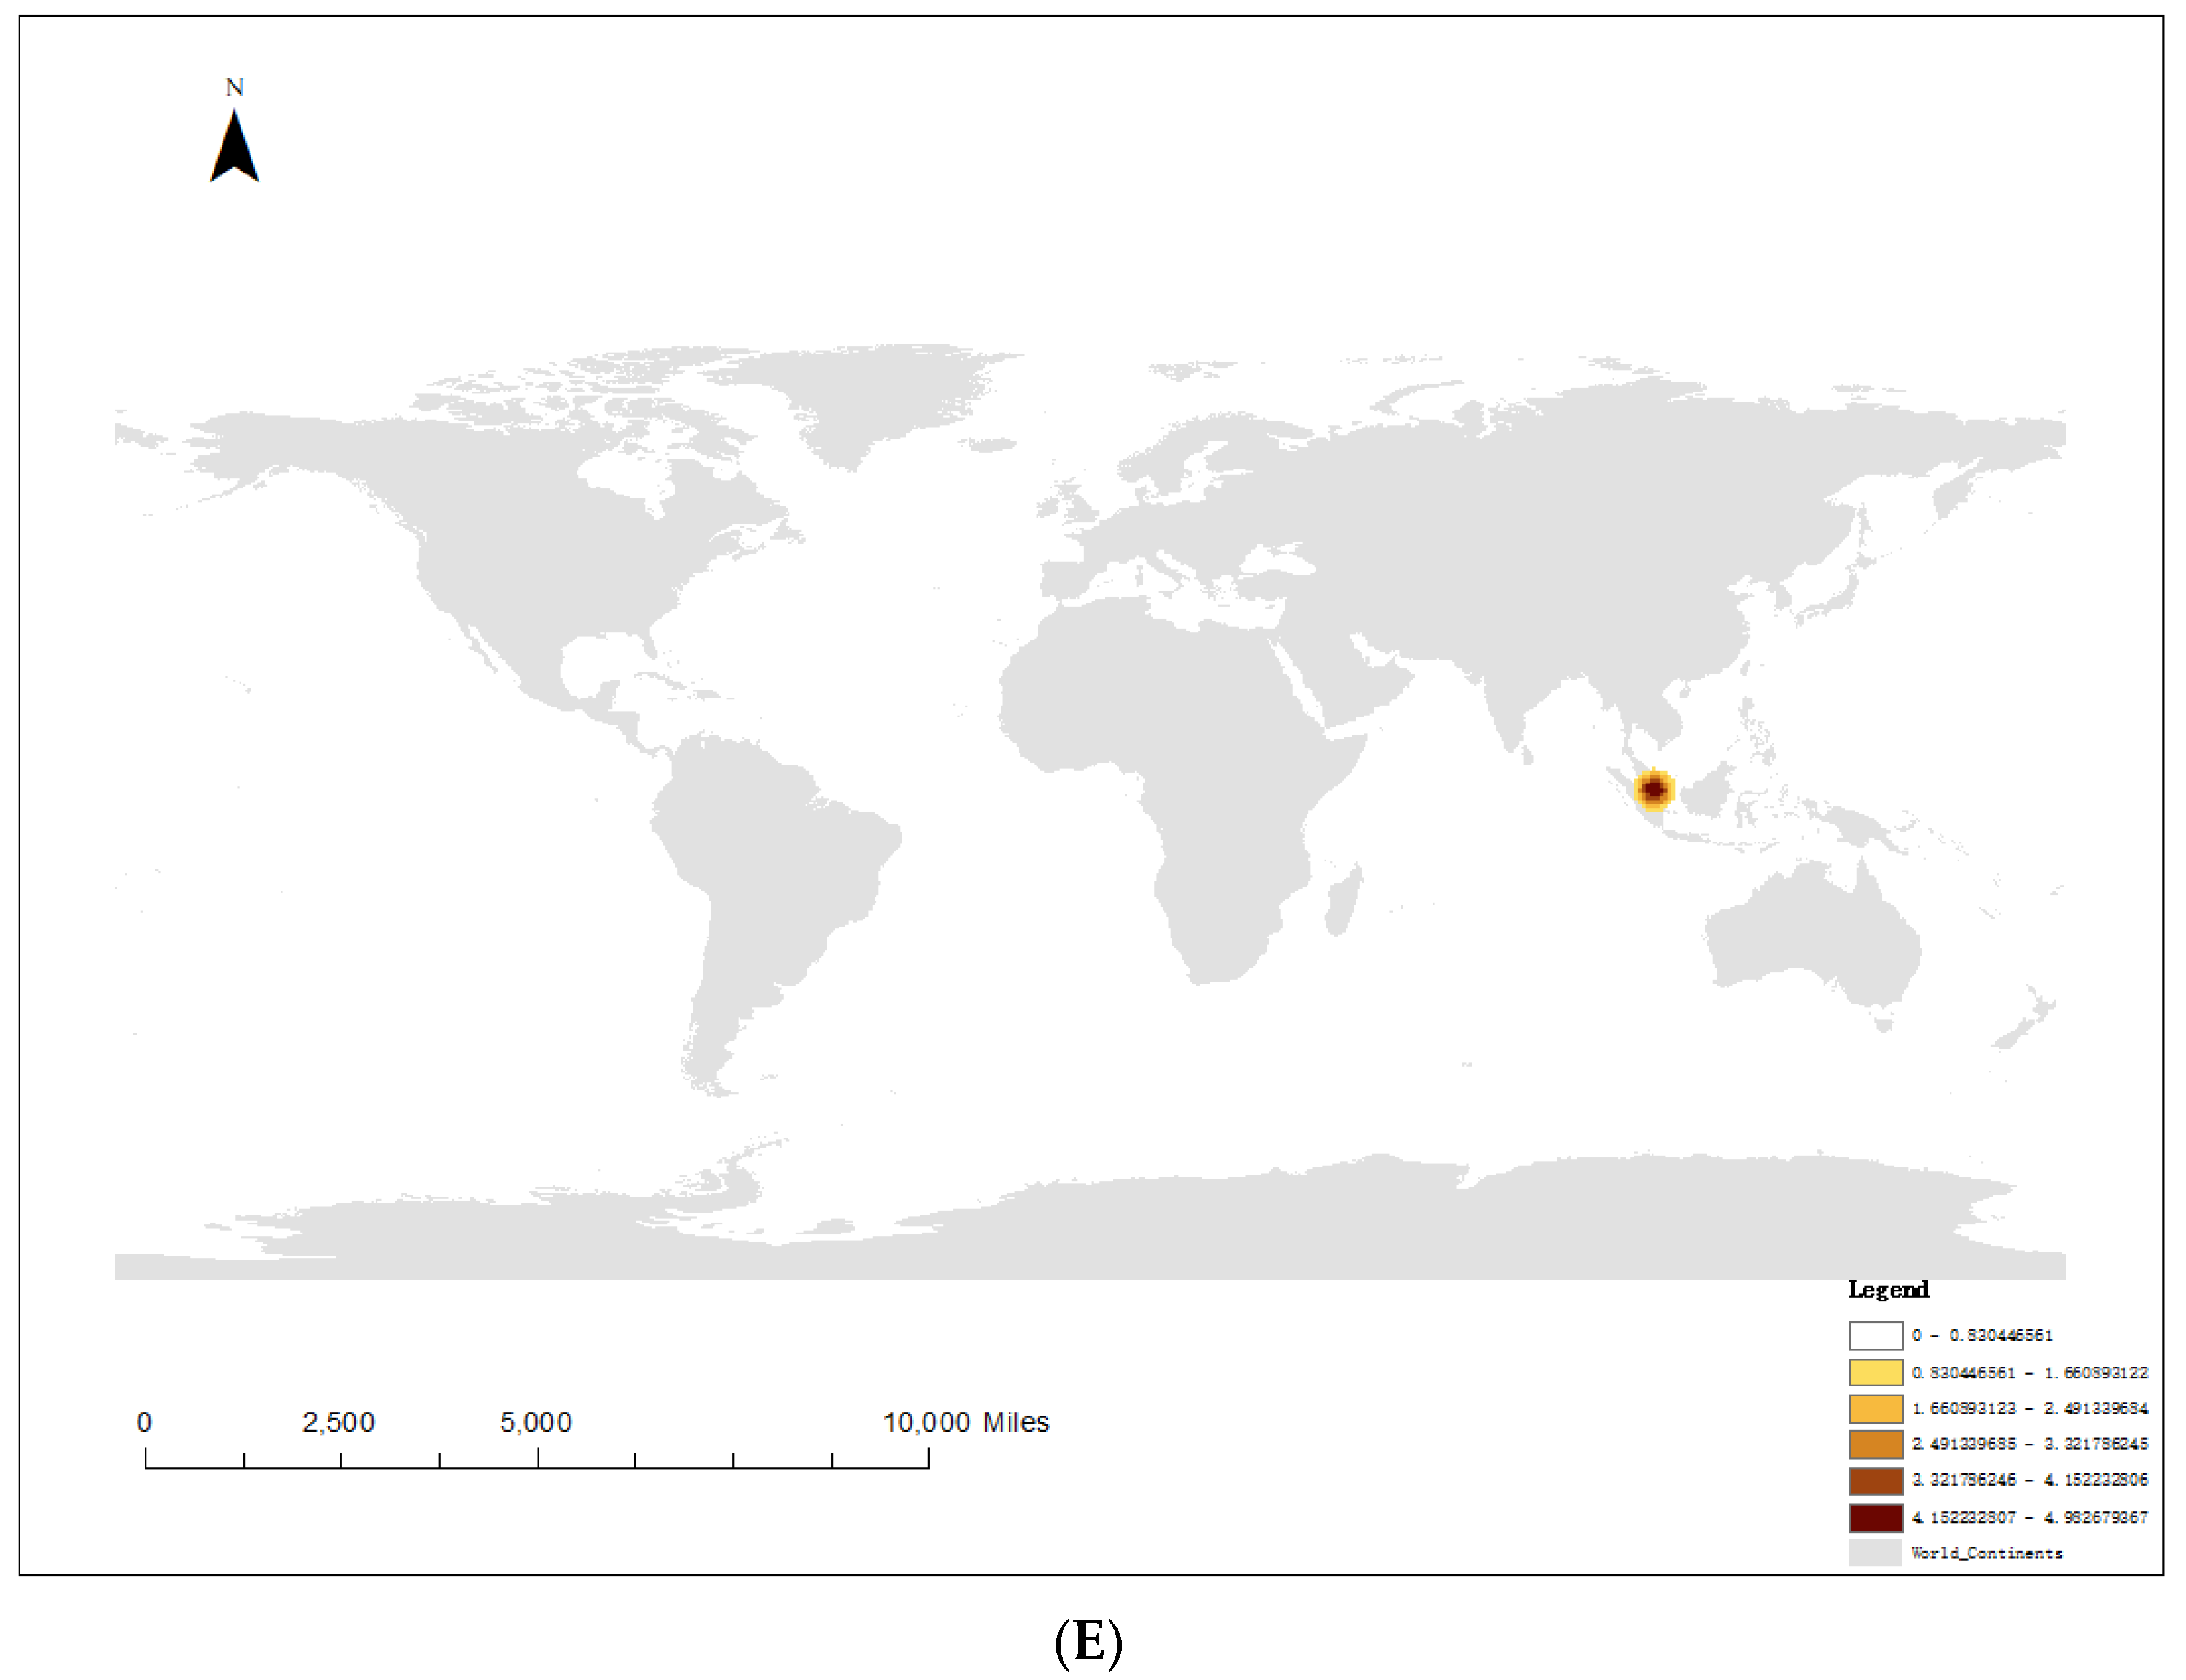
4.1. Spatial Distribution of Pirate Attacks

The analysis reflected that pirate attacks were not evenly distributed around the world. The spatial distribution showed an aggregation pattern in certain regions. The kernel density analysis maps of pirate attacks on different ship types could be directly associated with the spatial distribution of pirate attacks.
It can be seen from Figure 1 that tankers were mainly attacked by pirates in the Strait of Malacca, the Gulf of Aden, and the Gulf of Guinea; dry bulk carriers were mainly attacked by pirates in the Gulf of Aden, the Strait of Makassar, the Gulf of Guinea, the Bay of Bengal, and the Strait of Malacca; container vessels were mainly attacked by pirates in the Gulf of Guinea, the waters off Somalia, the Gulf of Aden, the Strait of Malacca, the Bay of Bengal, the Strait of Makassar, the South China Sea, and the waters off northwest South America; general cargo vessels were mainly attacked by pirates in the Gulf of Guinea, the waters off Somalia, the Gulf of Aden, the Caribbean Sea, and the Strait of Malacca; and pirates primarily targeted tugboats in the Strait of Malacca. Pirate attacks were found to be frequent in the waters of Somalia and the Strait of Malacca, where the kernel density was relatively high. These waters were the core areas where container vessels, dry bulk carriers, and general cargo vessels encountered pirate attacks.
Most of the coastal areas where the pirate attacks took place were economically depressed, along with high unemployment rates. Many unemployed people further contributed to social unrest. Driven by the lucrative economic benefits, people desperate to escape poverty became involved in piracy. The rising risk of debt made it difficult for the government to operate and unable to control the crime of piracy. As a result, the opportunity cost for coastal residents to participate in the crime of piracy was small. The unique and advantageous geographical locations also provided them with naturally favorable geographical conditions to carry out pirate attacks. Pirates chose the world’s strategic shipping lanes as their attack sites because these busy navigation channels were the routes for various ships, and these numerous passing ships were their main targets. In addition, the promotion of piracy culture in certain countries was also a major contributing factor.

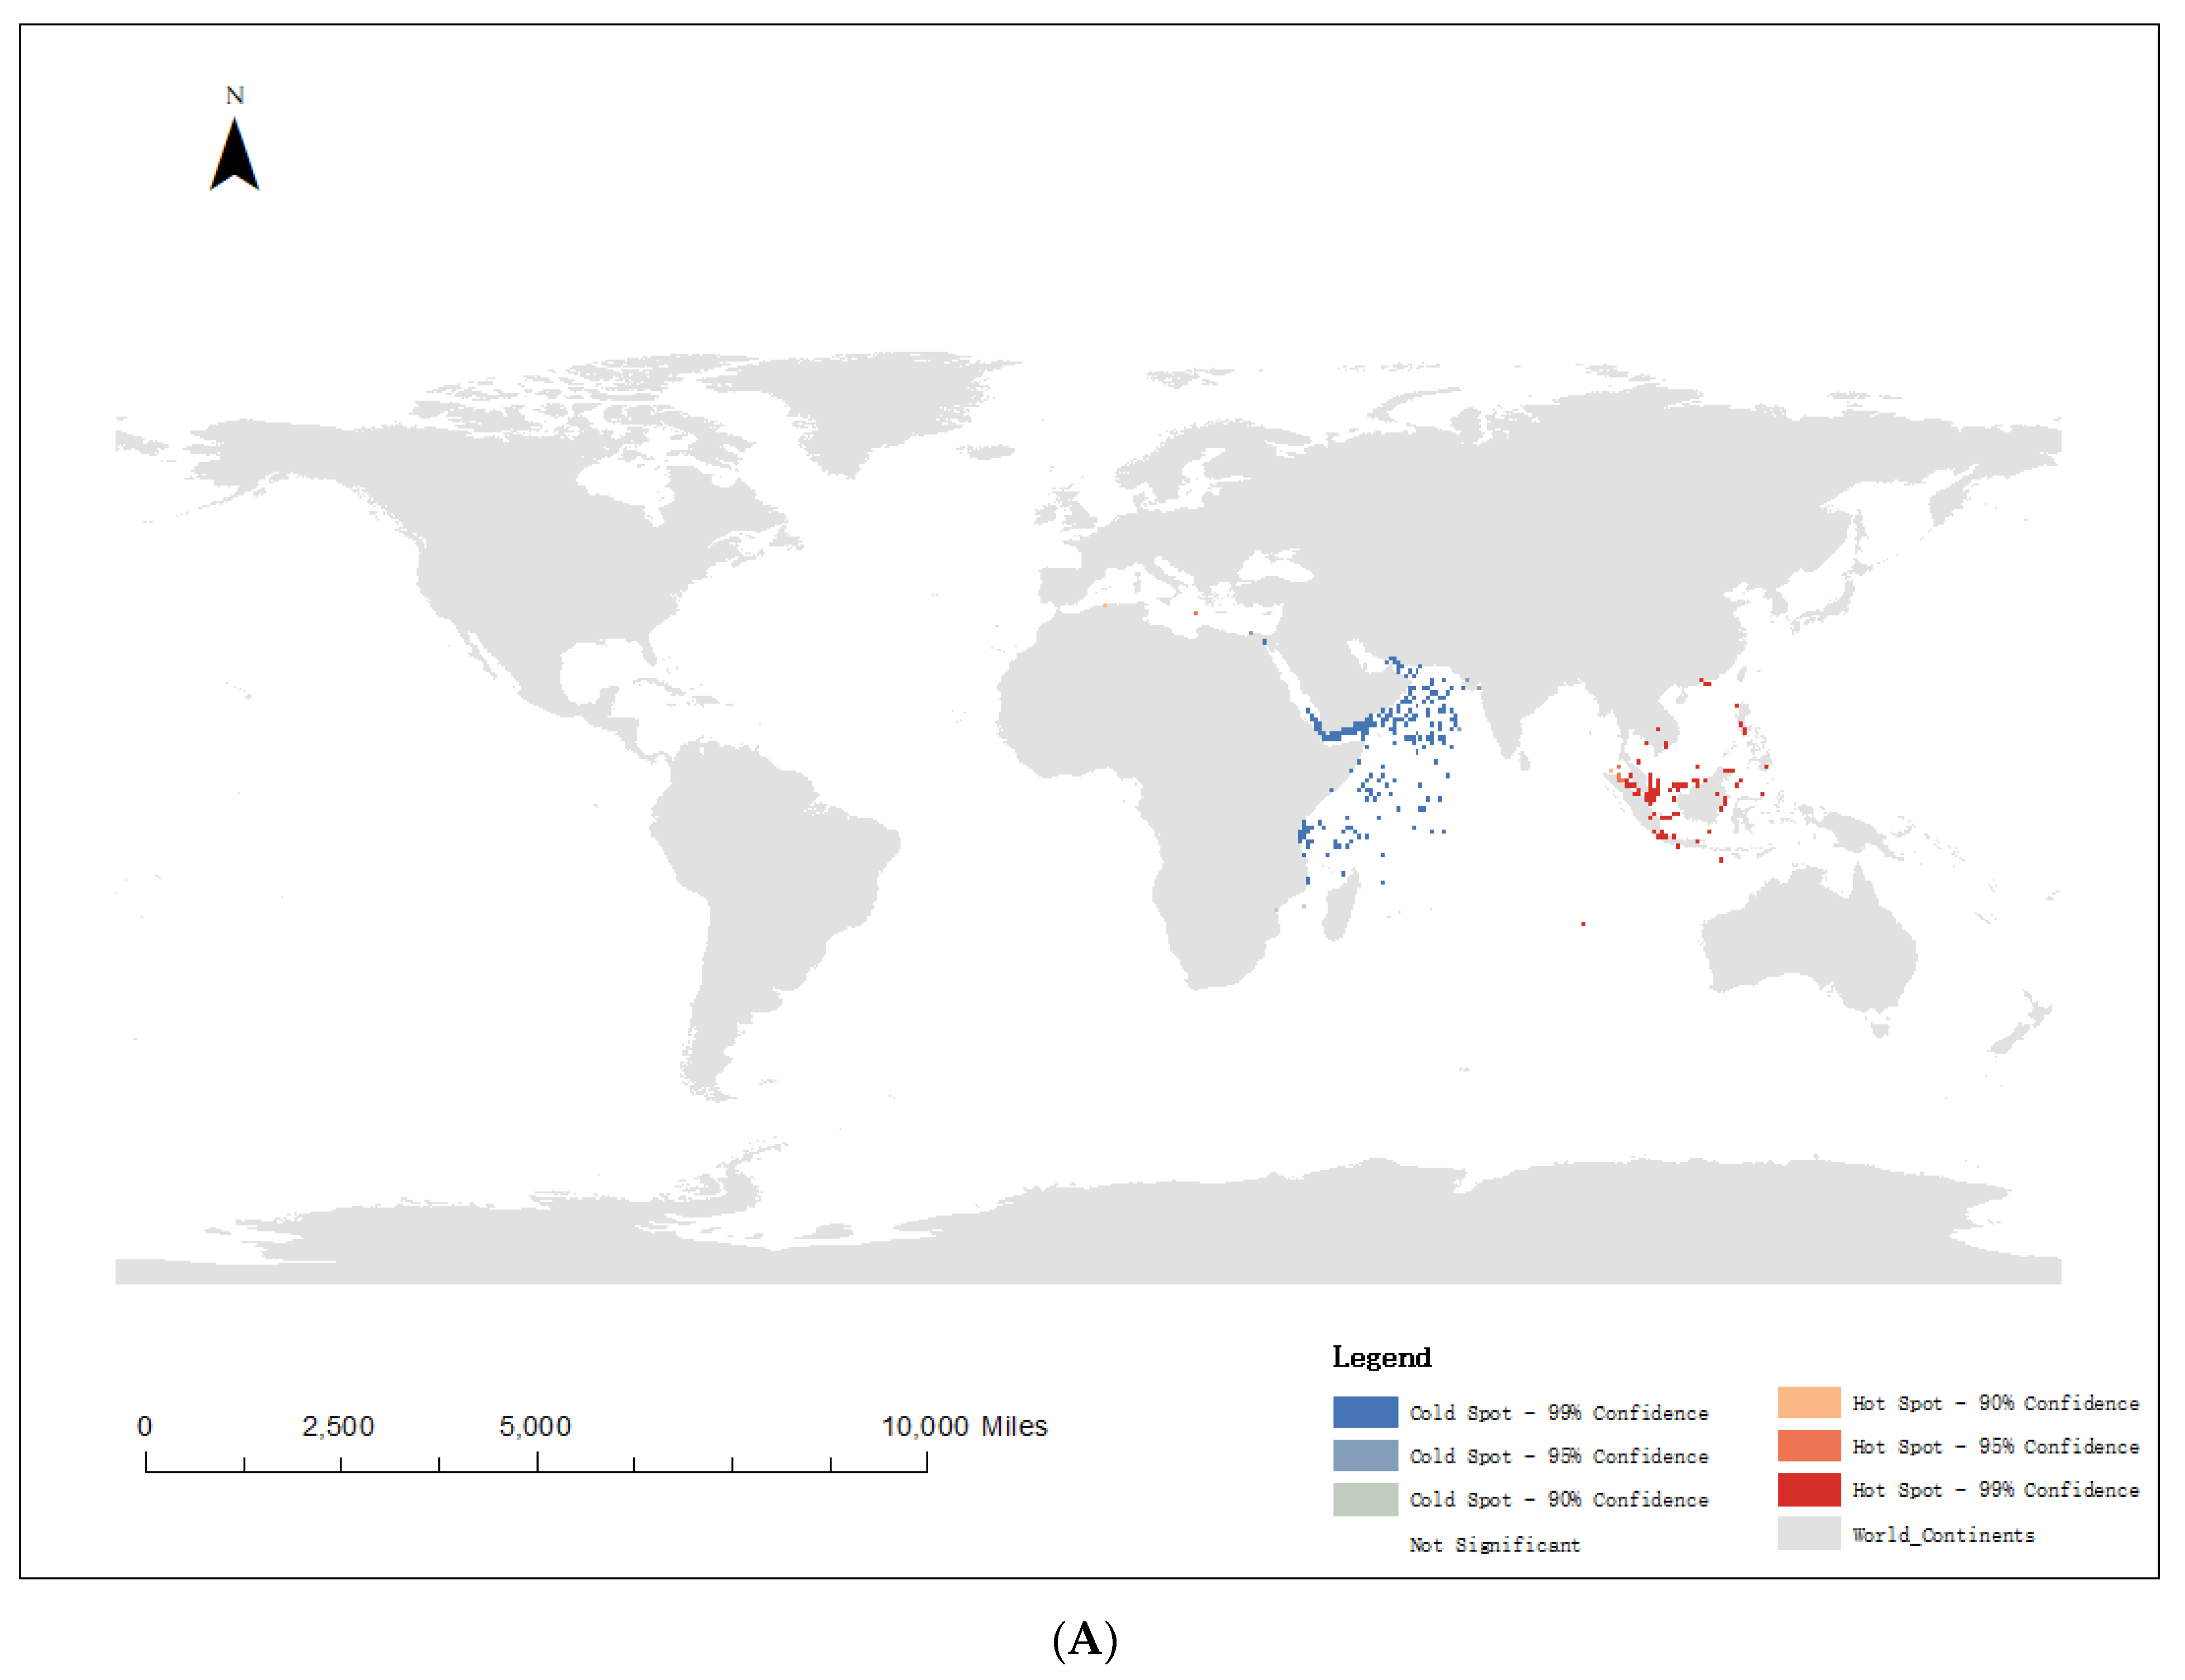
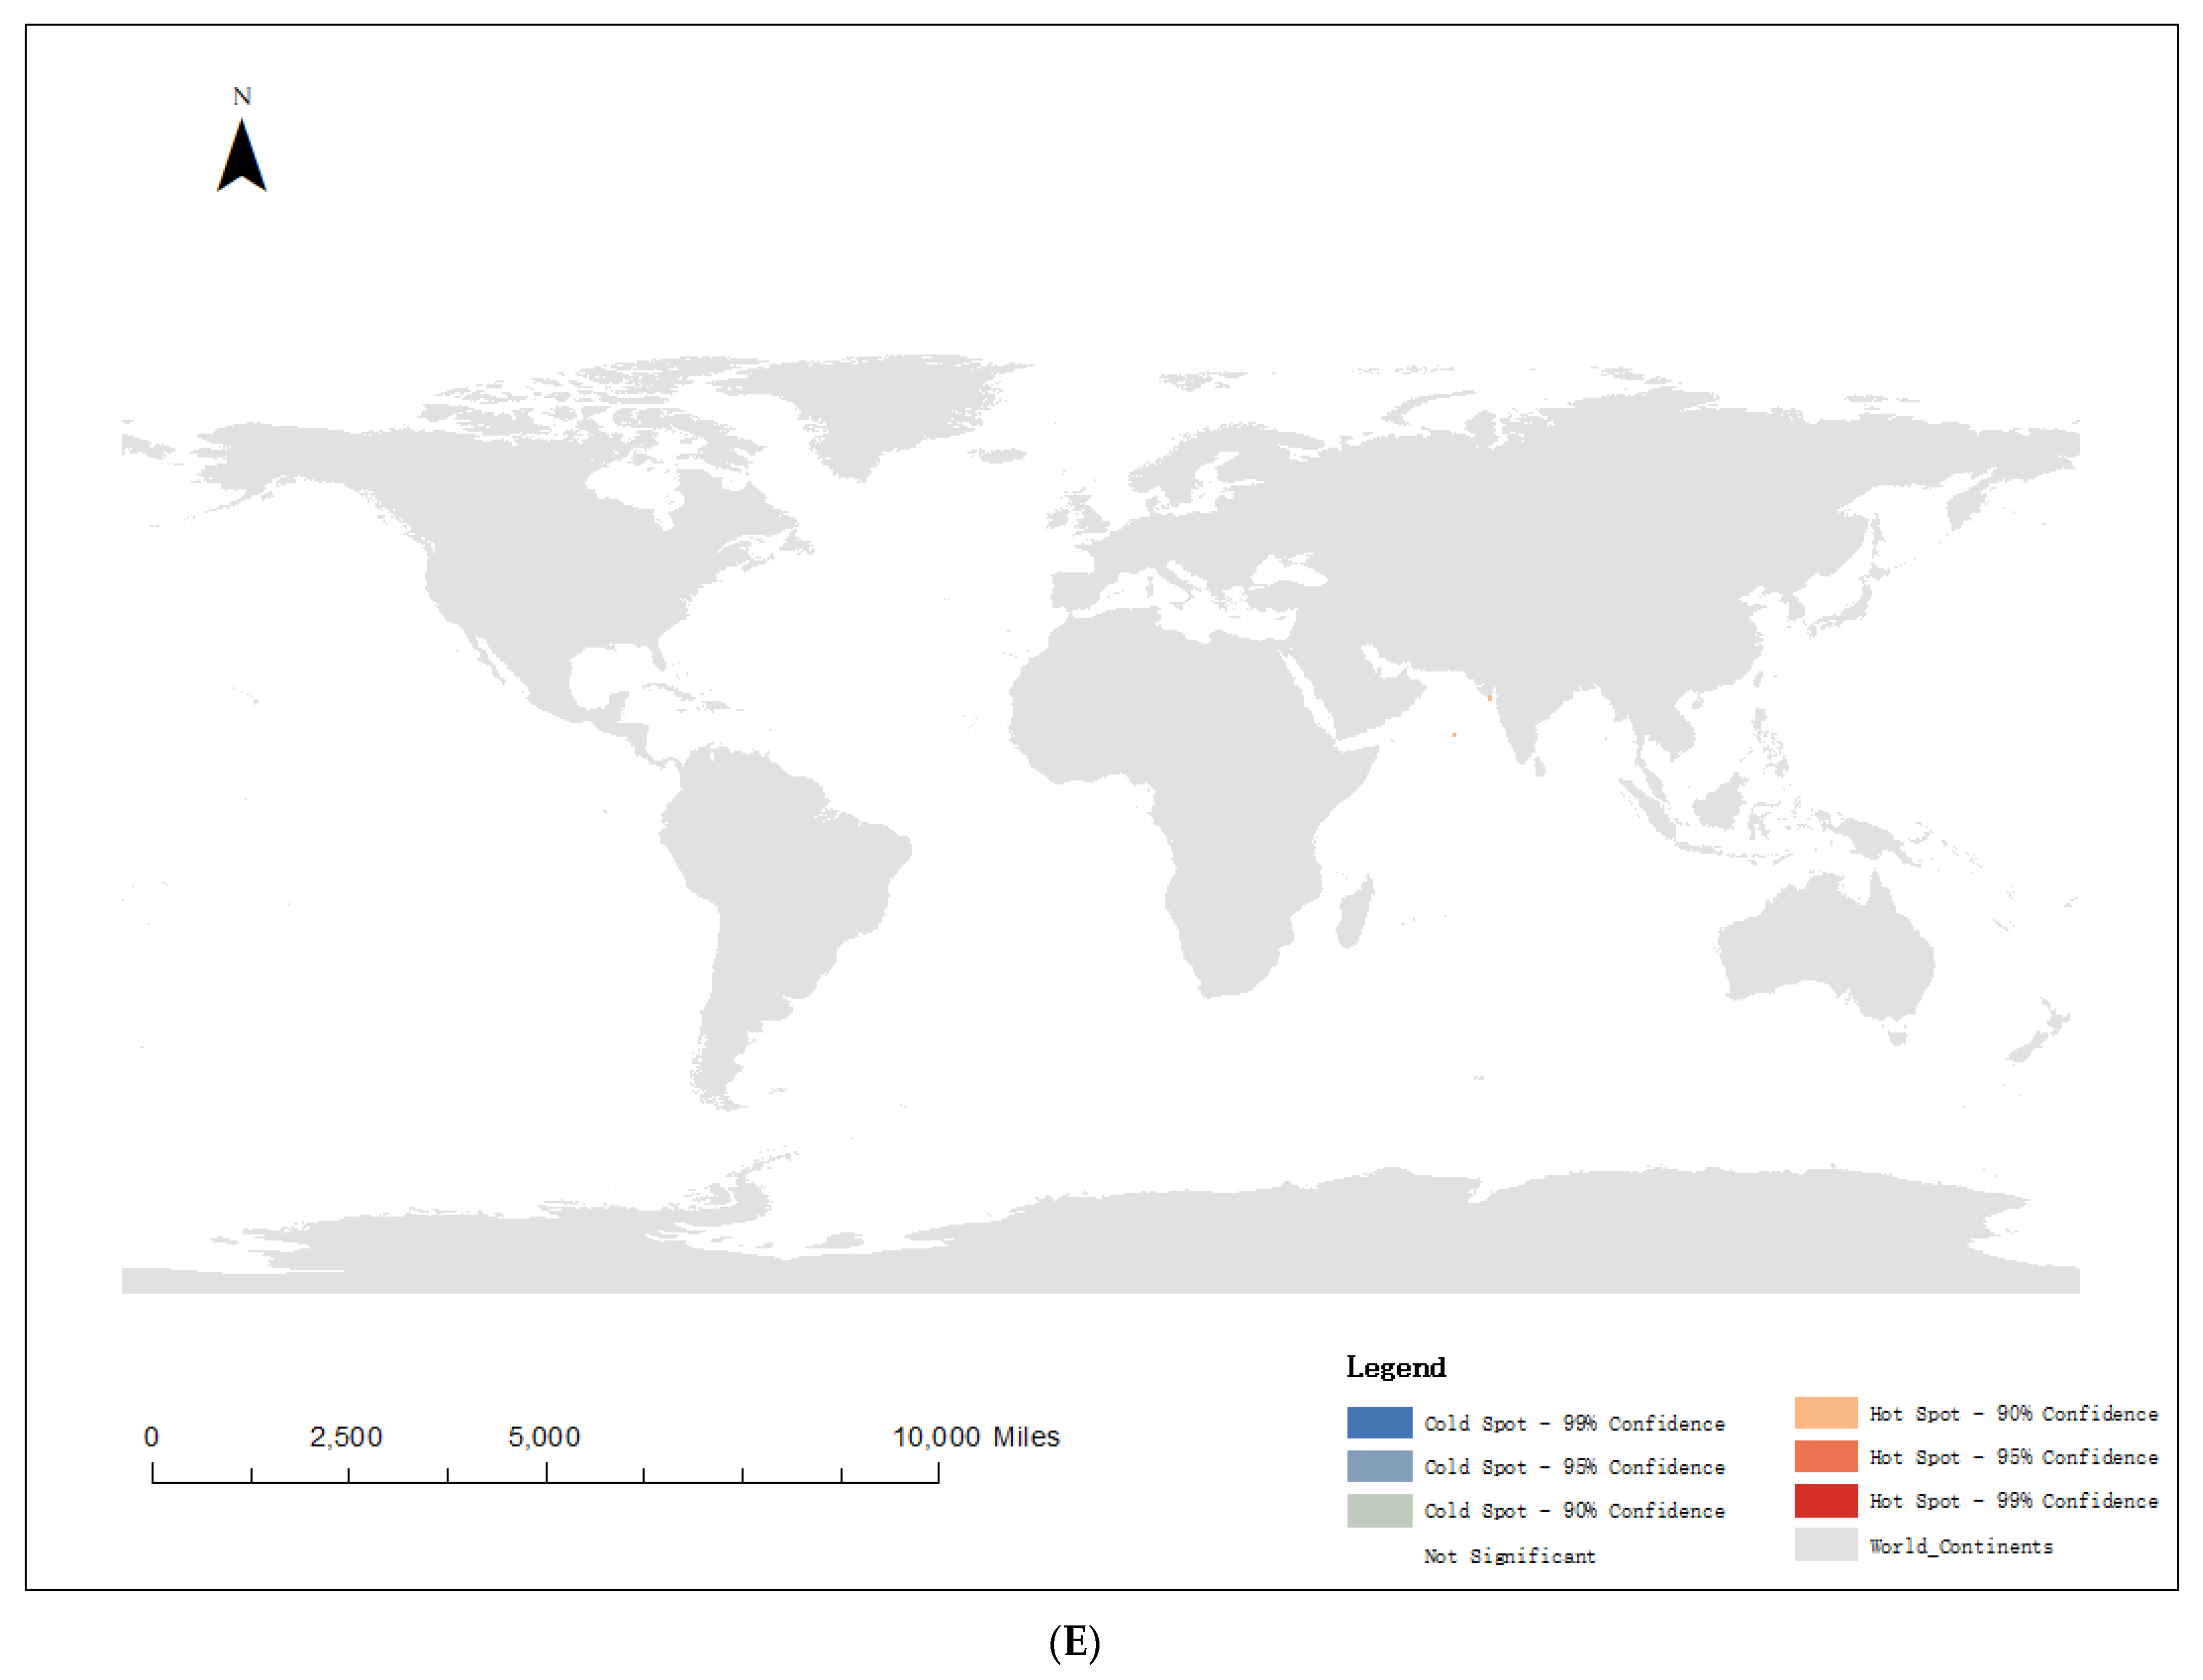
4.2. Hot Spot Analysis of Pirate Attacks

The hot spot analysis tool in ArcGIS10.6 spatial statistics was used to examine the hot spots of piracy attacks suffered by different ship types, with the objective of obtaining the cold and hot spot locations of pirate attacks. The pattern of cold spots and hot spots of pirate attacks on tankers, dry bulk carriers, container vessels, general cargo vessels, and tugs was plotted, respectively, in Figure 2, so that the results can be more visually reflected. The blue and red dots in the figure represent the cold spots and hot spots at different confidence levels. Indeed, the darker the color, the higher the corresponding confidence level.
When reviewing the analysis results for tankers and dry bulk carriers, it can be observed that the cold and hot spots of pirate attacks were roughly the same. The Bay of Bengal, the Strait of Malacca, the Philippines, Indonesia, and Malaysia were the main locations of common, striking hot spots. In addition, Hong Kong, Macao, Vietnam, and Cambodia were notable hot spots for tanker attacks as well. The obvious hot spots for attacks on general cargo ships were relatively widely distributed, spreading mainly in the Caribbean.
Although piracy was widespread off the coast of Somalia, where numerous ships were attacked by pirates, this area was a notably cold spot for the three main types of vessels and general cargo vessels. Such a pattern could be explained by the joint efforts of the IMO and countries around the world, in which the navy was dispatched to the waters off Somalia to participate in the naval escort operations, which played a vital role. Since 2008, the European Union, the North Atlantic Treaty Organization (NATO), and some countries like the United States, the United Kingdom, Canada, Germany, and Pakistan, under the call and authorization of the United Nations, have actively sent military forces to combat Somali pirates, resulting in effective control of pirate attacks during this period. However, Somali pirates used the lucrative proceeds from hijacking crews and robbing cargoes to purchase more advanced tools and speed up their ships. By 2011, Somali pirates had further expanded their scope, focusing more on the Red Sea and further in the northern Indian Ocean. With the efforts of international organizations to combat pirate attacks further, piracy governance achieved obvious results. The number of Somali pirate attacks had dropped sharply by 2013 and almost ceased in 2015. However, in late 2016, escort efforts waned with the withdrawal of NATO naval forces, and then a resurgence of Somali piracy began to emerge. Thus, although the governance of Somali piracy achieved remarkable results, all relevant parties should always remain vigilant and actively take countermeasures to prevent pirate attacks.

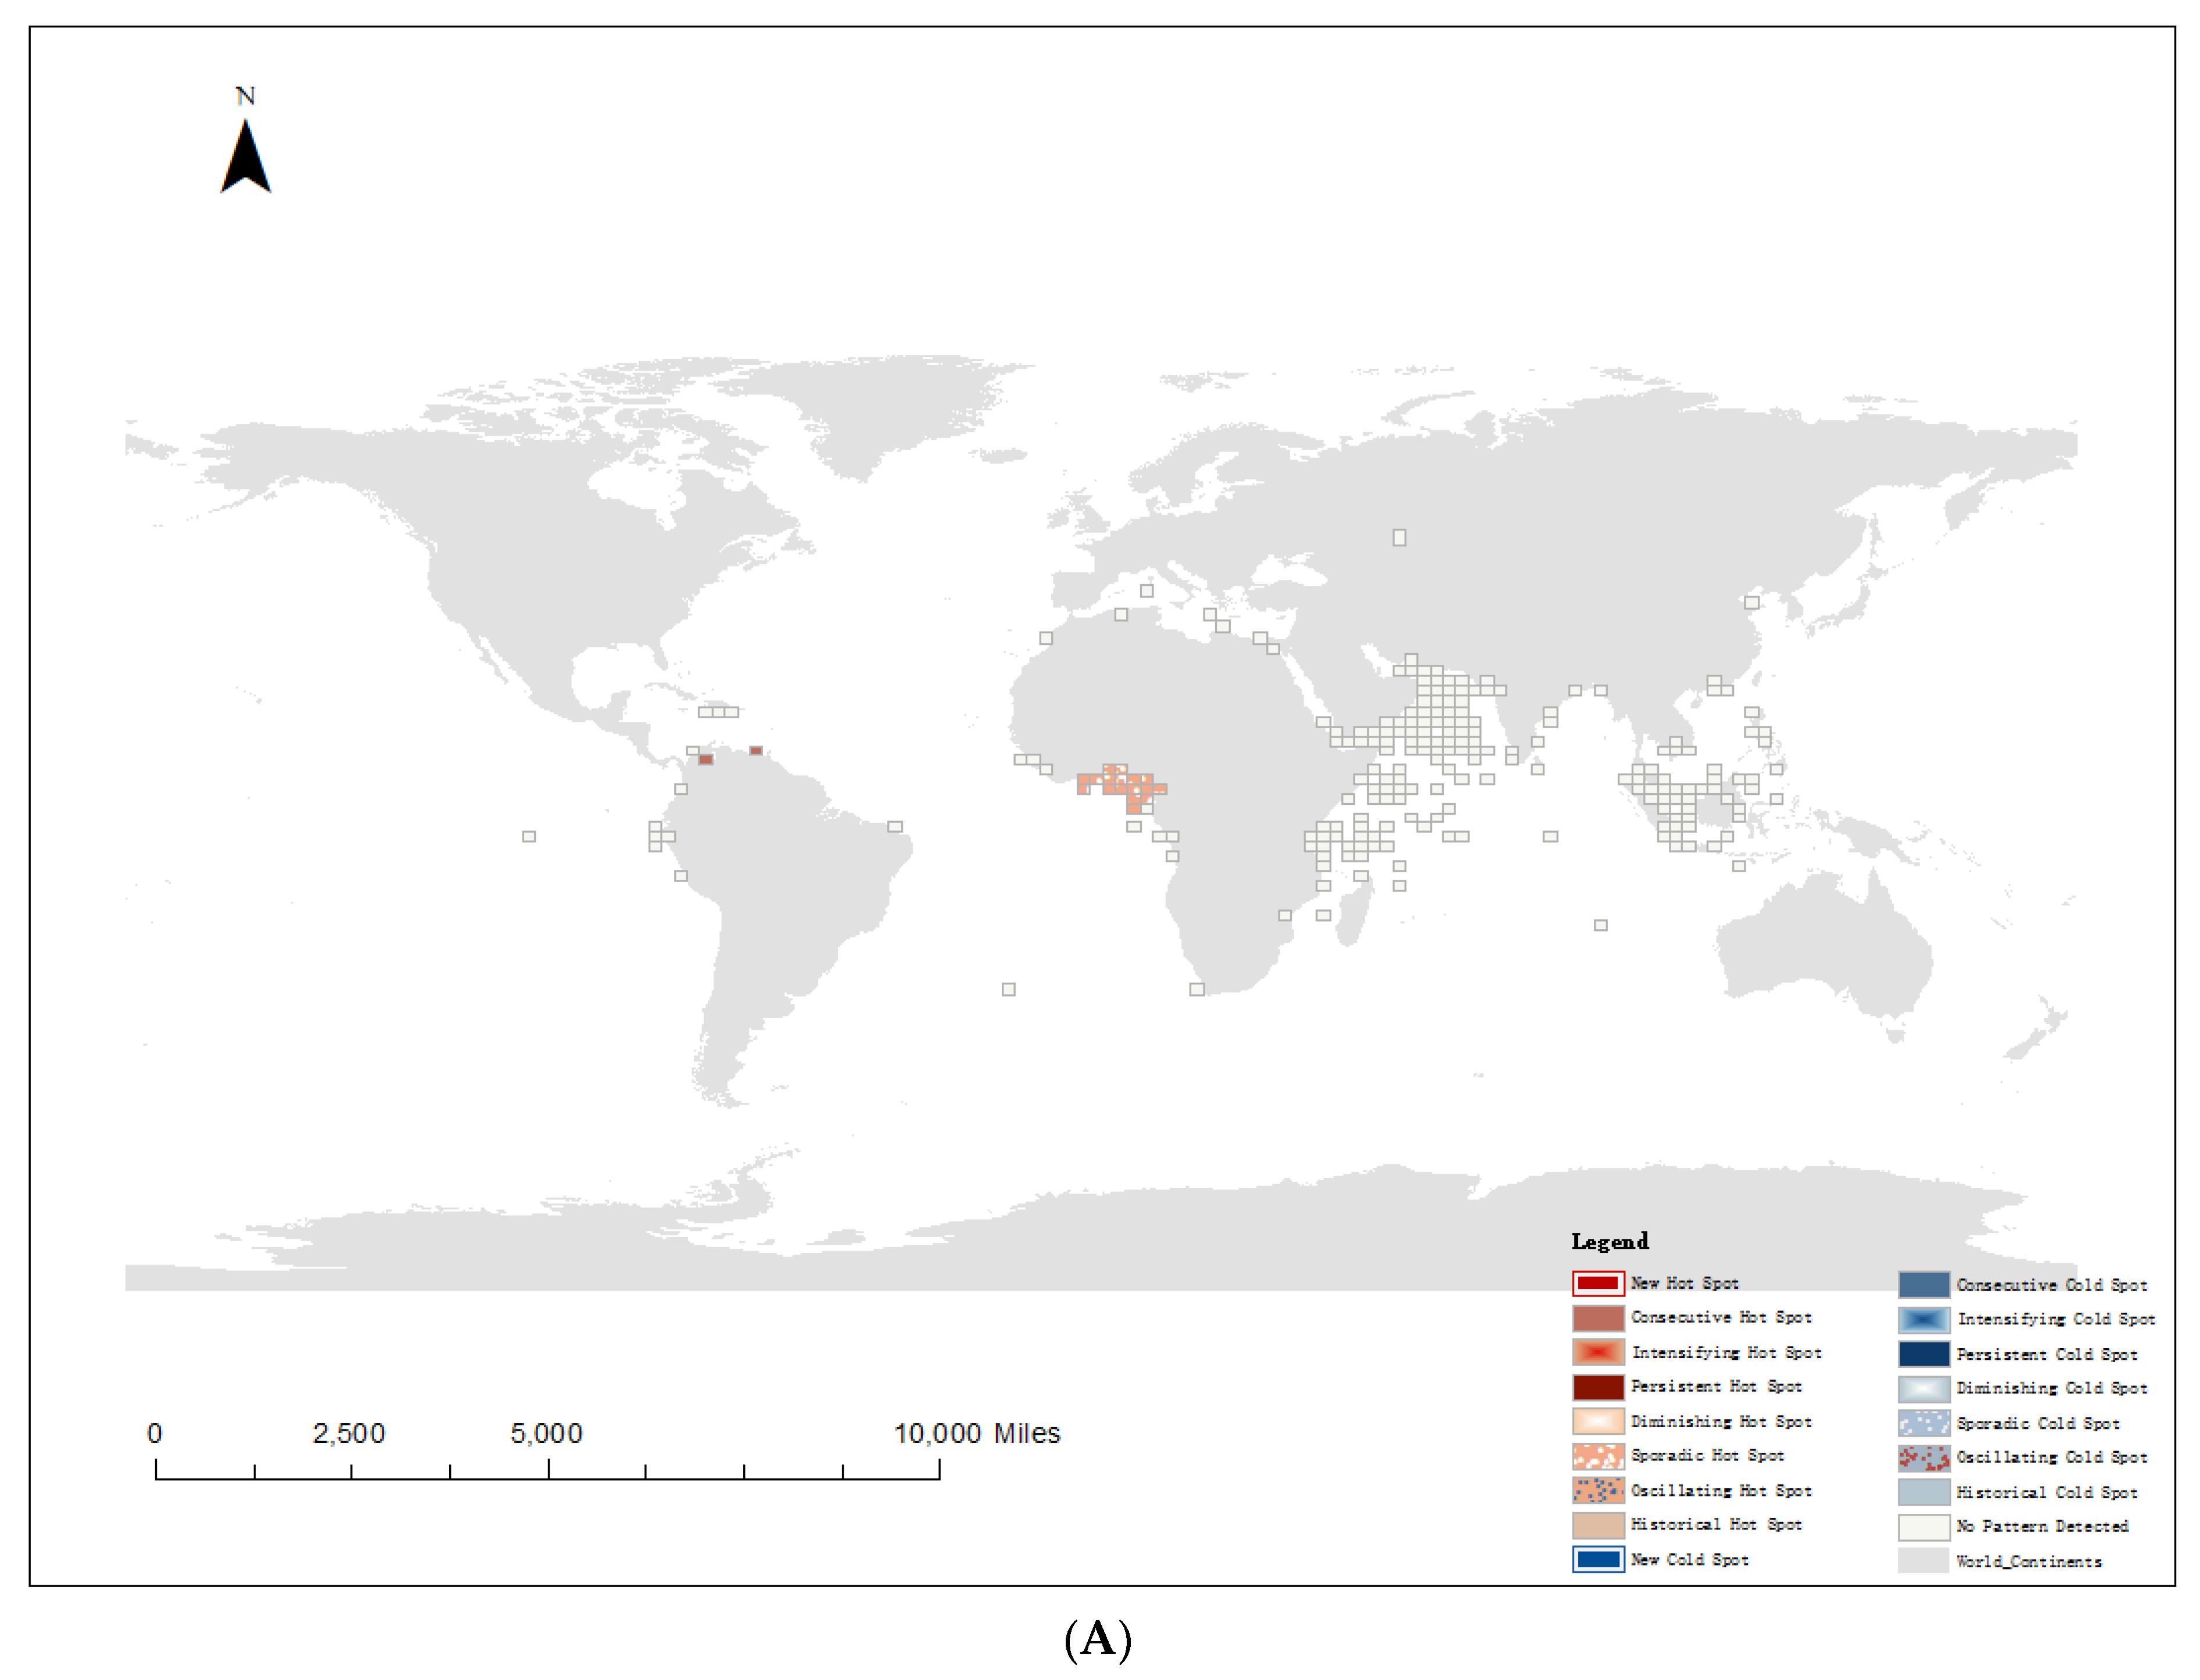
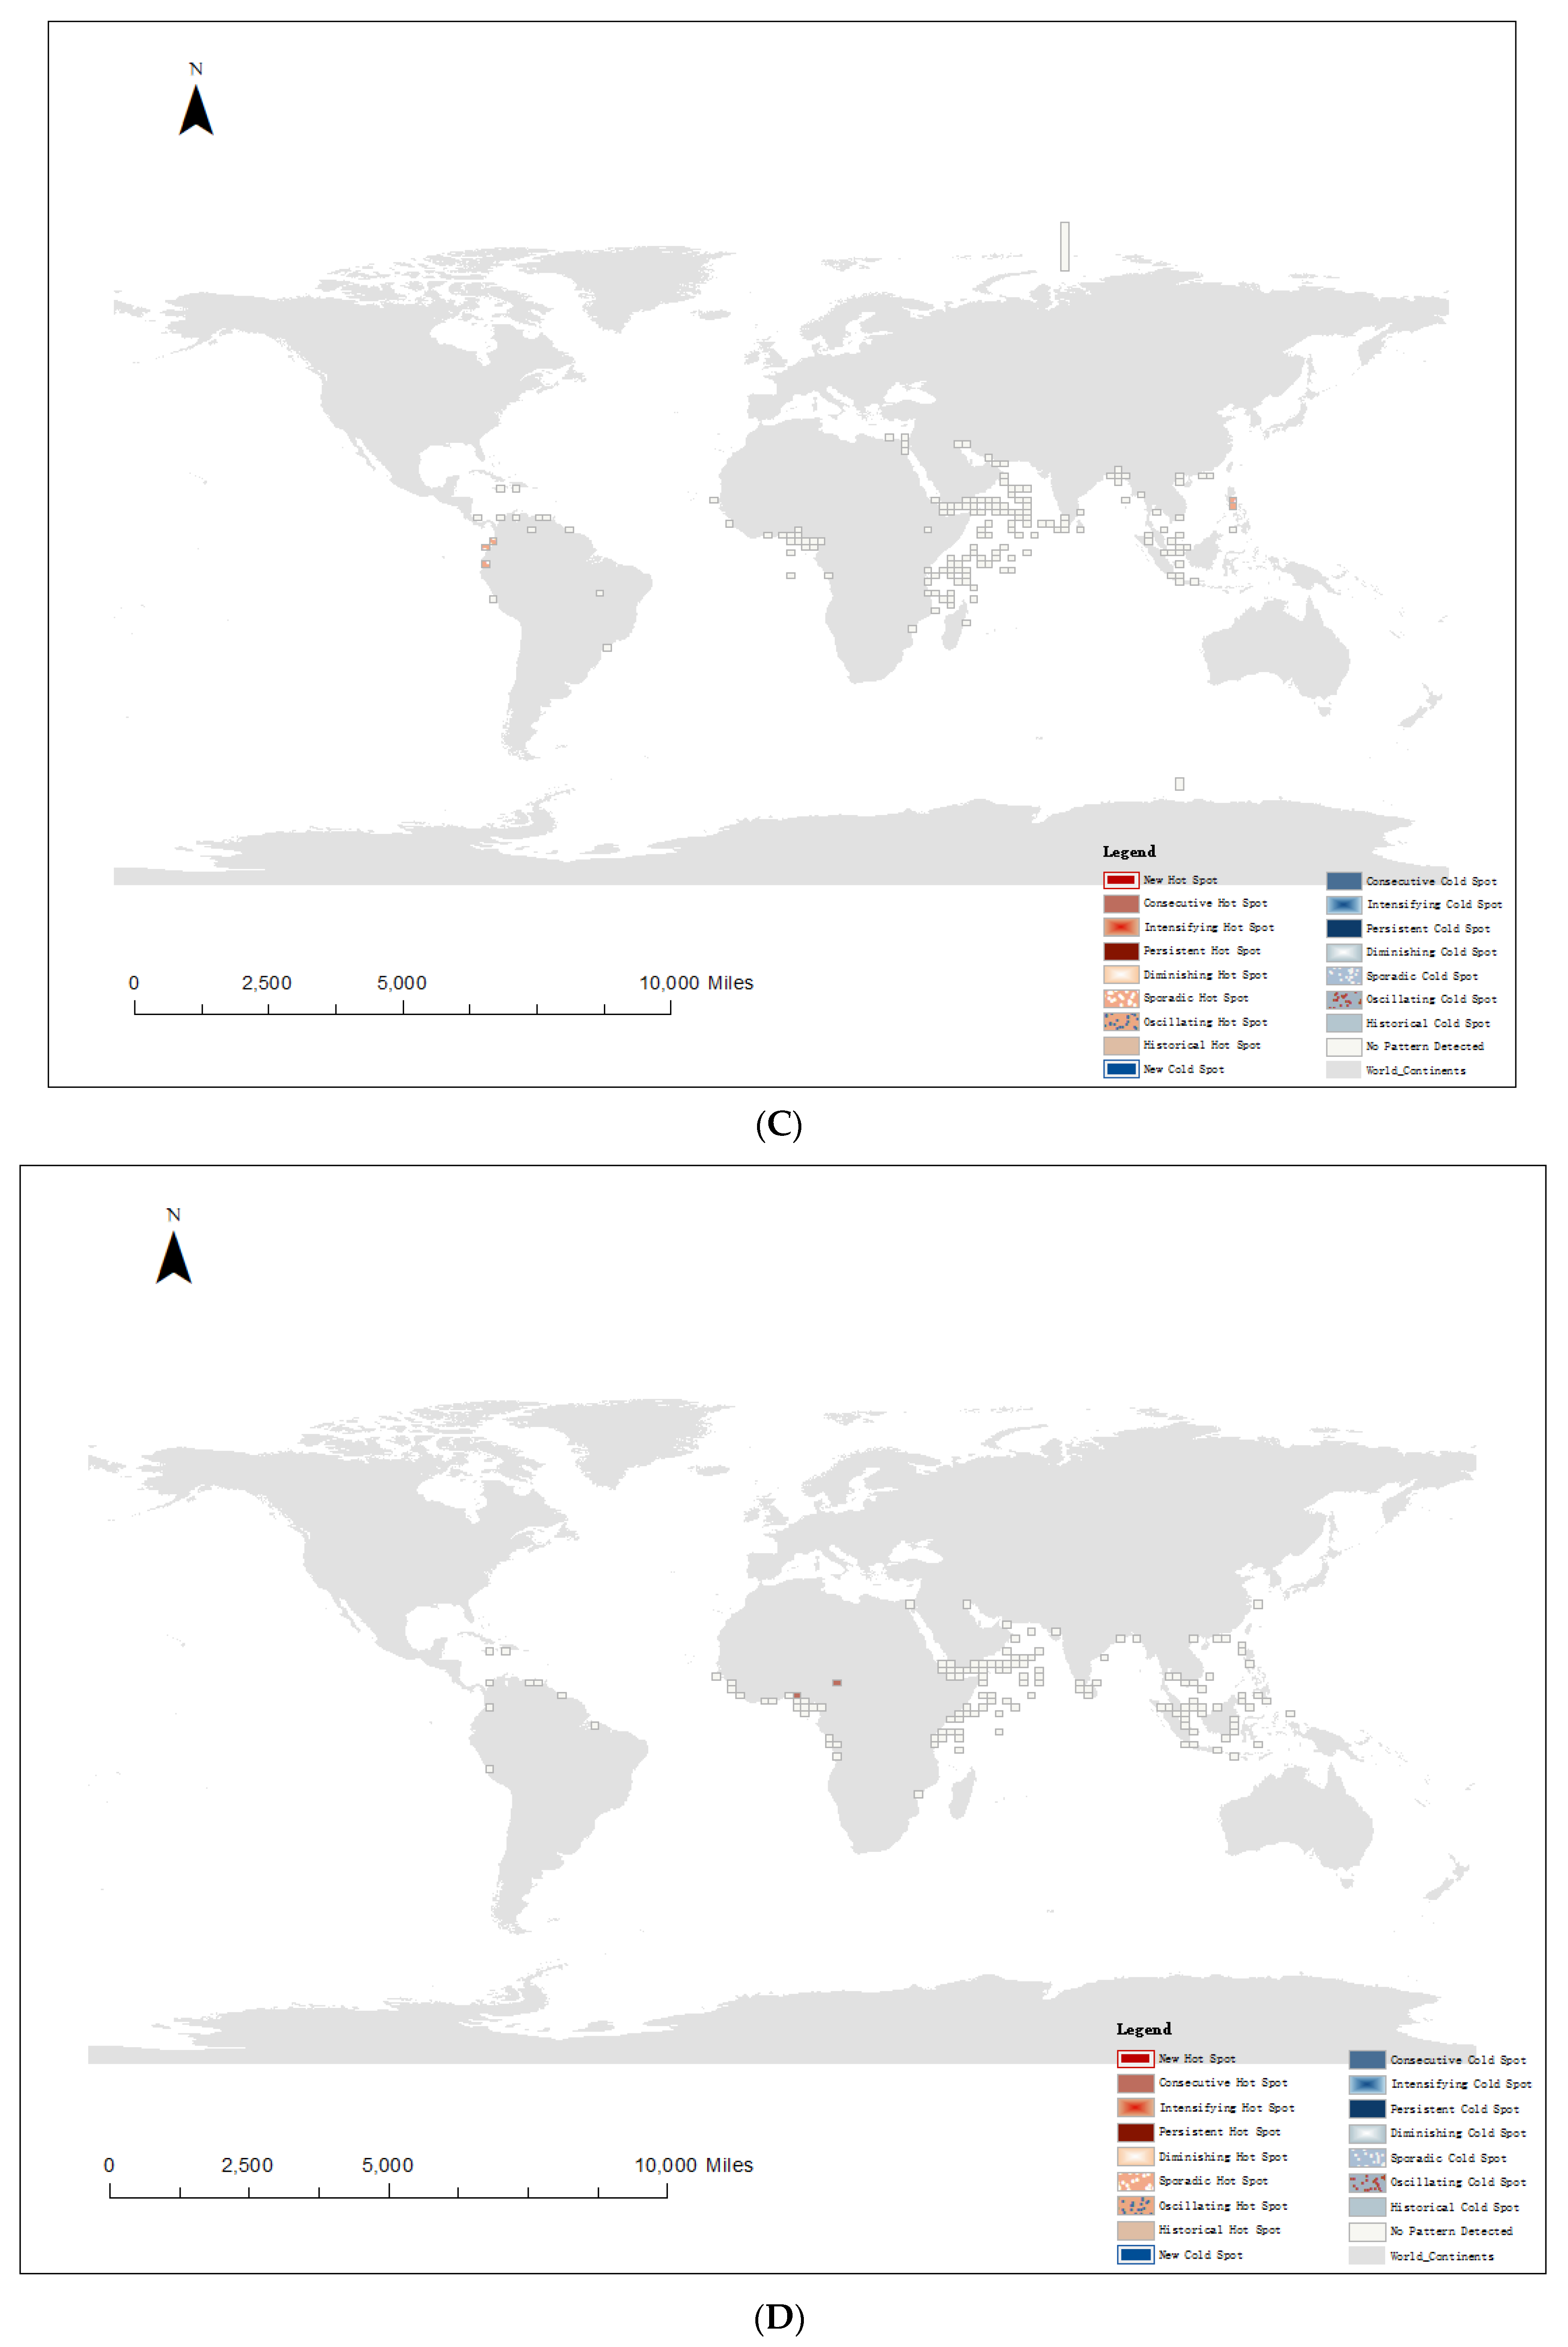
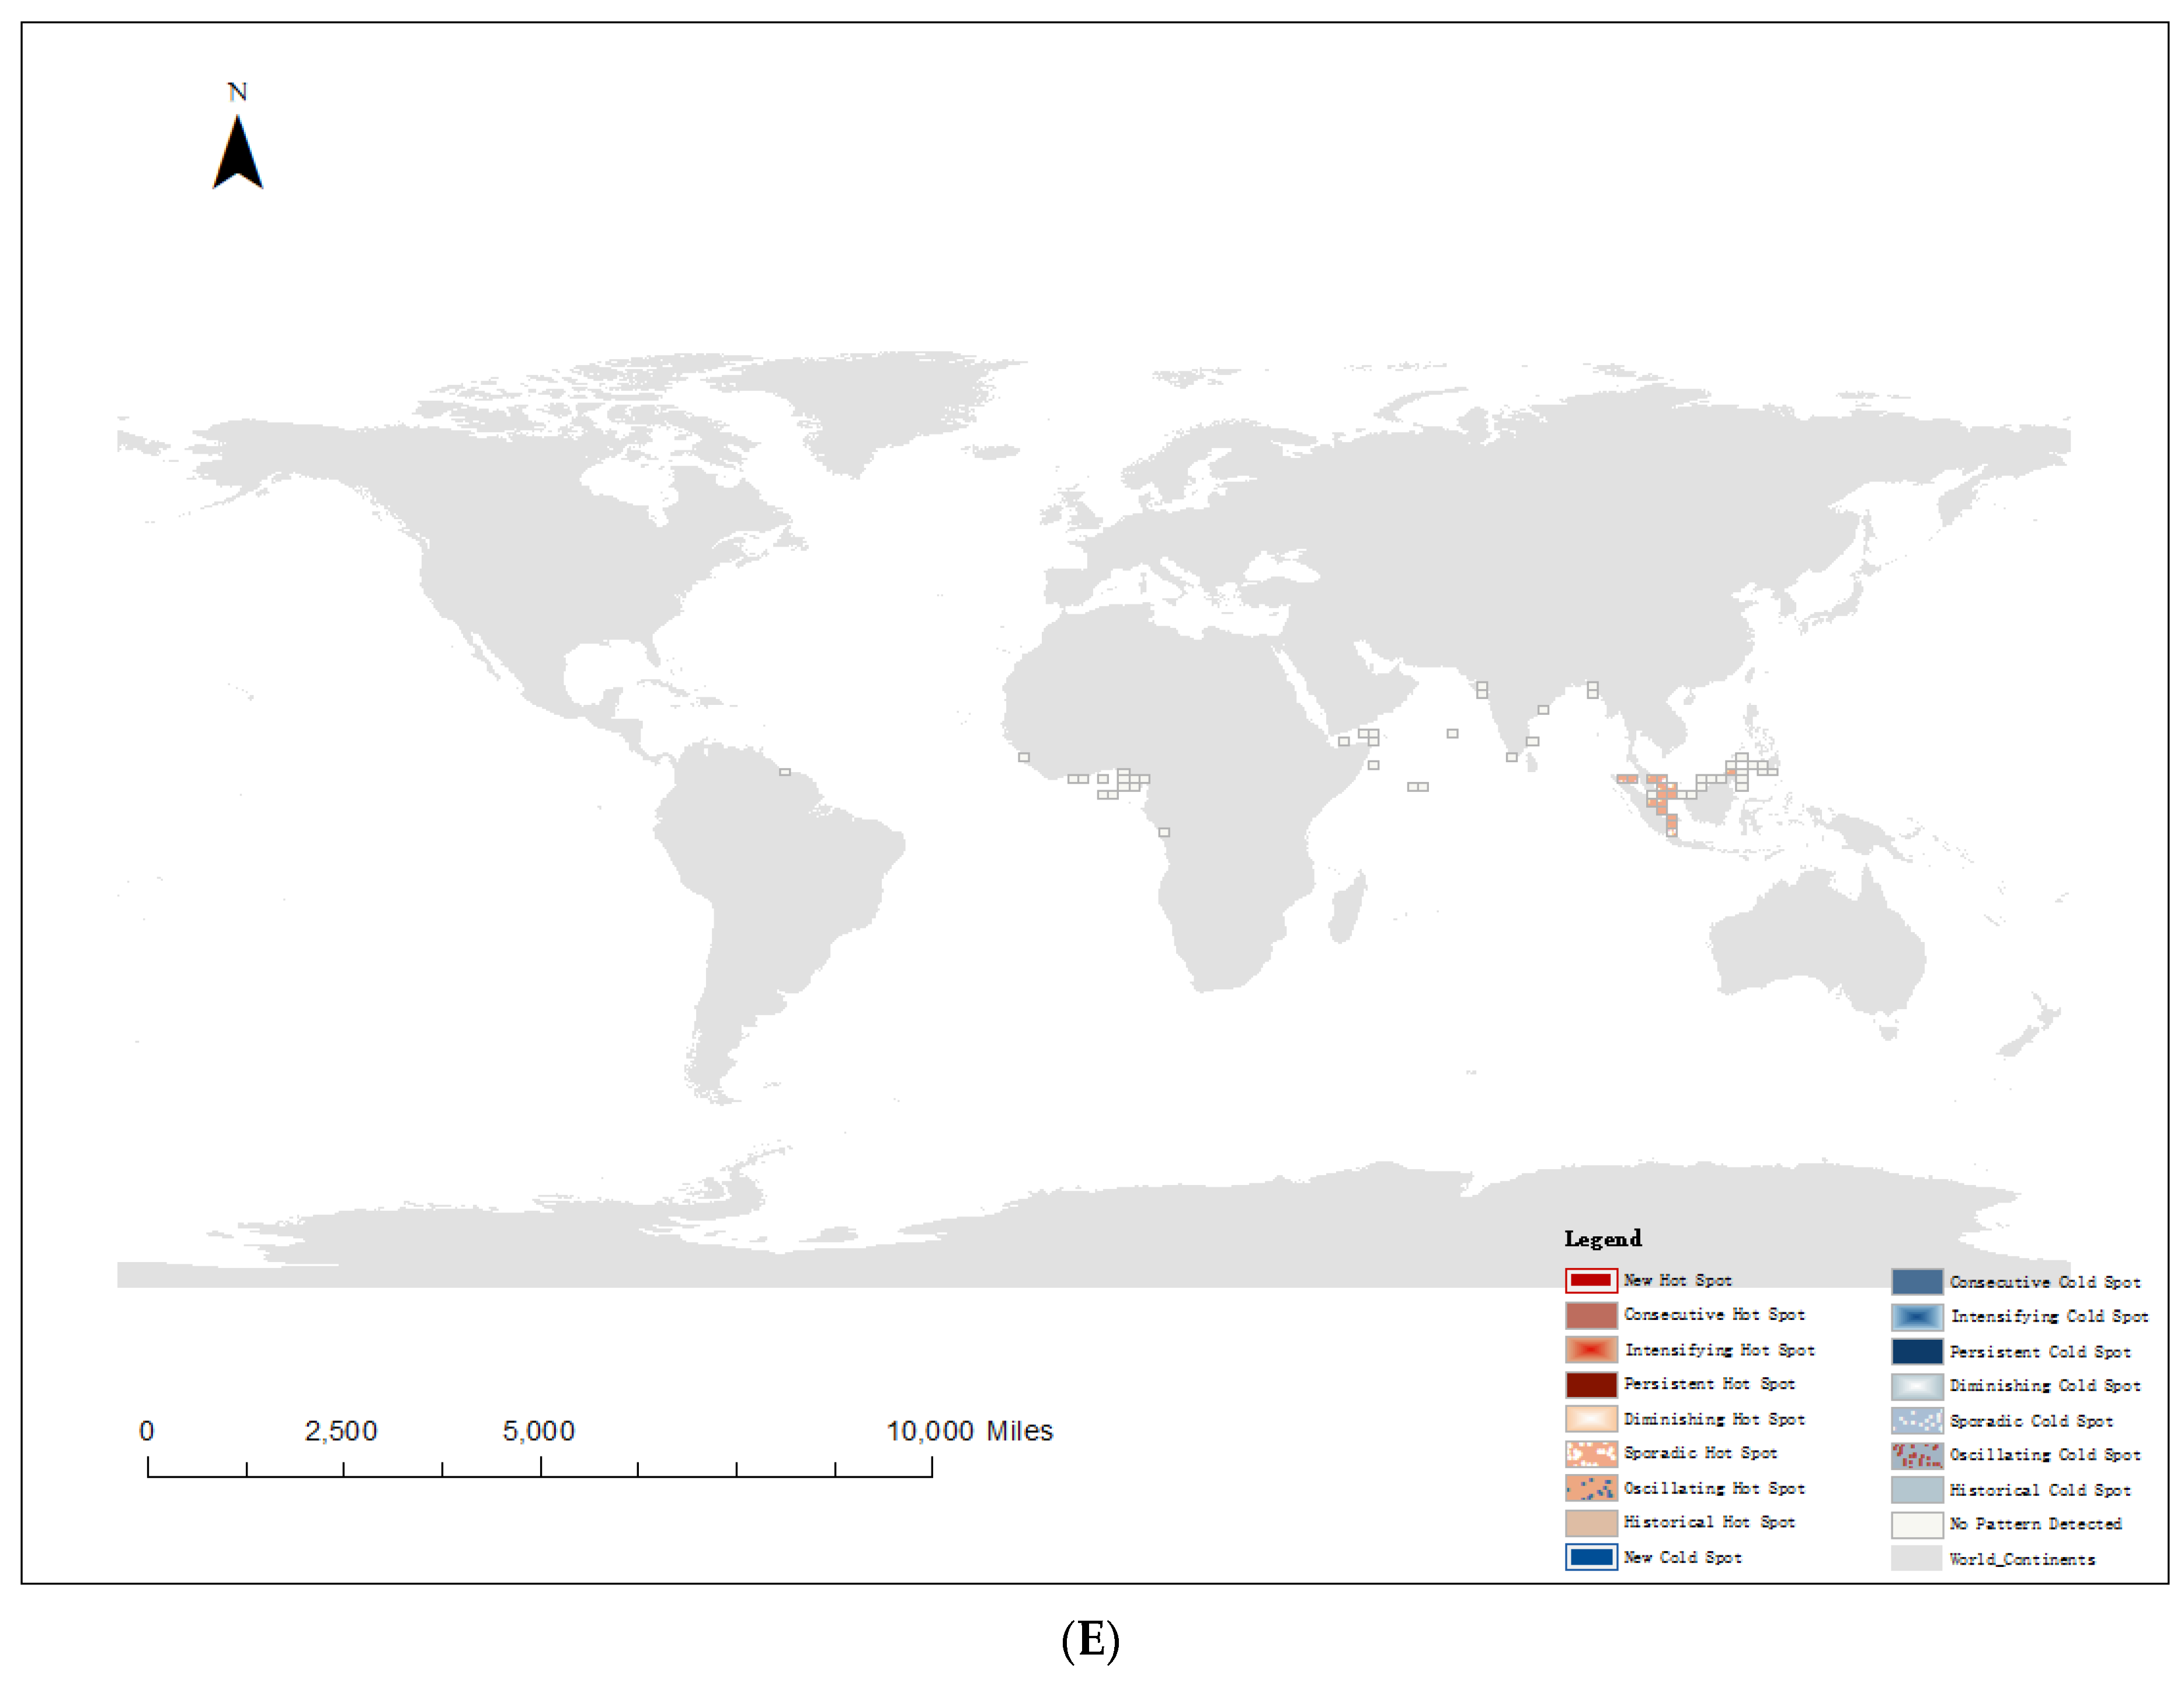
4.3. Spatiotemporal Hot Spot Analysis of Pirate Attacks

After the pirate attacks suffered by different ship types were integrated and events were collected, spatiotemporal cubes could be created as input data for further analysis. Then, spatiotemporal hot spot analysis could be performed to study the hot or cold spot directions of piracy attacks over time. The z-score value of Getis-Ord Gi* statistics at each position was counted, and the variation trends of hot spots and cold spots were classified according to the definitions given in Table 3 to obtain the analysis results of the spatiotemporal hotspot patterns for each ship type (see Figure 3).
In Figure 3, the location of the orange-colored squares is the spatiotemporal hot spot. The location of the blue-colored squares is the spatiotemporal cold spot, and the white squares indicate the locations in which the changing direction is not obvious. Based on the definitions of a specific hot spot or cold spot trend given in Table 3, only one type of spatiotemporal cold spot was detected, which was oscillating cold spots. The oscillating cold spots identified the frequency of pirate attacks in the given area, going up and down. However, the types of spatiotemporal hot spots were relatively diverse, and three types of spatiotemporal hot spots were identified, including new hot spots, continuous hot spots, and scattered hot spots. The new hot spot area recognized that it was not a hot spot before but became a statistically notable hot spot in a relatively recent period. Pirate attacks in continuous hotspot areas were relatively frequent and uninterrupted. In the scattered hot spot area, hot spots did not appear continuously, but there was no cold spot.
For different ship types in the same area, the trends of hot and cold spots were different. Venezuelan waters in northwestern South America were new hot spots for tankers, and the Gulf of Guinea region was a continuous hot spot for tankers. The Makassar and Malacca Straits were successive hotspots for dry bulk carriers. Northwestern South America was a hotspot for container ship attacks. The Strait of Malacca and Malaysia were hotspots for tugboat attacks. The obtained results could be used to allocate specific ship types to certain routes in response to pirate attacks in different regions.

5. Conclusions

Maritime piracy brings considerable threats to maritime trade, with substantial commodities, ranging from high-value manufactured products to energy and raw materials, being shipped between worldwide economic powerhouses [30]. Based on the analysis of pirate attacks from July 1994 to December 2019, the presented study explored the spatial distribution of pirate attacks. We also investigated the locations of cold spots and hot spots and the trends of cold spots and hot spots over time for different ship types. The results highlight that: (1) Pirate attacks can be associated with a regional clustering pattern, mainly occurring in the waters off Somalia, the Strait of Malacca, the Philippines, the Bay of Bengal, the Gulf of Guinea, and the northwest of South America, among which the Strait of Malacca is the core area of all ship types attacked. The common features of the regions where the attacks occur are an economic downturn, a high unemployment rate, and social unrest. (2) The main three ship types, including tankers, dry bulk carriers, and container vessels are attacked in similar cold spots and hot spots. Pirates are widely distributed in Somali waters, which is a remarkable cold spot for attacks; (3) The variation trends of cold and hot spots for pirate attacks on different ship types in the same region are diversified.
As such, we may propose that the small vessel owners who usually navigate in the waters off Somalia, the Strait of Malacca, the Philippines, the Gulf of Guinea, the Bay of Bengal, and the northwest of South America increase the anti-piracy awareness of the crew and reinforce anti-piracy equipment in the vessels because these kinds of vessels are most vulnerable to pirate attacks. Also, the ship owners are recommended to move across the waters of Somalia, the Strait of Malacca, the Philippines, the Gulf of Guinea, the Bay of Bengal, and the northwest of South America during the daytime. The probability increases with an increase in the rate of success of piracy during the night. Moreover, we propose that ship operators or owners arrange anti-piracy drills to become aware of possible anti-piracy actions like navy support, alarm, and avoidance due to such measures can significantly minimize the chance of a successful attack [7].
In addition, this study adopted GIS to show the scale and spatial distribution of the occurrence of pirate attacks, which can provide a valuable reference basis for the IMO, local authorities, policymakers, and governments to combat piracy. In addition, the outcomes of the present research can be useful for maritime transport operators to minimize the risk of pirate attacks. Moreover, our study can offer useful information on the development and realization of policies for fighting maritime piracy, including the location, financial commitments, and extent of international cooperation. To encounter piracy, we propose the local authorities to reinforce maritime patrols and escorts in hot spots repeated by pirates [7].
Nevertheless, the current study can be further expanded in several research directions as part of future research. To conduct a comparative study, future research may consider the analysis of piracy attacks during and after the COVID-19 pandemic. As such, we may identify the spatiotemporal changing pattern of sea freight transport networks during and after the COVID-19 pandemic. Currently, piracy attacks are a hot topic and an urgent issue for maritime stakeholders. The future studies may conduct semi-structured, in-depth interviews with various maritime stakeholders, including ship operators, policymakers, government bodies, port and terminal operators, and traders, to provide valuable insights and constructive feedback on how to resist and prevent piracy. Through the qualitative research approach, we may identify the organizational behavior in response to the piracy attack. The thematic analysis may foster the construction of a theoretical framework for maritime safety. Furthermore, another interesting future research direction may focus on assessing the global maritime piracy risk to construct a resilient maritime supply chain network by adopting Bayesian network modeling and complex network analysis. As such, the future study may develop valuable insights and practical guidelines that can make the international firm’s global maritime supply chain more resilient in the emergence of maritime piracy risks.

Author Contributions

Conceptualization: Q.C. and H.Z.; Methodology: Q.C., H.Z. and K.L.; Formal analysis and investigation: Q.C. and H.Z.; Writing—original draft preparation: Q.C. and H.Z.; Writing—review and editing: H.Z., Y.-y.L., K.L., A.K.Y.N., W.C., Q.L. and M.A.D.; Supervision: A.K.Y.N., K.L., and M.A.D. All authors have read and agreed to the published version of the manuscript.

Funding

This research was funded by a major project of Fujian Provincial Department of Education (JAT220181), research on Building a New Highland for Marine Scientific Research and Innovation in Xiamen (Xiamen Society Scientific Research [2023] No. C08), National Science Foundation of China (UICR0600041), Natural Science Fund Project of Jimei University (ZQ2022042), research on Carbon Peaking Technology of Shipping Industry in Zhejiang Province (Grant number: ZK202323), Xiamen Natural Science Foundation (No. 3502Z20227212), Fujian Province Young and Middle-aged Teacher Education Research Project (JAT210221), Fujian University Education and Teaching Research Project (FBJG20220200).

Institutional Review Board Statement

This article does not contain any studies with human participants or animals per-formed by any of the authors.

Informed Consent Statement

Not applicable.

Data Availability Statement

The datasets used and/or analyzed during the current study are available from the correspond-ing author on reasonable request.

Conflicts of Interest

The authors declare no conflict of interest.

References

  1. Ahmad, M. Maritime piracy operations: Some legal issues. J. Int. Marit. Saf. Environ. Aff. Shipp. 2020, 4, 62–69. [Google Scholar] [CrossRef]
  2. Hastings, J.V. The Return of Sophisticated Maritime Piracy to Southeast Asia. Pac. Aff. 2020, 93, 5–29. [Google Scholar] [CrossRef]
  3. Elmi, Z.; Singh, P.; Meriga, V.K.; Goniewicz, K.; Borowska-Stefańska, M.; Wiśniewski, S.; Dulebenets, M.A. Uncertainties in Liner Shipping and Ship Schedule Recovery: A State-of-the-Art Review. J. Mar. Sci. Eng. 2022, 10, 563. [Google Scholar] [CrossRef]
  4. Lau, Y.-y.; Ducruet, C.; Ng, A.K.Y.; Fu, X. Across the waves: A bibliometric analysis of container shipping research since the 1960s. Marit. Policy Manag. 2017, 44, 667–684. [Google Scholar] [CrossRef]
  5. Wang, L.; Zhu, Y.; Ducruet, C.; Bunel, M.; Lau, Y.-Y. From hierarchy to networking: The evolution of the “twenty-first-century Maritime Silk Road” container shipping system. Transp. Rev. 2018, 38, 416–435. [Google Scholar] [CrossRef]
  6. Bueger, C. Learning from piracy: Future challenges of maritime security governance. Glob. Aff. 2015, 1, 33–42. [Google Scholar] [CrossRef]
  7. Gong, X.; Jiang, H.; Yang, D. Maritime piracy risk assessment and policy implications: A two-step approach. Mar. Policy 2023, 150, 105547. [Google Scholar] [CrossRef]
  8. UNCTAD. United Nations Conference on Trade and Development, 2014, Part I: An Overview of Trends, Costs and Tradetrelated Implications. 2014. Available online: https://unctad.org/system/files/official-document/dtltlb2013d1_en.pdf (accessed on 1 October 2023).
  9. Jin, M.; Shi, W.; Lin, K.C.; Li, K.X. Marine piracy prediction and prevention: Policy implications. Mar. Policy 2019, 108, 103528. [Google Scholar] [CrossRef]
  10. Jiang, M.; Lu, J. The analysis of maritime piracy occurred in Southeast Asia by using Bayesian network. Transp. Res. Part E Logist. Transp. Rev. 2020, 139, 101965. [Google Scholar] [CrossRef]
  11. Liu, K.; Yang, L.; Li, M. Application of Cloud Model and Bayesian Network to Piracy Risk Assessment. Math. Probl. Eng. 2021. 2021, 2021, 6610339. [Google Scholar] [CrossRef]
  12. Nwokedi, T.C.; Anyanwu, J.; Eko-Rapheaels, M.; Obasi, C.; Akpufu, I.D.; Ogola, D.B. Probability Theory Analysis of Maritime Piracy and the Implications for Maritime Security Governance. J. ETA Marit. Sci. 2022, 10, 133–143. [Google Scholar] [CrossRef]
  13. Marchione, E.; Johnson, S.D. Spatial, Temporal and Spatio-Temporal Patterns of Maritime Piracy. J. Res. Crime Delinq. 2013, 50, 504–524. [Google Scholar] [CrossRef] [PubMed]
  14. Denton, G.L.; Harris, J.R. Maritime Piracy, Military Capacity, and Institutions in the Gulf of Guinea. Terror. Political Violence 2022, 34, 1–27. [Google Scholar] [CrossRef]
  15. Phayal, A.; Gold, A.; Prins, B. Interstate hostility and maritime crime: Evidence from South East Asia. Mar. Policy 2022, 143, 105134. [Google Scholar] [CrossRef]
  16. Fan, H.; Lu, J.; Chang, Z. A risk-based game theory model of navy and pirate behaviors. Ocean. Coast. Manag. 2022, 225, 106200. [Google Scholar] [CrossRef]
  17. Sandkamp, A.; Stamer, V.; Yang, S. Where has the rum gone? The impact of maritime piracy on trade and transport. Rev. World Econ. 2022, 158, 751–778. [Google Scholar] [CrossRef]
  18. Divine Caesar, L.; Cahoon, S.; Fei, J.; Sallah, C.A. Exploring the antecedents of high mobility among ship officers: Empirical evidence from Australia. Marit. Policy Manag. 2021, 48, 109–128. [Google Scholar] [CrossRef]
  19. Rosnani, R.; Heryadi, D.; Yani, Y.M.; Sinaga, O. ASEAN Maritime Security Cooperation. TransNav. Int. J. Mar. Navig. Saf. Sea Transp. 2022, 16, 413–417. [Google Scholar]
  20. Dong, B.; Morrison, C.N.; Branas, C.C.; Richmond, T.S.; Wiebe, D.J. As Violence Unfolds: A Space-Time Study of Situational Triggers of Violent Victimization among Urban Youth. J. Quant. Criminol. 2020, 36, 119–152. [Google Scholar] [CrossRef]
  21. Martins Filho, T.R.; Melo, S.N. School performance and violence: Intra-urban evaluation of an Amazonian metropolis. Cities 2023, 132, 104074. [Google Scholar] [CrossRef]
  22. Rosa, A.G.F.; Mota, C.M.D.M.; Figueiredo, C.J.J.D. A spatial multi-criteria decision analysis framework to reveal vulnerabilities of areas to incidences of street robberies. Appl. Geogr. 2023, 151, 102840. [Google Scholar] [CrossRef]
  23. Silva, C.; Melo, S.; Santos, A.; Junior, P.A.; Sato, S.; Santiago, K.; Sá, L. Spatial Modeling for Homicide Rates Estimation in Pernambuco State-Brazil. ISPRS Int. J. Geo-Inf. 2020, 9, 740. [Google Scholar] [CrossRef]
  24. Stassen, R.; Ceccato, V. Environmental and Wildlife Crime in Sweden from 2000 to 2017. J. Contemp. Crim. Justice 2020, 36, 403–427. [Google Scholar] [CrossRef]
  25. Sukhija, K.; Singh, S.N.; Kumar, M.; Mehrotra, D. Spatial and temporal trends reveal: Hotspot identification of crimes using machine learning approach. Int. J. Comput. Sci. Eng. 2022, 25, 174–185. [Google Scholar] [CrossRef]
  26. Li, G.; Wang, H.; Tan, R.; Fu, Y. Spatiotemporal characteristics and formation mechanism of child trafficking in China based on “successful cases”. Geogr. Res. 2017, 36, 2505–2520. [Google Scholar]
  27. ArcGIS Pro. 2023. Available online: https://pro.arcgis.com/zh-cn/pro-app/latest/tool-reference/spatial-analyst/an-overview-of-the-density-tools.htm (accessed on 1 October 2023).
  28. Kloog, I.; Haim, A.; Portnov, B.A. Using kernel density function as an urban analysis tool: Investigating the association between nightlight exposure and the incidence of breast cancer in Haifa, Israel. Comput. Environ. Urban Syst. 2009, 33, 55–63. [Google Scholar] [CrossRef]
  29. Alam, M.S.; Tabassum, N.J. Spatial pattern identification and crash severity analysis of road traffic crash hot spots in Ohio. Heliyon 2023, 9, e16303. [Google Scholar] [CrossRef]
  30. Fu, X.; Ng, A.K.Y.; Lau, Y.-Y. The impacts of maritime piracy on global economic development: The case of Somalia. Marit. Policy Manag. 2010, 37, 677–697. [Google Scholar] [CrossRef]
Figure 1. Kernel density analysis of pirate attacks: (A) tankers, (B) dry bulk carriers, (C) container vessels, (D) general cargo vessels, and (E) tugs.
Jmse 11 02295 g001aJmse 11 02295 g001bJmse 11 02295 g001c
Figure 2. Hotspot analysis of pirate attacks: (A) tankers, (B) bulk carriers, (C) container vessels, (D) general cargo vessels, and (E) tugs.
Jmse 11 02295 g002aJmse 11 02295 g002bJmse 11 02295 g002cJmse 11 02295 g002d
Figure 3. Spatiotemporal hotspot analysis of pirate attacks: (A) tankers, (B) bulk carriers, (C) container vessels, (D) general cargo vessels, and (E) tugs.
Jmse 11 02295 g003aJmse 11 02295 g003bJmse 11 02295 g003cJmse 11 02295 g003d
Table 1. Number of pirate attacks for different vessel types.
Ship TypeNumber of Pirate Attacks
Tanker1411
Bulk carrier863
Container vessel516
General cargo vessel328
Tug217
Table 2. Critical values of z-scores and p-values at different confidence levels.
Z-Score (Standard Deviation)p-Value (Probability)Confidence Degree
<−1.65 or >+1.65<0.1090%
<−1.96 or >+1.96<0.0595%
<−2.58 or >+2.58<0.0199%
Table 3. Trends and definitions of specific hot or cold spots.
Pattern NameDefinition
No pattern detectedIt does not belong to any of the cold or hot spot patterns explained below.
New cold spots (or hot spots)This position is a statistically remarkable cold (or hot) spot for the last time step and has absolutely not been a cold (or hot) spot of statistical significance before.
Continuous cold spots (or hot spots)This position has a sole continuous operation of statistically significant cold (or hot) bins in the last time step interval. It is most certaintly not a statistically remarkable cold (or hot) spot until the last hot spot runs, and at most 90% of every bin is a statistically remarkable cold (or hot) spot.
Strengthening cold spots (or hot spots)This position has been a statistically remarkable cold (or hot) spot for 90% of the time step intervals, pertaining to the last. Moreover, the clustering intensity of the larger (or smaller) number of every time step rises in general, and the rise is statistically notable.
Persistent cold spots (or hot spots)This position is already a statistically remarkable cold (or hot) spot at 90%-time step intervals, and there is no obvious direction indicating that the clustering intensity increases or decreases over time.
Gradually decreasing cold spots (or hot spots)This position has been a statistically remarkable cold (or hot) spot for 90% of the time step intervals, containing the last time step. Additionally, the intensity of a smaller number of clusters in every time step decreases generally, and the reduction is statistically notable.
Scattered cold spots (or hot spots)This position is a period cold spot (or hot spot). Up to 90% of the time step intervals are already statistically remarkable cold (or hot) spots, and no time step intervals are statistically significant hot (or cold) spots.
Oscillating cold spots (or hot spots)A statistically remarkable cold spot (or hot spot) at the last time step interval has a record of being a statistically remarkable hot spot (or cold spot) in the previous time step. At up to 90% of the time-step intervals, it is already a statistically remarkable cold (or hot) spot.
Historical hot and cold spotsRecnetly, almost the position is not a cold (or hot) spot, but it is already a cold (or hot) spot with statistical remarkable in at least 90% of the intervals.
Disclaimer/Publisher’s Note: The statements, opinions and data contained in all publications are solely those of the individual author(s) and contributor(s) and not of MDPI and/or the editor(s). MDPI and/or the editor(s) disclaim responsibility for any injury to people or property resulting from any ideas, methods, instructions or products referred to in the content.

