Article

Acoustic Evidence of Shallow Gas Occurrences in the Offshore Sinú Fold Belt, Colombian Caribbean Sea

by
Ana María Osorio-Granada
1,2,3,
Bismarck Jigena-Antelo
1,*,
Juan Vidal-Perez
1,
Enrico Zambianchi
3,
Edward G. Osorio-Granada
4,
Cristina Torrecillas
5,
Jeanette Romero-Cozar
1,
Hermann Leon-Rincón
2,
Karem Oviedo-Prada
1,2,6 and
Juan J. Muñoz-Perez
1,*
1
CASEM (Centro Andaluz Superior de Estudios Marinos), Campus de Puerto Real, Universidad de Cadiz, 11510 Puerto Real, Spain
2
Centro de Investigaciones Oceanográficas e Hidrográficas del Caribe, Cartagena de Indias 130001, Colombia
3
Dipartimento di Scienze e Tecnologie, Università degli Studi di Napoli Parthenope, 80143 Naples, Italy
4
Instituto de Investigaciones en Estratigrafía, Universidad de Caldas, Manizales 170004, Colombia
5
Departamento de Ingeniería Gráfica, Universidad de Sevilla, 41092 Sevilla, Spain
6
Kongsberg Maritime Training Center, Boca del Río 94299, Veracruz, Mexico
*
Authors to whom correspondence should be addressed.
J. Mar. Sci. Eng. 2023, 11(11), 2121; https://doi.org/10.3390/jmse11112121
Submission received: 15 September 2023 / Revised: 26 October 2023 / Accepted: 3 November 2023 / Published: 6 November 2023
(This article belongs to the Special Issue Tenth Anniversary of JMSE – Recent Advances and Future Perspectives)

Abstract

:
High-resolution seismic analysis and bathymetry data, used in the Offshore Sinú Fold Belt (OSFB), have revealed seabed and sub-surface anomalies, which were probably caused by the presence of shallow gas within the sedimentary records. Shallow gas is widely detected by the frequent presence of anomalous acoustic reflections including acoustic blanking, enhanced reflections, acoustic plumes, pockmarks, and dome structures. More than 30 anomalies that occur within a subsurface depth of ~65 m were acoustically detected within an area of 1000 km2 on the continental shelf and upper continental slope, in water depths ranging from −20 to −1300 m. Moreover, a map with the spatial distribution of the gas occurrences is shown. A close relationship between the locally elevated seabed (dome structures), pockmarks, and acoustic blanking was found. Most of the active pockmarks may be closely related to the submarine path of the Uramita Fault, indicating that the gas occurrences are controlled by active faulting. The shallow gas occurrence was confirmed by the generation of authigenic carbonate and the occurrence of chemosymbiotic biological communities sampled in the area. Although there is an admixture of biogenic gas, it is believed that many of the features observed relate to thermogenic gas. The identification of these anomalies represents a useful basis for an assessment of marine geohazards and can serve as a hydrocarbon exploration tool.

1. Introduction

The study of submarine, coastal, and insular areas in the world has been widely developed in recent decades [1,2,3,4,5]. This is particularly thanks to the development of technologies and methods in the acoustic, geodesic, geophysical, and remote sensing fields, as well as the improvement in geospatial data management [6,7,8,9,10,11,12]. The incorporation of new methods for the exploration of deep environments has allowed researchers to detect and map shallow gas accumulations in marine deposits [13,14,15]. Following Fleischer et al. [15], shallow gas is defined here as free gas trapped in sub-bottom sediments within a depth of 1000 m; this is the same for Holocene muddy sediments [16], which are considered the most important pathway for the emission of methane from deeper marine sediments to the atmosphere [17], originating in specific structures on the seabed and inducing acoustic features in the sedimentary record [13,15,18,19,20]. Therefore, the detection and mapping of shallow gas is usually performed through the analysis of high-resolution acoustic tools and techniques [13,21,22,23].
Shallow gas in near-surface sediments causes numerous anomalies in seismic data due to acoustic impedance between gas-bearing and gas-free sediments [13,21,24,25,26,27]. These anomalies include: (1) Acoustic turbidity caused by the scattering of acoustic energy due to the presence of gases in the sediment pore space, revealing a poor amplitude and low continuity of reflectors [13,28,29,30]. Acoustically turbid zones represent gas-charged sediments [31]. According to Fanin [32], this effect is already generated with only 1% of gas present in sediments. (2) Acoustic blanking zones related to the absence of sediment layering due the complete absorption of seismic signals in gas-charged sediments [13,29,33]. The most evident acoustic anomaly is blanking, appearing as diffuse and chaotic seismic facies, masking all other reflections [34]. The difference between acoustic turbidity and blanking is explained by the amount of free fluid accumulated in the sediment [35]. (3) Enhanced reflections caused by reflectors that are discontinuous, with high reflectivity or amplitude due to gas content within the shallow sediments [36]. (4) Bright spots resulting from the increase in the acoustic impedance contrast between sediments in which fluid is present and their surrounding areas. This anomaly indicates the top of a fluid-charged sediment with a high-amplitude reverse polarity [37]. The other acoustic features that may indicate the occurrence of shallow gas in seismic data include gas seeps and pockmarks. The acoustic blankings are explained as vertical disturbances of the sediment layer due the acoustic dispersion effect of the upward migration of gases or fluids in pores [36,38]. The vertical disturbances may seem to suggest the presence of small gas seeps [28]. The pockmarks are defined as crater-shaped seabed depressions that are generally related to gas and/or fluid discharge in shallow sediments [39]. Also, large-scale gas leaks can produce numerous bubbles throughout the water column that are detected, using high-frequency echograms, as “gas plumes” or “hydroacoustic flares” [40]. In addition, fluid/gas movement indicators can cause seafloor irregularities such as diapirism, mud volcanism, subsidence and/or landslides, and other indicators [41,42].
The Colombian Caribbean region has been a target for energetic resource explorations since the early 1950s. Since the discovery of the Chuchupa and Ballenas fields in the 1970s [43,44], the region has been considered a gas province originating mainly from microbial activity [45]. Also, the latest discoveries in areas located below 2000 m with the drilling of the Orca (2014), Kronos (2015), Purple Angel (2017), and Gorgon (2022) exploratory wells confirm the presence of an emerging basin dominated by methane [46]. Despite these discoveries, the knowledge of shallow gas-bearing sediments is still limited and the shelf remains poorly understood. In this study, we analyzed multibeam bathymetry and seismic sub-bottom profilers (SBPs) in the Offshore Sinú Fold Belt (OSFB), in the Colombian Caribbean Sea, to describe and map the acoustic anomalies related to the occurrence of gas. The study was largely focused on the shallow gassy sediments. The knowledge obtained will be helpful analysis as a proxy for seep distribution and seep activity; it can serve as an indicator for deeper hydrocarbon reserves and thus as an exploration tool.

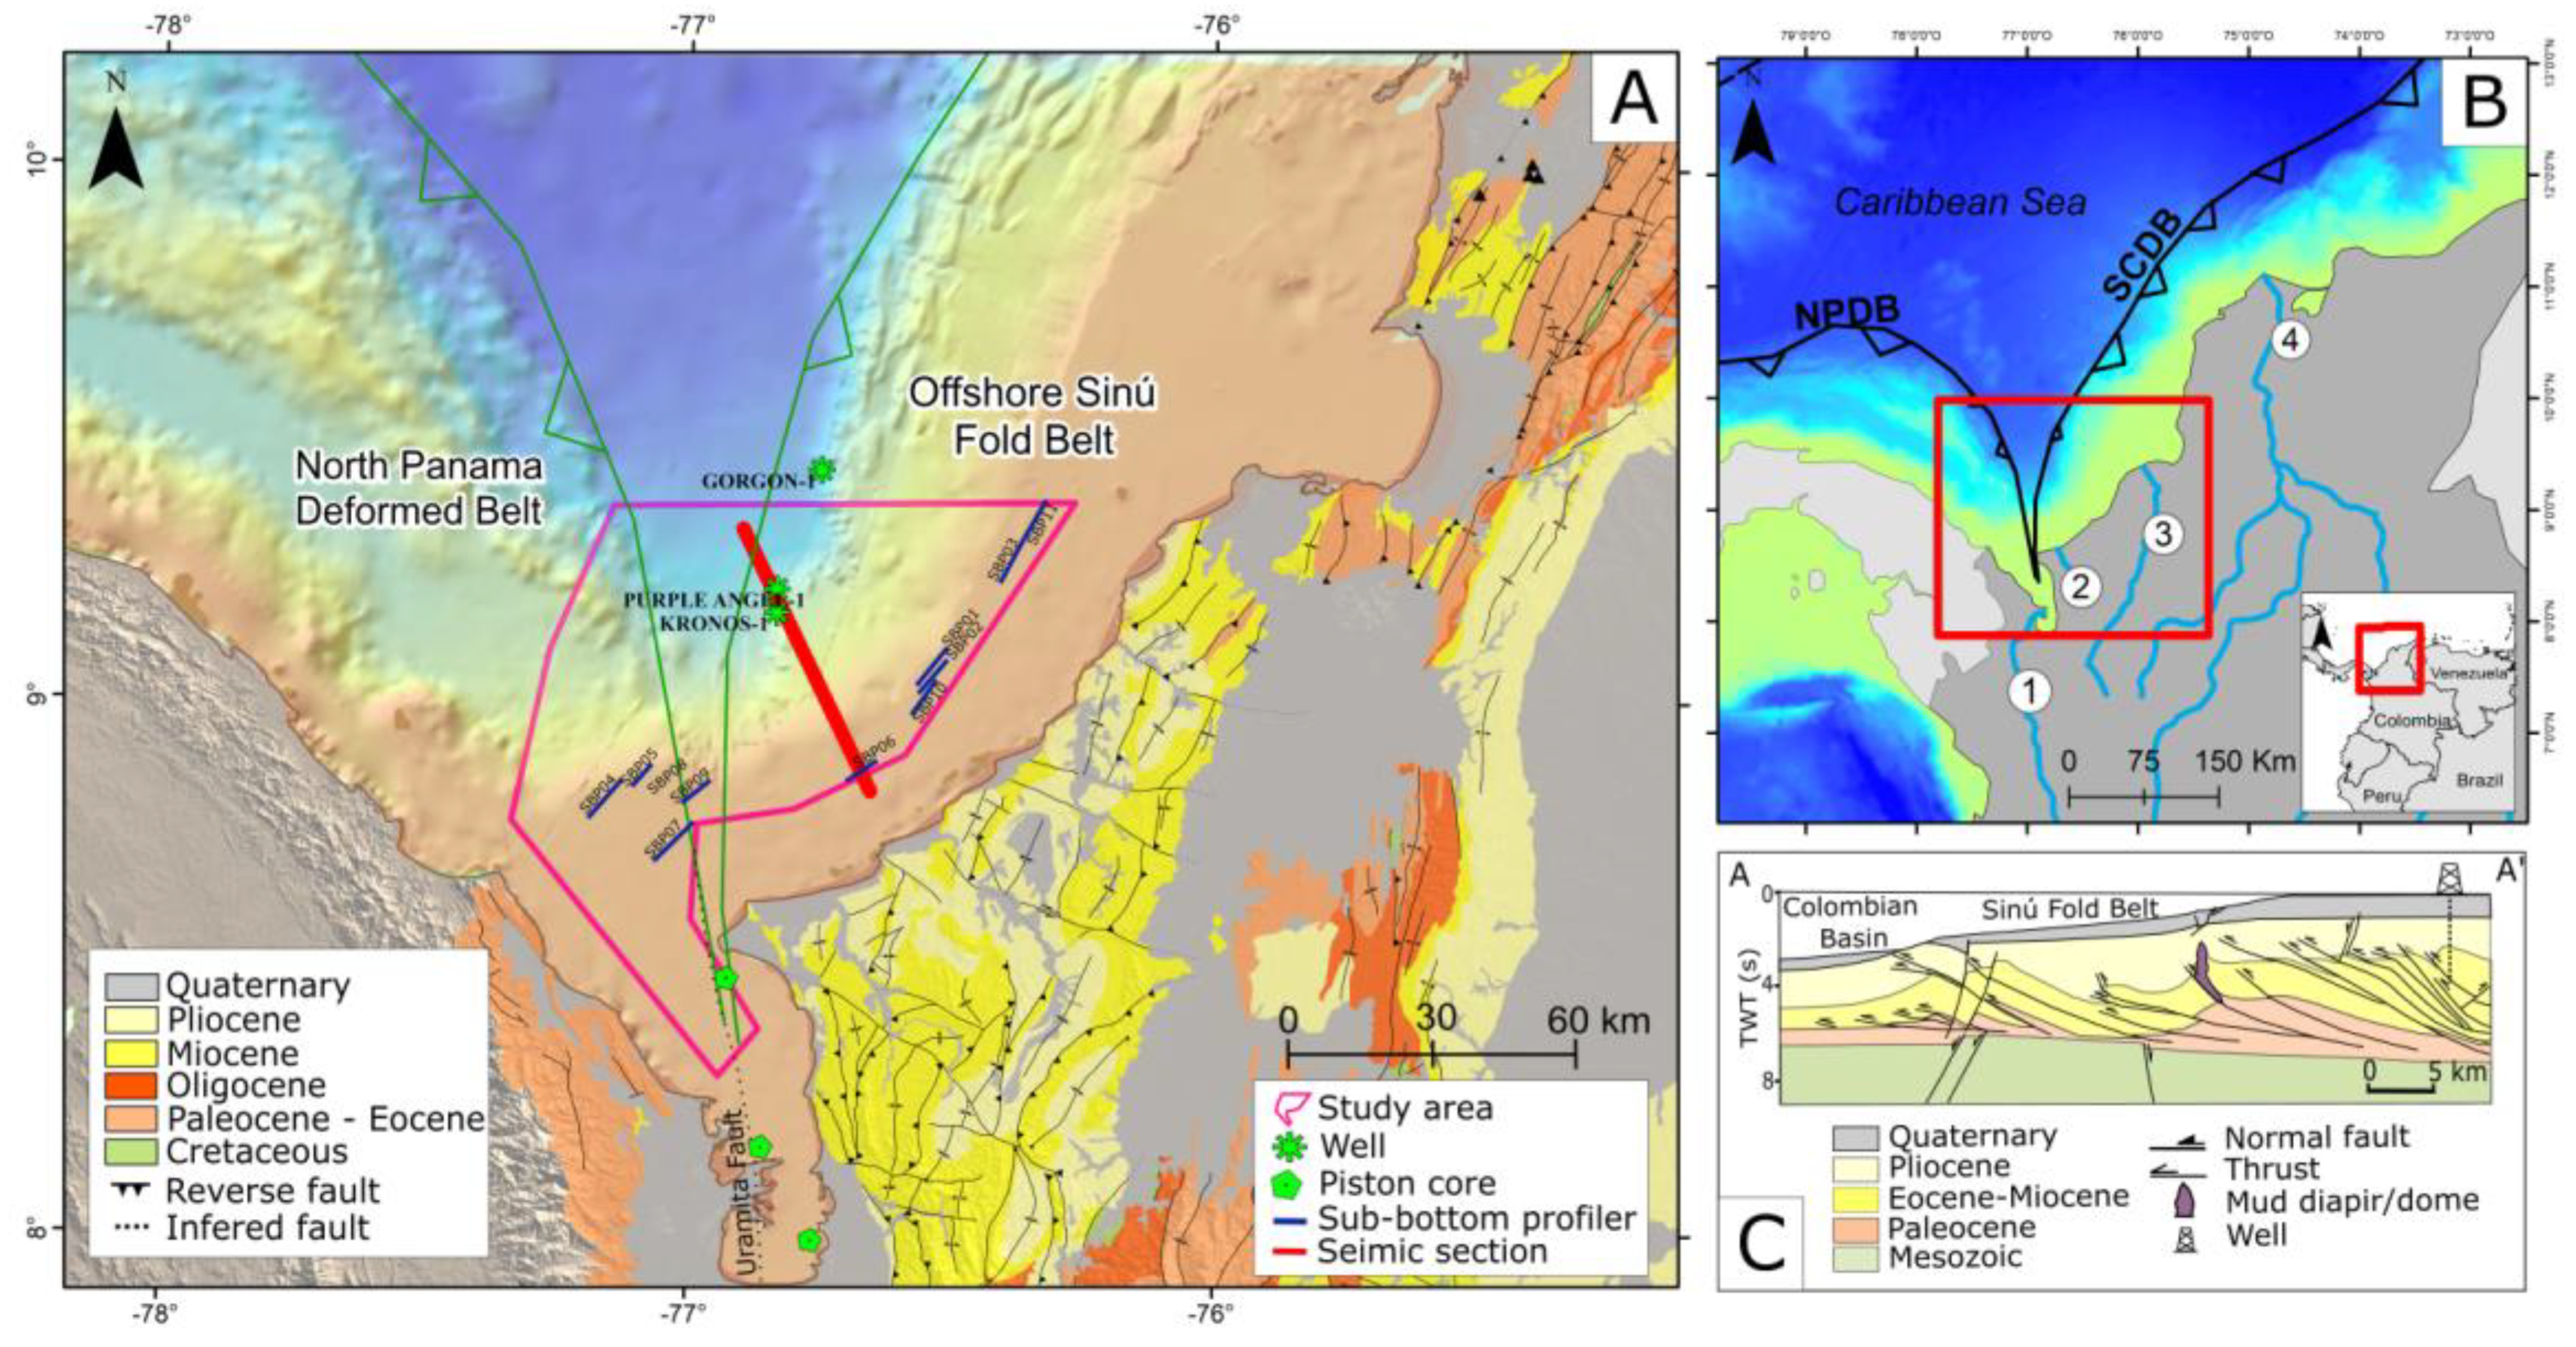
2. Geological Configuration

The study area covers an area of 6700 km2 and extends along the shelf and continental slope with a maximum depth of 2870 m (Figure 1). It is located on a wide platform, generally with muddy bottoms, with turbid, warm, and low-salinity environments [47,48]. Sediment supply is influenced by the deltaic systems of four rivers: Atrato, Mulatos, Sinú, and Magdalena (Figure 1B). The Atrato River presents a moderate annual sediment flow of 11.26 × 10⁶ ton yr−1 [49], most of which is deposited within the gulf. The Mulatos River discharges around 0.21 × 10⁶ ton yr−1, and the Sinú River discharges 6.1 × 10⁶ ton yr−1. Finally, the Magdalena River discharges 143.9 × 10⁶ ton yr−1 [49,50,51].
The study area in the OSFB is the frontal part of the southwestern portion of an accretionary wedge called the South Caribbean Deformed Belt (SCDB), formed from the subduction of the Caribbean Plate under the South American Plate [55]. The Sinú Fold Belt is separated from the North Panama Deformed Belt by the NNW–SSE-trending Uramita Fault (Figure 1A). The belt is configured over a Mesozoic basement [56,57] and involves a sedimentary cover with a thickness of approximately 8 km from the Cenozoic age [58]. The study area is mostly established in the continental shelf and only in the upper continental slope. According to Figure 1C [54], the vertical thickness of the wedge is greater at the deformation front, decreasing towards the shelf break. Beneath the deformation front, the depth of detachment is intermediate, and beneath the shelf break it is the lowest. The continental shelf that forms the inner part of the belt is characterized by large normal faults, thrust and related folds [52,59,60,61], mud diapirs, and mud volcanoes [52,62,63,64,65,66]. The source of shale diapirism, considered the main detachment, is located within the Paleogene shales [52,63,64,65,67]. The external part related to the continental slope is dominated by the NW-trending imbricate thrust, piggy-back basins, thrusts and related folds, tear faults subperpendicular to the thrusts, and shallow normal faults [52,56,59,68]. Figure 1C shows a structural-style interpretation across the OSFB in the continental shelf and continental slope, exhibiting a wedge-shaped geometry gently inclined to the NW, and gently dipping due to a basal detachment to the SE [69].

3. Methods

For this work, the seabed and sub-bottom anomalies in the OSFB were analyzed using high-resolution marine geophysical data. Multibeam bathymetry and SBP data were acquired and used to characterize bottom geomorphology, map the distribution of submarine landslides, examine shallow sub-bottom structures, and discuss the nature of gas occurrences in this region. The acquisition of the information used was carried out in 2018 aboard the ARC Roncador Research Vessel operated by the Caribbean Oceanographic and Hydrographic Research Center (CIOH).
The Kongsberg EM-302 Multibeam Echosounder (MBES) was used to obtain the bathymetric data. This MBES was designed to carry out soundings up to 7000 m deep, with openings up to 8 km and a frequency of 30 kHz. For the survey, an opening angle of 70° and a 30% overlap were applied, which ensured 100% seabed coverage. The software used for data acquisition was the Seafloor Information System (SIS), which allows for viewing the topography of the seabed and the depth profile in real time. In addition, SIS constantly monitors the input data to ensure their quality. For positioning, the SEAPATH 330 differential positioning system was deployed, which guarantees centimeter accuracy in the bathymetric survey and uses an MRU-5 motion sensor. The equipment implemented to measure the speed of sound in the water column was a VALEPORT SVS. The CARIS HIPS and SIPS v3.35 software were used to post-process data, with the objective of controlling the quality of the information, eliminating erroneous depth soundings and applying corrections. Finally, a digital elevation model of the area was created covering a surface area of 6700 km2 with a spatial resolution of 30 m.
High-resolution seismic data were acquired simultaneously via bathymetry, using a SBP300 (Kongsberg, Norway) sub-bottom profiler emitting FM (frequency-modulated) signals. This tool operates with a frequency range of 5 kHz, reaching a maximum vertical resolution of 15 to 25 cm. Eleven high-resolution seismic–acoustic profiles were obtained with an approximate total length of 100 km (Figure 1A). The profiles were processed and analyzed using the Sonar Wiz V5 software. Proper bottom alignment was performed, and chirp removal and gain correction calculations were applied to improve signal intensity and optimize acoustic facies’ interpretations. Data generated via the SBP 300 was recorded in the SEG-Y format, which allows for post-processing using some standard seismic processing packages. The processed SBP data were used to identify the shallow deposits. The interpretations were carried out taking into account the tectonic environment, making it possible to visualize bottom and sub-bottom variations associated with the structural style of the area. The sediment cores reported in this work to discuss vent-related d13C values were acquired with a gravity piston corer on board the R/V ARC-Quindío in December 2009 [70].

4. Results

4.1. Seafloor Morphology

The region covers the transition zone between the shelf and the upper continental slope. Unlike the other zones of the Sinú Fold Belt, only the upper continental slope occurs in this region. The bathymetry of the area is the most regular of the belt, suggesting almost no recent tectonic activity. The water depth varies from 18 to 2870 m and the shelf break occurs at a depth of 125 m. The continental shelf exhibits a relatively flat relief with depths between 18 and 120 m. Taking the coastline as a reference, the platform has an amplitude of 37 km towards the northwest. Its geometry shows a thickening towards the Gulf of Urabá that reaches approximately 100 km. Locally, it is interrupted by reef structures, dome structures, and some depressions in the terrain morphology. The former is interpreted in this study as related to occasional emanations of fluids or pockmarks (Figure 2A).
Starting at approximately 125 m, the continental slope is found up to a maximum depth of 2750 m. The morphology of the slope in the area shows profiles of inclined and irregular topography (Figure 2C). Numerous systems of wide channels and turbidity channels (canyons) are formed on the upper continental slope, with steep slopes indicating incision. These systems are slightly sinuous and reach lengths between 5 and 20 km, and do not show a direct connection with an important river on the continent. Cross-sectional topographic profiles along the channels are mainly U-shaped, with walls that reach 7° (Figure 2C). Some sections of the slope show numerous topside canyons with no evidence of significant mass loss, while other sections are characterized by large-scale mass loss with no canyons or gullies.
The continental slope is highly deformed by mass wasting and shows features indicating faulting and a complex interplay of sediment transport processes, directed downslope along the continental slope and deep into the basin. Figure 2B shows numerous seafloor features generated primarily by these turbidity currents and landslides. It comprises a variety of phenomena that include landslides, rockfalls, and debris flows. We also identified a series of mass-transport complexes (MTCs), mass failures, and slide scars (Figure 2B). MTCs are particularly attached to the continental slope associated with the continental shelf break, with areas of up to 100 km2 where the deformation associated with mud diapirism overlaps; see Figure 2B. A total of five probable mass failures were identified based on the occurrence of headwall scarps (red dotted lines in Figure 2B), which, together with MTCs, evacuated sediments from the continental shelf and slope. At the base of the slope and on the deep basin seafloor below each of the escarpments, there are large areas of debris fans of positive relief. This morphology reveals the emplacement of rough rubble lobes with blocky, mounded, and irregular seabed morphologies.
Based on the bathymetric model, in the Sinú Fold Belt area, two different shallow gas-related features were identified: (1) dome structures and (2) active and inactive pockmarks.

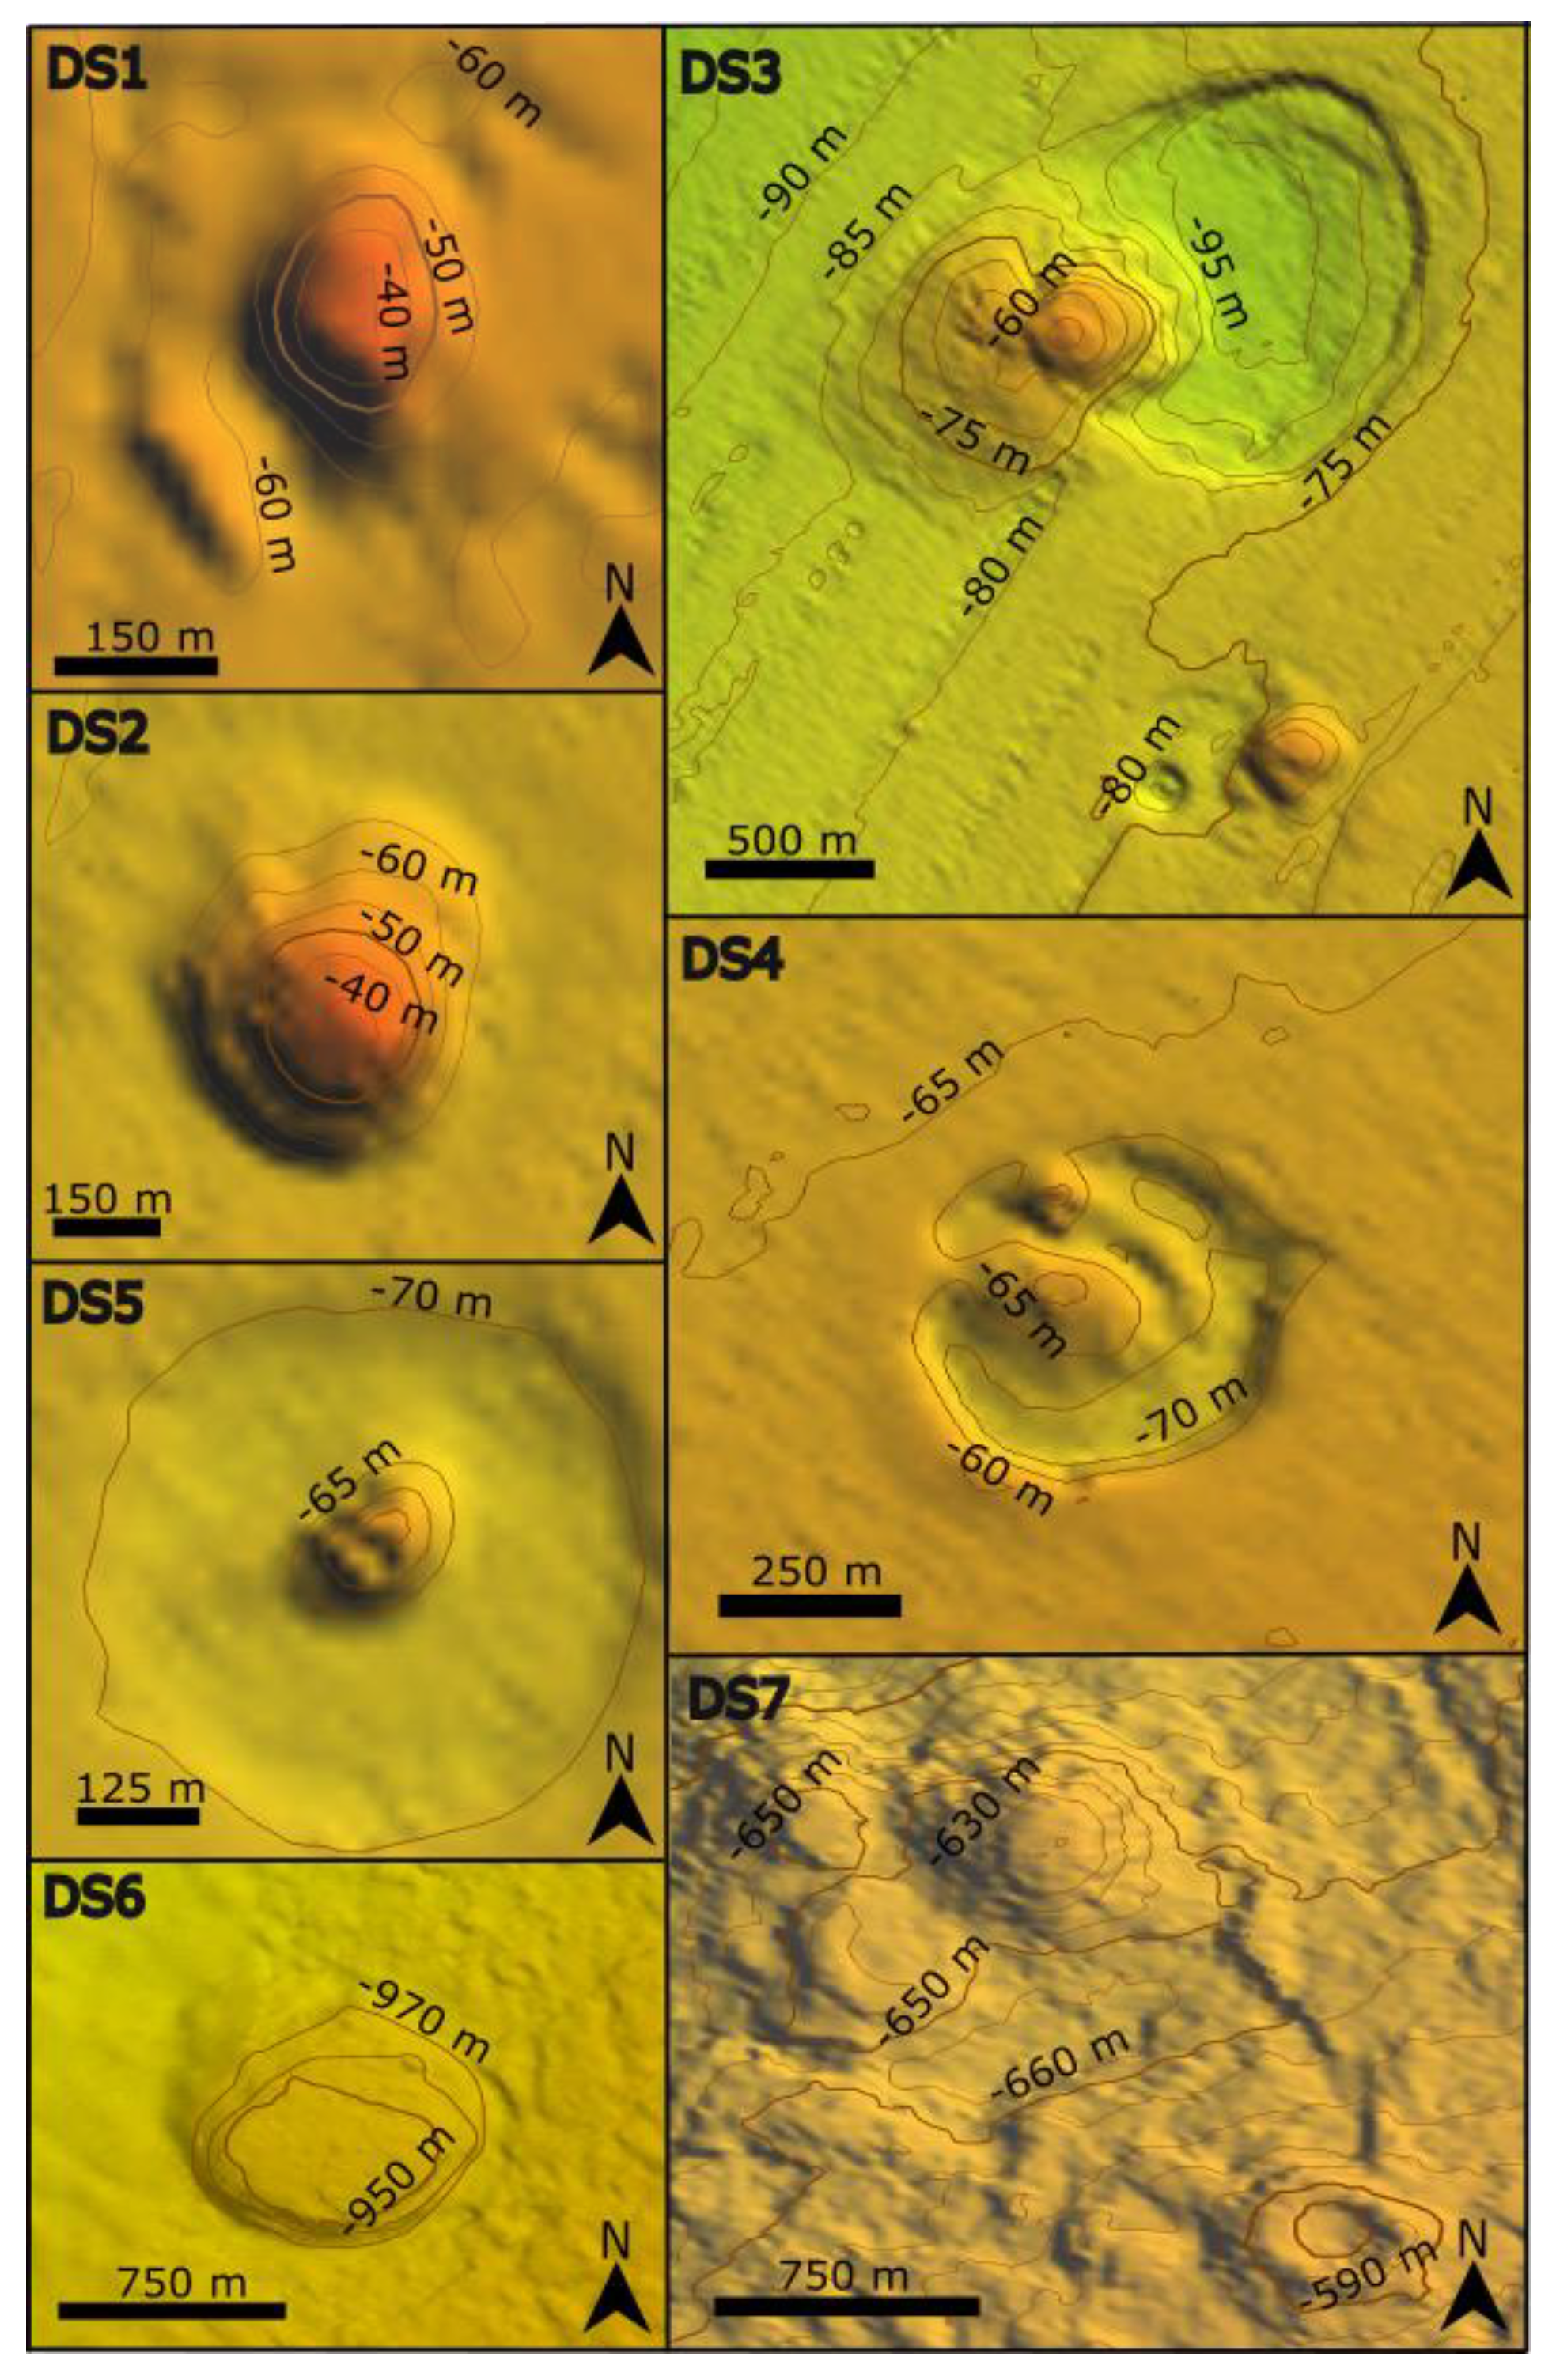
4.2. Dome Structures

Based on bathymetric data, twenty-three submarine dome structures (DS) were identified in the study area. The domes were found at depths between 25 and 1300 m, and some of these volcanoes can be seen in detail (Figure 3). The structures are distributed on the continental shelf and slope and appear as a dome-conical building that rises above the seabed. The heights oscillate between 15 and 45 m and the diameters at the base oscillate between 250 m and 2 km. Some of the structures are calderas due to the extension of their crater (e.g., DS3, DS4, and DS5). Most of them are isolated and some are grouped (e.g., DS3 and DS7). Some show some type of plume or gas leak above the water column, revealing areas of central vents that probably constitute the source of fluid for the formation of the dome structures, e.g., at SBP1 (Figure 4) and SBP5 (Figure 5).

4.3. Pockmarks

The pockmarks are mostly located on the continental shelf. Due to their expression, it is very difficult to differentiate them in the slope area. They appear as local crater-shaped depressions of the seabed with depths between 3 and 15 m and with diameters that reach 50 to 170 m (Figure 2A). These pockmarks indicate abrupt and sudden discharges of gas/fluids from deeper zones towards the sea floor and the water column. An acoustic blanking signal below the pockmark is usually associated with active gas seeps, as SBP7 (Figure 6) and SBP9 (Figure 7) show. The feeder channel is displayed as an acoustic turbid zone in SBPs. This phenomenon of seismic suppression could be due to the existence of gas.

4.4. Sub-Seafloor Morphology

Seismic anomalies related to gas occurrences in superficial marine sediments of the OSFB have been clearly identified in the SBPs (Figure 4, Figure 5, Figure 6, Figure 7 and Figure 8). Acoustically transparent zones on the sub-bottom profile sections were detected between 25 and 65 m below the seabed and extend across the entire shelf to the upper continental slope. The occurrences have been classified according to their specific seismic signatures, dimensions, and geometry.
Acoustic blanking (AB) zones appear as a reflection of great amplitude with extensions between 350 and 700 m. Their upper surface has a flat geometry that completely masks the entire underlying sequence due to the total absorption of seismic energy (Figure 4, Figure 5, Figure 6, Figure 7 and Figure 8). This is the reason why AB shows up as an acoustically transparent zone in many sections. This phenomenon is one of the most common seismic anomalies produced by the occurrence of shallow gas in the area. AB also shows a diffuse disturbance due to the dispersion of various amplitudes, displaying less influence on the sedimentary record. Its effect is related to disturbed or slightly discontinuous reflectors whose superficial degassing has led to the blurring of the layer. In some cases, the continuity of the reflectors can be observed, although the generating source is not differentiated. According to Fannin [32], this effect is already generated with only 1% of gas present in sediments. These areas are characterized by chaotic sequences with variable extensions, whose superficial outgassing leads to the aforementioned blurring of the layer (Figure 4, Figure 5, Figure 6, Figure 7 and Figure 8).
Acoustic blanking is also identified as a vertical disturbance of the sediment layers due to the acoustic dispersion effect of the upward migration of gases or fluids in pores with small amplitude They can be observed in SBP7 (Figure 6) and SBP9 (Figure 7), which reveal amplitudes of approximately 3 m and heights of 20 m (these “heights” are clearly identified as the elevation of the acoustic plume in the water column). They can be found isolated, as in SBP4 (Figure 5), aligned, as in SBP8 and SBP9 (Figure 7), or in groups, as in SBP7 (Figure 6). They are also seen immediately below the pockmarks, indicating a feeder channel, as in SBP7 (Figure 6) and SBP9 (Figure 7). The origin of these acoustics is located between −50 and −60 m below the seabed.
Enhancement reflectors (ER) show the discontinuous horizons of high acoustic reflection with lengths reaching 1 to 2 km. They are found on both the shelf and the continental slope up to depths of 1500 m. The enhanced reflectors are shown in SBP1 (Figure 4) and SBP6 (Figure 5). Some sub-bottom records reveal expulsions or plumes in the water column, e.g., at SBP1 (Figure 4) and SBP5 (Figure 5). They are located on dome structures, in areas of pockmarks and acoustic blanking, with heights that reach 15 m. Sometimes they are individual forms, and in others, they appear in high density, forming fields of plumes (Figure 7). Some type of acoustic blanking was observed under these forms of gas escape at SBP7 (Figure 6) and SBP9 (Figure 7).
The pockmarks and dome structures can also be recognized better on the SBPs. The pockmarks appear as depressions in the seabed and can be recognized on the SBP records as highly reflective areas. Pockmarks are shown in SBP4, SBP6 (Figure 5), SBP7 (Figure 6), and SBP8 (Figure 7).
Mud volcanoes in the SBP are characterized by acoustic blanking, interpreted as sediments disturbed by fluid migration, by either recent or past activity. They are shown in SBP1, SBP2 (Figure 4), SBP3, SBP5 (Figure 5), SBP10, and SBP11 (Figure 8).

5. Discussion

The high-resolution seismic analysis together with bathymetry data allowed us to identify and map different acoustic anomalies due to the occurrences of shallow gas in the Offshore Sinú Fold Belt (OSFB). Shallow gassy sediments can particularly be recognized by acoustic anomalies such as attenuation and scattering of the seismic signal [18,71,72]. In high-resolution seismic profiles, gas presence in the sediments produces the absorption of most of the high-frequency acoustic energy, masking the deeper horizons. Transparent zones (or anomalous zones without reflections) are found in the seismic profiles producing acoustic blanking, turbidity zones, acoustic voids, acoustic blanking, acoustic turbid layers, and bounded gas upthrust structures [13,25,73,74]. These occurrences are common in the OSFB sedimentary record (Figure 4, Figure 5, Figure 6, Figure 7 and Figure 8).
The predominant acoustic occurrence in the OSFB is the acoustic blanking in the sediments. An area of acoustic blanking in the platform and slope area was analyzed. The profiles also reveal high-frequency, high-amplitude areas such as enhanced reflectors. These higher intensity reflectors indicate variations in acoustic impedance due to high gas flow [75,76,77]. They are commonly found in the vicinity of pockmarks, as in SBP6 (Figure 5). This type of event reveals a local gas occurrence in the upper part of the superficial sediments (in the vicinity of the seabed) at depths of 25 to 65 m below the seafloor. The presence of acoustic blanking with a columnar shape is commonly observed in high-resolution profiles, showing a columnar disturbance in the OSFB surface sediments. These vertical anomalies, generally located less than 50 m below the seabed, imply that gas has propagated upward from the deep subsurface to surface sediments [13,76,78,79,80], indicating important migration pathways [81].
The most common surface expressions associated with gas seeps on the continental margins are pockmarks and dome structures [82,83,84]. The pockmarks’ origin is related to the expulsion of shallow gas pockets [15,36]. The mechanism of the formation of pockmarks is strongly controlled by local sedimentation processes, such as sediment type, thickness, permeability, pore pressure, and fluid content [20]. Their development requires the presence of fine granular sediments to support their structure and generate sediment removal, local subsidence, and escape failures [20]. The results allow us to establish that pockmarks are very common characteristics in the OSFB. Pockmarks were observed on the continental slope in water depths between 20 and 2000 m. These pockmarks generate sinkholes that reach a depth of 15 m and are commonly found in the vicinity of dome structures. These depressions are produced by gas migrations, which displace part of the sediment and generate conical depressions [85,86]. The presence of these structures in the area indicates that the seafloor morphology may be formed by silty sediment packages and fine-grained clays (as suggested by [47,83,84]), which is mainly related to the sediment supply of the Atrato, Sinú, and Magdalena rivers. Bottom profiles reveal inactive pockmarks as well as pockmarks associated with active gas seeps in the OSFB. Most pockmarks reveal the presence of zones of acoustic turbidity and enhanced reflectors below their base, suggesting a continuous supply of gases [87,88,89]. Some acoustic blanking also occurs under pockmarks, indicating active vertical gas leaks [20]. Although some pockmarks do not show clear evidence of recent activity, their formation suggests that they are remnants of past active degassing [36].
Dome structures have been reported in many places around the world [90,91,92,93,94,95,96,97,98,99,100]. They have been widely studied given their close relationship with the occurrence of hydrocarbons, and they also constitute the most important migration pathways of methane and CO2 from marine sediments to the atmosphere [17,91,95]. Around 23 dome structures have been identified in water depths between 20 and 2000 m in the OSFB. They are characterized by internal dispersion and acoustic blanking in seismic records. These behaviors are interpreted as sequences of shallow sediments that have been disturbed by the upward migration of fluids that arrived near the seabed.
Various acoustic plumes over dome structures or pockmarks were observed in the seismic records. Their presence is interpreted as gas bubbles escaping into the water column, indicating active degassing, given the abundance of gas in subsoil sediments at high pressure conditions [18,101]. If the free gas in the sediments cannot be held below the seabed, it will eventually escape and form gas plumes [102]. The abundance of observed gas plumes in the bottom profiles indicates that gas is abundant in the surface sediments.
The origin of gas in shallow marine sediments is associated with thermogenic and/or biogenic processes [15,22,38,73,103]. In both cases, the gases result from organic matter via thermogenic processes that depend on pressure and temperature, or as a result of bacterial activity. Since the discovery of the Chuchupa and Ballenas fields in the 1970s [43,44], the offshore Colombian Caribbean has been considered a gas province originating mainly from microbial activity [45]. The latest discoveries in areas located below 2000 m with the drilling of the Orca (2014), Kronos (2015), Purple Angel (2017) and Gorgon (2022) exploratory wells confirm the presence of an emerging basin dominated by methane [46]. This suggests occurrences not only of biogenic origin but also the thermogenic generation of hydrocarbons [46,104].
Rua et al. (2016) [70] analyzed sediment cores in the southern Offshore Sinú Fold Belt, collected via a gravity piston at a site that showed acoustic anomalies in high-resolution subsoil profiles (see Figure 1 for location). The carbon isotopic signature measurements on six samples revealed low δ13C values (as low as 30%). These results suggest that the origin of the superficial gas occurrences is a deep thermogenic source [73,103,105]. Gracia et al. (2012) [106] reported, during the INVEMAR-ANH I project carried out in 2008, the discovery of new chemosymbiotic species in the south of the Sinú Fold Belt. Several fragments and shells corresponding to families of chemosymbiotic bivalves were collected, including two morphotypes of the family Lucinidae (Graecina colombiensis) and three unidentified species of Lucinoma. The occurrence of these biological communities dominated by chemosymbiotic metazoans is highly endemic to reducing conditions, such as those observed in environments where there are seeps of methane or other hydrocarbons [107,108]. Other indicators of seepage activity, such as pieces of authigenic carbonates, were also sampled. This is a typical feature of sites where methane is expelled from the seabed. The data presented above [70,106], including our results, biologically and geologically support the presence of gas seeps on the seabed in the area of the Offshore Sinú Fold Belt.
Natural gas is considered one of the main sources of energy in the world [109,110].
In Colombia, it is the second-most used energy source. The expansion of this area could significantly contribute to supporting the country’s energy security and open the possibility of future gas exports, offering a fundamental energy source for the energy transition that the Colombian government has been developing.

6. Conclusions

One of the primary sources of energy across the globe is natural gas, which is the reason that numerous explorations with different methodologies are being carried out worldwide.
The presence of several acoustic anomalies in the Offshore Sinú Fold Belt (OSFB) was detected via the combined use of high-resolution seismic analysis and bathymetry data. This method made possible the identification and mapping of several shallow gassy sediments.
Gas-related features observed on the very high-resolution acoustic surveys include blanking, enhanced reflections, acoustic plumes, pockmarks, and dome structures.
Seismic records show a variety of sonic plumes over dome structures or pockmarks. Moreover, minor gas escape was observed throughout the water column as gas plumes.
It was also detected that, in some places, shallow gas continues under the sea floor at about –60 m depth, often marked by step-like offsets, indicating different levels of gas penetration, possibly due to interbedded deposits of fine sand and mud.
Finally, the results indicate that gas is abundant in the surface sediments (as evidenced by the frequency of gas plumes detected in the bottom profiles) and, thus, the use of more expensive exploration methods is not only justified but recommended.

Author Contributions

Conceptualization, A.M.O.-G., J.V.-P., E.G.O.-G., C.T., J.R.-C., H.L.-R. and J.J.M.-P.; Methodology, B.J.-A., E.Z., E.G.O.-G. and K.O.-P.; Software, A.M.O.-G., E.G.O.-G. and H.L.-R.; Validation, H.L.-R.; Formal analysis, B.J.-A., J.V.-P., E.Z., C.T., J.R.-C. and H.L.-R.; Investigation, A.M.O.-G., B.J.-A., J.V.-P., E.Z., E.G.O.-G., C.T., J.R.-C., K.O.-P. and J.J.M.-P.; Data curation, A.M.O.-G., H.L.-R. and K.O.-P.; Writing—original draft, A.M.O.-G.; Writing—review & editing, B.J.-A., J.V.-P., E.Z. and J.J.M.-P.; Visualization, E.Z., E.G.O.-G., C.T., J.R.-C. and K.O.-P.; Supervision, B.J.-A., J.V.-P. and J.J.M.-P. All authors have read and agreed to the published version of the manuscript.

Funding

This research was funded by the University of Cadiz to support the stay at the Università degli Studi di Napoli Parthenope for our PhD Student Ana María Osorio-Granada. Some expenses for the translation of this article were funded by University of Cadiz and RNM912 Coastal Engineering Research Group.

Institutional Review Board Statement

Not applicable.

Informed Consent Statement

Not applicable.

Data Availability Statement

Not applicable.

Acknowledgments

The authors thank the Oceanographic and Hydrographic Research Center of Colombia for providing geophysical datasets.

Conflicts of Interest

The authors declare no conflict of interest.

References

  1. Hamilton, E.L. Geoacoustic modeling of the sea floor. J. Acoust. Soc. Am. 1980, 68, 1313–1340. [Google Scholar] [CrossRef]
  2. Gons, H.J.; Rijkeboer, M.; Bagheri, S.; Ruddick, K.G. Optical teledetection of chlorophyll a in estuarine and coastal waters. Environ. Sci. Technol. 2000, 34, 5189–5192. [Google Scholar] [CrossRef]
  3. Sun, K.; Cui, W.; Chen, C. Review of underwater sensing technologies and applications. Sensors 2021, 21, 7849. [Google Scholar] [CrossRef] [PubMed]
  4. Pszonka, J.; Schulz, B.; Sala, D. Application of mineral liberation analysis (MLA) for investigations of grain size distribution in submarine density flow deposits. Mar. Pet. Geol. 2021, 129, 105109. [Google Scholar] [CrossRef]
  5. Idárraga-García, J.; García-Varón, J.; León, H. Submarine geomorphology, tectonic features and mass wasting processes in the archipelago of San Andres, Providencia and Santa Catalina (Western Caribbean). Mar. Geol. 2021, 435, 106458. [Google Scholar] [CrossRef]
  6. Berrocoso, M.; Gárate, J.; Martín-Dávila, J.; Fernández-Ros, A.; Moreu, G.; Jigena, B. Improving the local geoid with GPS. Rep. Finn. Geod. Inst. 1996, 96, 91–96. [Google Scholar]
  7. Jigena, B.; Berrocoso, M.; Torrecillas, C.; Vidal, J.; Barbero, I.; Fernandez-Ros, A. Determination of an experimental geoid at Deception Island, South Shetland Islands, Antarctica. Antarct. Sci. 2016, 28, 277. [Google Scholar] [CrossRef]
  8. Payo, A.; Jigena Antelo, B.; Hurst, M.; Palaseanu-Lovejoy, M.; Williams, C.; Jenkins, G.; Lee, K.; Favis-Mortlock, D.; Barkwith, A.; Ellis, M.A. Development of an automatic delineation of cliff top and toe on very irregular planform coastlines (CliffMetrics v1. 0). Geosci. Model Dev. 2018, 11, 4317–4337. [Google Scholar] [CrossRef]
  9. Jigena, B.; Mamani, R.; Muñoz-Perez, J.J.; Garvi, D.; Walliser, J.; Calderay, F.; Berrocoso, M. Methodology for hydrological information management in waterways: Application to Bolivia. Tecnol. Cienc. Agua 2018, 9, 237–256. [Google Scholar] [CrossRef]
  10. Rey, W.; Ruiz-Salcines, P.; Salles, P.; Urbano-Latorre, C.P.; Escobar-Olaya, G.; Osorio, A.F.; Ramírez, J.P.; Cabarcas-Mier, A.; Jigena-Antelo, B.; Appendini, C.M. Hurricane Flood Hazard Assessment for the Archipelago of San Andres, Providencia and Santa Catalina, Colombia. Front. Mar. Sci. 2021, 8, 766258. [Google Scholar] [CrossRef]
  11. Osorio-Granada, A.M.; Antelo, B.J.; Pérez, J.M.V.; Hernández-Pardo, O.; Herman, L.; Muñoz-Pérez, J.J. Potential fields modeling for the Cayos Basin (Western Caribbean Plate): Implications in basin crustal structure. Mar. Geol. 2022, 449, 106819. [Google Scholar] [CrossRef]
  12. Jigena-Antelo, B.; Estrada-Ludeña, C.; Howden, S.; Rey, W.; Paz-Acosta, J.; Lopez-García, P.; Salazar-Rodriguez, E.; Endrina, N.; Muñoz-Pérez, J.J. Evidence of sea level rise at the Peruvian coast (1942–2019). Sci. Total Environ. 2023, 859, 160082. [Google Scholar] [CrossRef] [PubMed]
  13. Judd, A.G.; Hovland, M. The evidence of shallow gas in marine sediments. Cont. Shelf Res. 1992, 12, 1081–1095. [Google Scholar] [CrossRef]
  14. Van Weering, T.C.E.; Klaver, G.T.; Prins, R.A. Gas in Marine Sediments—An introduction. Mar. Geol. 1997, 137, 1–3. [Google Scholar] [CrossRef]
  15. Fleischer, P.; Orsi, T.; Richardson, M.; Anderson, A. Distribution of free gas in marine sediments: A global overview. Geo-Mar. Lett. 2001, 21, 103–122. [Google Scholar]
  16. Song, L.; Fan, D.; Su, J.; Guo, X. Controls on shallow gas distribution, migration, and associated geohazards in the Yangtze subaqueous delta and the Hangzhou Bay. Front. Mar. Sci. 2023, 10, 1107530. [Google Scholar] [CrossRef]
  17. Dimitrov, L.I. Mud volcanoes—A significant source of atmospheric methane. Geo-Mar. Lett. 2003, 23, 155–161. [Google Scholar] [CrossRef]
  18. Dondurur, D.; Çifçi, G.; Drahor, M.G.; Coşkun, S. Acoustic evidence of shallow gas accumulations and active pockmarks in the Izmir Gulf, Aegean Sea. Mar. Pet. Geol. 2011, 28, 1505–1516. [Google Scholar] [CrossRef]
  19. Roy, S.; Senger, K.; Hovland, M.; Römer, M.; Braathen, A. Geological controls on shallow gas distribution and seafloor seepage in an Arctic fjord of Spitsbergen, Norway. Mar. Pet. Geol. 2019, 107, 237–254. [Google Scholar] [CrossRef]
  20. Toker, M.; Tur, H. Shallow seismic characteristics and distribution of gas in lacustrine sediments at Lake Erçek, Eastern Anatolia, Turkey, from high-resolution seismic data. Environ. Earth Sci. 2021, 80, 1–23. [Google Scholar] [CrossRef]
  21. Carlson, P.R.; Golan-Bac, M.; Karl, H.A.; Kvenvolden, K.A. Seismic and geochemical evidence for shallow gas in sediment on Navarin continental margin, Bering Sea. Am. Assoc. Pet. Geol. Bull. 1985, 69, 422–436. [Google Scholar]
  22. Lee, S.H.; Chough, S.K. Distribution and origin of shallow gas in deep-sea sediments of the Ulleung Basin, East Sea (Sea of Japan). Geo-Mar. Lett. 2002, 22, 204–209. [Google Scholar] [CrossRef]
  23. Andreassen, K.; Nilssen, E.G.; Ødegaard, C.M. Analysis of shallow gas and fluid migration within the Plio-Pleistocene sedimentary succession of the SW Barents Sea continental margin using 3D seismic data. Geo-Mar. Lett. 2007, 27, 155–171. [Google Scholar] [CrossRef]
  24. Fader, G.B.J. Gas-related sedimentary features from the eastern Canadian continental shelf. Cont. Shelf Res. 1991, 11, 1123–1153. [Google Scholar] [CrossRef]
  25. Yuan, F.; Bennell, J.D.; Davis, A.M. Acoustic and physical characteristics of gassy sediments in the western Irish Sea. Cont. Shelf Res. 1992, 12, 1121–1134. [Google Scholar] [CrossRef]
  26. Ercilla, G. Gas-charged sediments and large pockmark-like features on the Gulf of Cadiz slope (SW Spain). Mar. Pet. Geol. 1996, 13, 253–261. [Google Scholar]
  27. Fader, G.B.J. The effects of shallow gas on seismic reflection profiles. In Glaciated Continental Margins: An Atlas of Acoustic Images; Springer: Berlin/Heidelberg, Germany, 1997; pp. 29–30. [Google Scholar]
  28. Missiaen, T.; Murphy, S.; Loncke, L.; Henriet, J.-P. Very high-resolution seismic mapping of shallow gas in the Belgian coastal zone. Cont. Shelf Res. 2002, 22, 2291–2301. [Google Scholar] [CrossRef]
  29. Schroot, B.M.; Klaver, G.T.; Schüttenhelm, R.T.E. Surface and subsurface expressions of gas seepage to the seabed—Examples from the Southern North Sea. Mar. Pet. Geol. 2005, 22, 499–515. [Google Scholar] [CrossRef]
  30. Gay, A.; Lopez, M.; Berndt, C.; Seranne, M. Geological controls on focused fluid flow associated with seafloor seeps in the Lower Congo Basin. Mar. Geol. 2007, 244, 68–92. [Google Scholar] [CrossRef]
  31. Hovland, M.; Curzi, P. V Gas seepage and assumed mud diapirism in the Italian central Adriatic Sea. Mar. Pet. Geol. 1989, 6, 161–169. [Google Scholar] [CrossRef]
  32. Fannin, N.G.T. Use of Regional Geological Surveys in the North Sea and Adjacent Areas in the Recognition of Offshore Hazards; Institute of Geological Sciences, Continental Shelf Division: London, UK, 1979. [Google Scholar]
  33. Lee, M.W.; Dillon, W.P. Amplitude blanking related to the pore-filling of gas hydrate in sediments. Mar. Geophys. Res. 2001, 22, 101–109. [Google Scholar] [CrossRef]
  34. Aiello, G.; Caccavale, M. New Seismoacoustic Data on Shallow Gas in Holocene Marine Shelf Sediments, Offshore from the Cilento Promontory (Southern Tyrrhenian Sea, Italy). J. Mar. Sci. Eng. 2022, 10, 1992. [Google Scholar] [CrossRef]
  35. Baltzer, A.; Tessier, B.; Nouze, H.; Bates, R.; Moore, C.; Menier, D. Seistec seismic profiles: A tool to differentiate gas signatures. Mar. Geophys. Res. 2005, 26, 235–245. [Google Scholar] [CrossRef]
  36. Hovland, M.; Judd, A. Seabed Pockmarks and Seepages: Impact on Geology, Biology, and the Marine Environment; Springer: Berlin/Heidelberg, Germany, 1988; ISBN 0860109488. [Google Scholar]
  37. Sheriff, R.E.; Geldart, L.P. Exploration Seismology; Cambridge University Press: Cambridge, UK, 1995; ISBN 1139643118. [Google Scholar]
  38. Davis, A.M. Shallow gas: An overview. Cont. Shelf Res. 1992, 12, 1077–1079. [Google Scholar] [CrossRef]
  39. King, L.H.; Maclean, B. Pockmarks on the Scotian shelf. Geol. Soc. Am. Bull. 1970, 81, 3141–3148. [Google Scholar] [CrossRef]
  40. Civile, D.; Baradello, L.; Accaino, F.; Zecchin, M.; Lodolo, E.; Ferrante, G.M.; Markezic, N.; Volpi, V.; Burca, M. Fluid-Related Features in the Offshore Sector of the Sciacca Geothermal Field (SW Sicily): The Role of the Lithospheric Sciacca Fault System. Geosciences 2023, 13, 231. [Google Scholar] [CrossRef]
  41. Kelley, J.T.; Dickson, S.M.; Belknap, D.F.; Barnhardt, W.A.; Henderson, M. Giant sea-bed pockmarks: Evidence for gas escape from Belfast Bay, Maine. Geology 1994, 22, 59–62. [Google Scholar] [CrossRef]
  42. Bøe, R.; Rise, L.; Ottesen, D. Elongate depressions on the southern slope of the Norwegian Trench (Skagerrak): Morphology and evolution. Mar. Geol. 1998, 146, 191–203. [Google Scholar] [CrossRef]
  43. Hatfield, L.E.; Tator, B.A.; Neff, C.H. Petroleum developments in South America, Central America, and Caribbean area in 1974. Am. Assoc. Pet. Geol. Bull. 1975, 59, 1756–1813. [Google Scholar]
  44. Amato, F.L. Petroleum Developments in South America, Central America, Mexico, and Caribbean Area in 1976. Am. Assoc. Pet. Geol. Bull. 1977, 61, 1578–1635. [Google Scholar]
  45. Katz, B.; Williams, K. Biogenic gas potential offshore Guajira peninsula, Colombia. In Proceedings of the AAPG Annual Meeting, Houston, TX, USA, 1–13 March 2002. [Google Scholar]
  46. Gonzalez-Penagos, F.; Milkov, A.; Lopez, E.; Duarte, L. Microbial and Thermogenic Petroleum Systems in the Colombian offshore Caribbean—New Geochemical Insights in an Emerging Basin. In Proceedings of the 2019 AAPG Annual Convention and Exhibition, San Antonio, TX, USA, 19–22 May 2019. [Google Scholar]
  47. Castaño, C. Golfos y Bahías de Colombia; Banco de Occidente: Cali, Colombia, 2002. [Google Scholar]
  48. Naranjo-Vesga, J.; Ortiz-Karpf, A.; Wood, L.; Jobe, Z.; Paniagua-Arroyave, J.F.; Shumaker, L.; Mateus-Tarazona, D.; Galindo, P. Regional controls in the distribution and morphometry of deep-water gravitational deposits along a convergent tectonic margin. Southern Caribbean of Colombia. Mar. Pet. Geol. 2020, 121, 104639. [Google Scholar] [CrossRef]
  49. Restrepo, J.D.; Kjerfve, B. The Pacific and Caribbean rivers of Colombia: Water discharge, sediment transport and dissolved loads. In Environmental Geochemistry in Tropical and Subtropical Environments; Springer: Berlin/Heidelberg, Germany, 2004; pp. 169–187. [Google Scholar]
  50. GEBCO, General Bathymetric Chart of the Oceans/GEBCO Web Services/Gridded Bathymetry Data/Download global coverage grids/Data Geotiff GEBCO_2023 Grid (Sub-Ice Topo/Bathy). Available online: https://www.gebco.net/data_and_products/gridded_bathymetry_data/#global (accessed on 14 September 2023).
  51. Gómez, J.; Montes, N.; Marín, E. Mapa Geológico de Colombia 2023. Escala 1:1 500 000; Servicio Geológico Colombiano: Bogotá, Colombia, 2023. [Google Scholar]
  52. Rodríguez, I.; Bulnes, M.; Poblet, J.; Masini, M.; Flinch, J. Structural style and evolution of the offshore portion of the Sinu Fold Belt (South Caribbean Deformed Belt) and adjacent part of the Colombian Basin. Mar. Pet. Geol. 2021, 125, 104862. [Google Scholar] [CrossRef]
  53. Naranjo-Vesga, J.; Paniagua-Arroyave, J.F.; Ortiz-Karpf, A.; Jobe, Z.; Wood, L.; Galindo, P.; Shumaker, L.; Mateus-Tarazona, D. Controls on submarine canyon morphology along a convergent tectonic margin. The Southern Caribbean of Colombia. Mar. Pet. Geol. 2022, 137, 105493. [Google Scholar] [CrossRef]
  54. Rodríguez, I.; Poblet, J.; Bulnes, M.; Masini, M.; Flinch, J. Thrust sequence in the Sinú Fold Belt (South Caribbean Deformed Belt), offshore northwestern Colombia. In Andean Structural Styles; Elsevier: Amsterdam, The Netherlands, 2022; pp. 111–119. [Google Scholar]
  55. Ladd, J.W.; Truchan, M. Compressional features across the Caribbean margin of Colombia. In Seismic Expression of Structural Styles: A Picture and Work Atlas; American Association of Petroleum Geologists: Tulsa, OK, USA, 1983. [Google Scholar]
  56. Toto, E.A.; Kellogg, J.N. Structure of the Sinu-San Jacinto fold belt—An active accretionary prism in northern Colombia. J. S. Am. Earth Sci. 1992, 5, 211–222. [Google Scholar] [CrossRef]
  57. Alfaro, E.; Holz, M. Review of the chronostratigraphic charts in the Sinú-San Jacinto Basin based on new seismic stratigraphic interpretations. J. S. Am. Earth Sci. 2014, 56, 139–169. [Google Scholar] [CrossRef]
  58. Duque-Caro, H. Estilo estructural, diapirismo y episodios de acrecimiento del terreno Sinú-San Jacinto en el noroccidente de Colombia. Bol. Geológico Ingeominas 1984, 27, 1–29. [Google Scholar] [CrossRef]
  59. Flinch, J.F. Structural evolution of the Sinu-Lower Magdalena area (northern Colombia). In The Circum-Gulf of Mexico and the Caribbean: Hydrocarbon Habitats, Basin Formation, and Plate Tectonics: AAPG Memoir 79; American Association of Petroleum Geologists: Tulsa, OK, USA, 2003. [Google Scholar]
  60. Mantilla, A.M. Crustal Structure of the Southwestern Colombian Caribbean Margin: Geological Interpretation of Geophysical Data. Ph.D. Thesis, Friedrich-Schiller-Universität, Jena, Germany, 2007. [Google Scholar]
  61. Mantilla, A.M.; Jentzsch, G.; Kley, J.; Alfonso-Pava, C.; Lallemand, S.; Funiciello, F. Configuration of the Colombian Caribbean Margin: Constraints from 2D seismic reflection data and potential fields interpretation. In Subduction Zone Geodynamics; Springer: Berlin/Heidelberg, Germany, 2009; pp. 247–272. [Google Scholar]
  62. Shepard, F.P.; Dill, R.F.; Heezen, B.C. Diapiric intrusions in foreset slope sediments off Magdalena delta, Colombia. Am. Assoc. Pet. Geol. Bull. 1968, 52, 2197–2207. [Google Scholar]
  63. Duque-Caro, H. Major Structural Elements and Evolution of Northwestern Colombia: Small Basin Margins. In M 29: Geological and Geophysical Investigations of Continental Margins; AAPG: Tulsa, OK, USA, 1979. [Google Scholar]
  64. Vernette, G.; Mauffret, A.; Bobier, C.; Briceno, L.; Gayet, J. Mud diapirism, fan sedimentation and strike-slip faulting, Caribbean Colombian Margin. Tectonophysics 1992, 202, 335–349. [Google Scholar] [CrossRef]
  65. Ruiz, C.; Davis, N.; Bentham, P.; Price, A.; Carvajal, D. Structure and tectonic evolution of the south Caribbean Basin, southern offshore Colombia: A progressive accretionary system. In Proceedings of the 7th Simposio Bolivariano—Exploracion Petrolera en las Cuencas Subandinas, Caracas, Venezuela, 10–13 September 2000. [Google Scholar]
  66. Aristizábal, C.; Ferrari, A.; Silva, C. Control neotectónico del diapirismo de lodo en la región de Cartagena, Colombia. Ing. Investig. y Desarro. I2+ D 2009, 8, 42–50. [Google Scholar]
  67. Vernette, G. La Plate-Forme Continentale Caraïbe de Colombie: Du Débouché du Magdalena au Golfe de Morrosquillo: Importance du Diapirisme Argileux sur la Morphologie et la Sédimentation; Institut de Géologie du Bassin d’Aquitaine: Talence, France, 1986. [Google Scholar]
  68. Vinnels, J.S.; Butler, R.W.H.; McCaffrey, W.D.; Paton, D.A. Depositional processes across the Sinú accretionary prism, offshore Colombia. Mar. Pet. Geol. 2010, 27, 794–809. [Google Scholar] [CrossRef]
  69. Zamora, G.; Mora, A. Andean Structural Styles: A Seismic Atlas; Elsevier: Amsterdam, The Netherlands, 2022; ISBN 0323859585. [Google Scholar]
  70. Rúa, A.; Liebezeit, G.; Molina, R.; Palacio, J. Unmixing progradational sediments in a southwestern Caribbean gulf through late Holocene: Backwash of low-level atmospheric jets. J. Coast. Res. 2016, 32, 397–407. [Google Scholar]
  71. Abegg, F.; Anderson, A.L. The acoustic turbid layer in muddy sediments of Eckernfoerde Bay, Western Baltic: Methane concentration, saturation and bubble characteristics. Mar. Geol. 1997, 137, 137–147. [Google Scholar] [CrossRef]
  72. Anderson, A.L.; Hampton, L.D. Acoustics of gas-bearing sediments I. Background. J. Acoust. Soc. Am. 1980, 67, 1865–1889. [Google Scholar] [CrossRef]
  73. Floodgate, G.D.; Judd, A.G. The origins of shallow gas. Cont. Shelf Res. 1992, 12, 1145–1156. [Google Scholar] [CrossRef]
  74. Ercilla, G.; Alonso, B.; Estrada, F.; Chiocci, F.L.; Baraza, J.; li Farran, M. The Magdalena Turbidite System (Caribbean Sea): Present-day morphology and architecture model. Mar. Geol. 2002, 185, 303–318. [Google Scholar] [CrossRef]
  75. Wood, W.T.; Ruppel, C. Seismic and thermal insvestigations of the Blake Ridge Gas Hydrate Area: A synthesis. Proc. Ocean Drill. program. Sci. results. Ocean Drill. Progr. 2000, 164, 253–264. [Google Scholar]
  76. Cukur, D.; Krastel, S.; Yama, T.; Namık, Ç. Seismic evidence of shallow gas from Lake Van, eastern Turkey. Mar. Pet. Geol. 2013, 48, 341–353. [Google Scholar] [CrossRef]
  77. Horozal, S.; Chae, S.; Kim, D.H.; Seo, J.M.; Lee, S.M.; Han, H.S.; Cukur, D.; Kong, G.-S. Seismic evidence of shallow gas in sediments on the southeastern continental shelf of Korea, East Sea (Japan Sea). Mar. Pet. Geol. 2021, 133, 105291. [Google Scholar] [CrossRef]
  78. Taylor, D.I. Nearshore shallow gas around the UK coast. Cont. Shelf Res. 1992, 12, 1135–1144. [Google Scholar] [CrossRef]
  79. Woodside, J.M.; Ivanov, M.K.; Limonov, A.F. Shallow gas and gas hydrates in the Anaximander Mountains region, eastern Mediterranean Sea. Geol. Soc. Lond. Spec. Publ. 1998, 137, 177–193. [Google Scholar] [CrossRef]
  80. Hustoft, S.; Bünz, S.; Mienert, J. Three-dimensional seismic analysis of the morphology and spatial distribution of chimneys beneath the Nyegga pockmark field, offshore mid-Norway. Basin Res. 2010, 22, 465–480. [Google Scholar] [CrossRef]
  81. Judd, A.; Hovland, M. Seabed Fluid Flow: The Impact on Geology, Biology and the Marine Environment; Cambridge University Press: Cambridge, UK, 2009; ISBN 1139461605. [Google Scholar]
  82. Neurauter, T.W.; Bryant, W.R. Seismic expression of sedimentary volcanism on the continental slope, northern Gulf of Mexico. Geo-Mar. Lett. 1990, 10, 225–231. [Google Scholar] [CrossRef]
  83. Graue, K. Mud volcanoes in deepwater Nigeria. Mar. Pet. Geol. 2000, 17, 959–974. [Google Scholar] [CrossRef]
  84. Somoza, L.; Gardner, J.M.; Díaz-del-Río, V.; Vázquez, J.T.; Pinheiro, L.M.; Hernández-Molina, F.J.; Parties, T.S.S. Numerous methane gas-related sea floor structures identified in Gulf of Cadiz. Eos Trans. Am. Geophys. Union 2002, 83, 541–549. [Google Scholar] [CrossRef]
  85. Gontharet, S.; Pierre, C.; Blanc-Valleron, M.-M.; Rouchy, J.-M.; Fouquet, Y.; Bayon, G.; Foucher, J.-P.; Woodside, J.; Mascle, J.; Party, T.N.S. Nature and origin of diagenetic carbonate crusts and concretions from mud volcanoes and pockmarks of the Nile deep-sea fan (eastern Mediterranean Sea). Deep Sea Res. Part II Top. Stud. Oceanogr. 2007, 54, 1292–1311. [Google Scholar] [CrossRef]
  86. Mazzini, A.; Svensen, H.H.; Planke, S.; Forsberg, C.F.; Tjelta, T.I. Pockmarks and methanogenic carbonates above the giant Troll gas field in the Norwegian North Sea. Mar. Geol. 2016, 373, 26–38. [Google Scholar] [CrossRef]
  87. CIOH Carta de Repartición de Facies Sedimentarias; Escala 1:300000; Centro de Investigaciones Oceanográficas e Hidrográficas: Cartagena, Colombia, 1999.
  88. Rangel-Buitrago, N.; Idárraga-García, J. Geología general, morfología submarina y facies sedimentarias en el margen continental y los fondos oceánicos del mar Caribe colombiano. In Biodiversidad de la Margen Continental del Caribe Colombiano; INVEMAR: Santa Marta, Columbia, 2010; pp. 29–51. [Google Scholar]
  89. Hovland, M.; Judd, A.G.; King, L.H. Characteristic features of pockmarks on the North Sea Floor and Scotian Shelf. Sedimentology 1984, 31, 471–480. [Google Scholar] [CrossRef]
  90. Camerlenghi, A.; Cita, M.B.; Della Vedova, B.; Fusi, N.; Mirabile, L.; Pellis, G. Geophysical evidence of mud diapirism on the Mediterranean Ridge accretionary complex. Mar. Geophys. Res. 1995, 17, 115–141. [Google Scholar] [CrossRef]
  91. Pérez-Belzuz, F.; Alonso, B.; Ercilla, G. History of mud diapirism and trigger mechanisms in the Western Alboran Sea. Tectonophysics 1997, 282, 399–422. [Google Scholar] [CrossRef]
  92. Gamberi, F.; Rovere, M. Mud diapirs, mud volcanoes and fluid flow in the rear of the Calabrian Arc Orogenic Wedge (southeastern Tyrrhenian sea). Basin Res. 2010, 22, 452–464. [Google Scholar] [CrossRef]
  93. Milkov, A.V. Worldwide distribution of submarine mud volcanoes and associated gas hydrates. Mar. Geol. 2000, 167, 29–42. [Google Scholar] [CrossRef]
  94. Sumner, R.H.; Westbrook, G.K. Mud diapirism in front of the Barbados accretionary wedge: The influence of fracture zones and North America–South America plate motions. Mar. Pet. Geol. 2001, 18, 591–613. [Google Scholar] [CrossRef]
  95. Kopf, A.J. Significance of mud volcanism. Rev. Geophys. 2002, 40, 2-1–2-52. [Google Scholar] [CrossRef]
  96. Krastel, S.; Spiess, V.; Ivanov, M.; Weinrebe, W.; Bohrmann, G.; Shashkin, P.; Heidersdorf, F. Acoustic investigations of mud volcanoes in the Sorokin Trough, Black Sea. Geo-Mar. Lett. 2003, 23, 230–238. [Google Scholar] [CrossRef]
  97. Sautkin, A.; Talukder, A.R.; Comas, M.C.; Soto, J.I.; Alekseev, A. Mud volcanoes in the Alboran Sea: Evidence from micropaleontological and geophysical data. Mar. Geol. 2003, 195, 237–261. [Google Scholar] [CrossRef]
  98. Somoza, L.; Dıaz-del-Rıo, V.; León, R.; Ivanov, M.; Fernández-Puga, M.C.; Gardner, J.M.; Hernández-Molina, F.J.; Pinheiro, L.M.; Rodero, J.; Lobato, A. Seabed morphology and hydrocarbon seepage in the Gulf of Cadiz mud volcano area: Acoustic imagery, multibeam and ultra-high resolution seismic data. Mar. Geol. 2003, 195, 153–176. [Google Scholar] [CrossRef]
  99. Morita, S.; Ashi, J.; Aoike, K.; Kuramoto, S. Evolution of Kumano basin and sources of clastic ejecta and pore fluid in Kumano mud volcanoes, Eastern Nankai Trough. In Proceedings of the International Symposium on Methane Hydrates and Fluid Flow in Upper Accretionary Prisms, Kyoto, Japan, 6 February–3 April 2004; Citeseer: University Park, PA, USA, 2004; pp. 92–99. Available online: https://acortar.link/OYJkj9 (accessed on 14 September 2023).
  100. León, R.; Somoza, L.; Medialdea, T.; González, F.J.; Díaz-del-Río, V.; Fernández-Puga, M.; Maestro, A.; Mata, M.P. Sea-floor features related to hydrocarbon seeps in deepwater carbonate-mud mounds of the Gulf of Cádiz: From mud flows to carbonate precipitates. Geo-Mar. Lett. 2007, 27, 237–247. [Google Scholar] [CrossRef]
  101. Paull, C.K.; Ussler, W., III; Borowski, W.S.; Spiess, F.N. Methane-rich plumes on the Carolina continental rise: Associations with gas hydrates. Geology 1995, 23, 89–92. [Google Scholar] [CrossRef]
  102. Hsu, S.-K.; Shiao-Shan, L.; Wang, S.-Y.; Ching-Hui, T.; Doo, W.-B.; Song-Chuen, C.; Jing-Yi, L.; Yeh, Y.-C.; Wang, H.-F.; Cheng-Wei, S. Seabed gas emissions and submarine landslides off SW Taiwan. TAO Terr. Atmos. Ocean. Sci. 2018, 29, 7. [Google Scholar] [CrossRef]
  103. Welte, D.H.; Tissot, P. Petroleum Formation and Occurrence; Springer: Berlin/Heidelberg, Germany, 1984; ISBN 0387132813. [Google Scholar]
  104. Ramirez, V.O. Stratigraphic Framework and Petroleum Systems Modeling, Guajira Basin Northern Colombia. Ph.D. Thesis, University of Alabama, Tuscaloosa, AL, USA, 2007. Available online: https://www.worldcat.org/es/title/stratigraphic-framework-and-petroleum-systems-modeling-guajira-basin-northern-colombia/oclc/191736499 (accessed on 14 September 2023).
  105. Mullins, H.T.; Nagel, D.K. Evidence for shallow hydrocarbons offshore northern Santa Cruz County, California. Am. Assoc. Pet. Geol. Bull. 1982, 66, 1130–1140. [Google Scholar]
  106. Gracia, A.; Rangel-Buitrago, N.; Sellanes, J. Methane seep molluscs from the Sinú–San Jacinto fold belt in the Caribbean Sea of Colombia. J. Mar. Biol. Assoc. 2012, 92, 1367–1377. [Google Scholar] [CrossRef]
  107. Von Cosel, R.; Olu, K. A new genus and new species of Vesicomyidae (Mollusca, Bivalvia) from cold seeps on the Barbados accretionary prism, with comments on other species. Zoosystema 2008, 30, 929–944. [Google Scholar]
  108. Von Cosel, R.; Olu, K. Large Vesicomyidae (Mollusca: Bivalvia) from cold seeps in the Gulf of Guinea off the coasts of Gabon, Congo and northern Angola. Deep Sea Res. Part II Top. Stud. Oceanogr. 2009, 56, 2350–2379. [Google Scholar] [CrossRef]
  109. Saxena, R.C.; Seal, D.; Kumar, S.; Goyal, H.B. Thermo-chemical routes for hydrogen rich gas from biomass: A review. Renew. Sustain. Energy Rev. 2008, 12, 1909–1927. [Google Scholar] [CrossRef]
  110. Vedachalam, N.; Srinivasalu, S.; Rajendran, G.; Ramadass, G.A.; Atmanand, M.A. Review of unconventional hydrocarbon resources in major energy consuming countries and efforts in realizing natural gas hydrates as a future source of energy. J. Nat. Gas Sci. Eng. 2015, 26, 163–175. [Google Scholar] [CrossRef]
Figure 1. (A). Location of the study area showing the digital elevation model (based on [52]), onshore geology, and the main tectonic elements (based on [53]). It covers an area of 6700 km2 that extends along the shelf and part of the continental slope, with a maximum depth of 2870 m. (B). Regional maps showing the location of the main rivers that contribute sediments: 1. Atrato River; 2. Mulatos River; 3. Sinú River; and 4. Magdalena River. The location of the NPDB and SCDB is based on [52]. The bathymetric data and drainage are based on [50,53] respectively. Abbreviations: NPDB: North Panama Deformed Belt; SCDB: South Caribbean Deformed Belt. (C). Seismic section across the Offshore Sinú Fold Belt, showing thrust, normal faults, and diapirs as the main structures in the continental shelf and continental slope. Adapted from [54,55,56].
Jmse 11 02121 g001
Figure 2. (A). Multibeam bathymetric relief of the study area with spatial distribution of the gas occurrence features; (B). 3D view of the multibeam bathymetry. Continental slope has been modified by mass wasting events; (C). Profiles across the continental slope; (D). Cross-sectional topographic profile along a channel dike complex.
Jmse 11 02121 g002
Figure 3. Morphology of submarine volcanoes identified in the area of the shelf and the continental slope. Most of them appear isolated and some appear in groups (See Figure 2 for locations).
Jmse 11 02121 g003
Figure 4. (A). Sub-bottom profiler 1 along the continental shelf; (B). Sub-bottom profiler 2. Sub-bottom records reveal dome structures, acoustic blanking, and enhanced reflections as gas occurrences.
Jmse 11 02121 g004
Figure 5. Sub-bottom profilers 3, 4, 5, and 6. The profiles reveal various anomalies associated with gas occurrences at depth such as acoustic blanking (AB), acoustic turbidity, enhanced reflectors (ER), pockmarks (P), and domes structures (DS).
Jmse 11 02121 g005
Figure 6. Sub-bottom profiler 7 presenting acoustic blanking (AB). Several plumes are observed over the pockmarks (P) and active pockmarks (AP) that reveal active escapes of gas from the soil towards the water.
Jmse 11 02121 g006
Figure 7. Sub-bottom profilers 8 and 9 showing numerous pockmarks (P) and acoustic blanking (AB) in the area of the shelf break.
Jmse 11 02121 g007
Figure 8. Sub-bottom profilers 10 and 11 showing dome structures (DS) and acoustic blanking (AB).
Jmse 11 02121 g008
Disclaimer/Publisher’s Note: The statements, opinions and data contained in all publications are solely those of the individual author(s) and contributor(s) and not of MDPI and/or the editor(s). MDPI and/or the editor(s) disclaim responsibility for any injury to people or property resulting from any ideas, methods, instructions or products referred to in the content.

