Transient Hydrodynamic Characteristics of a High-Speed Axial Flow Water-Jet Pump during Variable Speed Process

 ,
,
Abstract
:1. Introduction
2. Numerical Method
2.1. Turbulence Model and Cavitation Model
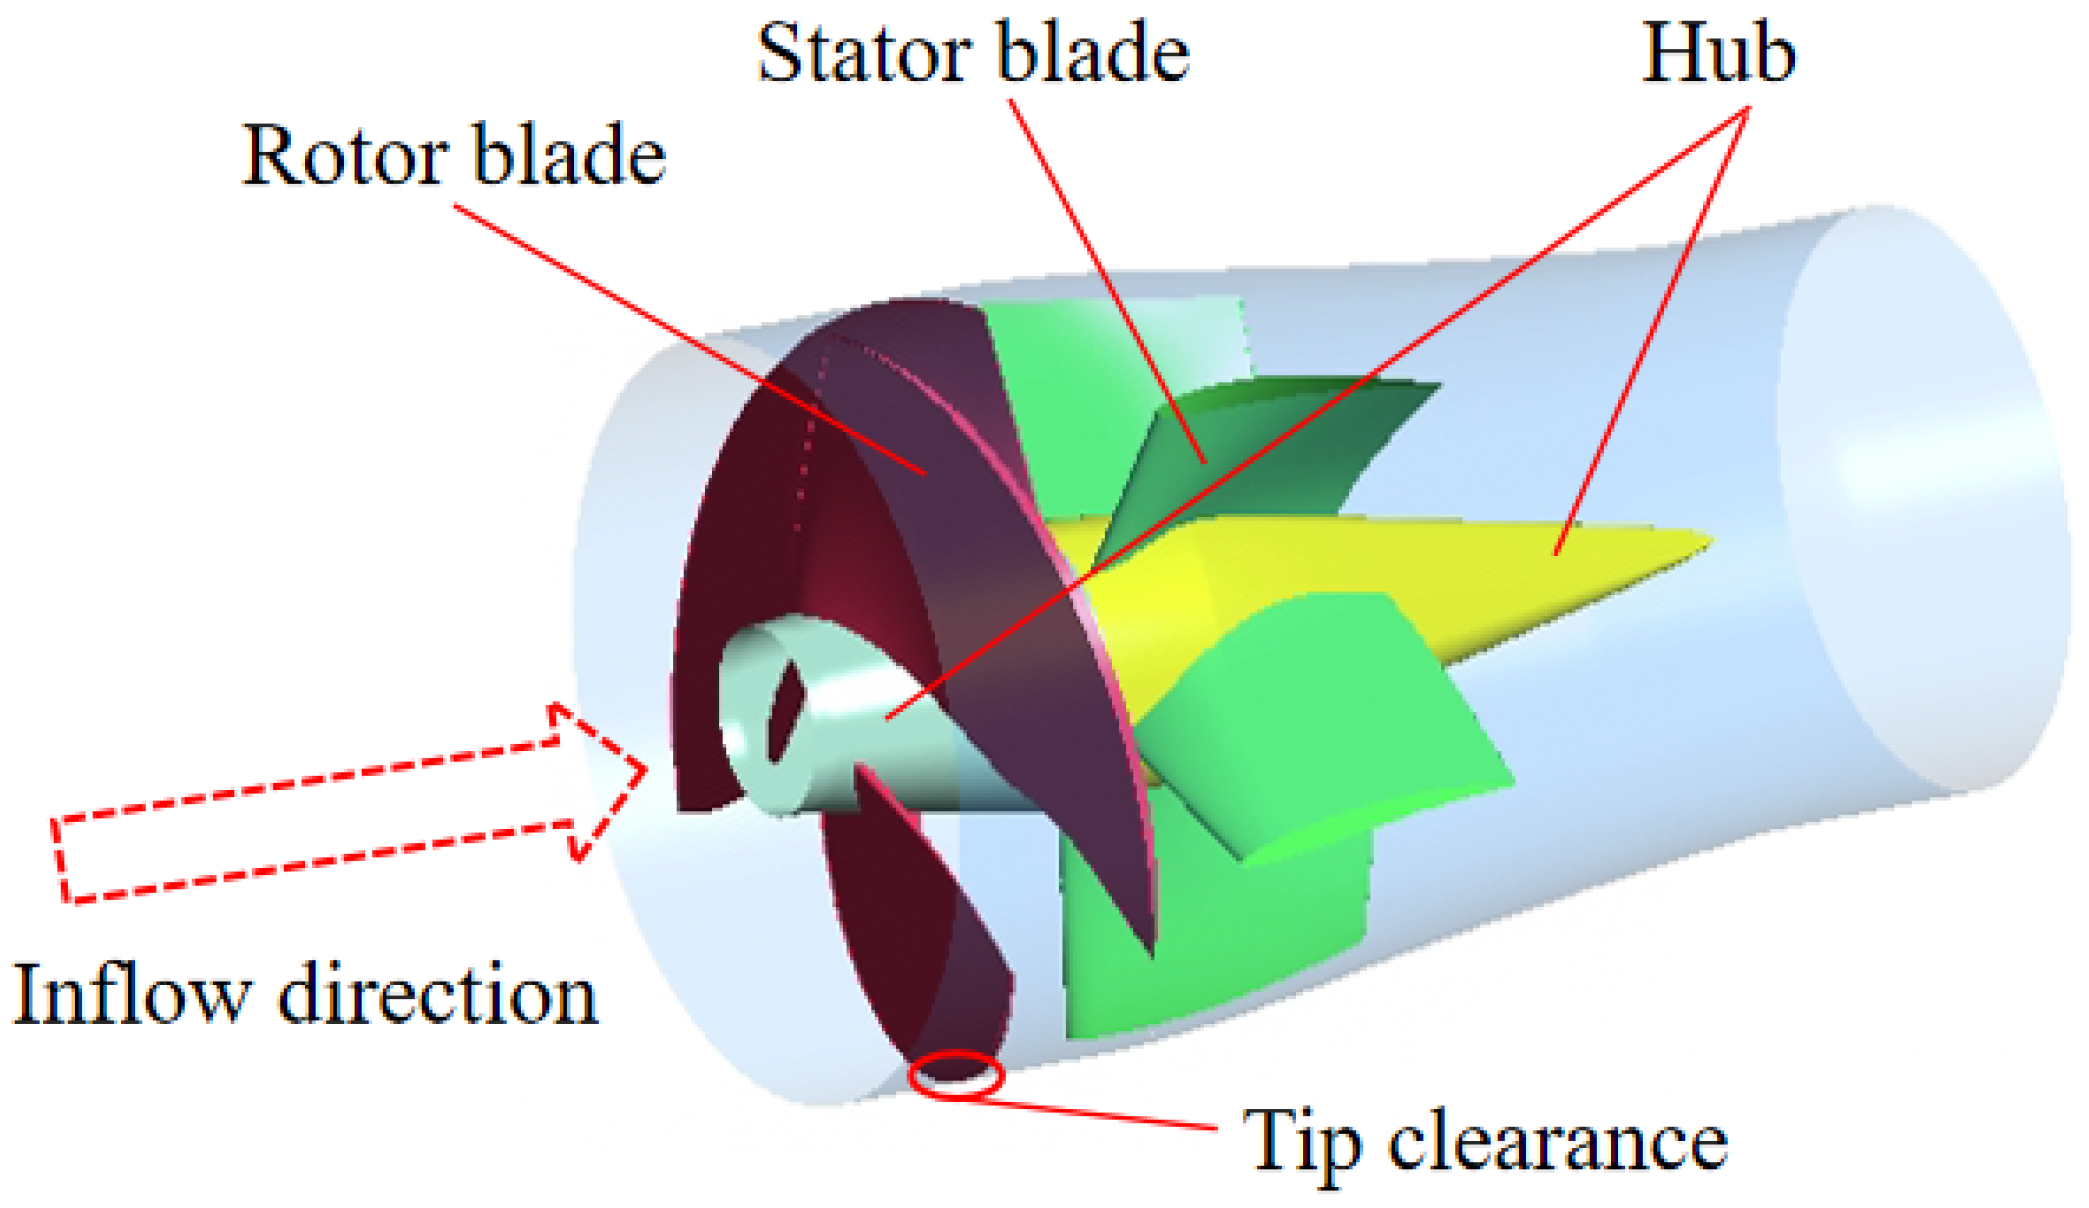
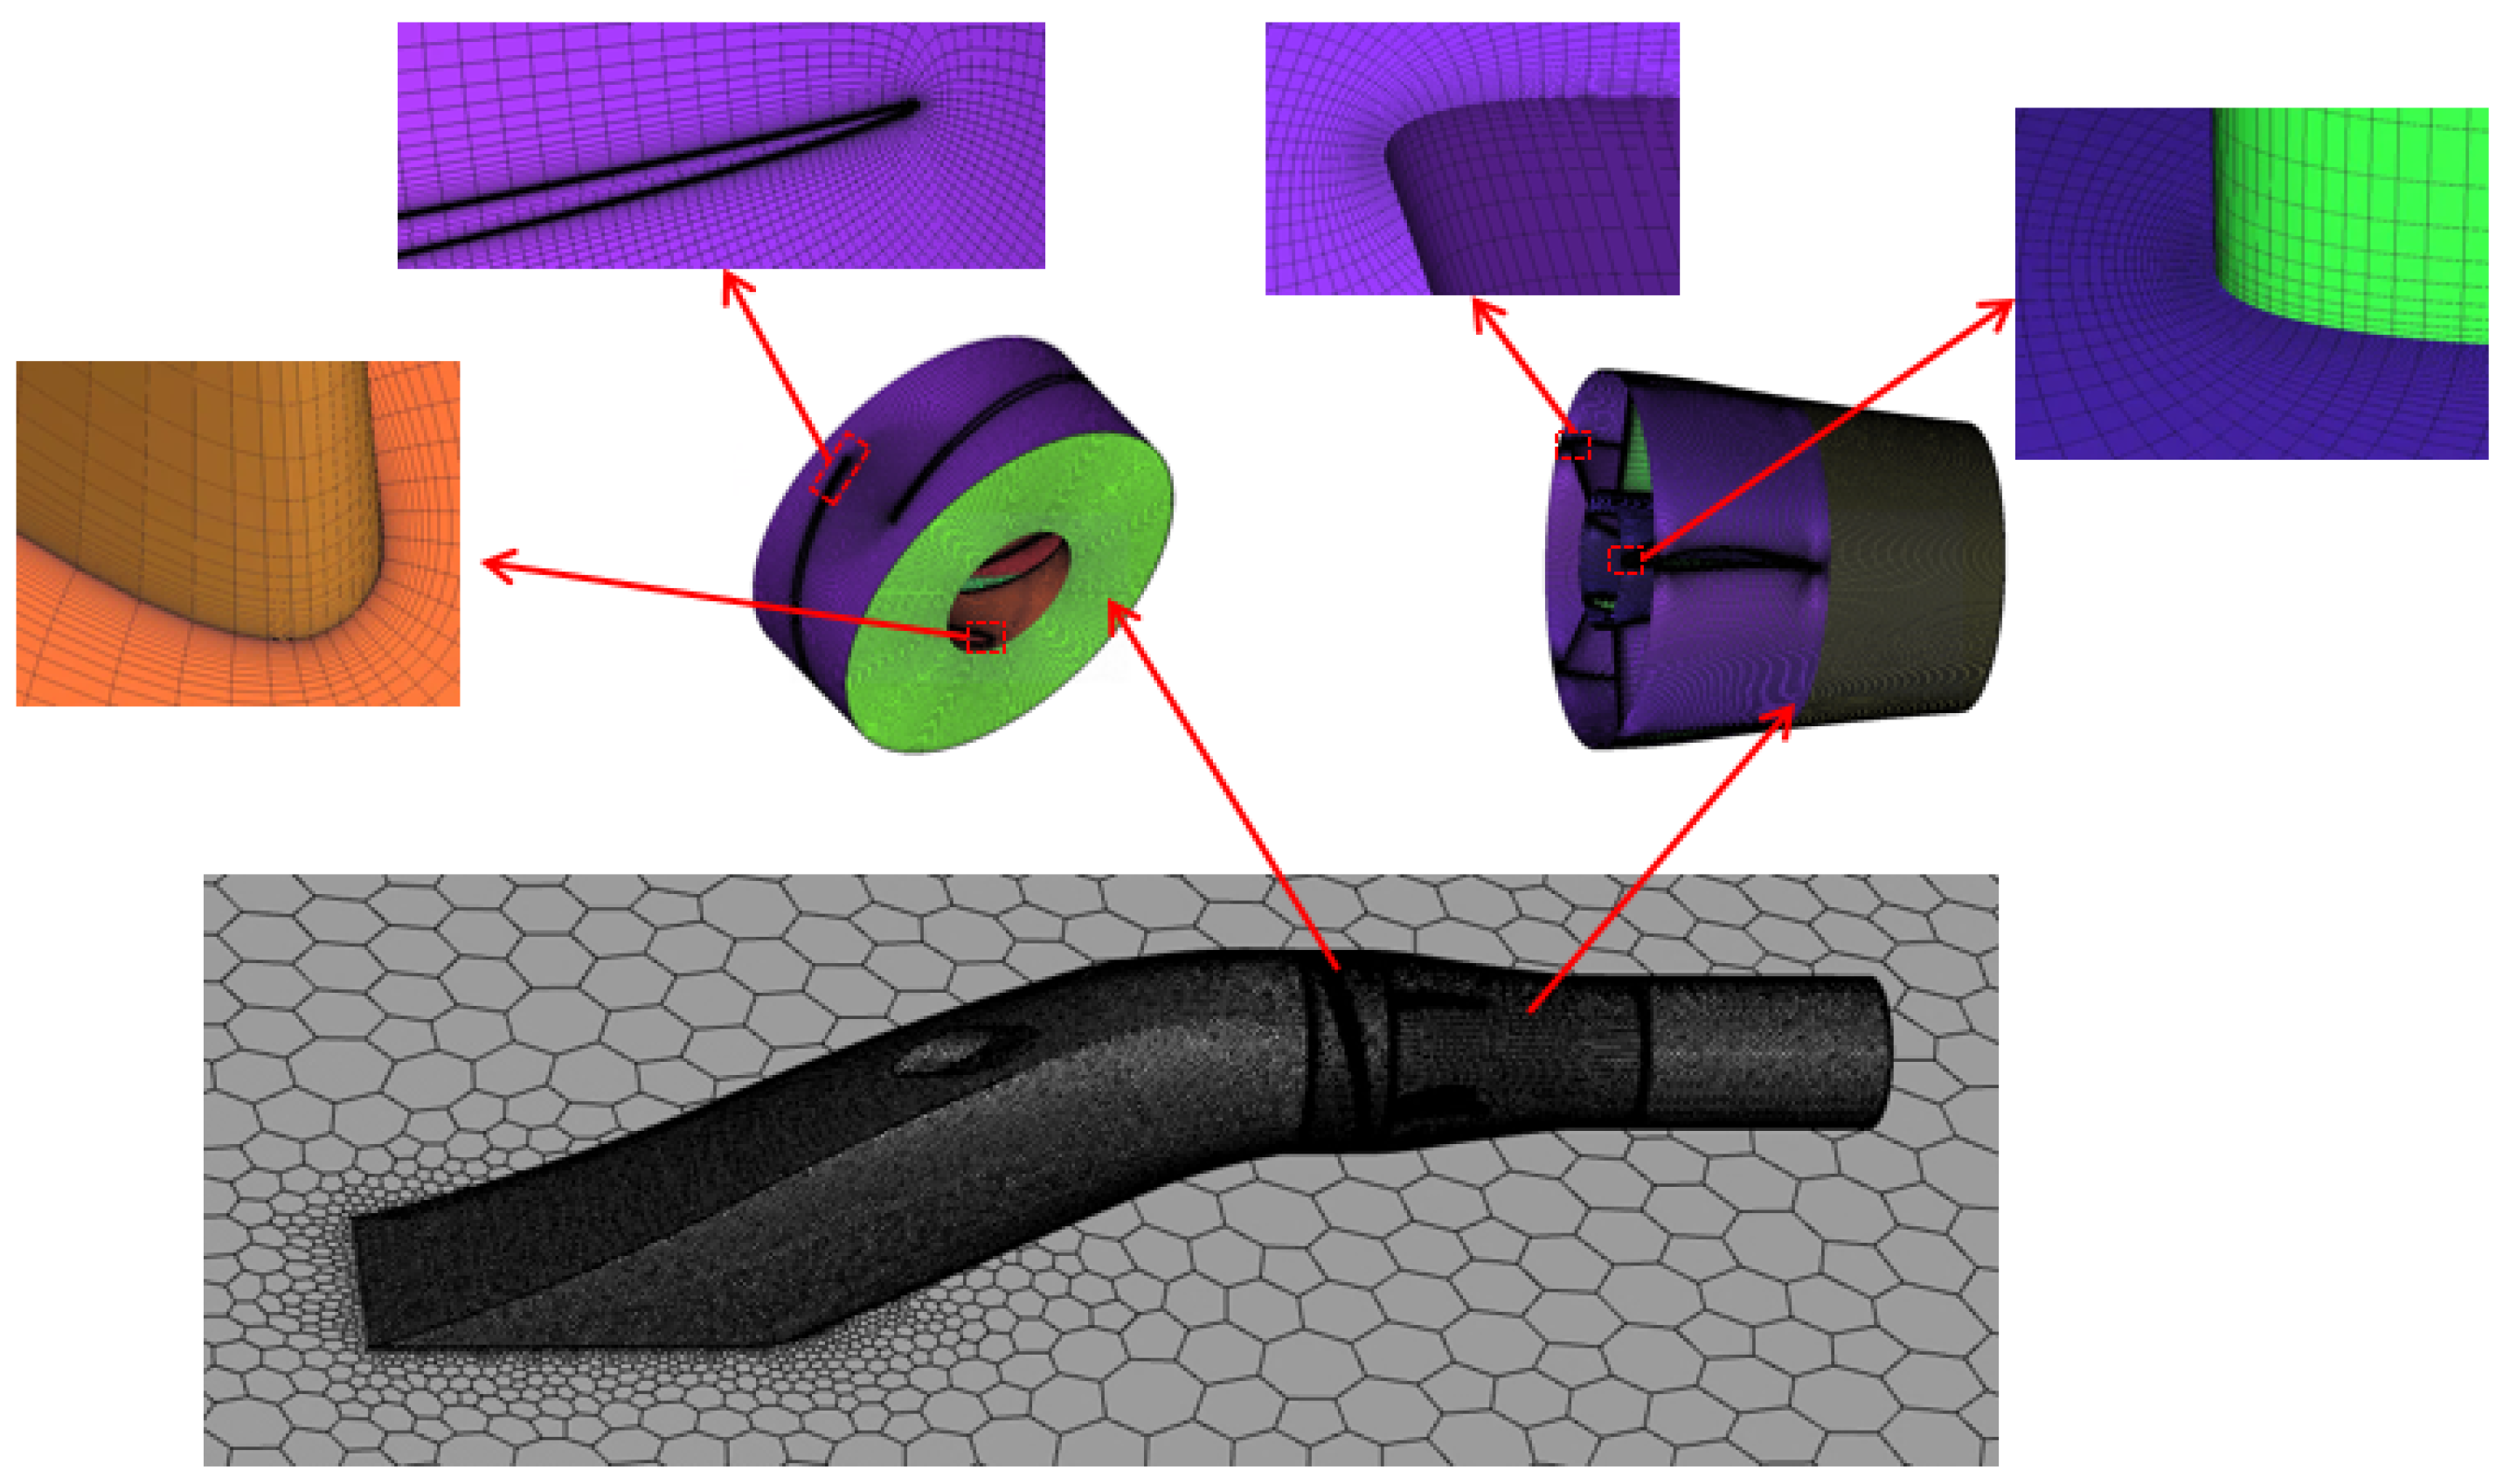
2.2. Establishment of the Calculation Domain
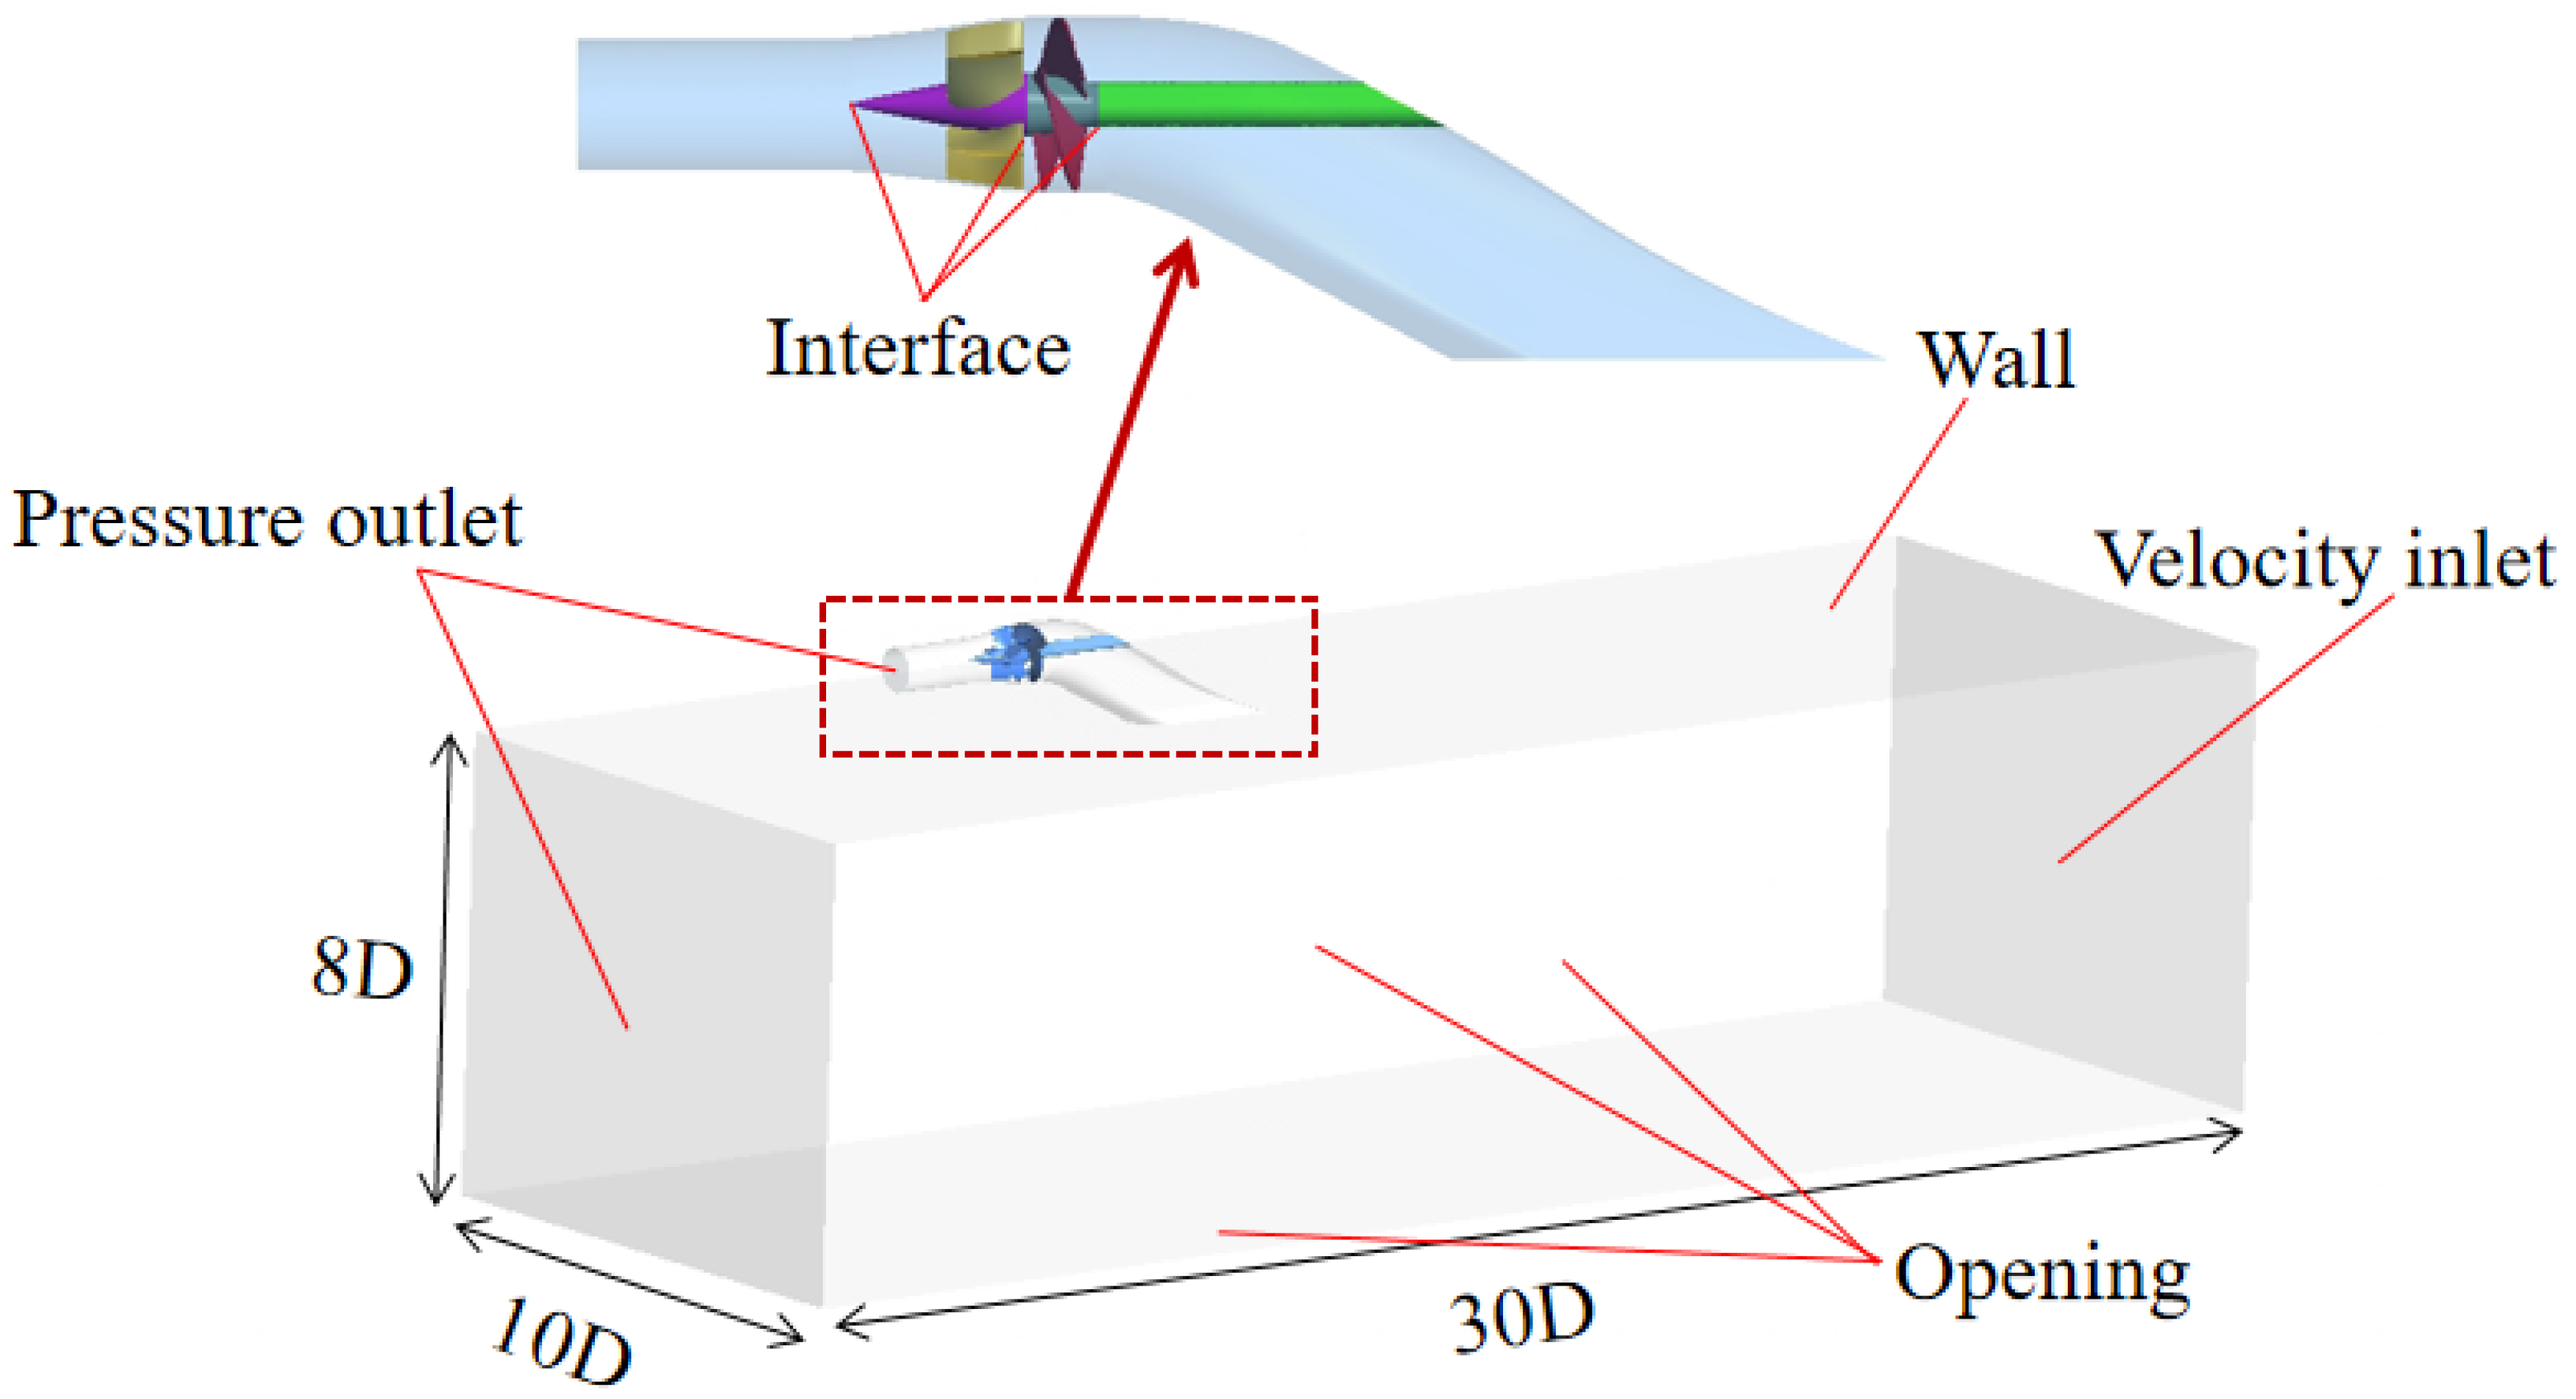
2.3. Boundary Conditions
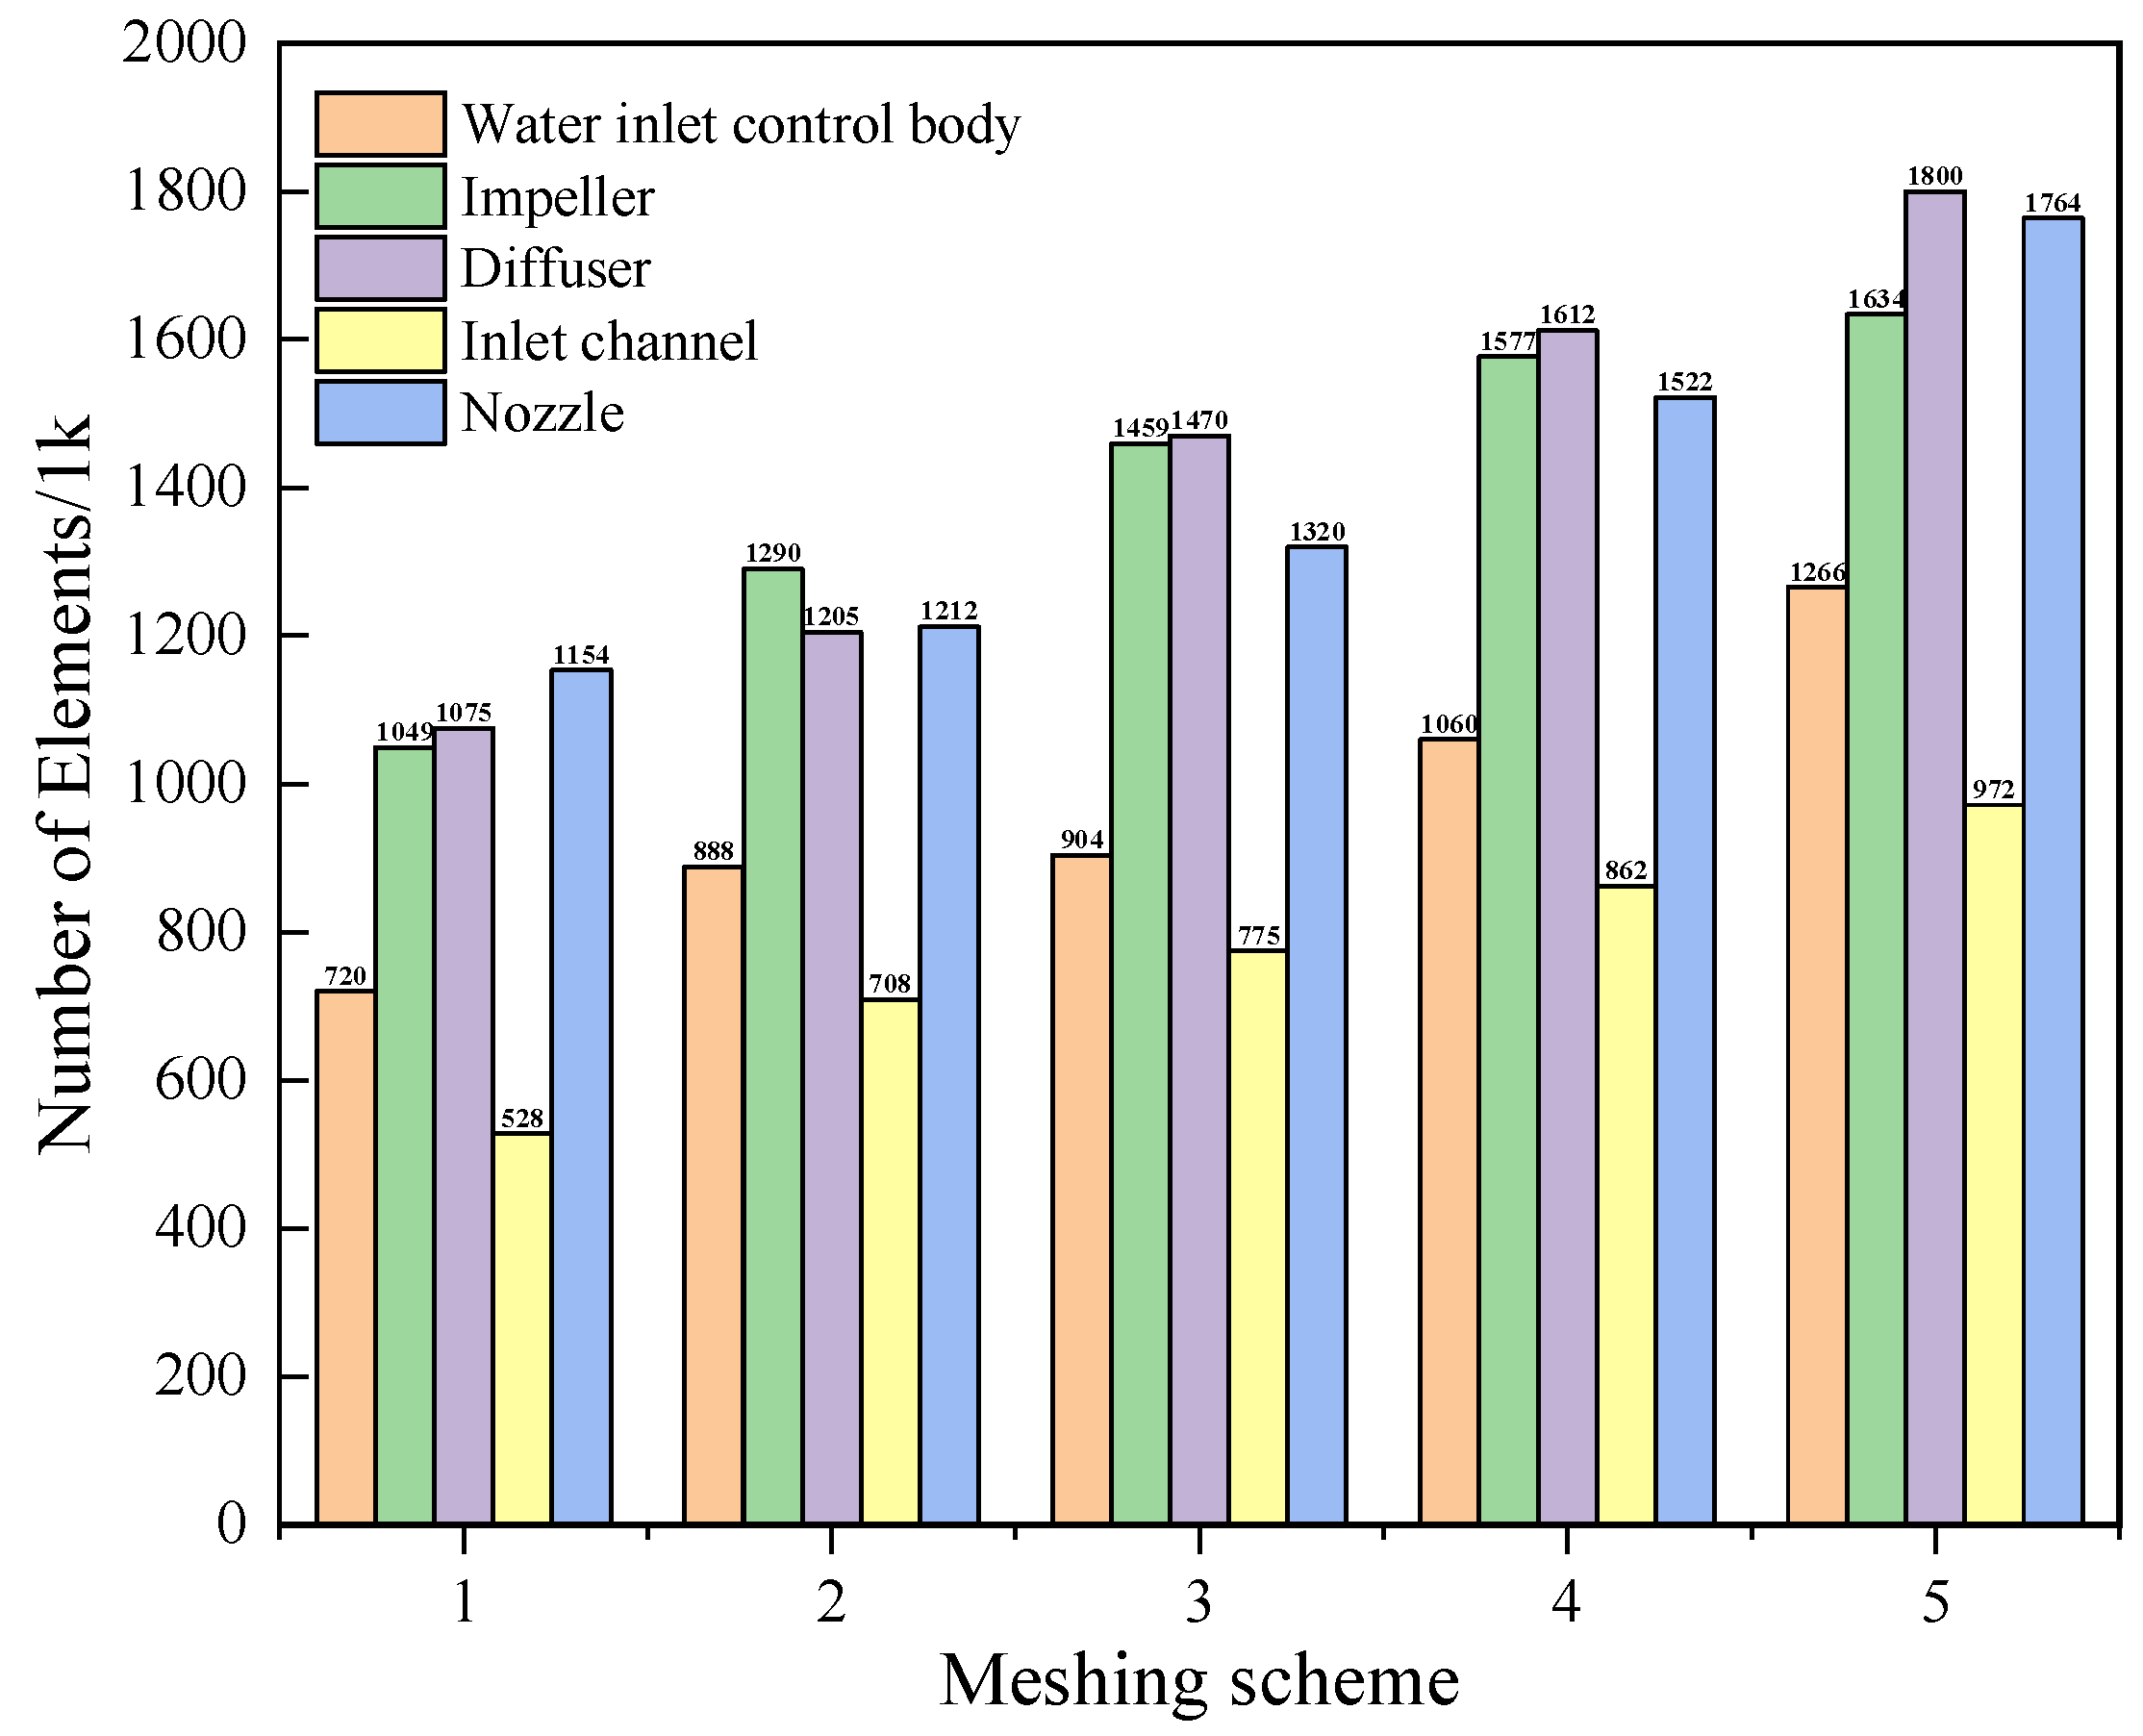
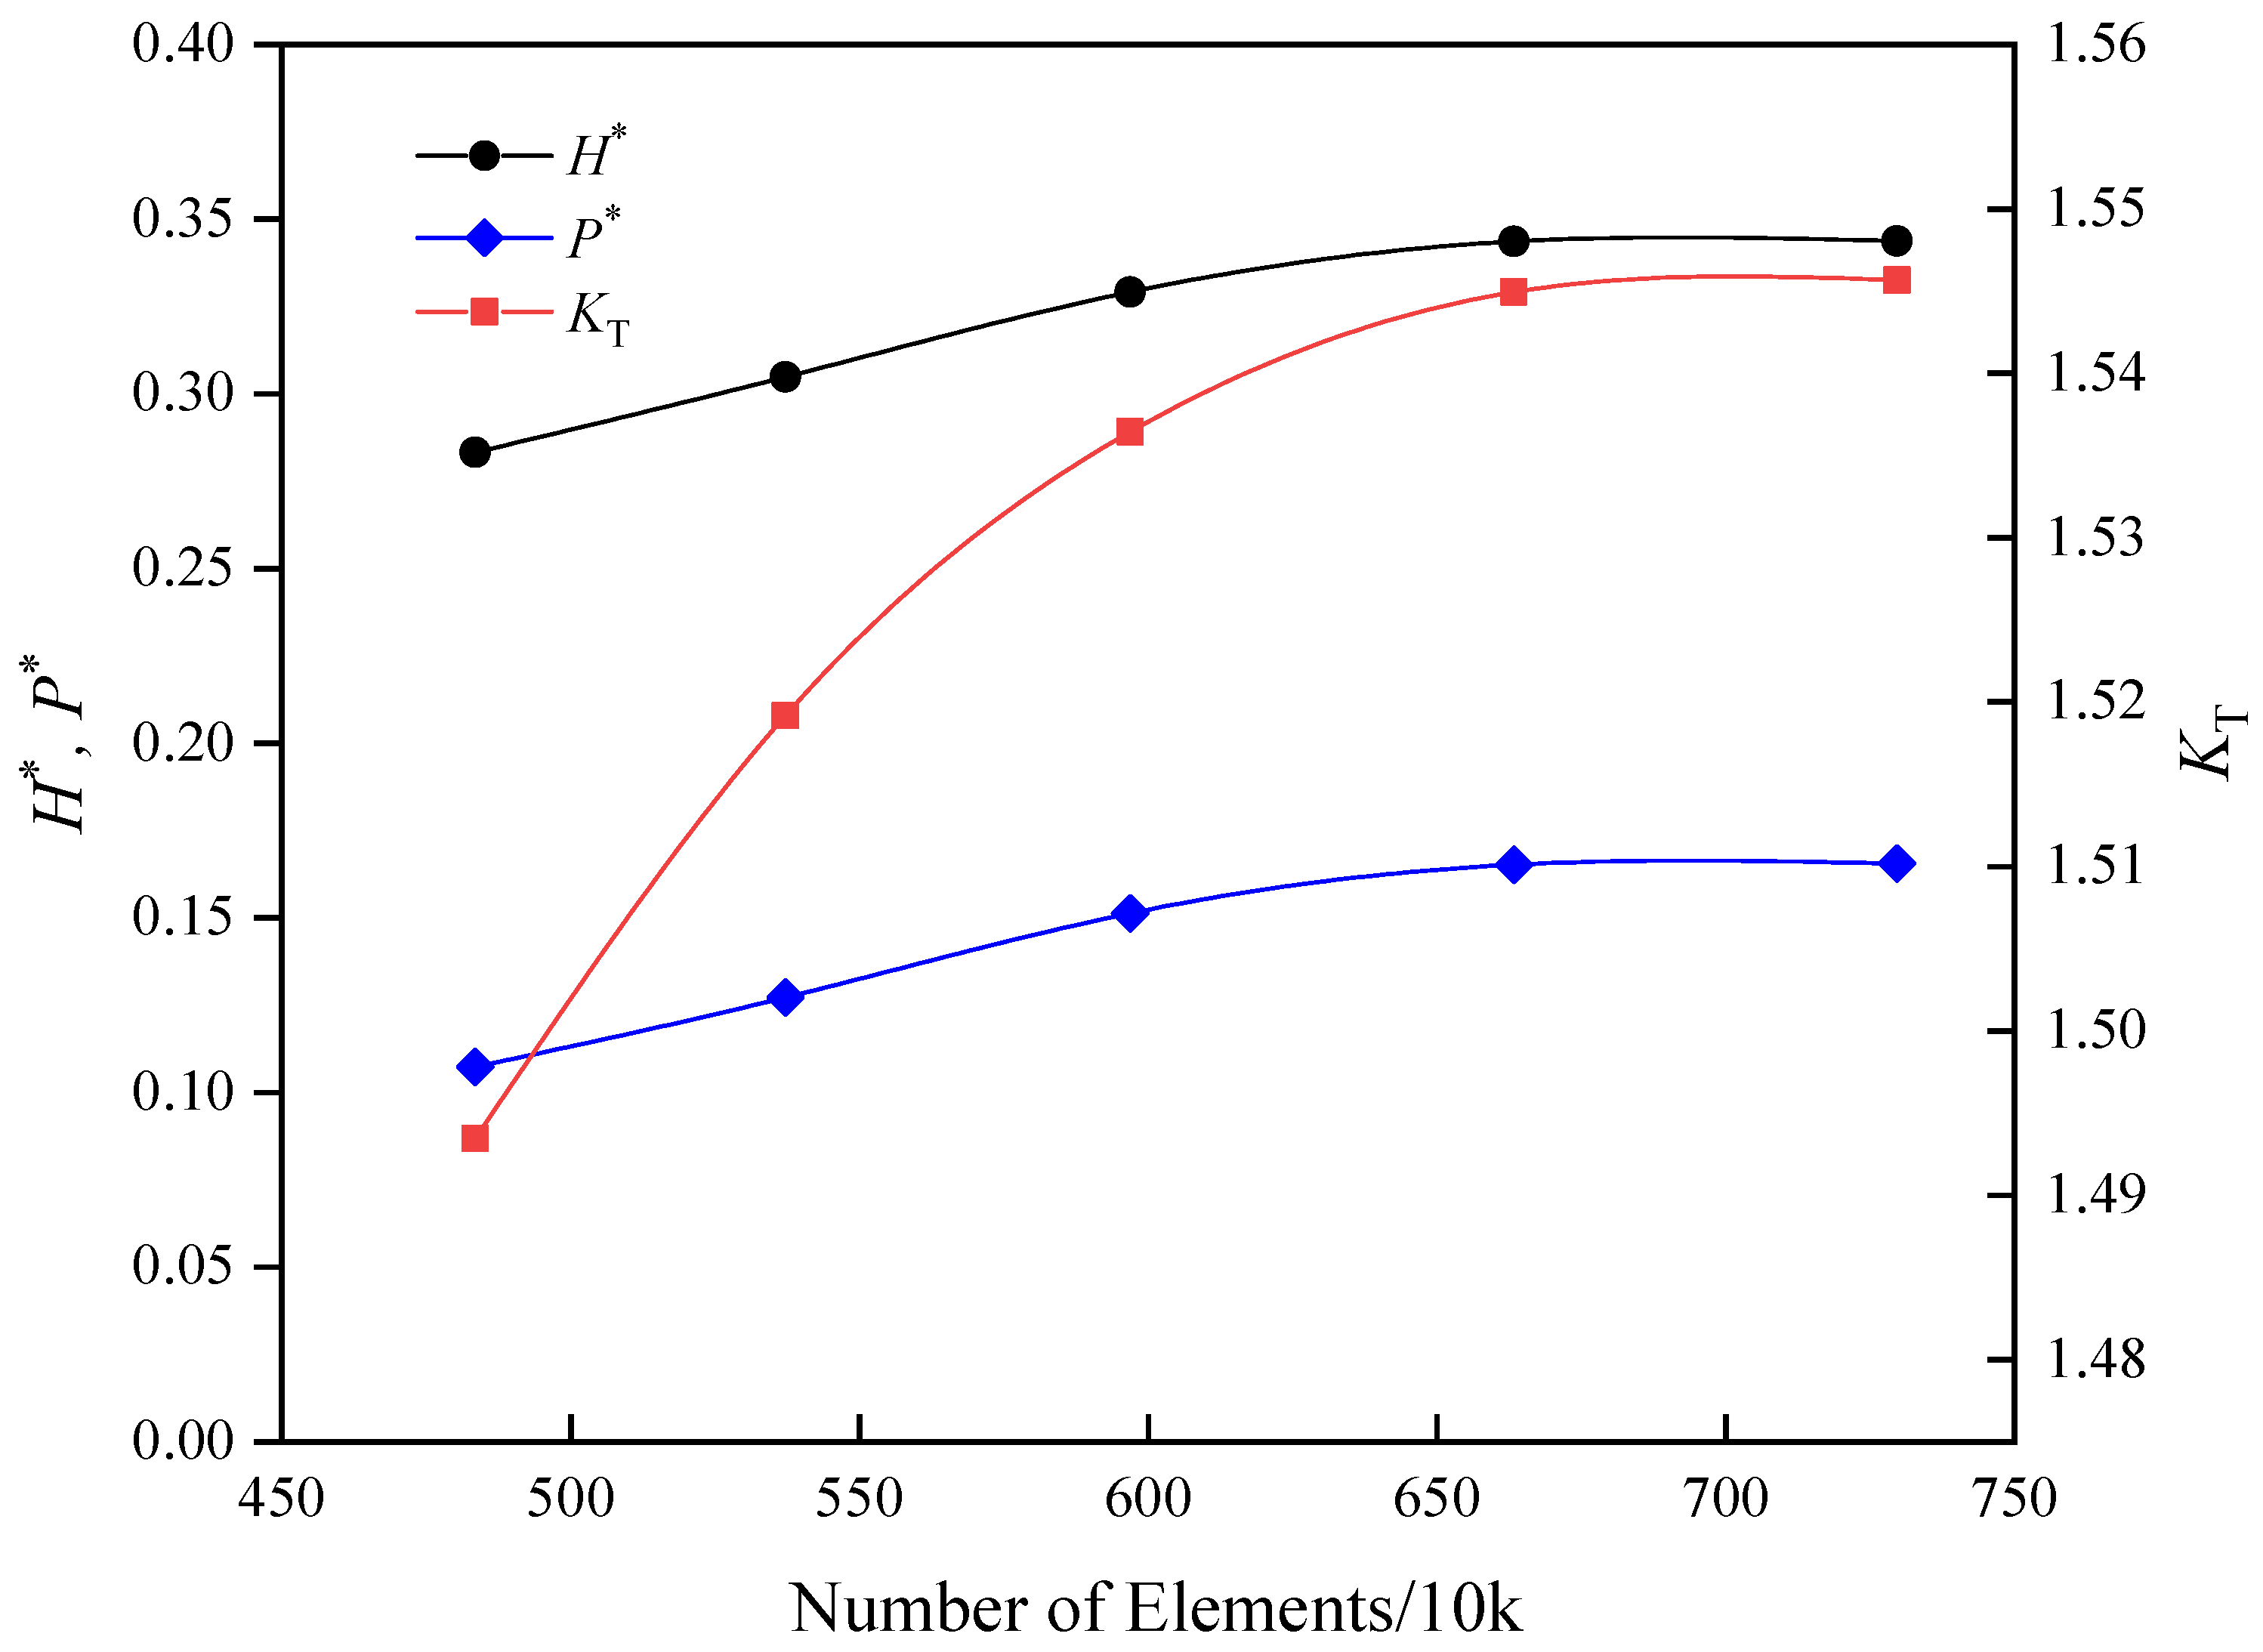
2.4. Mesh Division and Mesh Independence Test
3. Experimental System and Method
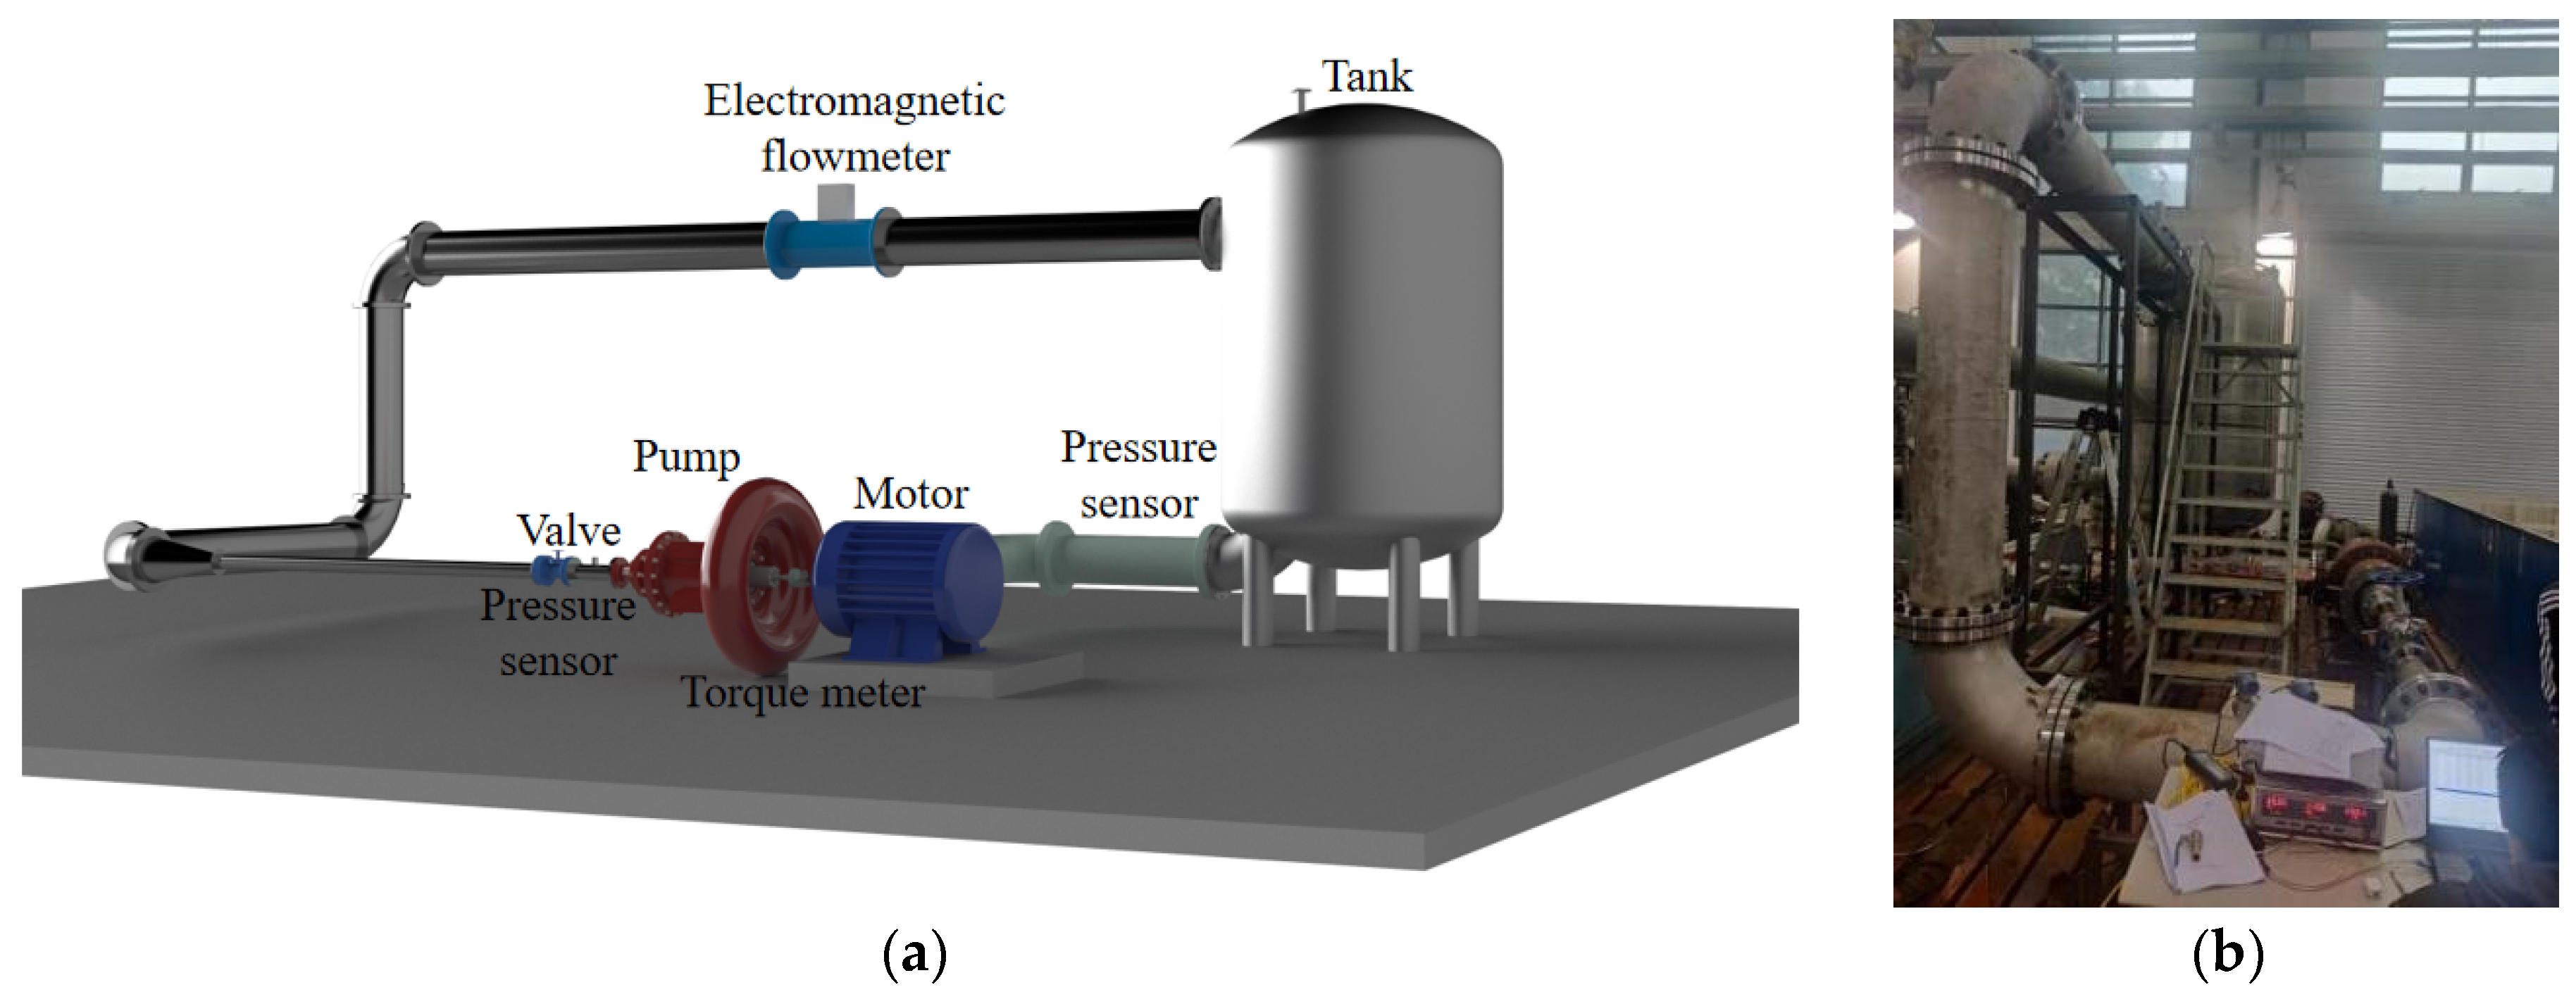
3.1. Experimental System
3.2. Experimental Methods and Results
4. Research Program
5. Calculation Results and Analysis
5.1. Transient Thrust Performance Analysis
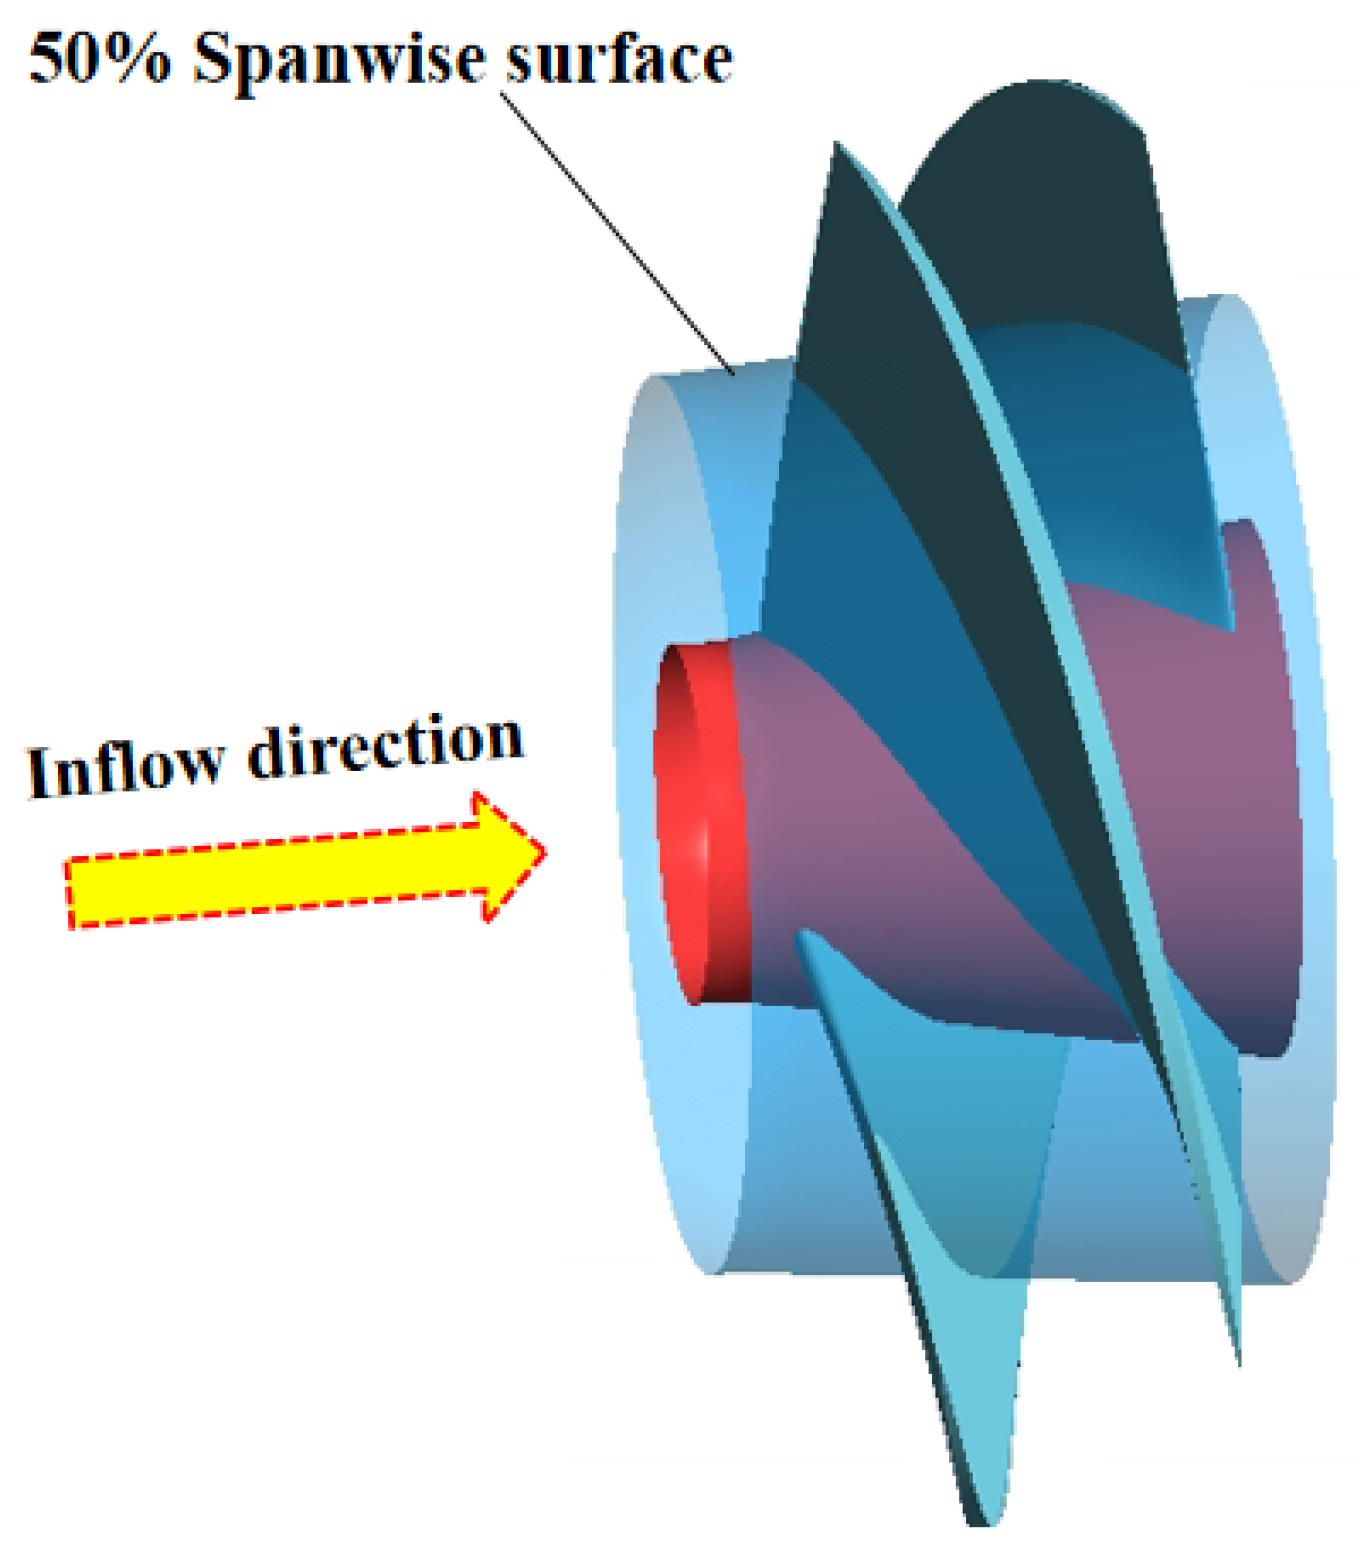
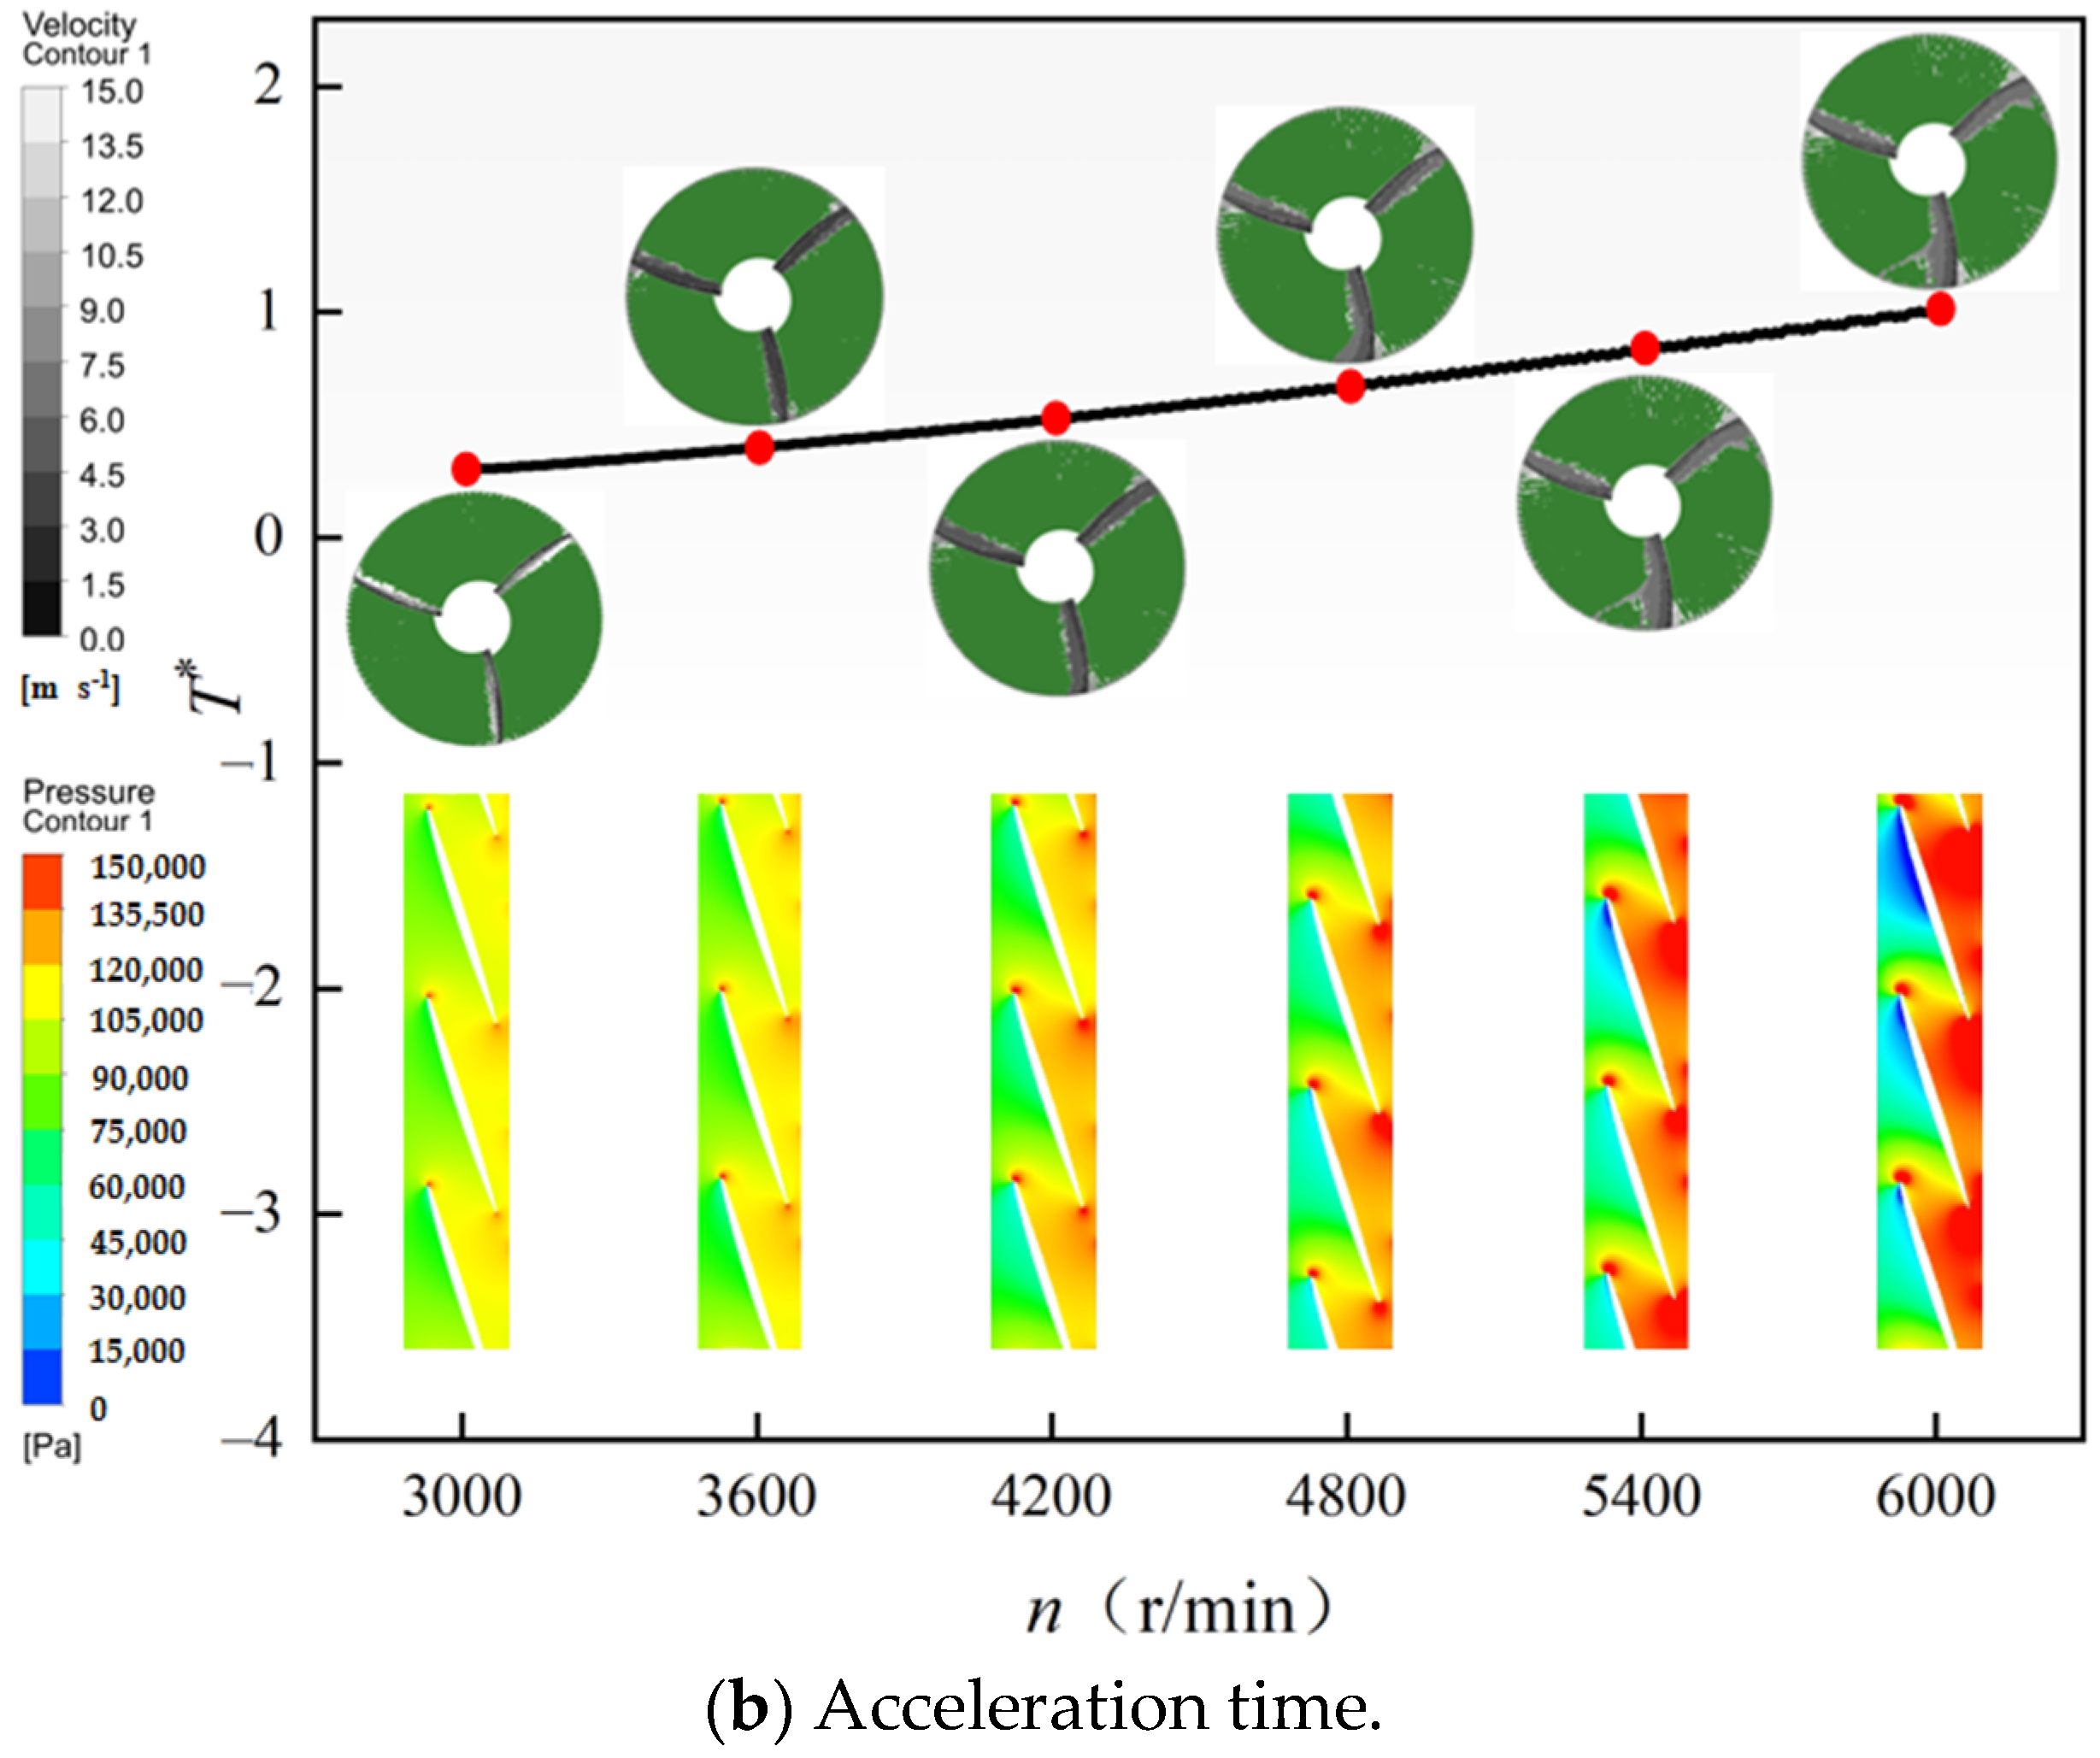
5.2. Evolution Characteristics of the Flow Field
5.3. Cavitation Evolution Characteristics
6. Conclusions
- (1)
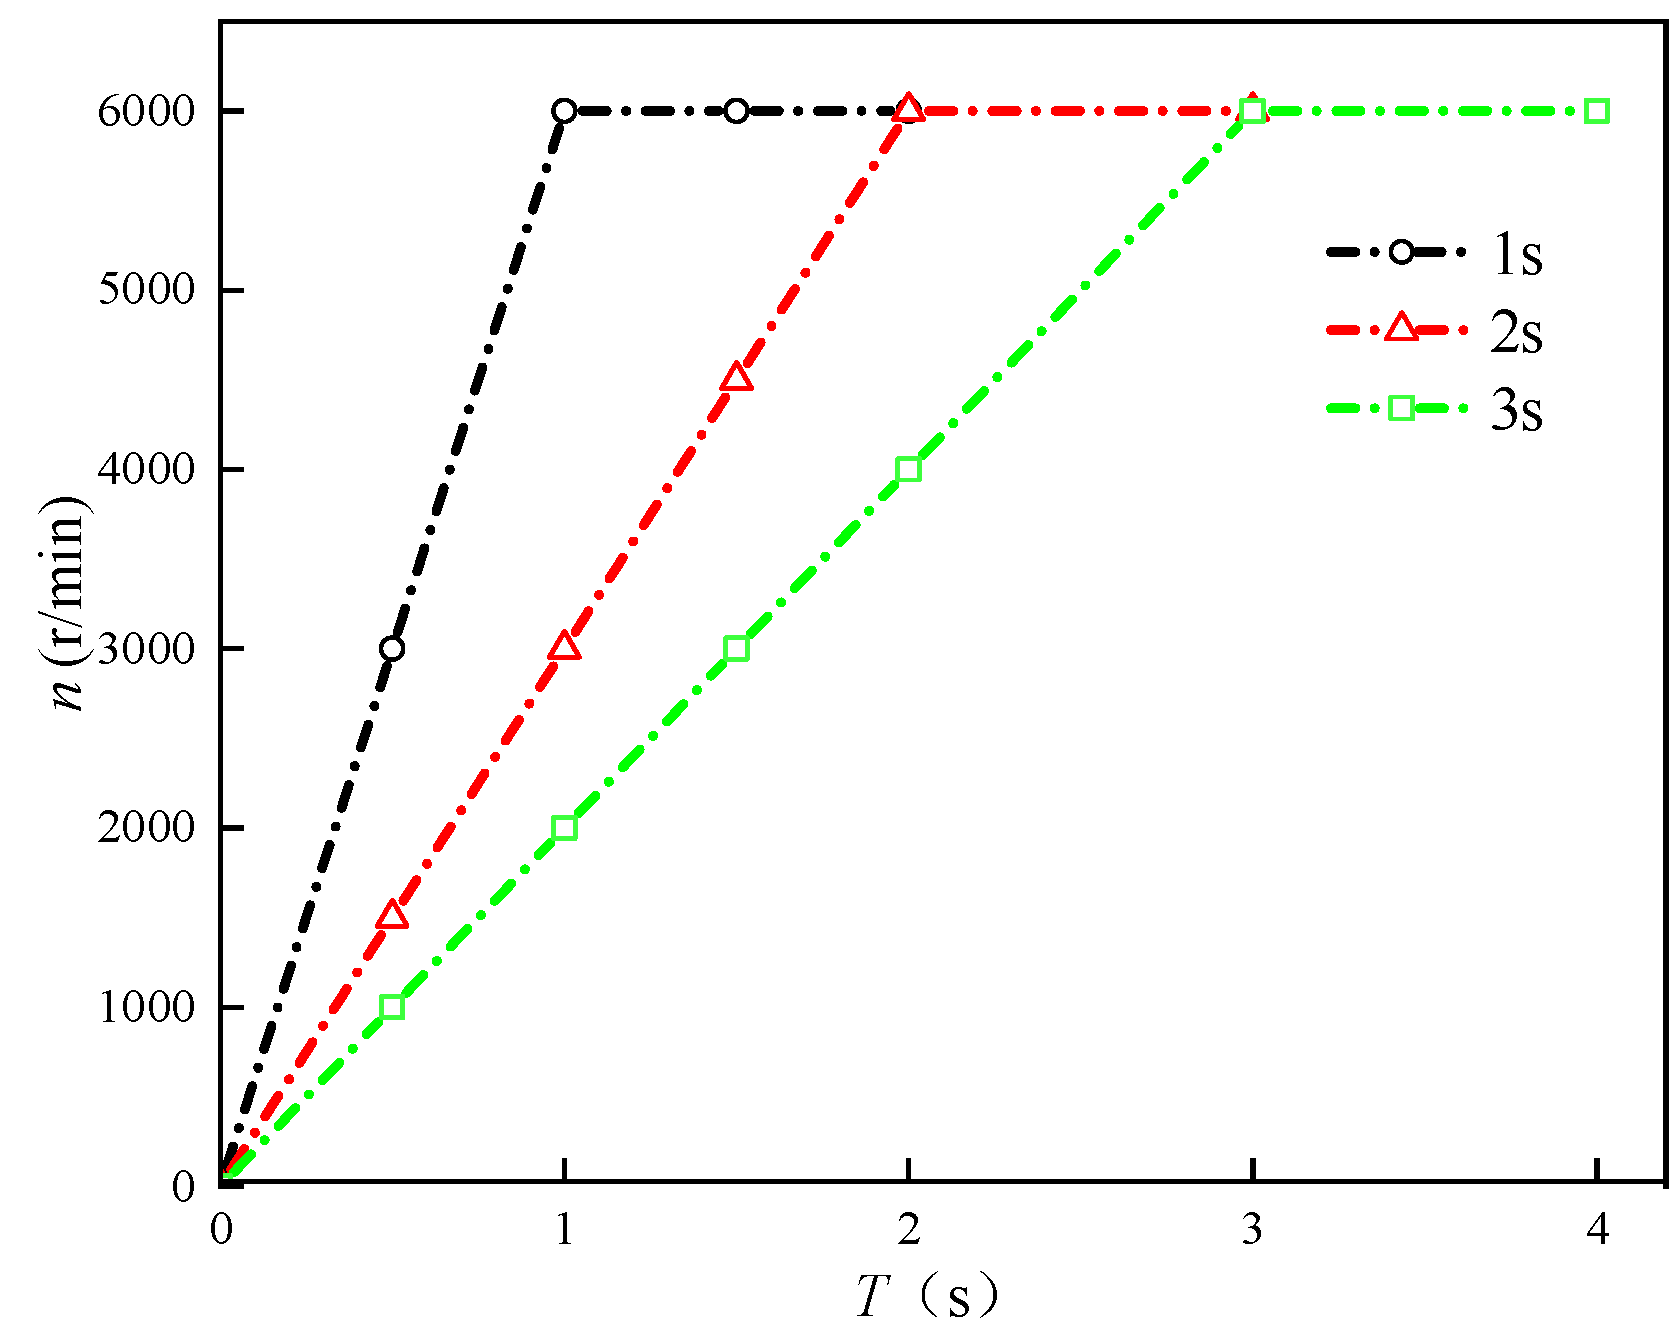
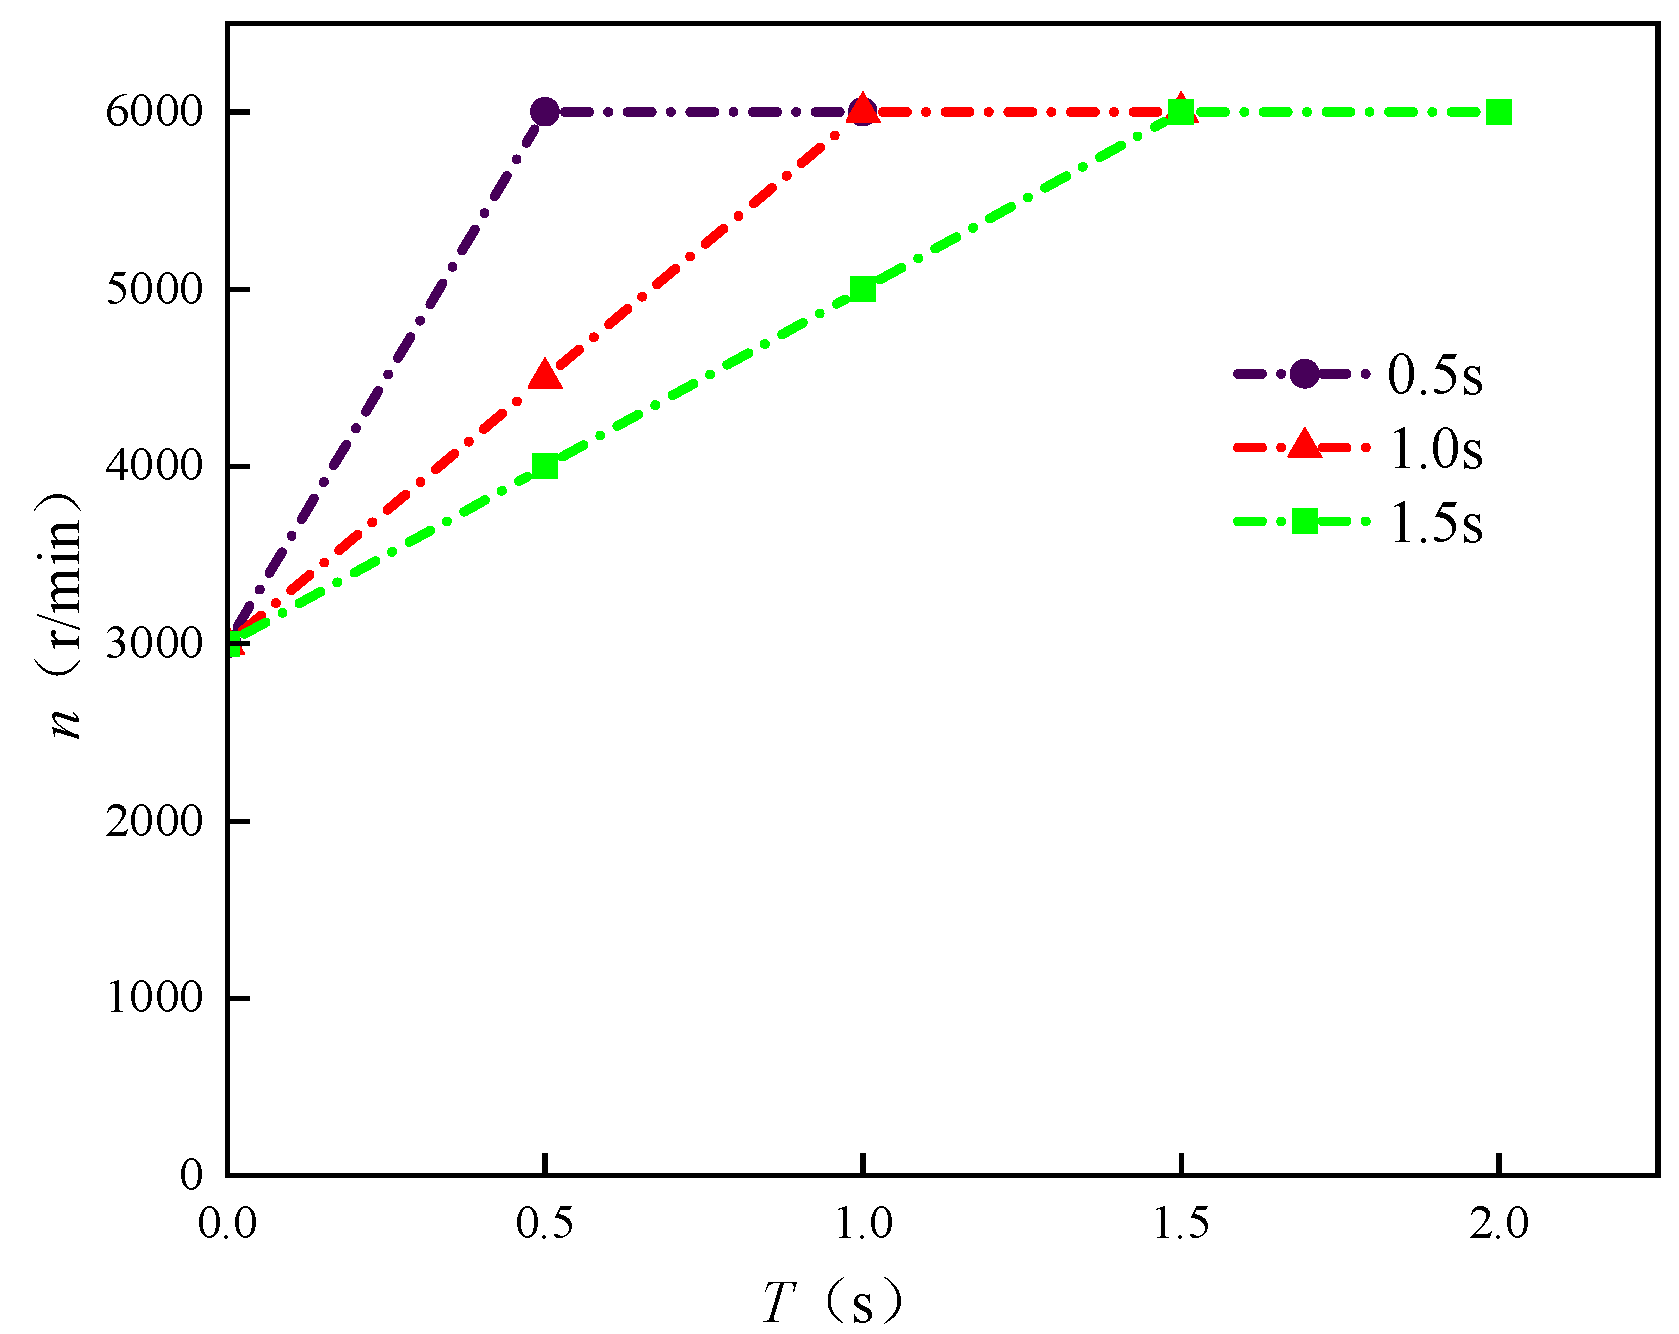
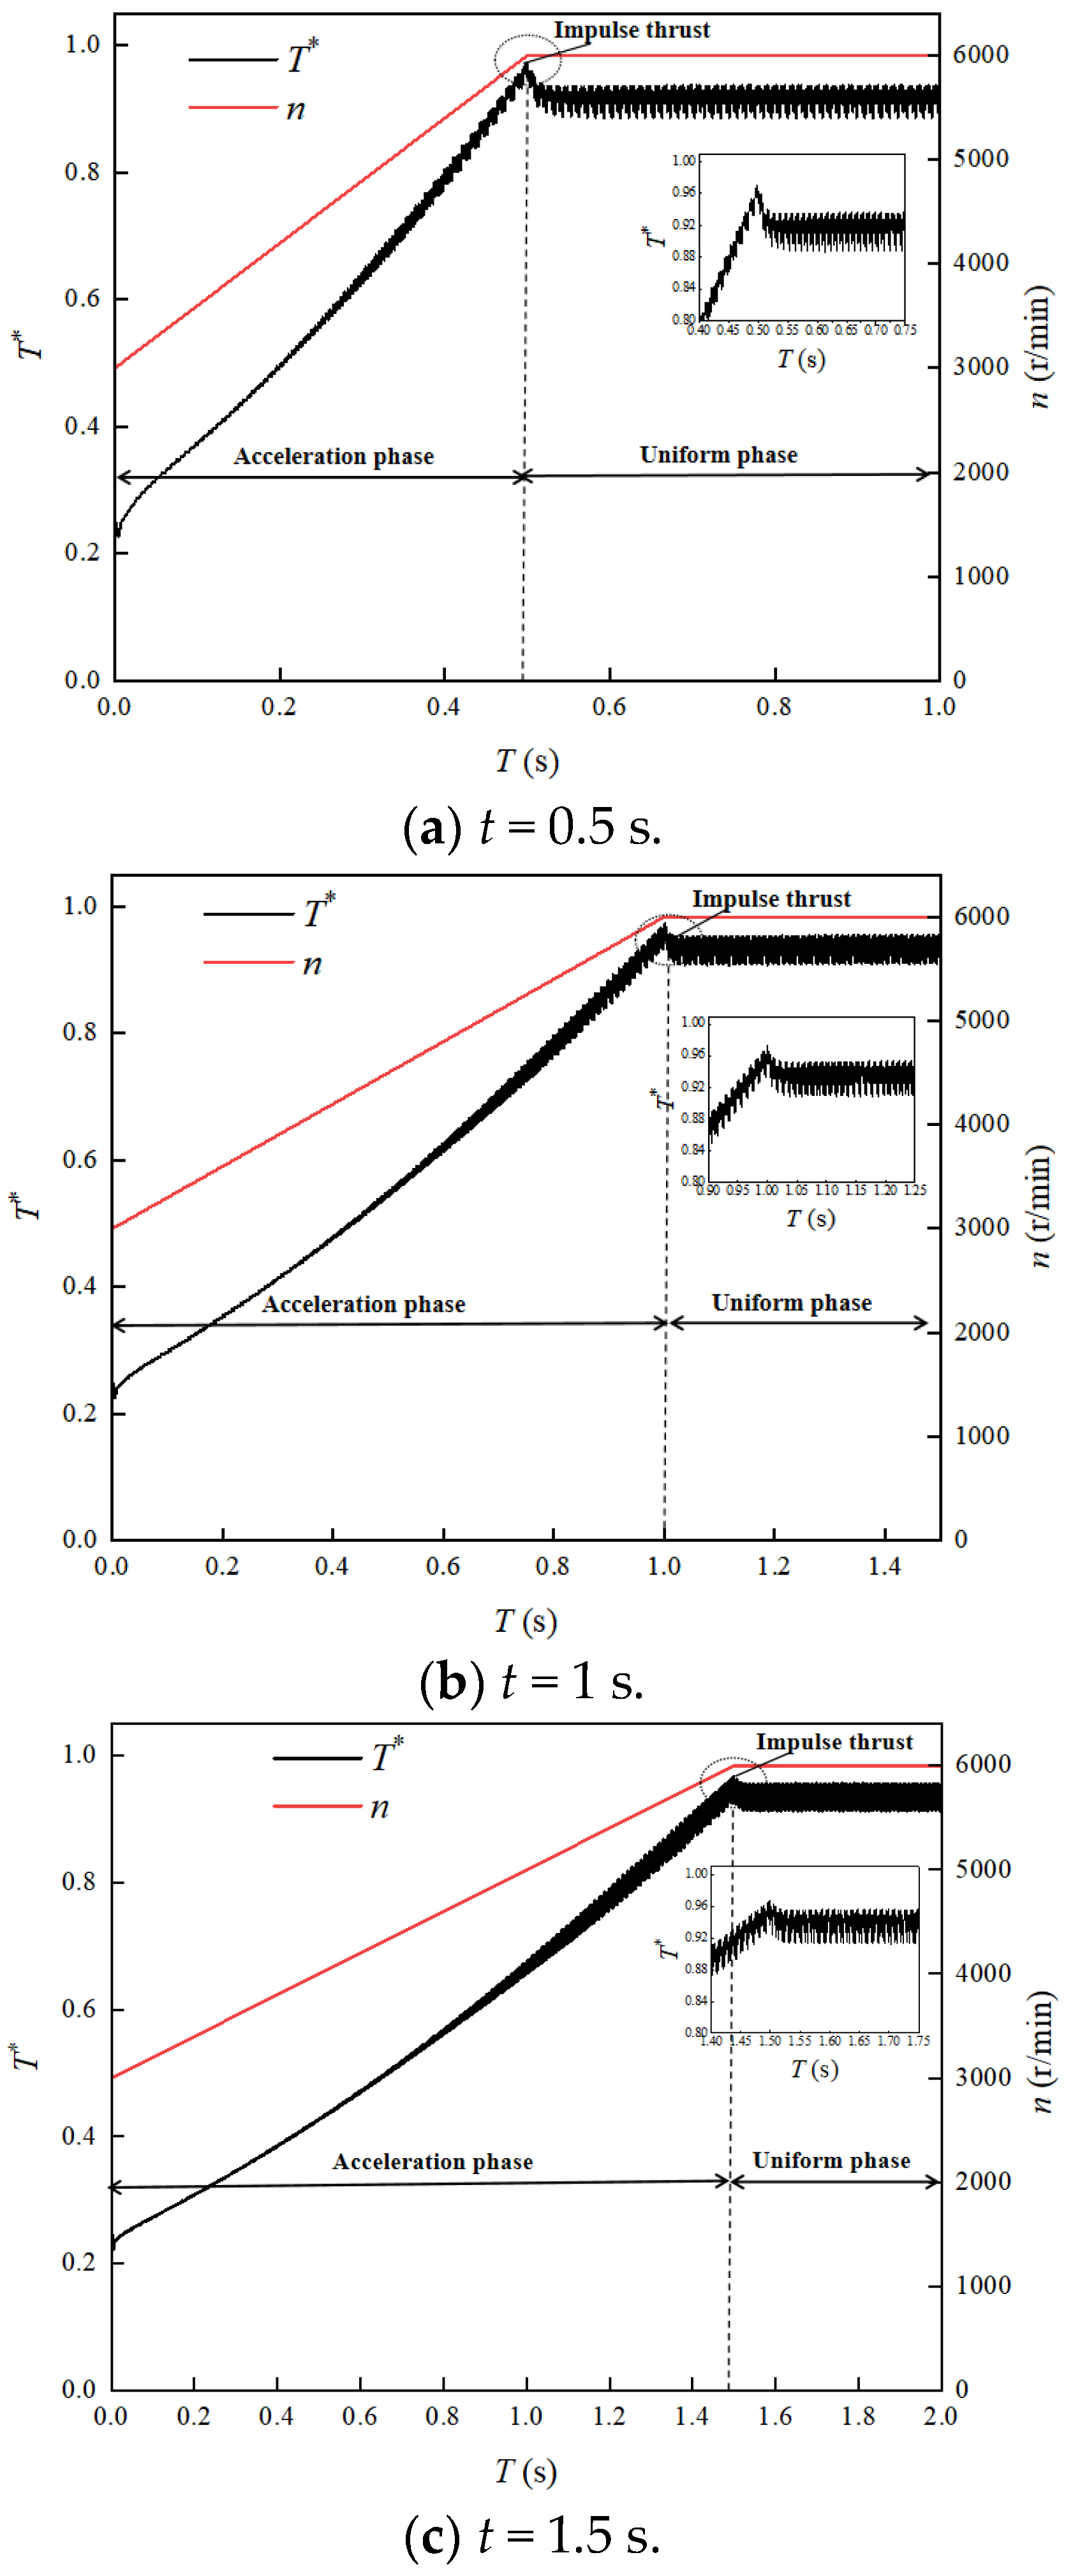
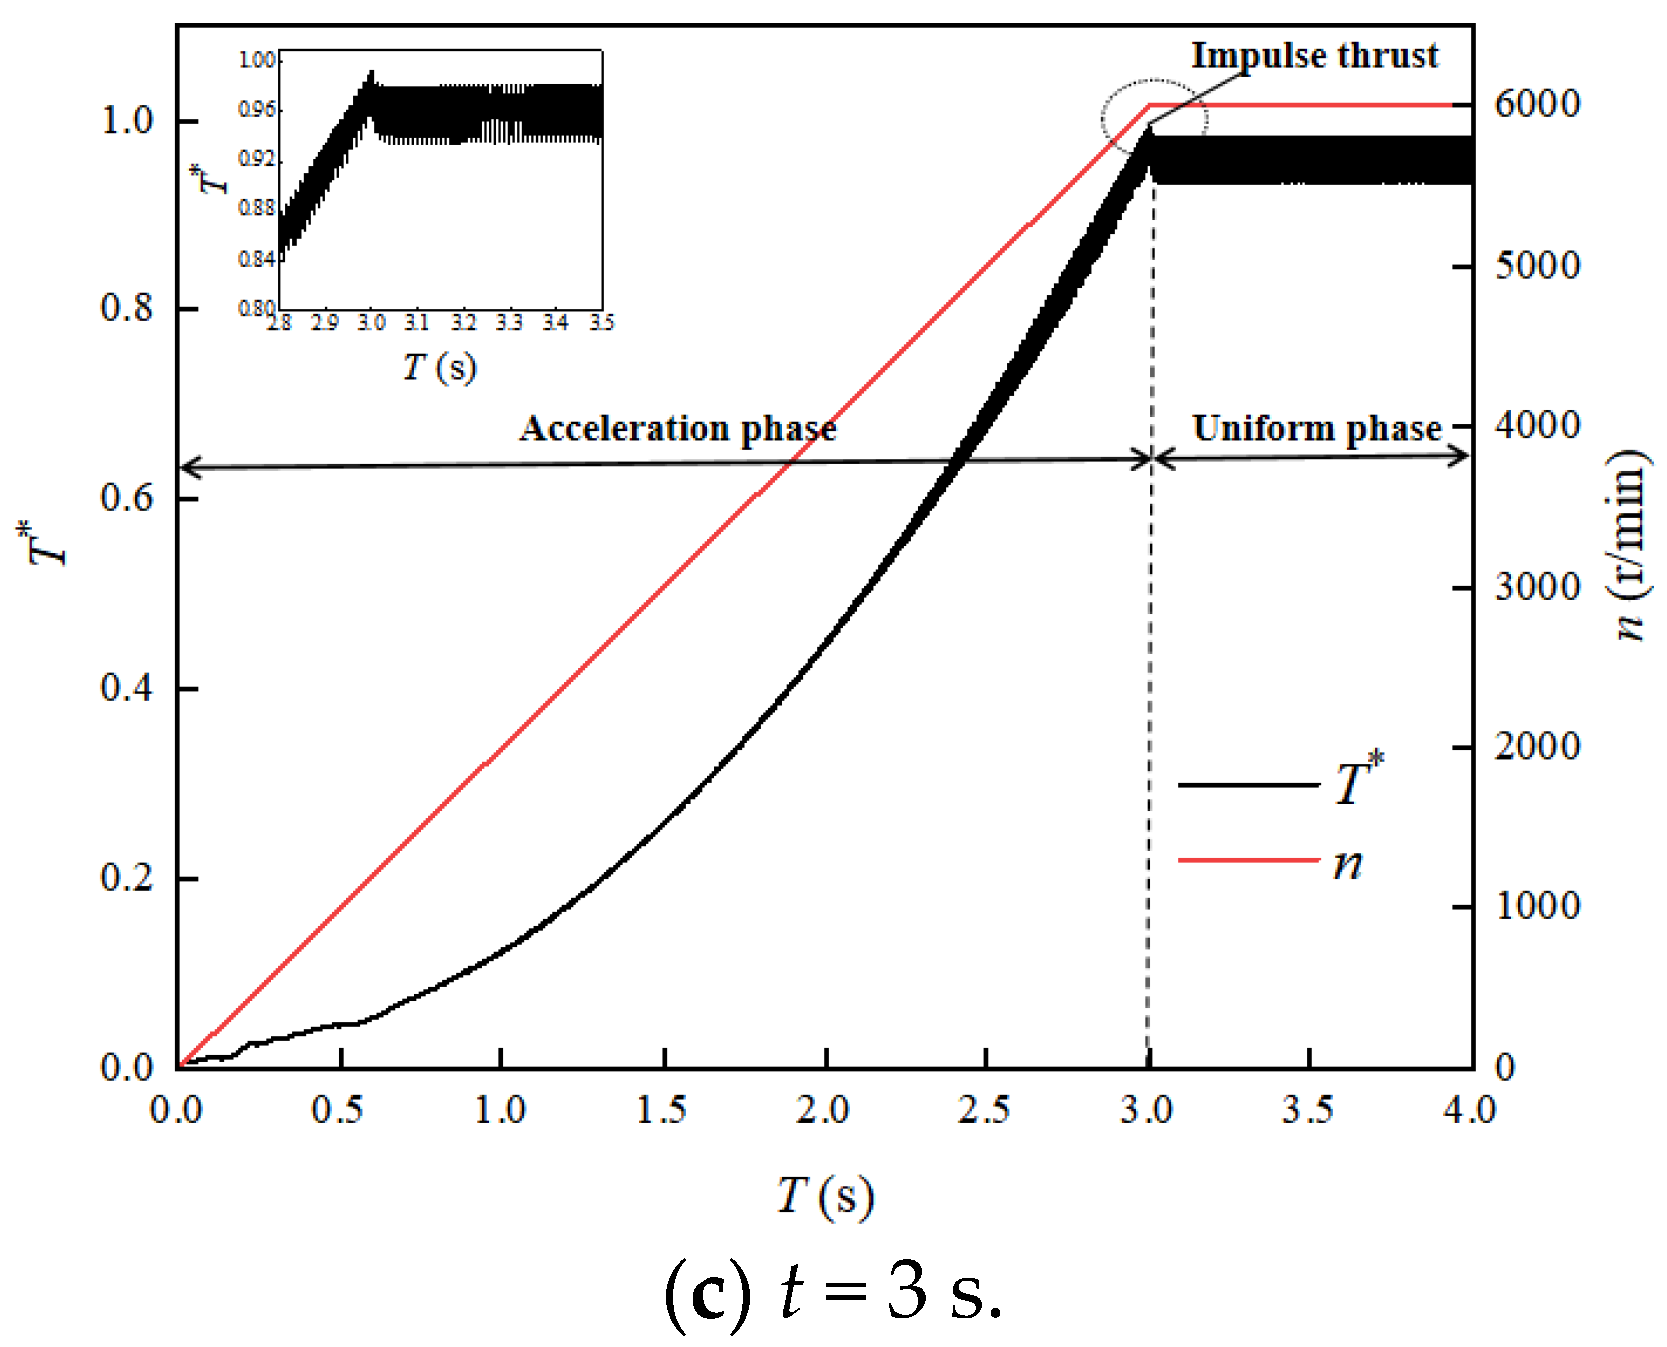
- The variable speed process of the high-speed water-jet pump can be divided into the acceleration stage and stability stage. There is an obvious transient effect in the process of the variable speed, and the thrust reaches the stable state later than the speed. The buffer times for start-up times of 1 s, 2 s, and 3 s were 0.0394 s, 0.0375 s, and 0.0282 s, respectively; the buffer times for acceleration times of 0.5 s, 1.0 s, and 1.5 s were 0.0330 s, 0.0273 s, and 0.0230 s, respectively. The greater the acceleration, the more serious the flow rate and thrust lag behind the speed, and the greater the impact thrust.
- (2)
- In the process of variable speed of the high-speed water-jet pump, the vortex core area of the suction surface first appears at the inlet, on the side of the shroud of the impeller, and increases with the increase in the speed, and develops toward the middle of the impeller. However, after the flow is stabilized, the vortex core region will gradually decrease and eventually be eliminated.
- (3)
- When the speed reaches 0.6 times of the design speed, cavitation begins to occur at the leading edge of the blade, and the cavitation area increases with the increase in speed. Under the design speed, that is, 6000 r/min, the cavitation volume fraction of the 1 s start-up process is 7.32%, the 2 s start-up process is 5.84%, the 3 s start-up process is 5.32%, and the 0.5 s acceleration process is 6.86%. The cavitation volume fraction of the 1 s acceleration process is 5.04%, and that of the 1.5 s acceleration process is 4.23%. When the same speed is reached, the greater the acceleration, the more serious the cavitation, and the weaker the blade’s ability to perform work.
- (4)
- In the high-speed water-jet pump, the lag effect brought by the transient effect cannot be ignored. Compared with the start-up process and acceleration process under the same acceleration, it was found that the lag effect will be slightly lower than the start-up process during the acceleration process. Under the same acceleration, the buffer time required for the start-up process is 19.3~22.6% longer than that for the acceleration process. This also leads to a smaller range of the vortex core area during the acceleration process, stronger anti-cavitation ability, and more stable flow when the speed reaches 6000 r/min. When the high-speed water-jet pump is used, it is recommended that the speed is slowly increased in the segmentation acceleration mode.
- (1)
- Environmental factors were not considered in this paper, which will have a great impact on the actual operation of the water-jet pump. For example, cavitation is related to steam pressure and corresponding temperature. If the appropriate temperature is selected, cavitation can be reduced.
- (2)
- Multi-parameter analysis and optimization are indispensable for the in-depth study of the water-jet pump, but relevant research was not involved in the paper.
- (3)
- This paper mainly studied the operation characteristics and internal flow characteristics of a high-speed water-jet pump through numerical simulation, and did not conduct experimental discussions on the internal flow field.
Author Contributions
Funding
Data Availability Statement
Conflicts of Interest
References
- Cao, L.L.; Che, B.X.; Hu, L.J.; Wu, D.Z. Design method of water jet pump towards high cavitation performances. IOP Conf. Ser. Mater. Sci. Eng. 2016, 129, 012067. [Google Scholar] [CrossRef]
- Fu, Y. A Review on Hydrodynamic Performance and Design of Pump-Jet: Advances, Challenges and Prospects. J. Mar. Sci. Eng. 2022, 10, 1514. [Google Scholar]
- Han, W.; Chen, R.; Li, R.; Su, M.; Qiang, Y.; Han, J.; Li, H. Acoustic characteristics of water-jet propulsion with screw mixed-flow pump under quasi-submerged state. Mod. Phys. Lett. B 2020, 34, 205373. [Google Scholar] [CrossRef]
- Han, W.; Shang, T.; Su, M.; Gong, C.; Meng, B. Direct Sailing Variable Acceleration Dynamics Characteristics of Water-Jet Propulsion with a Screw Mixed-Flow Pump. Appl. Sci. 2019, 9, 4194. [Google Scholar] [CrossRef]
- Wu, J.; Cheng, L.; Luo, C.; Wang, C. Influence of External Jet on Hydraulic Performance and Flow Field Characteristics of Water Jet Propulsion Pump Device. Shock. Vib. 2021, 2021, 1–15. [Google Scholar] [CrossRef]
- Huang, R.; Yu, A.; Ji, B.; Zhou, J.; Zhai, Z.; Luo, X. Cavitating flow features in a water-jet pump under different upstream conditions. In Proceedings of the 16th International Symposium on Transport Phenomena and Dynamics of Rotating Machinery, Honolulu, HI, USA, 10–15 April 2016. [Google Scholar]
- Wang, J.; Cheng, H.; Xu, S.; Ji, B.; Long, X. Performance of cavitation flow and its induced noise of different jet pump cavitation reactors. Ultrason. Sonochemistry 2019, 106, 215–225. [Google Scholar] [CrossRef]
- Zhao, G.; Liang, N.; Zhang, Y.; Cao, L.; Wu, D. Dynamic behaviors of blade cavitation in a water jet pump with inlet guide vanes: Effects of inflow non-uniformity and unsteadiness. Appl. Ocean. Res. 2021, 117, 102889. [Google Scholar] [CrossRef]
- Yang, D.; Huang, Z.; Guo, A.; Xu, J.; Jiao, L. Effect of Tip Clearance on Hydraulic Performance of Water-jet Pump. J. Phys. Conf. Ser. 2017, 916, 012020. [Google Scholar] [CrossRef]
- Yang, Y.; Wu, S.; Wang, C.; Jiao, W.; Ji, L.; An, C.; Ge, J. Effect of effuser throat diameter on the internal flow structure and energy characteristics of the jet pump. Energy Rep. 2023, 9, 2075–2086. [Google Scholar] [CrossRef]
- Zhang, Y.; Han, J.; Huang, B.; Zhang, D.; Wu, D. Excitation force on a pump-jet propeller: The effect of the blade number. Ocean. Eng. 2023, 281, 114727. [Google Scholar] [CrossRef]
- Lu, Y.; Tan, L.; Han, Y.; Liu, M. Cavitation-vibration correlation of a mixed flow pump under steady state and fast start-up conditions by experiment. Ocean. Eng. 2022, 251, 111158. [Google Scholar] [CrossRef]
- Duplaa, S.; Coutier-Delgosha, O.; Dazin, A.; Roussette, O.; Caignaert, G. Experimental Study of a Cavitating Centrifugal Pump During Fast Startups. J. Fluids Eng. 2010, 132, 365–368. [Google Scholar] [CrossRef]
- Zhang, Y.-L.; Zhu, Z.-C.; Zhao, Y.-J.; Wu, J.; Zhou, F.-L. Comparative Experiments on a Self-priming Pump Delivering Water Medium During Rapid and Slow Starting Periods. Iran. J. Sci. Technol. Trans. Mech. Eng. 2021, 45, 1007–1019. [Google Scholar] [CrossRef]
- Zhang, Y.-L.; Zhu, Z.-C.; Dou, H.-S.; Cui, B.-L.; Li, Y. Experimental and Theoretical Study of a Prototype Centrifugal Pump during Startup Period. Int. J. Turbo Jet-Engines 2013, 30, 173–177. [Google Scholar] [CrossRef]
- Wu, D.; Wang, L.; Hao, Z.; Li, Z.; Bao, Z. Experimental study on hydrodynamic performance of a cavitating centrifugal pump during transient operation. J. Mech. Sci. Technol. 2010, 24, 575–582. [Google Scholar] [CrossRef]
- Li, W.; Ji, L.; Shi, W.; Li, E.; Ma, L.; Yang, Z. Particle image velocimetry experiment of the inlet flow field in a mixed-flow pump during the startup period. Proc. Inst. Mech. Eng. Part. A J. Power Energy 2019, 234, 300–314. [Google Scholar] [CrossRef]
- Li, Q.; Ma, X.; Wu, P.; Yang, S.; Huang, B.; Wu, D. Study on the Transient Characteristics of the Centrifugal Pump during the Startup Period with Assisted Valve. Processes 2020, 8, 1241. [Google Scholar] [CrossRef]
- Gaggero, S.; Martinelli, M. Design and analysis of pumpjet propulsors using CFD-based optimization. Ocean. Eng. 2023, 277, 114304. [Google Scholar] [CrossRef]
- Fu, S.; Zheng, Y.; Kan, K.; Chen, H.; Han, X.; Liang, X.; Liu, H.; Tian, X. Numerical simulation and experimental study of transient characteristics in an axial flow pump during start-up. Renew. Energy 2020, 146, 1879–1887. [Google Scholar] [CrossRef]
- Zheng, F.; Zhang, X.; Chen, T.; Huang, B.; Xu, J.; Wang, G. Strong transient characteristics in axial flow waterjet pump during rapid starting period with special emphasis on saddle zone. Ocean. Eng. 2023, 269, 113506. [Google Scholar] [CrossRef]
- Ren, Z.; Sun, M.; Zhang, J.; Wang, X.; Huang, Z.; Xu, J.; Huang, C. Start-up strategy of mixed-flow pump system with impulse operation. Ocean. Eng. 2023, 277, 114058. [Google Scholar] [CrossRef]
- Li, K.; Li, W.H. Study on the Acceleration Process of Water-Jet Propulsion Ship. Appl. Mech. Mater. 2013, 263, 756–761. [Google Scholar] [CrossRef]
- Wu, X.-F.; Li, M.-H.; Liu, H.-L.; Tan, M.-G.; Lu, Y.-D. Performance of water-jet pump under acceleration. Int. J. Nav. Archit. Ocean. Eng. 2021, 13, 794–803. [Google Scholar] [CrossRef]
- Chang, H.; Hong, S.; Wang, C.; Peng, G.; Fan, F.; Ye, D. Investigation on the Transient Characteristics of Self-Priming Pumps with Different Hub Radii. Machines 2021, 9, 311. [Google Scholar] [CrossRef]
- Feng, J.; Ge, Z.; Zhang, Y.; Zhu, G.; Wu, G.; Lu, J.; Luo, X. Numerical investigation on characteristics of transient process in centrifugal pumps during power failure. Renew. Energy 2021, 170, 267–276. [Google Scholar] [CrossRef]
- Wang, H.; Hu, Q.; Yang, Y.; Wang, C. Performance differences of electrical submersible pump under variable speed schemes. Int. J. Simul. Model. 2021, 20, 76–86. [Google Scholar] [CrossRef]
- Zuo, Z.; Tan, L.; Shi, W.; Chen, C.; Ye, J.; Francis, E.M. Transient Characteristic Analysis of Variable Frequency Speed Regulation of Axial Flow Pump. Sustainability 2022, 14, 11143. [Google Scholar] [CrossRef]
- Han, W.; Zhang, T.; Su, Y.L.; Chen, R.; Han, Y. Transient Characteristics of Water-Jet Propulsion with a Screw Mixed Pump during the Startup Process. Math. Probl. Eng. 2020, 2020, 5691632. [Google Scholar] [CrossRef]
- Constantinescu, G. Rough Wall Flow Using k − ω Turbulence Model in FLUENT. Am. Soc. Civ. Eng. 2012. [Google Scholar] [CrossRef]
- Wu, Q.; Huang, B.; Wang, G.; Cao, S.; Zhu, M. Numerical modelling of unsteady cavitation and induced noise around a marine propeller. Ocean. Eng. 2018, 160, 143–155. [Google Scholar] [CrossRef]
- Fuyi, Z.; Hang, L.; Tairan, C.; Qin, W.; Biao, H.; Guoyu, W. Transient Characteristics of Start-up Process of an Axial Flow Water-jet Propeller. Acta Armamentarii 2021, 42, 1592. [Google Scholar]


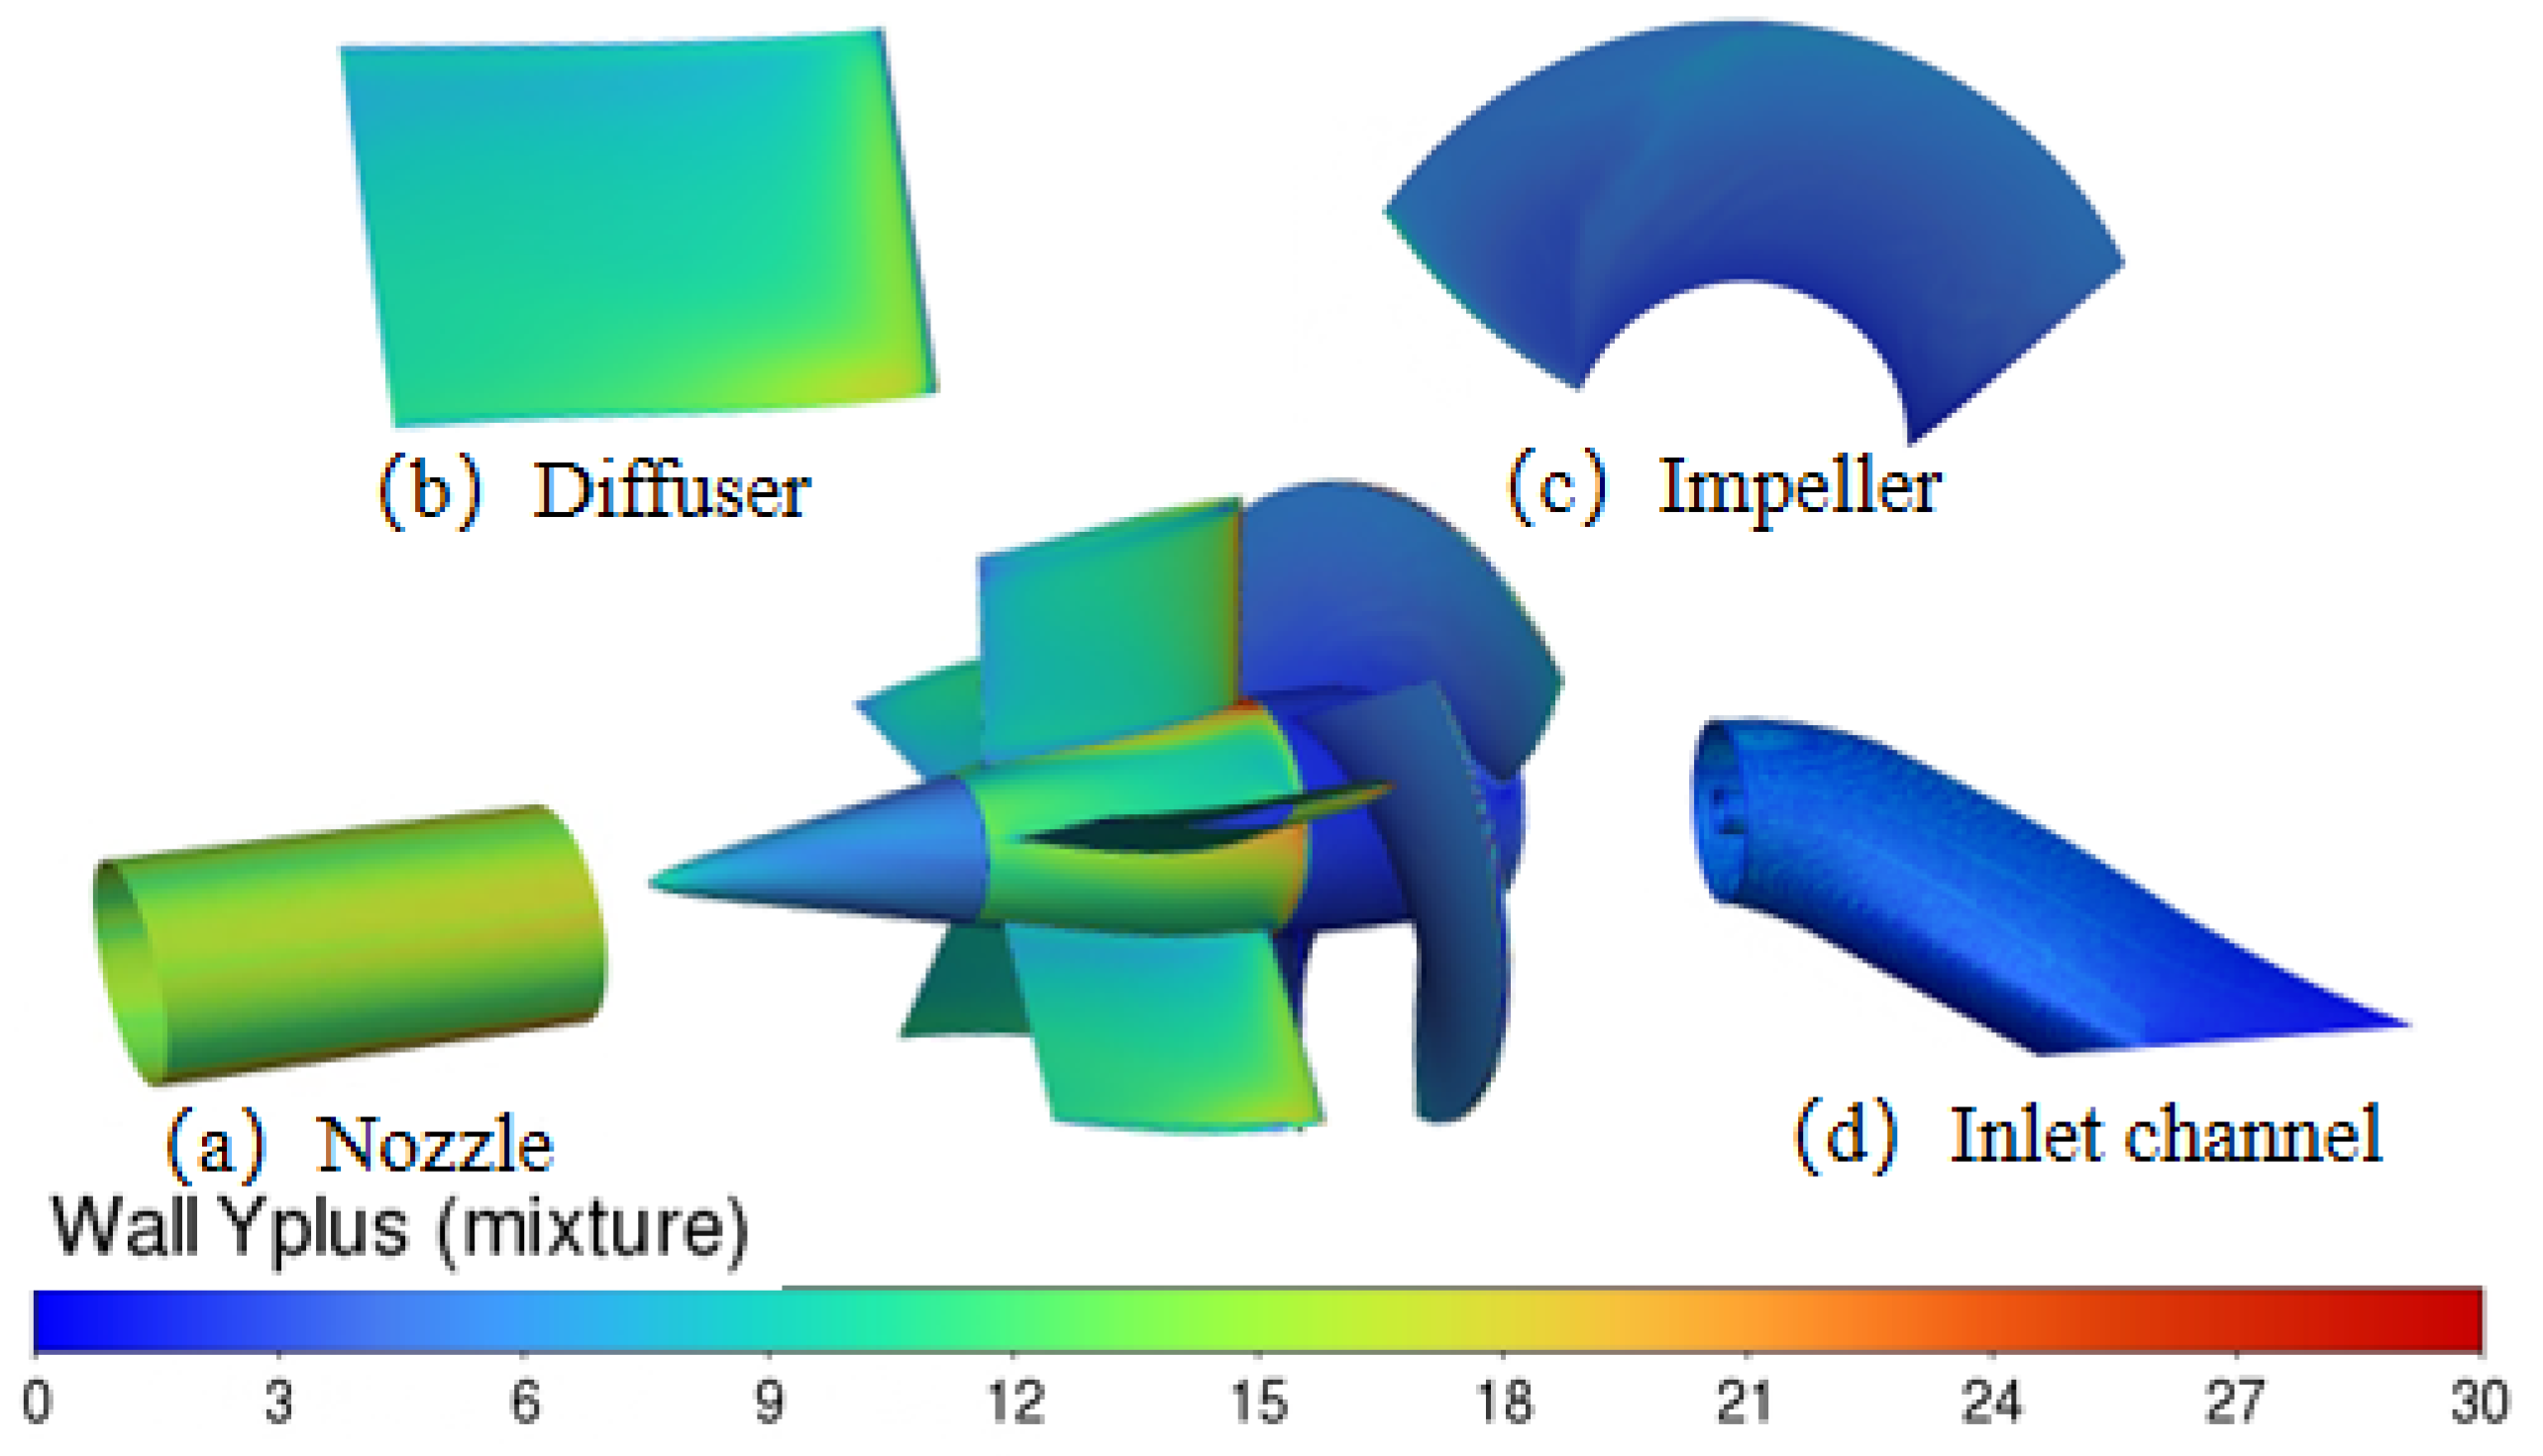
| Hydraulic Components | Maximum Value | Average Value |
|---|---|---|
| Impeller | 12.4 | 7.3 |
| Diffuser | 21 | 12.8 |
| Inlet channel | 9.7 | 5.2 |
| Straight pipe nozzle | 24.3 | 14.6 |
| n (r/min) | Start-Up Process | Acceleration Process | ||||
|---|---|---|---|---|---|---|
| t = 1 s | t = 2 s | t = 3 s | t = 0.5 s | t = 1 s | t = 1.5 s | |
| 3000 |  |  |  |  |  |  |
| 3600 |  |  |  |  |  |  |
| 4200 |  |  |  |  |  |  |
| 4800 |  | 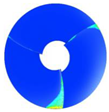 |  |  |  |  |
| 5400 |  |  |  |  | 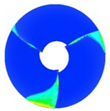 | 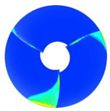 |
| 6000 | 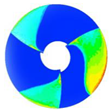 |  | 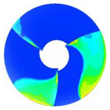 | 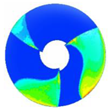 | 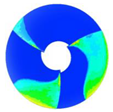 |  |
 | ||||||
Disclaimer/Publisher’s Note: The statements, opinions and data contained in all publications are solely those of the individual author(s) and contributor(s) and not of MDPI and/or the editor(s). MDPI and/or the editor(s) disclaim responsibility for any injury to people or property resulting from any ideas, methods, instructions or products referred to in the content. |
© 2023 by the authors. Licensee MDPI, Basel, Switzerland. This article is an open access article distributed under the terms and conditions of the Creative Commons Attribution (CC BY) license (https://creativecommons.org/licenses/by/4.0/).
Share and Cite
Zhu, R.; Shi, W.; Gan, G.; Li, H.; Yang, D.; Duan, Y.; Fu, Q. Transient Hydrodynamic Characteristics of a High-Speed Axial Flow Water-Jet Pump during Variable Speed Process. J. Mar. Sci. Eng. 2023, 11, 1965. https://doi.org/10.3390/jmse11101965
Zhu R, Shi W, Gan G, Li H, Yang D, Duan Y, Fu Q. Transient Hydrodynamic Characteristics of a High-Speed Axial Flow Water-Jet Pump during Variable Speed Process. Journal of Marine Science and Engineering. 2023; 11(10):1965. https://doi.org/10.3390/jmse11101965
Chicago/Turabian StyleZhu, Rongsheng, Wenhao Shi, Gongchang Gan, Huairui Li, Dawei Yang, Yuchen Duan, and Qiang Fu. 2023. "Transient Hydrodynamic Characteristics of a High-Speed Axial Flow Water-Jet Pump during Variable Speed Process" Journal of Marine Science and Engineering 11, no. 10: 1965. https://doi.org/10.3390/jmse11101965
APA StyleZhu, R., Shi, W., Gan, G., Li, H., Yang, D., Duan, Y., & Fu, Q. (2023). Transient Hydrodynamic Characteristics of a High-Speed Axial Flow Water-Jet Pump during Variable Speed Process. Journal of Marine Science and Engineering, 11(10), 1965. https://doi.org/10.3390/jmse11101965