1. Introduction
1.1. Background
With the advancement of intelligent shipping, traditional maritime supervision systems such as ship automatic identification systems, ship traffic management systems, very high frequency (VHF) wireless, and ship video supervision systems have become inadequate to meet the requirements of intelligent supervision. These systems are unable to achieve the safety supervision purpose of wide area coverage, intelligent decision-making, and rapid response [
1,
2]. In particular, with regard to ship violations, on-site boarding is still necessary for inspection. The current practice of comparing the automatic identification system (AIS) dynamic information of the inspected ship with the AIS information on the maritime supervision platform through manual identification, to identify the ship as abnormal or violating if it does not match, is time-consuming and inefficient for timely and accurate maritime supervision [
3,
4]. Moreover, challenges such as irregular and renamed ship names, diverse configurations of ship AIS equipment, multiple ships with one nine-digit code or one ship with multiple nine-digit codes [
5,
6], and irregular encoding of ship nine-digit code information also present significant obstacles to the precise detection of ship violations [
7,
8].
Currently, research on identifying ship’s illegal behaviors primarily focuses on ship traffic management. Liu and Tian [
9] introduced a traditional method for analyzing and discriminating AIS ship data to identify illegal coding problems of ship AIS equipment, with a single recognition target and low performance. Rong et al. [
10] proposed a new method for automatically identifying ship collision avoidance behavior from ship trajectories using AIS trajectory data, and the data source is relatively small and fails to consider more comprehensive factors, resulting in insufficient reliability and accuracy of identification [
11]. Kaluza et al. [
12] elaborated on the attribute characteristics of key ship data in maritime data according to different ship uses and stowage methods, focused on the data attributes themselves and failed to attempt to explore the association relationships between attributes. Veenstra et al. [
13] proposed a framework for port sensing and computing based on maritime big data. While this method uses multi-source data, such as ship GPS tracks, ship attributes, port geographic information, and port facility parameters to construct maritime big data, it still relies on system-level data analysis. Acharya et al. [
14] used spatial clustering to identify accident-prone areas, analyze the causes of accidents, and develop risk prevention and control strategies based on maritime accident data, but did not consider other dimensions to make comprehensive assessment decisions. Fu et al. [
15] proposed an object-oriented Bayesian network model to quantitatively assess the risk of maritime accident scenarios in ice-covered Arctic waters concerning human and organizational factors. Similarly, Kehrer and Hauser [
16] reviewed visualization for multifaceted scientific data and visual analysis techniques but did not use knowledge graphs as visual objects.
This analysis of the literature shows that the identification of violations in multi-source maritime ship data is predominantly based on the manual matching of information. Research methods for processing before data analysis are also mostly conventional, and the source data used for data analysis are relatively homogeneous, failing to analyze the behavior of ships comprehensively. Most research on maritime mass data focuses on the attribute characteristics that can be directly reflected by the data themselves, failing to explore the potential behavior of ships under big data. Although research on ship applications based on maritime data is relatively abundant, the functions are often similar and discrete, leading to issues such as the homogeneity of ship behavior analysis and inconsistency of analysis points. Currently, research on ship multi-source data processing and behavior analysis based on knowledge graph technology is lacking, especially regarding the application research on ship knowledge graph construction, ship violation analysis, and identification for maritime ship data [
17,
18]. Given the rapid development of shipping technology driven by new technologies such as big data, the Internet of Things, and artificial intelligence, the need for intelligent transformation and development of water traffic management and services has become more pressing. It is necessary to conduct in-depth research on the innovative application of maritime data combined with new technologies.
To improve the effectiveness of ship management and services, this study proposes an innovative approach that constructs a ship static and dynamic relationship graph based on multi-source maritime ship static and dynamic data. The study analyzes the correlation relationship between ships, extracts ship behavioral features, and comprehensively reasons and identifies ship violations using these features. The proposed method is validated through a practical case study, which demonstrates the feasibility and effectiveness of the knowledge-graph-based approach for identifying ship violations. This method integrates maritime multi-source data to achieve universal ship knowledge graph modeling. Based on violation behavior rules, graph inference technology is used to efficiently determine ship violations, improving the efficiency of ship behavior judgment, and offering the potential to develop an intelligent decision-making system for maritime traffic management.
1.2. The Definition of Ship Illegal Behavior
The term “ship violations” generally pertains to ship-related behaviors that contravene the stipulations outlined in the Maritime Traffic Safety Law of the People’s Republic of China. These behaviors can include violations of ship and marine facility management orders, crew management orders, navigation, berthing, and operational management orders, dangerous goods carriage safety supervision and management orders, and marine search and rescue management orders, as well as marine traffic accident investigation and handling orders [
4,
19,
20,
21]. The definitions of several illegal behaviors are listed as follows:
Speed violation: a ship sailing at a speed exceeding the prescribed speed, including speeding or not complying with speed restrictions in a specific area;
Improper navigation rules: the failure of a ship to follow the prescribed navigation rules, such as failure to follow the navigation guidelines, or failure to comply with the rules for crossing ships;
Unqualified seaworthiness safety inspection: the ship’s seaworthiness certificate information is incomplete or abnormal, the navigation safety equipment is incomplete or defective, and the ship fails to pass the maritime ship safety inspection, and is deemed unseaworthy;
Violation of maritime management requirements: the failure of a ship to comply with maritime safety management requirements during navigation, such as ship misregistration, AIS closure, failure to report port, failure to maintain appropriate ship spacing, failure to comply with navigation signs and signals, and failure to take appropriate collision prevention measures;
Improper use of communication and navigation equipment: the failure or incorrect use of communication and navigation equipment by ships during navigation, such as navigation radio communication and navigation equipment, satellite communication and navigation equipment, radar, or GPS.
This article, however, focuses specifically on the issue of fake ship license plates, which constitute a breach of navigation, berthing, and operational management orders [
22,
23]. Utilizing a fake license plate involves the unlawful use of the same ship name and number belonging to another or the use of a canceled ship name and number painted on a new, renewed, modified, or purchased ship without approval. These fake ship license plates are used under the guise of legitimacy with the intent of deceiving others. To counter this problem, the Ministry of Transport and Communications has been actively working to combat the use of fake ship license plates. In line with this, the maritime department has been exerting significant pressure to suppress illegal acts of licensing of ships.
2. Method
2.1. Framework
This research focuses on the data object associated with maritime ships, encompassing both static and dynamic data. The research process involves three key aspects: stage 1 pertains to processing ship data, while stage 2 involves the construction of a knowledge graph model related to ships. Finally, stage 3 centers on the application of the ship knowledge graph, as shown in
Figure 1. The research process can be distilled into three main stages:
Stage 1: Data and processing. Ship data processing is necessary due to the heterogeneity of data from multiple sources and issues such as redundancy, anomalies, irregularities, and other paradigmatic problems. Data pre-processing techniques including data de-duplication, data noise reduction [
24], data supplementation, data fusion, and other methods are utilized to address these challenges;
Stage 2: Ship knowledge graph modeling (takes center stage). This involves using knowledge graph technology and the maritime supervision business model to establish ship graph semantic rules and achieve the semanticization of the ship data graph [
25,
26]. Entity extraction and relationship extraction methods are employed to transform triadic data structures [
27]. At the same time, knowledge fusion and denotation disambiguation techniques are utilized to complete the construction of the ship static graph [
28]. The construction method of the ship knowledge graph in this study has significant innovative advantages in understanding actual business rules, integrating professional knowledge in the field, automating data updates, and providing powerful query interfaces. It better meets actual business needs, improves reliability and operability. Subsequently, based on AIS data and the definition of ship violations, calculations are made for ship violation features such as monitoring key ships, expired ship certificates, inconsistent ship tracks with reported ports, multiple ship tracks, and ships that do not report ports for extended periods [
29]. These calculated violation features, in combination with the ship name graph identified through on-site inspections, are used to infer ship licensing violations, ultimately leading to the creation of a complete ship knowledge graph that integrates both dynamic and static data [
30,
31];
Stage 3: The application and validation of the ship knowledge graph. Using fused regional ship static and dynamic graphs, E-chart technology is used to conduct graph analysis and display ship violations [
32]. The feasibility of the method is then verified by combining it with actual cases.
2.2. Data and Processing
2.2.1. Data Origin
This study area mainly focuses on the identification of illegal behaviors of fake ship license plates based on the ship’s knowledge graph. The main task is to study the construction of the ship’s knowledge graph and identify the fake ship license plate behaviors. The primary data involved are the static data of ships in maritime management and the dynamic business data of maritime supervision. The dataset includes basic ship information, ship company information, key tracking ship information, ship nationality certificates, ship entry and exit reports, ship violation inspection data, and ship AIS information [
33,
34,
35], as shown in
Table 1.
Basic ship information comprises essential ship data such as ship number, Chinese and English names of the ship, Maritime Mobile Service Identify (MMSI), nationality, ship type, and initial registration number [
36]. The main issues with these data are data redundancy, data noise, and data being missing;
Ship company information encompasses the shipowner’s company serial number, Chinese and English names of the company, legal representative, and contact telephone number, among other details. These data mainly have data ambiguity issues;
Key tracking ship information includes tracking number, ship registration number, Chinese and English ship names, port of registry, MMSI, tracking reason code, tracking reason name, and date of creation, among others. These data mainly have data redundancy and missing data;
Ship nationality certificate data includes ship registration number, Chinese name of the ship, MMSI, owner of the ship, contact number, starting validity period, expiry date of the certificate, registration authority, and certificate printing number, among other key details. The main issue with these data is missing data;
Ship entry and exit report data is comprised of ship identification number, ship registration number, Chinese and English ship names, MMSI, ship type, gross tonnage, net tonnage, gross engine power, passenger capacity, overall ship length, beam, depth, ship owner, port name, port number, type of port of entry/exit, name of next port, reporting time, berthing code, berth of call, actual cargo volume, local port unloading/loading volume, actual dangerous goods volume, local port unloading/loading dangerous goods volume, actual passenger volume, local port drop-off/pick-up volume, actual vehicle volume, local port unloading/loading vehicle volume, number of barges, local port unloading/loading barges, actual container volume, local port unloading/loading container volume, and other relevant information. The main issue with these data is data noise;
Ship violation inspection information comprises data such as the supervision and inspection number, inspection content code, inspection content, inspection results, violations or problems found, and description of violations or problems. The main issues with these data include missing data and data ambiguity;
Ship AIS information includes MMSI, Chinese and English ship names, heading, course, speed, longitude, latitude, draft, received time, and other relevant data points. The main issues with these data include data noise and missing data.
Duplicate ship names and MMSI mainly characterize the problem of duplicate and redundant maritime ship data. The problem of ship data noise includes attribute data noise and spatial data noise. Attribute noise mainly refers to the problem of unclear data features caused by the complexity of field design. In contrast, spatial data noise mainly refers to the problem of data features not being displayed and data spatial anomalies caused by large amounts of data. The problem of missing ship data mainly includes features such as MMSI and trajectory being missing. The ambiguity problem of ship data is mainly caused by inconsistent information such as the ship’s ownership company, ship contact person, and communication address. Based on the knowledge graph of ships, identifying illegal behavior of ship deck rigging may pose a threat to the safety of ships and may also pose a threat to the safety of crew members. The behavior judgment process requires collecting and processing a large amount of ship and crew information, which may involve personal privacy and require measures to protect it.
2.2.2. Data Processing
Ship data pre-processing is a key step for accurate and efficient data mapping transformation, analysis, and application. The principle of data processing starts with removing abnormal data and updating supplementary data as much as possible. The pre-processing methods used include data de-duplication, data noise reduction, data filling, and data fusion, as shown in
Figure 2. The following are specific descriptions of these steps.
Step 1: Data de-duplication. For the problem of duplicate redundancy of maritime ship data, data cleaning is carried out by data query and regular matching methods, including redundancy processing by using MMSI and ship name segment and redundancy processing by ship registration number and ship name segment to ensure that ship data can be uniquely identified;
Step 2: Data noise reduction. For the ship data noise problem, the data normalization method is used for standardized field template design and field screening, and in principle, information such as primary key, Chinese name, English name, type, and content is retained, and attribute field information is simplified; for the ship spatial data noise problem, the Douglas–Peuker (DP) method is used for the abnormal ship spatial trajectory extraction thinning to simplify the ship spatial field information to achieve the purpose of clearer data. The DP algorithm is used to determine the key waypoints of the ship’s trajectory [
35]. These key waypoints can be used to represent the geographical locations where the ship changes course.
Figure 3 and
Table 2 show the steps of the DP algorithm. Step 1 can be used to generate an approximated line segment between the departure and destination points. Steps (2, 3, …,
n) introduce sub-line segments using various threshold parameters ε [
23].
The steps of the DP algorithm (the black line represents the original ship trajectory centerline, and the red line represents the simplified ship trajectory. The idea of the simplified ship trajectory centerline is to approximate the original trajectory in green).
Step 3: Data filling. For the problem of missing ship data, the same kind of cubic spline function interpolation, K-mean clustering, and mean value method [
23] are used to estimate and fill the missing data. Making full use of the third-party complete ship data, adopting the method of data interface synchronization, and completing the data filling of MMSI, ship name, ship type, etc., based on the third-party data interface, and completing the filling of spatial information such as port and ship trajectory based on the open GIS data interface make ship data more complete. Data filling effectively improves the integrity of ship data, improves the accuracy of ship data analysis and ship knowledge graph modeling, enhances the distribution characteristics of ship data, and improves the efficiency of ship data analysis and processing. The cultivation process fully considers the nature of ship data and the types of missing values, and combines the goal of building a ship knowledge graph to ensure that the filling process does not introduce noise or deviation;
Step 4: Data fusion. In response to the problem of ship data ambiguity, we adopted data replacement and splicing fusion methods, such as splicing and fusing multiple contact fields to form more accurate contact descriptions, so as to eliminate the heterogeneity between data and improve data integrity and reliability.
2.3. Knowledge Graph for the Identification of Ship Illegal Behaviors
The process of constructing a knowledge graph for the domain of ships typically involves several interrelated steps. These steps typically include the semantic design of the graph, ontology construction, entity linking, graph computation, and inference. Semantic design involves the identification of domain-specific concepts and relationships, which form the backbone of the knowledge graph. This step is essential for ensuring that the knowledge graph accurately reflects the domain of interest and can provide meaningful insights. Ontology construction is the process of creating a formal specification of the concepts and relationships in the domain, typically using a standardized language such as OWL or RDF. This step is crucial for ensuring that the knowledge graph is structured in a way that can be easily queried and analyzed. Entity linking involves identifying and linking instances of concepts in the knowledge graph to external sources of information, such as databases or websites. This step can help to enrich the knowledge graph with additional information, and make it more useful for real-world applications. Graph computation is the process of analyzing the structure of the knowledge graph and extracting useful insights or patterns. This step is essential for understanding the relationships between concepts and identifying domain interest areas. Finally, inference is the process of making logical deductions or predictions based on the knowledge graph, using techniques such as rule-based reasoning or machine learning. This step can help to uncover new insights and generate hypotheses for further investigation.
A top–down construction method [
37] is used. The top–down construction method is a widely used approach to knowledge graph construction, which involves starting with a high-level view of the domain and then refining the details and relationships over time. This method helps to ensure that the knowledge graph is accurate, consistent, and reflects the most important concepts and relationships in the domain.
2.3.1. Step 5: Semantic Design
To construct a ship knowledge graph business model, under the process of
Section 2.2, a Mysql [
38], ship relational database, is utilized for field extraction after a thorough understanding of ship maritime supervision and navigation security business, as shown in
Figure 4.
The model encompasses the ship company, ship type, ship history changes, ship certificates, ship key tracking and reasons for tracking, and ship dynamics port call. The relationships between business models are integrated with actual maritime business logic. Semanticized rule descriptions are conducted via entity-relationship-entity ternary semantic definitions to accomplish this. In this approach, nodes represent objects while concepts and edges signify relationships between nodes. The definition of association combinations is established to formulate a ship graph semantic rule that comprehensively describes the entire maritime business.
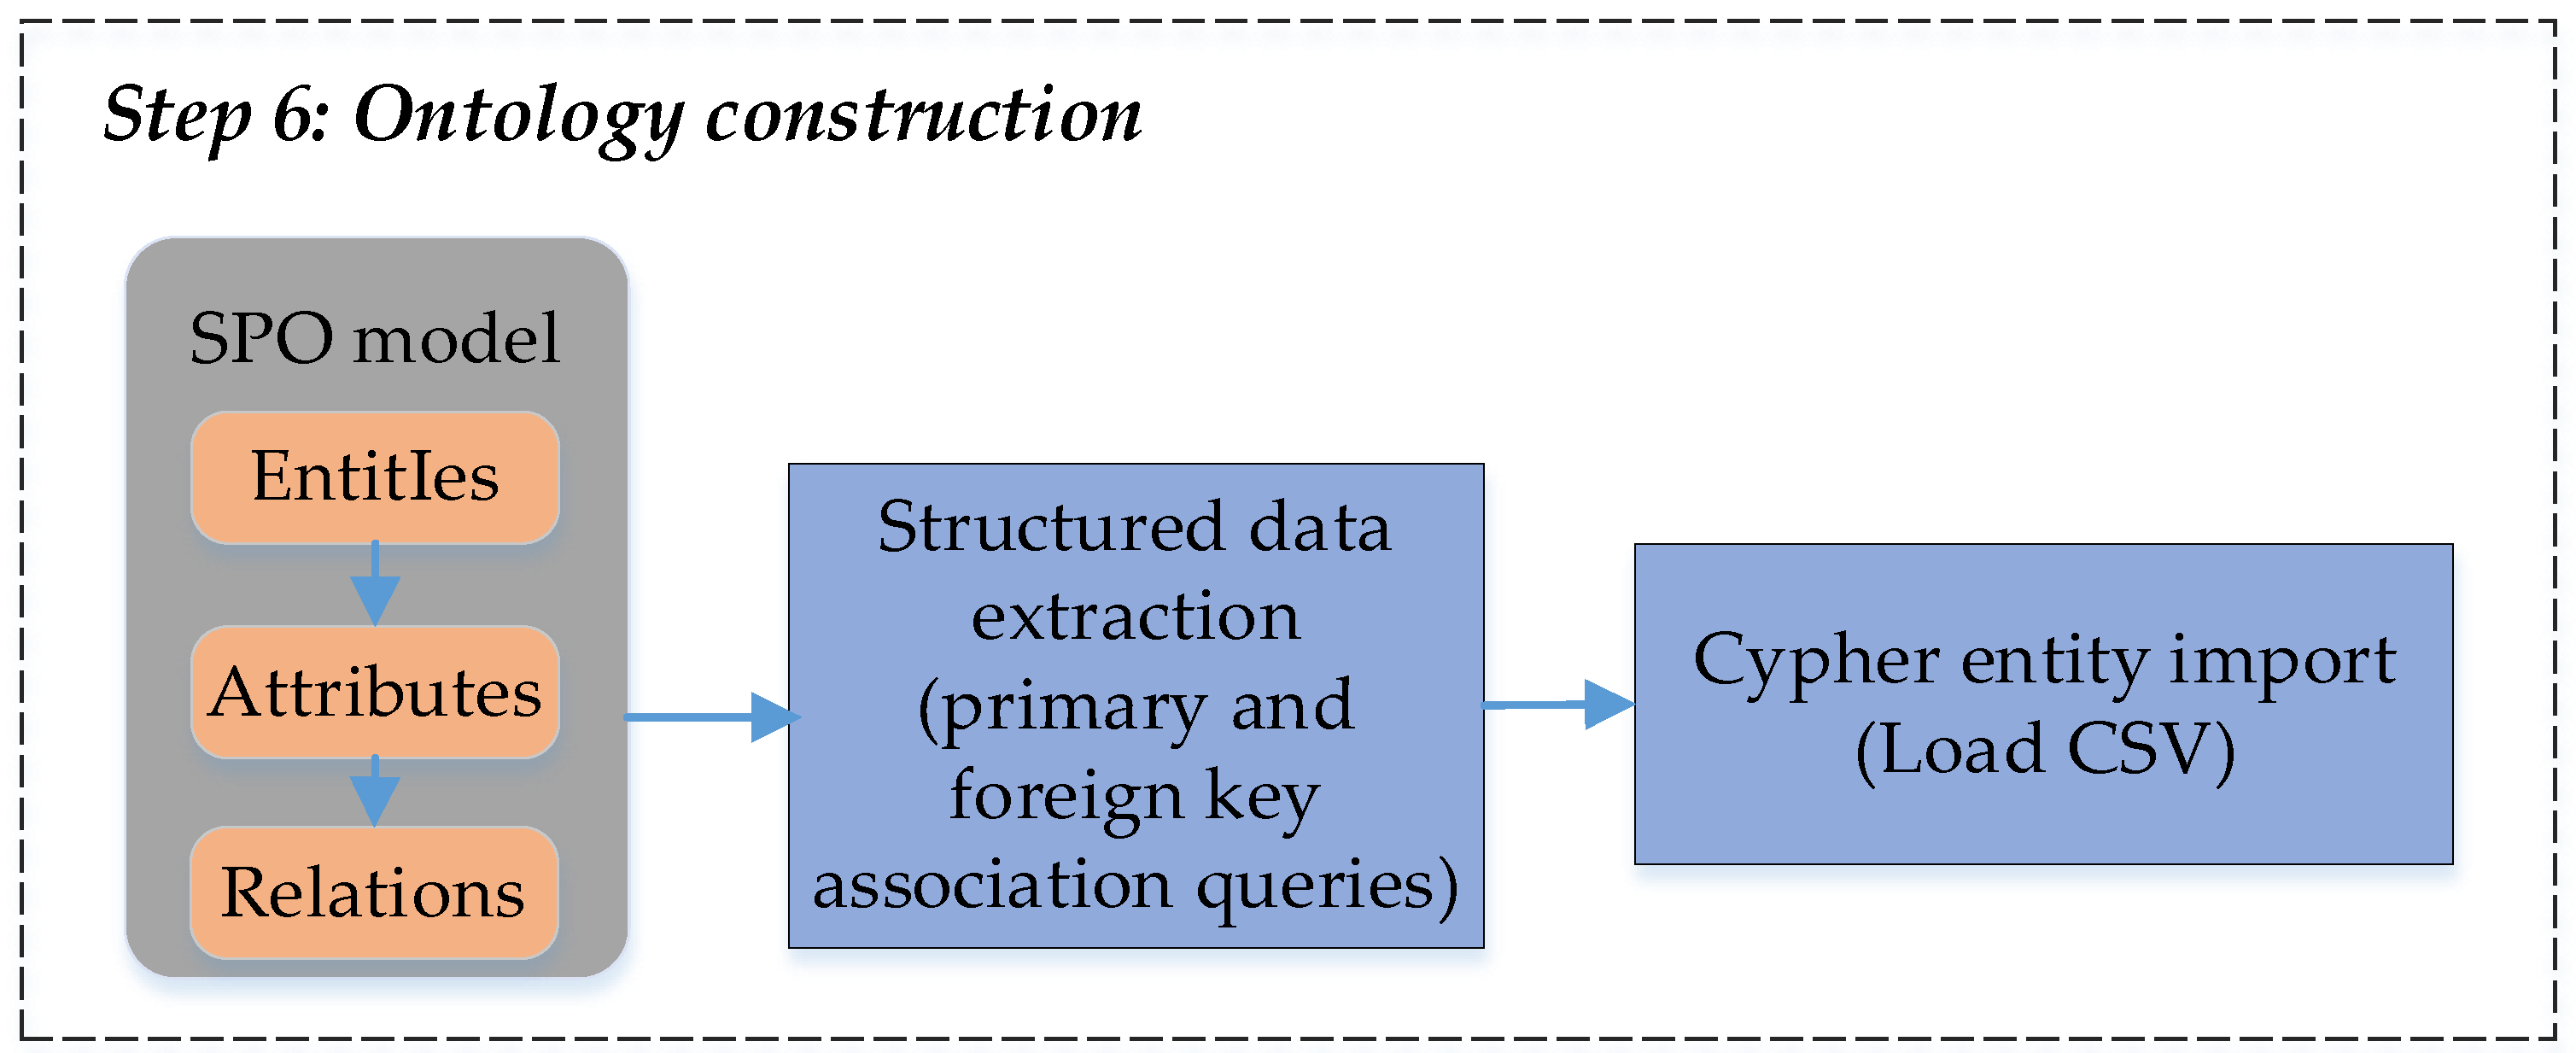
2.3.2. Step 6: Ontology Construction
In order to extract relevant information from the processed ship data, the semantic rules pertaining to entity, attribute, and relationship data are employed. The relationships and events between the entities are established using primary and foreign keys, creating a relational subject–predication–object (SPO) triad. Subsequently, the triadic data are combined and transformed into basic ship graph ontology elements, as shown in
Figure 5.
The primary objective of entity identification and extraction is to identify named entities of various categories, including shipping companies, ships, crew, certificates, key surveillance, ports, berths, dynamic reporting visas, etc. The extraction process entails identifying structured entity-relational data, defining entity boundaries, and determining entity types through Mysql-based primary and foreign key association queries. Following this, semantic rules defined in the previous step are used to extract two or more entities from the relational data and establish matching semantic relationships. The Cypher Load CSV function [
39] is employed within the neo4j graph database to convert the relational SPO ternary data into entity graph data.
2.3.3. Step 7: Entity Linking
In the process of integrating ship data, multiple representations for a single entity often lead to a reduction in the quality of the integrated data, as shown in
Figure 6. This paper proposes a pattern-matching method to address the problem of entity referent disambiguation. The method involves discovering the graph relationships between attributes in different relational data sources and calculating the similarity of related descriptions to match patterns. Entities and relational objects are deleted, replaced, and fused to solve conflicts between predicates in triples, and to ensure the unique integration of heterogeneous data sources. Furthermore, the meaning of ship entities may vary in different contexts, necessitating entity disambiguation. This paper adopts word-sense annotation to model disambiguation. The semantic features introduced in the previous section include semantic class information based on syntactic relations, such as semantic classes of subject/object central words, and semantic role annotation class information. Combining semantic information for contextual semantic discrimination classification can address the problem of diversity in the representation of ship entities.
2.3.4. Step 8: Ship Behavior Feature Extraction
Based on the developed database, a ship behavior feature extraction method is proposed to identify ship behavior feature features, as shown in
Figure 7.
Based on the features, K-means algorithm is used to cluster this feature information of ship trajectory in the case study area [
35]. The mathematical background to this process is displayed in Equations (1)–(4) below and the pseudocode of the process is summarized in
Table 3. For a point
in the way of a trajectory defined as per Equation (1), the locations of the departure and destination ports are defined as in Equation (2). Then, the length of the ship trajectory is calculated as in Equations (3) and (4).
where
and
denote the longitude and latitude of the departure and destination ports, respectively.
denote the distance between
and
(see
Figure 8). This is example 2 of an equation:
Finally, the ship multi-track determination method traces through Mysql relational data and neo4j graph database fusion calculation with the following rules:
- (a)
Define the data set , where each xi represents a point in the ship trajectory;
- (b)
Preprocessing the dataset, e.g., sorting the trajectories in chronological order and representing each point as a triplet of (longitude, latitude, time);
- (c)
Choose the number of clusters k, initialize k prime centers ;
- (d)
For each point xi, calculate its distance dij to each center of mass cj and classify it into the cluster sj to which the center of mass with the closest distance belongs;
- (e)
Update the center of mass, and for each cluster sj, update its center of mass cj to be the average of all its points;
- (f)
Repeating the above steps (d) and (e) until the center of mass no longer changes or reaches the specified number of iterations, obtaining the number of ship multiple trajectories, and finally labeling and refining the ship multiple trajectory feature information into the ship feature graph.
Based on the ship entity (ship number, ship name), extract local subgraphs centering on ship attributes (such as ship name, MMSI, ship type, etc.), key monitoring relationship and certificate expiration relationship, obtain ship attributes, ship key monitoring and ship certificate expiration subgraph features and refine them into the new ship feature graph with specific markings; use Mysql aggregation and correlation query to retrieve ship reporting information. The ship characteristics are extracted and added to the ship characteristics graph by using Mysql aggregation and correlation query to retrieve the ship reporting information; the ship multiple trajectory features and the ship reporting time sequence information are fused, and the inconsistent trajectory and reporting features are inferred and added to the ship characteristics graph.
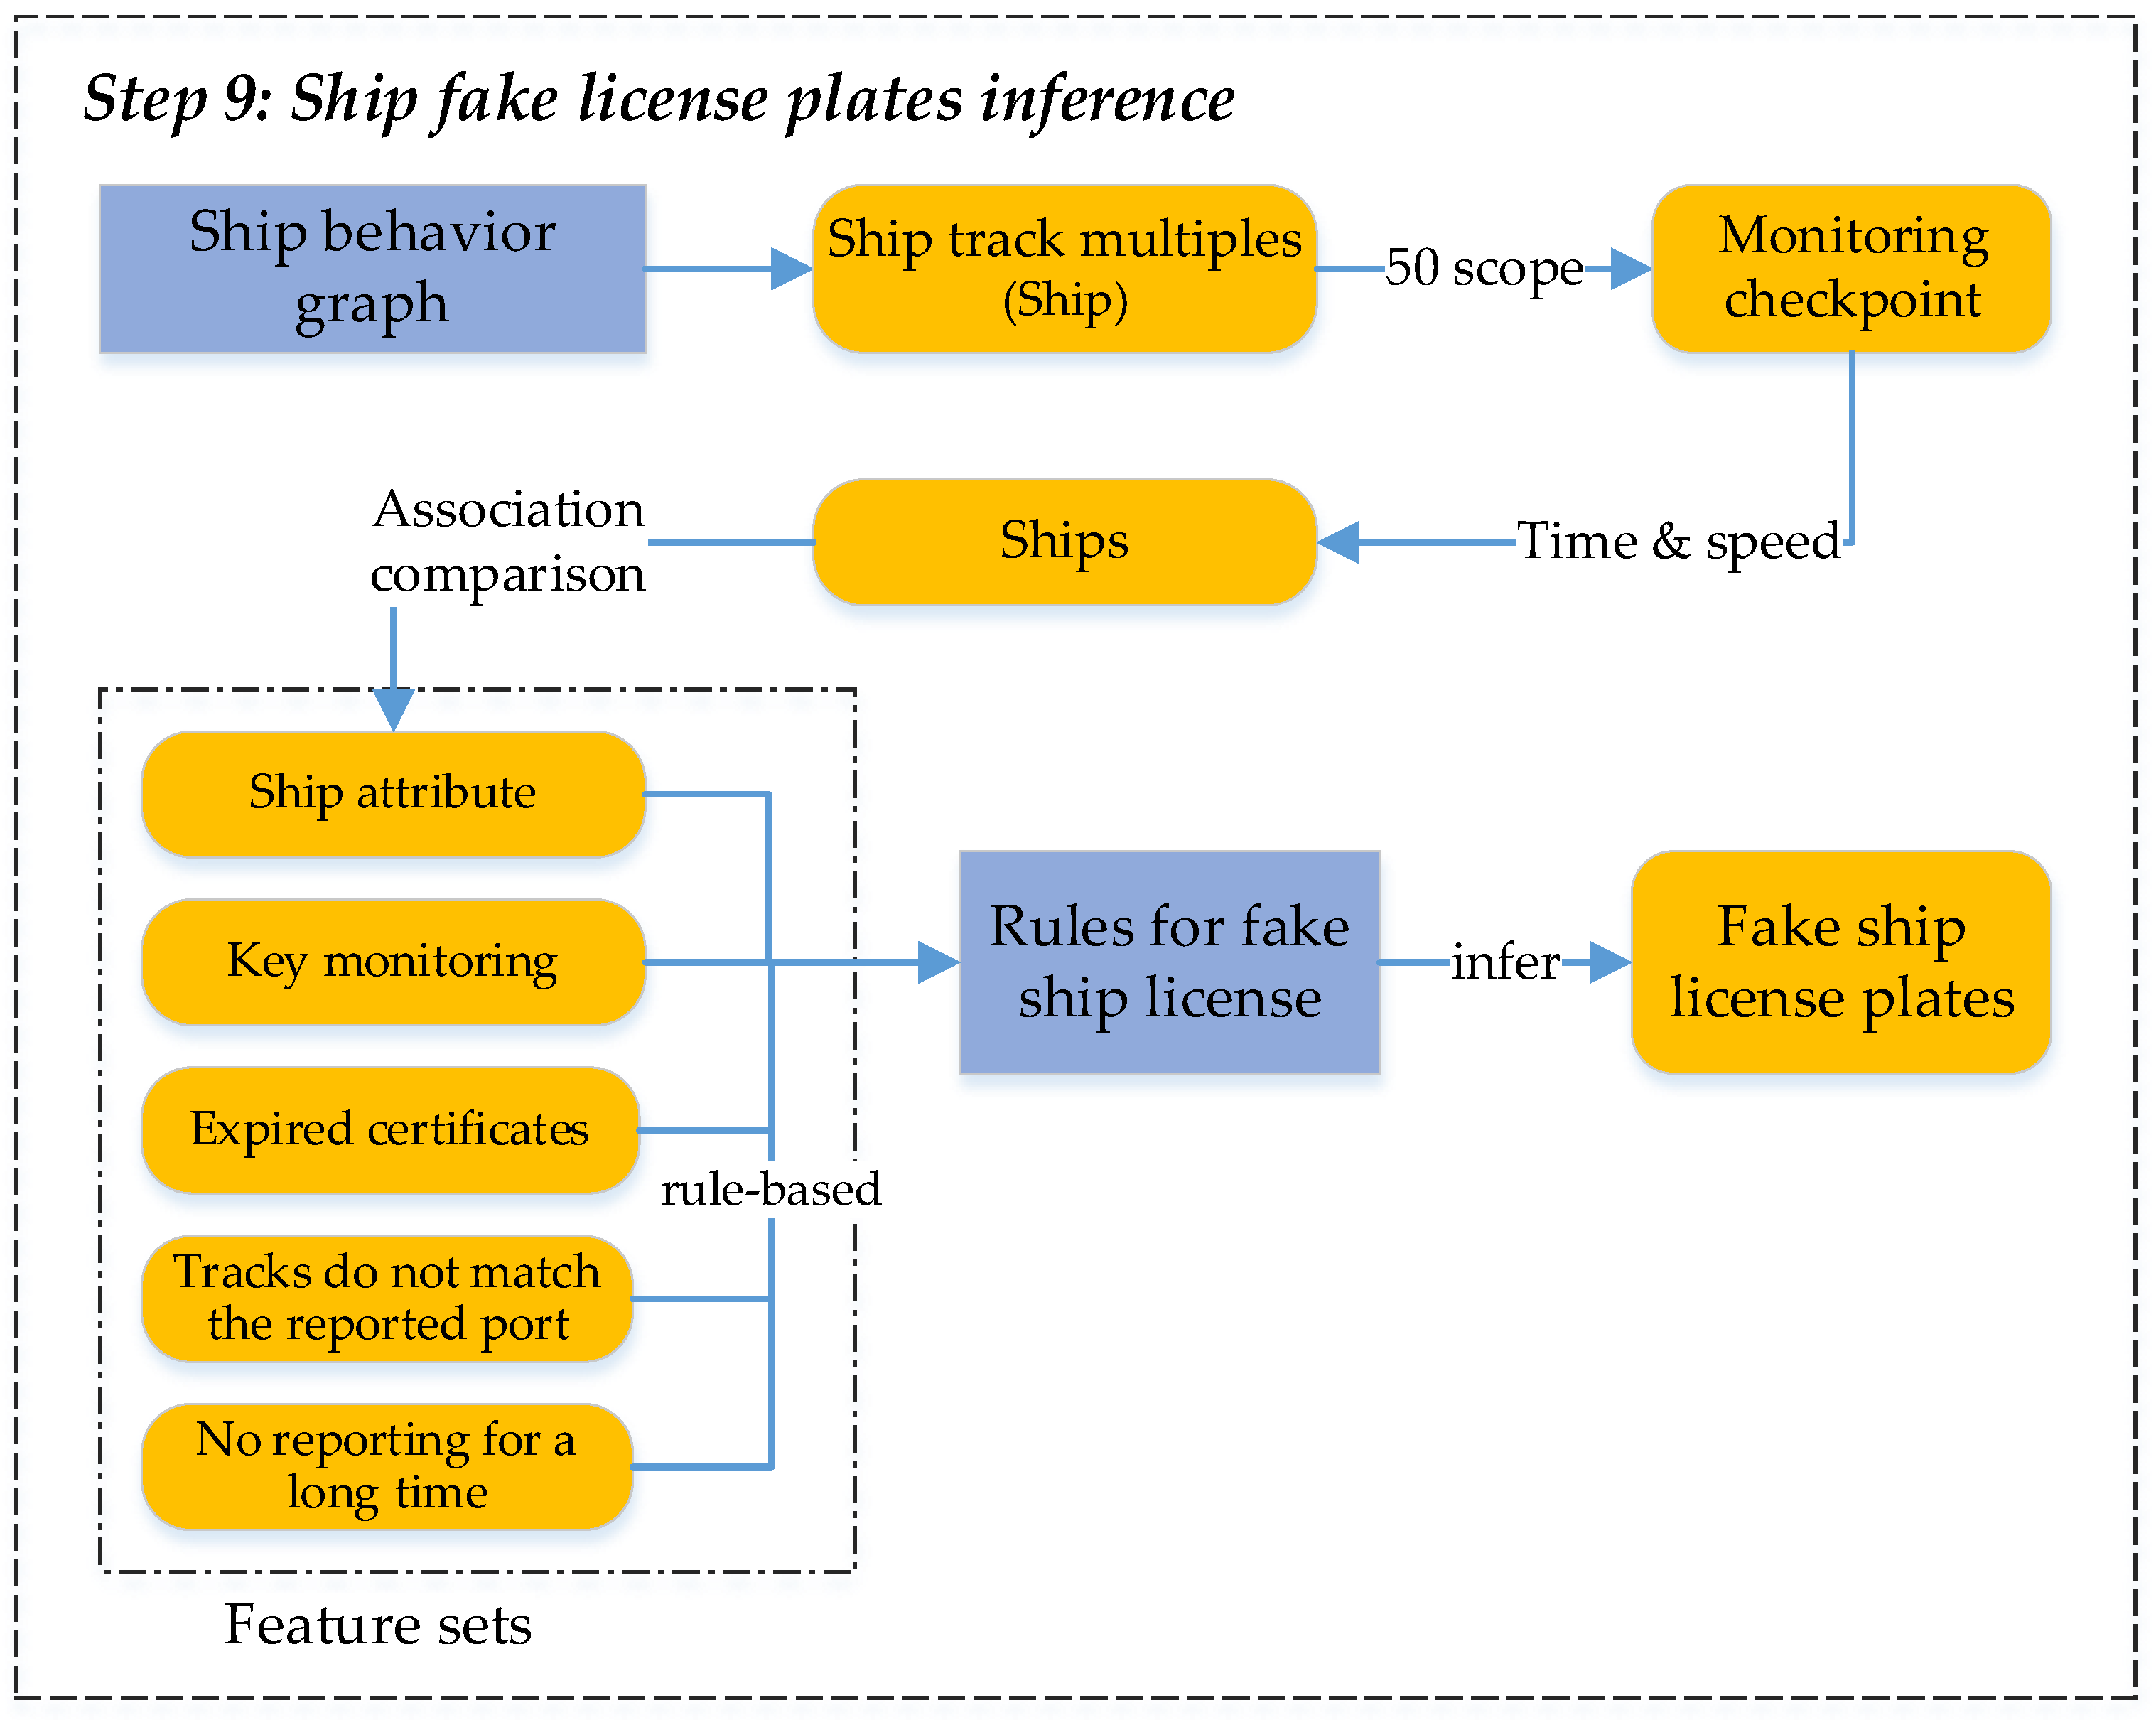
2.3.5. Step 9: Fake Ship License Plates Inference
As shown in
Figure 9, the rules for fake ship license plates can be defined in order of whether the ship is an inland ship, MMSI or ship name information does not match, certificate expiration or invalidity, inconsistent or non-reporting of ports and trajectories, and ship focus monitoring. Using ship knowledge graph feature analysis technology, ship feature vectors can be extracted from ship information from monitoring chokepoints before combining them with feature weights for weighted assignment. The calculation process includes the following four sub-steps:
Step 9-1: Discover the ships that may be snared from the mapping of ship behavior characteristics in the study area, mainly acquiring the ships with multiple trajectories (this ship is usually a sea ship), and extract the abnormal trajectory data of the ship at sea;
Step 9-2: Retrieve the surveillance chokepoints within 50 kn of the surrounding area with this ship as the center. Assume the longitude and latitude of the ship
i (
i = 1, 2, 3) are
and
respectively; the longitude and latitude of the monitoring chokepoint
j (
j = 1, 2, 3) are
loni and
lati, respectively. The distance
Dij between ship
i and monitoring chokepoint
j can be calculated as Equations (5)–(7).
where
R is the radius of the Earth and takes the value of about 6371 km. After finding the distance between any point and the current position, determine whether it is less than or equal to 50 kn (1 kn is about 1.852 km) to obtain the corresponding result;
Step 9-3: Calculate the spatial distance between the multi-track ship and the surveillance chokepoint, calculate the average speed of the ship, combine the two to calculate the time difference, and collect the ship’s information before the time difference of the surveillance chokepoint. The calculation formula of average ship speed is as Equation (8):
Vn denotes the average speed, Vi is the ship sailing speed at each point, and n denotes the total number of points;
Step 9-4: The collected ship information set is correlated and compared with the ship behavior characteristic graph in the current region, and combined with the fake license plate rules, according to the weight order of whether the ship is a river ship, whether the ship information does not match (ship name/MMSI), whether the ship certificate is invalid, whether the ship does not have the reported port record (if so, also judge whether the ship trajectory is inconsistent with the reported port), or whether the ship is a key monitoring, etc. The highest possible ship is finally deduced.
3. Case Study
The semantic rules for ship graph data are constructed with reference to the business rules of maritime supervision and maritime security, and the ternary processed ship ontology data are combined with the semantic rules to form a standard ship graph knowledge representation. A case study was carried out on river–sea direct ships.
3.1. Ship Knowledge Graph Construction
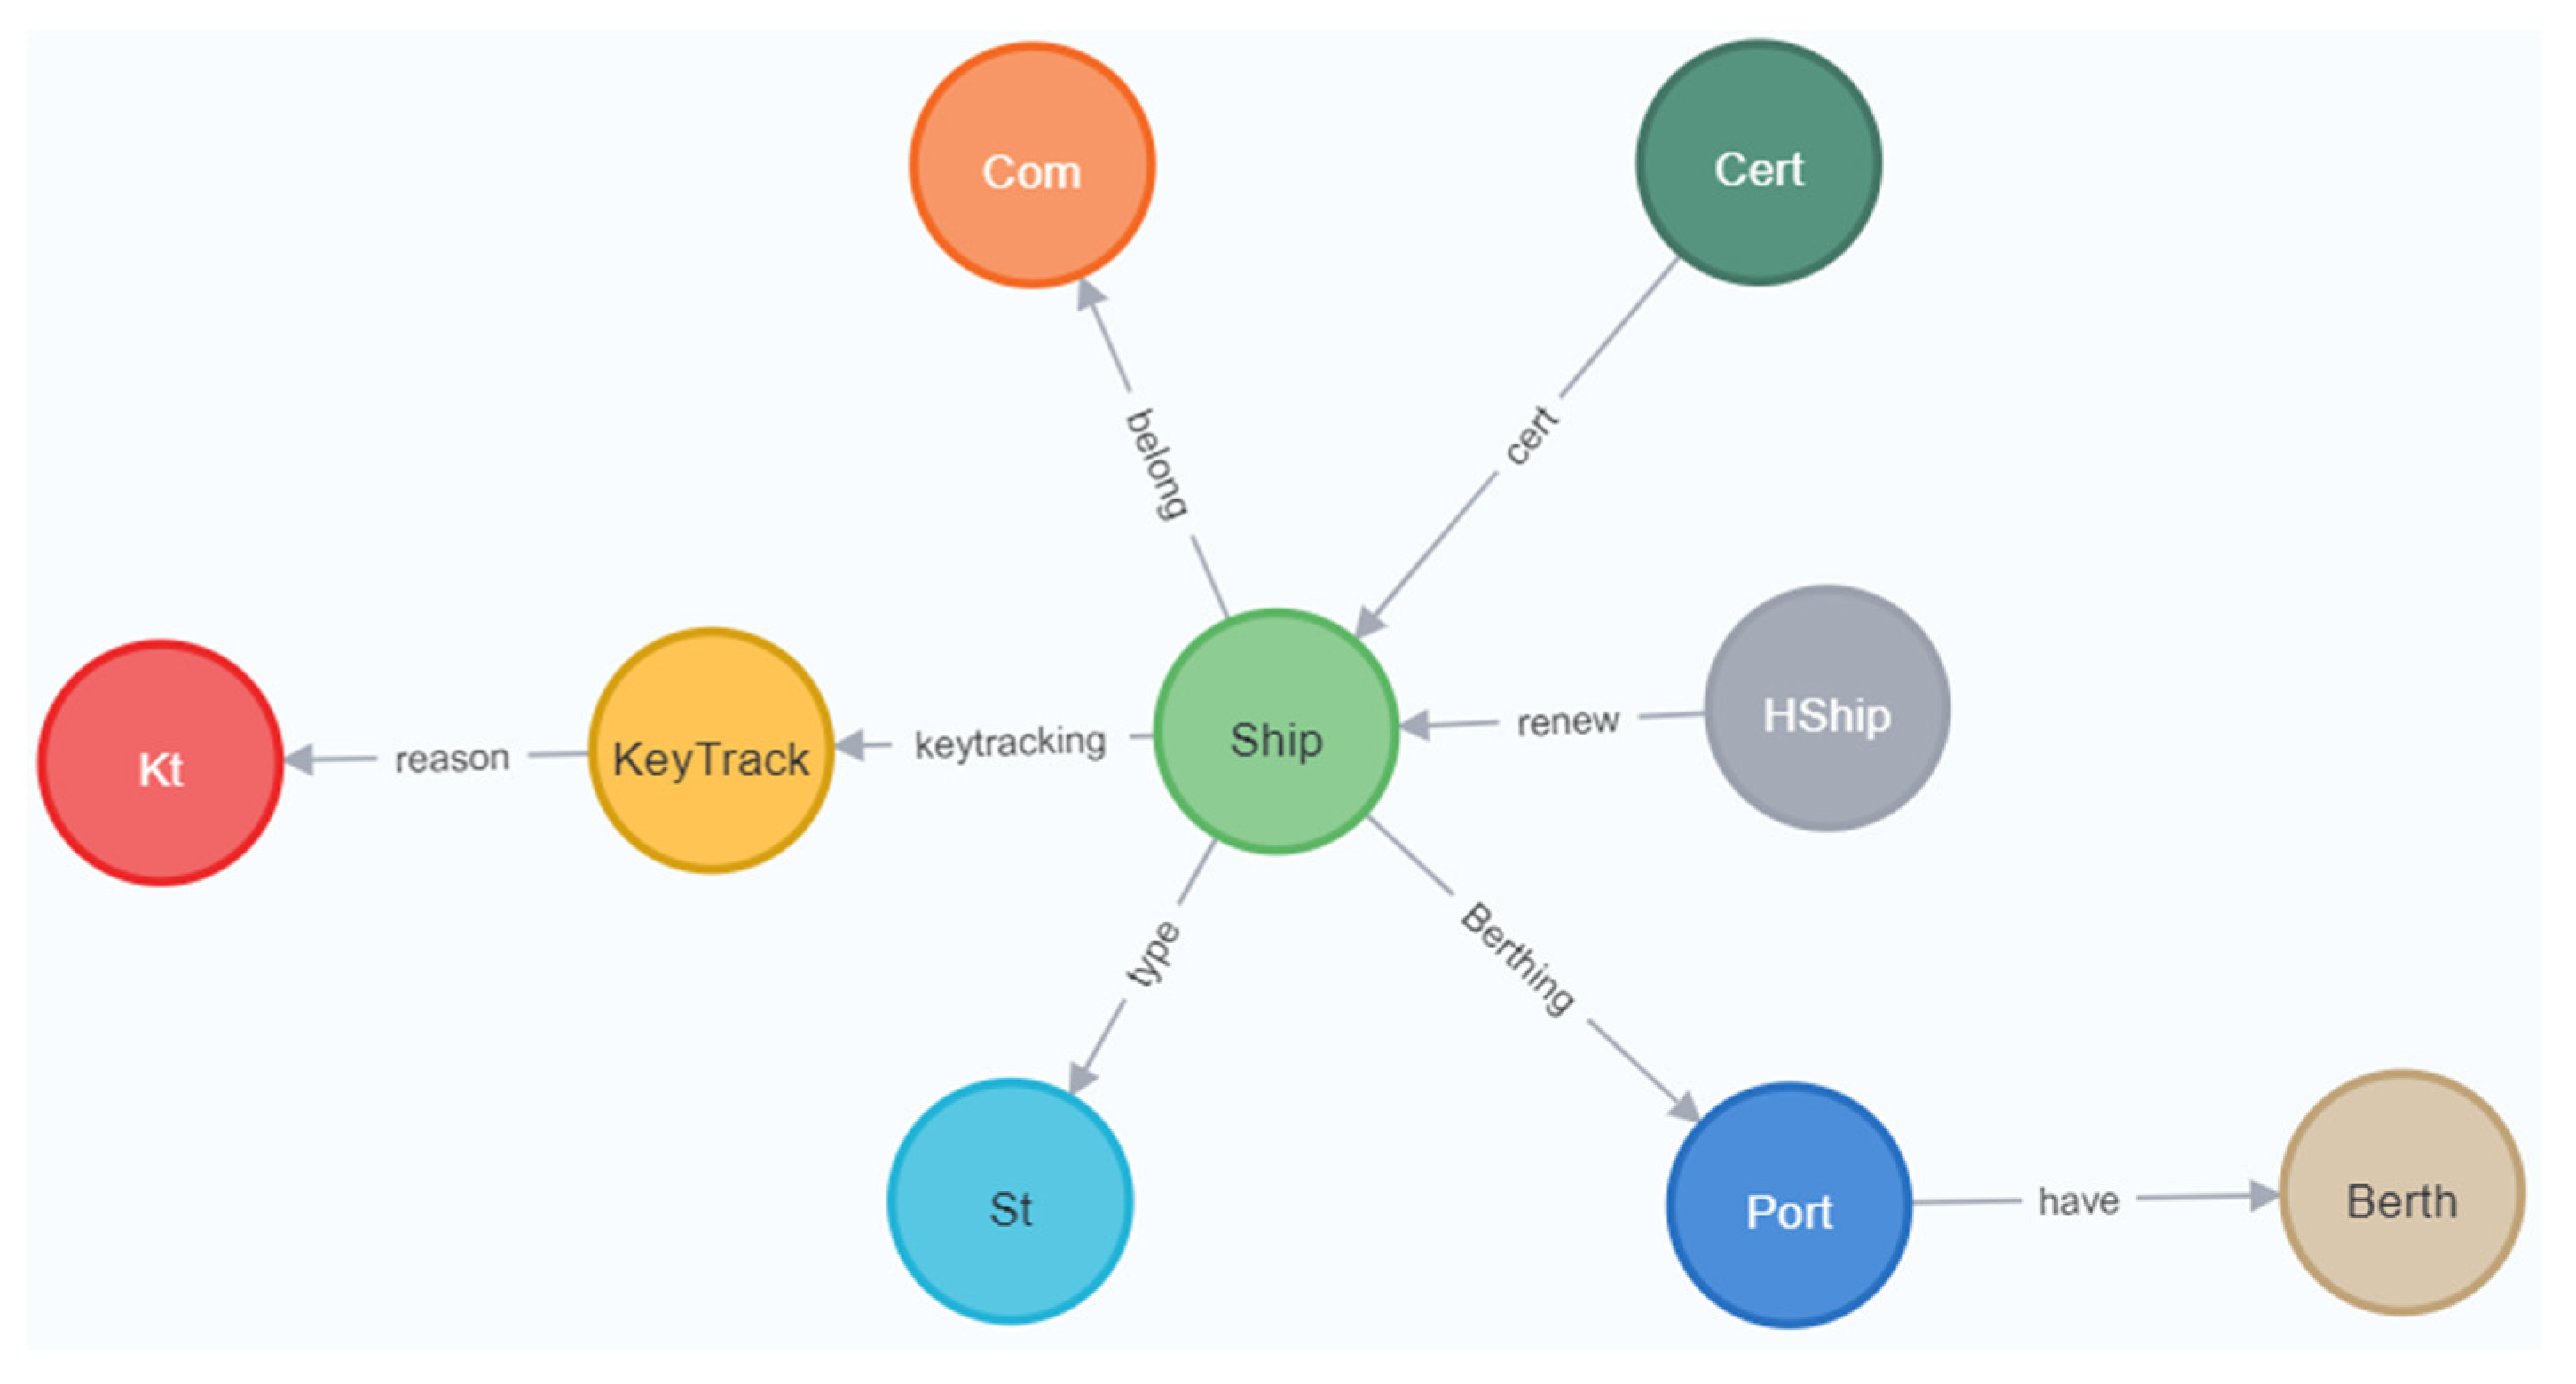
The ontology construction based on the graph semantic rules can form the ship base graph model, which includes the ship’s owner company, ship type, key tracking or not, ship certificate validity, ship port call, etc. After the completion of the ontology construction, the initial prototype of the ship knowledge graph is formed, as shown in
Figure 10.
Ontologies include Ship, Historyship(HShip), Shiptype(St), Company(Com), Cert, Key Track, Key Type(Kt), Port, Berth, etc. Relations include type, renew, cert, belong, keytracking, reason, have, etc.
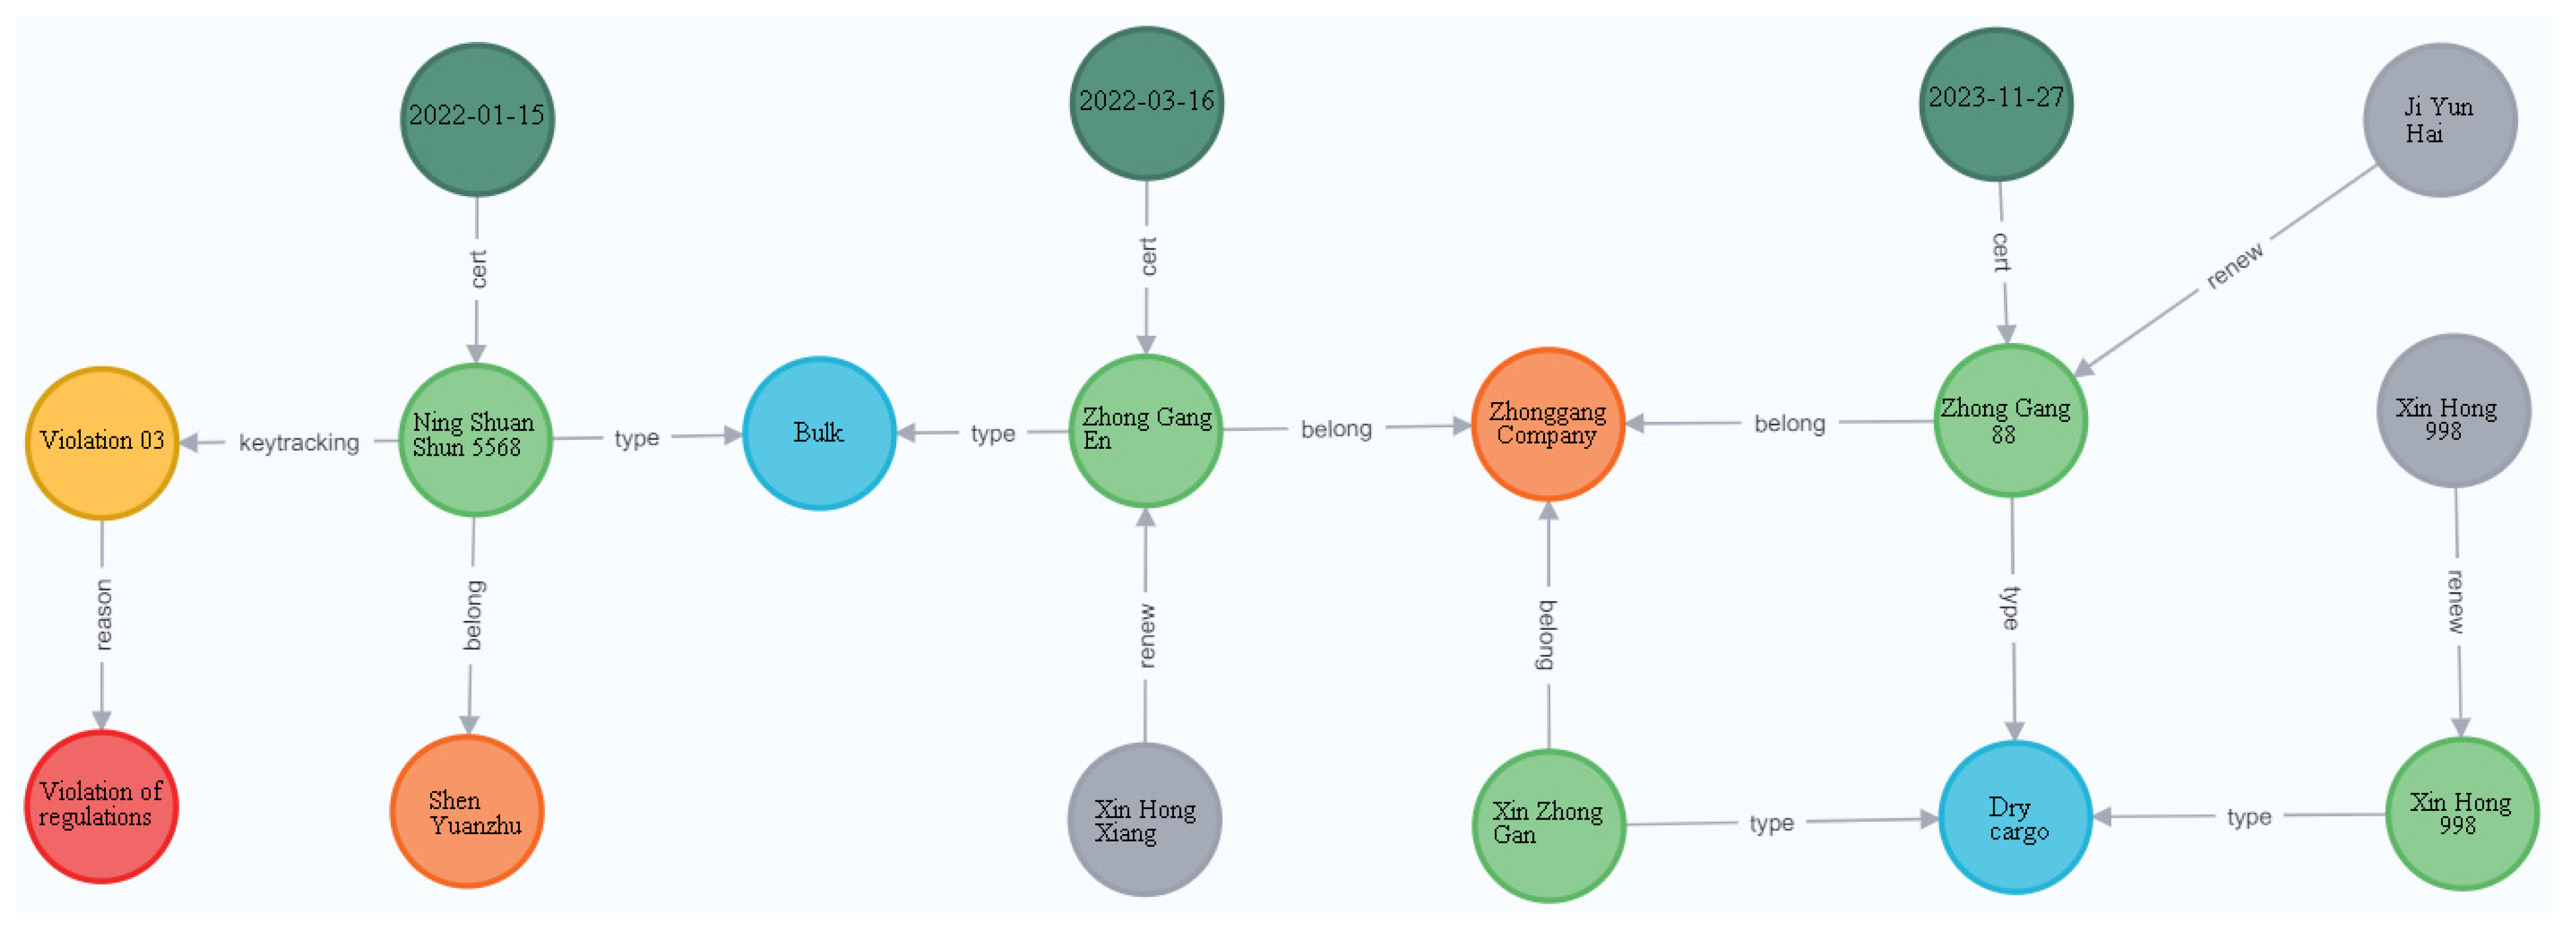
Also included is a description of the category that a ship belongs to by establishing a type of entity link relationship; a description of the ship’s change history by establishing a renewed relationship; the ship certificate information is included by establishing a cert relationship; a description of the ship company that the ship belongs to by establishing a Belong_to relationship; a description of whether a ship is a key tracking ship by establishing a key tracking relationship; a description of the specific reason why a ship is a key tracking ship by establishing a reason relationship. By establishing the relationship to describe the berth information under the port, the corresponding ship relationship graph is shown in
Figure 11.
The ship knowledge graph database established by setting up ship characteristic rules [
40] and combining the ship maritime supervision and navigation protection business model can realize the presentation of the overall relationship network of ships and the ship portrait of the static relationship of specific ships [
34]. Take the ship named “Ning Shuangshun 5568” as an example. By drawing its portrait, we can see that it is a river ship, the type of ship is a bulk carrier, it belongs to the maritime key tracking ship, it has violated regulations in Nanjing and disobeyed the authorities or evaded them, its certificate is valid (valid until 10 January 2021), and it belongs to Shen Yuanzhu, a self-employed person.
3.2. Extraction of Ship Behavior Characteristics Graph
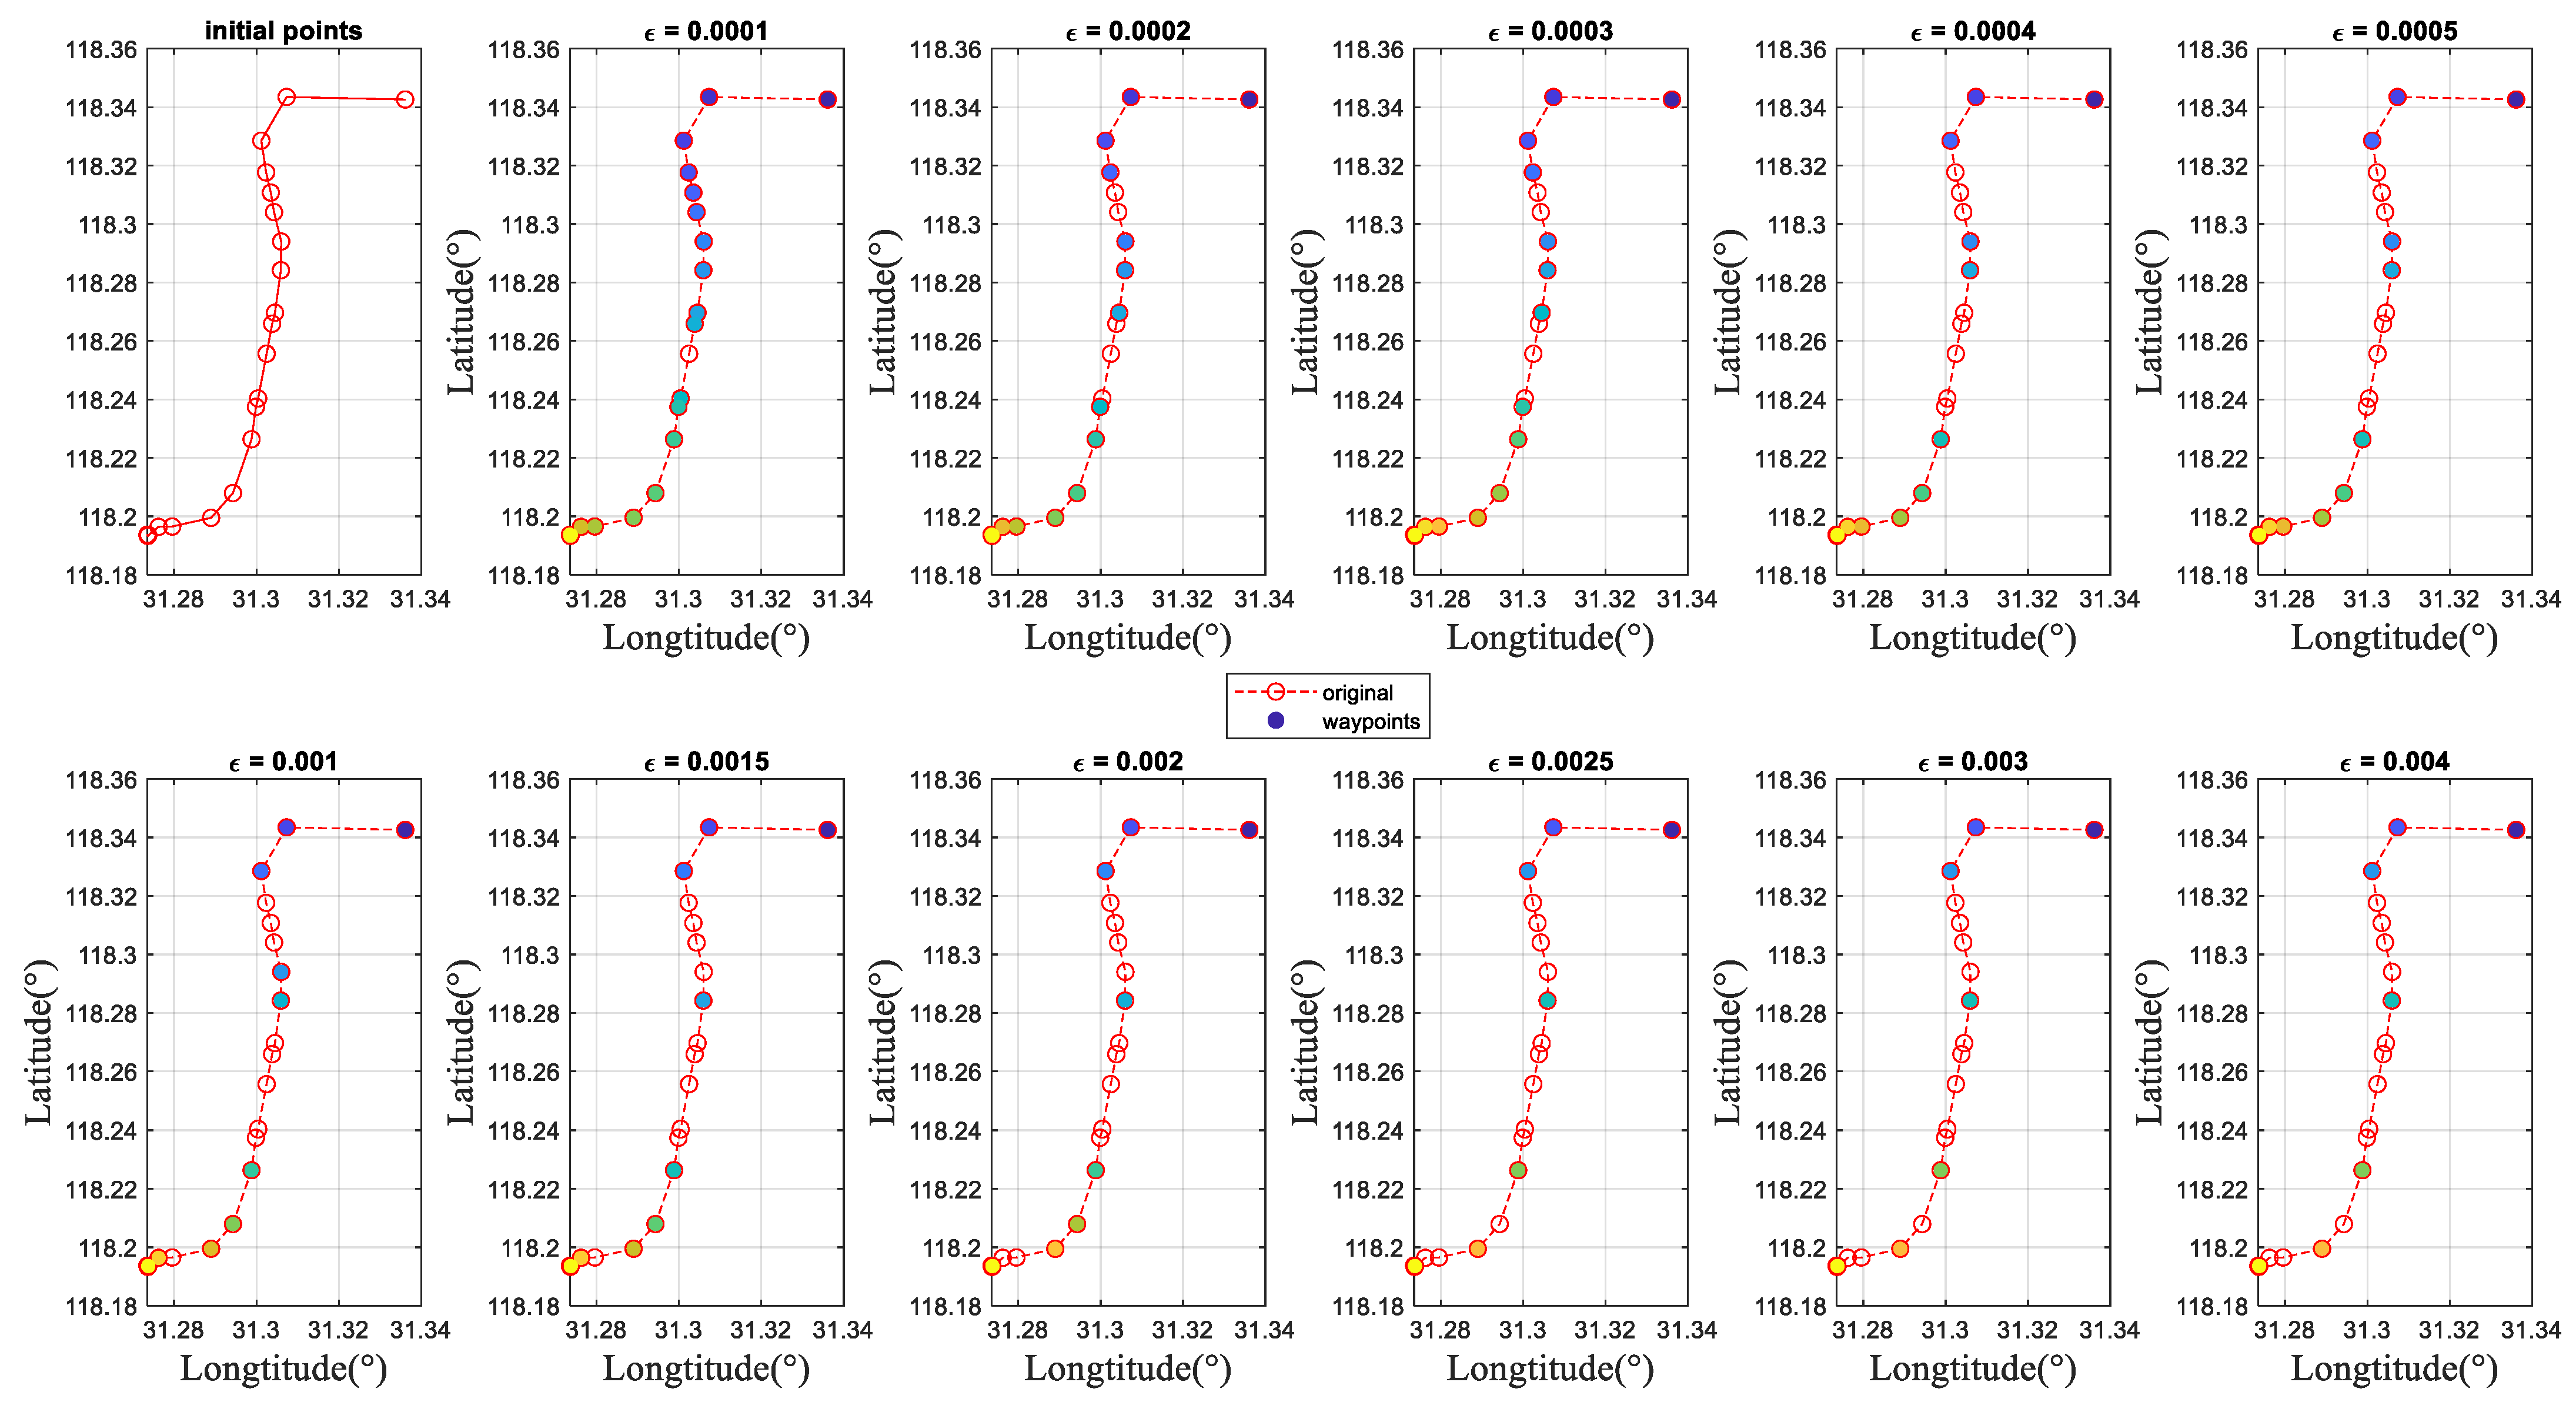
To extract the key waypoints, the key waypoints of ship navigation lanes were determined for each ship trajectory using the DP algorithm (see
Figure 3 and
Table 2 for the theoretical concept). Taking the “Xinhong 998” ship as an example, the historical trajectory of the ship for a certain period of time was first obtained from the MySQL database. Due to the dense trajectory, it is not convenient to perform data analysis. Therefore, the DP algorithm was used to optimize the ship’s historical trajectory. The following figure shows the optimization effect of the ship’s trajectory under different threshold conditions. As part of this process, sub-line segments were extracted using the DP algorithm with ε = 0.0025 (see
Figure 12).
For each ship trajectory, the K-means algorithm is used to cluster and analyze whether the ship has multiple abnormal trajectories (theoretical concepts are shown in
Figure 8 and
Table 3). In order to determine whether the “Xinhong 998” ship has multiple trajectory features, the K-means algorithm is used to cluster and analyze the optimized ship’s historical trajectory, quickly identifying the multiple trajectory features of the ship. As shown in
Figure 13, two types of trajectories can be found during the same period of the ship, indicating the existence of multiple trajectory features.
Based on Mysql and neo4j fusion calculation, the K-means clustering algorithm is used to identify multiple abnormal features of ship trajectory in the study area, and the acquired features are added into the ship behavior feature graph; based on specific ship ontology, the fusion calculation (subgraph inference, Mysql aggregation, and correlation query) is used to obtain ship data with abnormal features such as key monitored ships, expired ship certificate, inconsistent ship trajectory and reported port, etc., and the feature information is improved into the ship behavior feature graph. The ship data with abnormal features, such as ship certificate expired, ship trajectory inconsistent with reported port, ship not reported port for a long time, etc., are obtained through fusion calculation (subgraph inference, Mysql aggregation, and correlation query) to form a complete ship behavior feature graph. The calculation process is shown in
Table 4.
The subgraph search based on ship knowledge graph can quickly extract static features of ships, such as basic information of ships (including MMSI, ship name, ship type), validity of ship certificate, whether the ship is focused on tracking and the reasons for tracking, etc., and add them to the static feature graph of ship behavior; combined with dynamic port reporting information and ship AIS information, it can extract dynamic features of ships that combine motion and static, and realize the full domain mastery. By analyzing the relationship between time and space trajectory, we can find out the characteristics such as ships not reporting to port and inconsistency between the path of ships reporting to port and the actual AIS route trajectory, and add them into the dynamic feature graph of ship behavior. The combination of ship static feature graph and dynamic feature graph forms a complete ship behavior feature graph.
3.3. Fake Ship License Plate Judgment
3.3.1. Fake Ship License Plate Discovery
Based on ship behavior feature graph analysis, we focus on the abnormal behavior of double trajectories of ships in specific areas. As shown in
Figure 14, taking “Xinhong 998” ship chart node in the upstream section of the Yangtze River as an example for analysis, this ship is a sea ship with static chart characteristics, and in the time range of ‘21 March 2021 00:00:00’ to ‘21 March 2021 03:16:14’, the ship dynamically reports ports to call at Jiangyin, Diagang, and Niutoushan ports. Checking the AIS trajectory of this ship, it is found that one is the inland trajectory of the Yangtze River, and the inland trajectory is consistent with the reported path. The other is the sea navigation trajectory, and there is no matching sea reporting information, which means that some ships have multiple abnormal trajectories. The abnormal trajectory is the sea section, so it can be inferred that this ship has the risk of being licensed by the inland ship for sea navigation.
3.3.2. Calculation and Reasoning of Fake Ship License Plate
For “Xinhong 998” multiple areas of sea track, we obtained the center point of the ship track, taking the center point as the circle, 50 nautical miles (see more in
Figure 15) as the radius, and searching the ship monitoring chokepoint within the range (query to the monitoring chokepoint of Lianjiang Maritime Office). We calculated the distance between the center point of the ship track and the monitoring chokepoint, combined with the average speed of the ship’s property characteristics. To obtain the approximate time difference between the ship sailing from the monitoring chokepoint and the track area (roughly 2 h and 15 min by calculation), we subtracted the time difference from the multiple track time period of “Xinhong 998”, and obtained the time range of the monitoring chokepoint as ‘20 March 2021 09:45:00’ to ‘21 March 2021 01:01:14’. We obtained the ship information of the surveillance chokepoint in this time range, identifying “Ning Shuangshun 5568” as the active ship under the current surveillance chokepoint in the current time range, comparing the ship information with the ship behavior characteristics graph in the current area through circular association, and combining with the fake ship license plate rules. The ship “Ning Shuangshun 5568” is an inland river ship, and its AIS track cannot be found, which means the ship MMSI information does not match, the ship certificate has exceeded the validity period, the ship reporting information related to this ship cannot be found, and the ship belongs to the maritime key tracking ship. Thus, it meets many characteristics of the fake ship license violation, the matching degree is high, and it can be judged that the ship has the characteristics of the fake ship license plate violation. There is a high possibility that the ship set “Xinhong 998” is sailing at sea, and engaging in illegal activities.
This study collected questionnaire feedback from experts, and after statistical calculation, obtained the weight allocation information of ship deck rules, as shown in
Table 5.
Based on the weighted of inland river-ship-licensed seagoing ships as shown in
Table 6, the following algorithm is used to determine whether the ship is a licensed ship:
- (a)
Check if the ship is an inland waterway ship. If so, assign a weight of 0.1 to it; otherwise, no weight will be added;
- (b)
Check if the ship information matches. If it does not match, assign a weight of 0.4 to it; otherwise, no weight will be added;
- (c)
Check if the ship is using certificate information or if the certificate is invalid. If so, assign a weight of 0.1 to it; otherwise, no weight will be added;
- (d)
Check if the ship has not reported port for a long time or if the port report is inconsistent with the trajectory. If so, assign a weight of 0.2 to it; otherwise, no weight will be added;
- (e)
Check whether the ship is a key monitoring ship. If so, assign a weight of 0.1 to it; otherwise, no weight will be added. Add all weighted weight values together to obtain the total weight W of the ship;
- (f)
If W is greater than a certain threshold t (such as 0.6), it is determined that the ship is a licensed ship; otherwise, it is determined that it is not a licensed ship.
Among them, steps (a)~(d) are to check the characteristics of the ship and give corresponding weights based on the characteristics; step (e) is to add the weight of ownership to obtain the total weight of the ship; and step (f) is to determine whether the ship is a licensed ship based on the total weight. In practical applications, it is necessary to select an appropriate threshold t based on the specific situation, and continuously optimize and adjust the features and weights to improve the accuracy and reliability of the algorithm.
Based on the above weight determination algorithm, ships that meet the definition threshold of ship fraud with a value greater than 0.6 include Ning Shuangshun 5568 (1), Dafeng 3 (0.6), Fanzhou 10 (0.6), etc. Among them, Ning Shuangshun 5568 has the highest weight value and can be determined as a ship with fraudulent behavior.
4. Discussion
Based on the analysis of the collision accident between the “Zhonggang 88” ship and the “Ningshuangshun 5568” ship in Fuzhou on 21 March 2021, the “Zhonggang 88” ship, owned by Fujian Zhonggang Shipping Co., Ltd., loaded 4950 tons of wheat from Nantong to Quanzhou, collided with the “Ningshuangshun 5568” ship owned by Shen XX in the waters about 1.5 nautical miles west of Mazu Nangan Island (approximate position: 26°10.4′ N/119°53.2′ E). The accident caused the sinking of the “Ningshuangshun 5568” ship, and the stowage information of the “Zhonggang 88” ship was basically consistent with the portrait of the “Zhonggang 88” ship. No relevant records were found for “Ning Shuangshun 5568”.
A visualization analysis system for ship knowledge graphs was developed based on the ship knowledge graph technology studied in this study and combined with 3D-force-graph technology. The portrait analysis of the “Ningshuangshun 5568” ship shows that it belongs to an inland navigation ship, and its appearance at sea violates the rules of cross-inland and ocean navigation. Due to its lack of dynamic port reporting records and historical trajectory, it can be theoretically inferred that there is an illegal act of ship licensing. Combining the above analysis with the risk of “Xinhong 998” being falsely licensed for sea navigation by inland ships during the same period, and combining the abnormal trajectory of “Xinhong 998” in the current period analyzed earlier with the consistency of the monitoring checkpoint distance and speed calculation of the “Ningshuangshun 5568” falsely licensed ship, the combination of the two can indirectly infer that “Ningshuangshun 5568” falsely licensed “Xinhong 998” has a high probability of crossing inland rivers and sea navigation.
The final accident investigation report also confirmed that the “Ningshuangshun 5568” was falsely licensed as the “Xinhong 998”; “Ningshuangshun 5568” evaded normal maritime supervision and did not comply with the maritime regulations on the exclusive supervision of AIS for ships. The validity period of the certificate expired on 10 January 2021. When the accident occurred, the validity period of the certificate had expired. In addition, “Ningshuangshun 5568” had not yet fulfilled the declaration business of ship reporting operations as required, and it should bear the primary responsibility for this ship collision accident.
The inference method based on the graph of illegal behavior of ship deck rigging can also be applied to the field of ship collision risk assessment, and this method has a certain degree of universality. The inference technology for the graph of illegal behavior of ship cheating mainly includes extracting illegal behavior features of ship cheating, the design of ship cheating rules, the allocation of feature weights of ship cheating behavior, graph calculation, and graph inference process, etc. It is also applicable to the determination of ship collision risk. A ship collision risk assessment based on graph calculation and graph reasoning can be achieved by identifying and extracting key risk factors for ship collisions, designing ship collision rules, and assigning weights to key risk factors for ship collisions.
5. Conclusions
This paper presents the construction of a ship knowledge graph using science knowledge graph technology, which allows for extracting ship violation features and identifying specific fake ship license plates through inference and case analysis verification. The results of this research can significantly enhance the decision-making ability of maritime for ship safety supervision. The ship static and dynamic knowledge graph facilitates ship portrait and ship hidden relationship mining and analysis, allowing for the rapid identification of maritime key tracking ships, ships with expired certificates, and the consistency of ship trajectories and reported ports. It also enables the identification of multiple trajectory anomalies of ships and the retrieval of ships that have not reported ports for a long time. Through the analysis of the ship graph, the existence of abnormal ships navigating across inland rivers and seas, as well as the violation of the ship’s license plate, can be determined. Furthermore, in conjunction with the identification of ship names under on-site supervision, ship graph comparison analysis can be conducted to enable rapid screening and key monitoring of abnormal risks similar to “Ning Shuangshun 5568”, thereby enhancing the ability to prevent accidents beforehand. The ship graphical portrait provides full information on the ship belonging to the company, certificate information, the last port from where it departed, the next port where it will arrive, local cargo, and the ship’s crew, as well as violation behavior characteristics. This information allows for timely response to ship monitoring and tracking business requirements and enhances after-accident investigation, tracing, and control disposal capability through the use of graph path query and source tracing methods.
In summary, this research enhances the maritime industry’s pre-accident prevention capability and post-accident handling capability through the construction and analysis of a ship knowledge graph, providing valuable insights for ship safety supervision decision-making.
Author Contributions
Conceptualization, validation, writing, original draft, methodology, and formal analysis—H.W., S.F. and M.Z.; writing, review and editing, supervision, funding acquisition—H.W., S.F. and Y.X. All authors have read and agreed to the published version of the manuscript.
Funding
This study is supported by the National Natural Science Foundation of China under grants 52271363 and Shanghai Rising-Star Program 22QC1400600.
Institutional Review Board Statement
Not applicable.
Informed Consent Statement
Not applicable.
Data Availability Statement
Not applicable.
Conflicts of Interest
We declare that we have no financial and personal relationships with other people or organizations that can inappropriately influence our work, there is no professional or other personal interest of any nature or kind in any product, service, and/or company that could be construed as influencing the position presented in, or the review of, the manuscript entitled, ‘A semantic network method for the identification of ship illegal behaviors using knowledge graph: A case study on fake ship license plates’.
References
- Ma, X.; Shen, J.; Liu, Y.; Qiao, W. A Methodology to Evaluate the Effectiveness of Intelligent Ship Navigational Information Monitoring System. IEEE Access 2020, 8, 193544–193559. [Google Scholar] [CrossRef]
- Su, P.; Abera, T.; Guan, Y.; Pellikka, P. Image-to-Image Training for Spatially Seamless Air Temperature Estimation with Satellite Images and Station Data. IEEE J. Sel. Top. Appl. Earth Obs. Remote Sens. 2023, 16, 3353–3363. [Google Scholar] [CrossRef]
- Shi, Y.; Long, C.; Yang, X.; Deng, M. Abnormal Ship Behavior Detection Based on AIS Data. Appl. Sci. 2022, 12, 4635. [Google Scholar] [CrossRef]
- Wang, H.; Liu, Z.; Wang, X.; Graham, T.; Wang, J. An analysis of factors affecting the severity of marine accidents. Reliab. Eng. Syst. Saf. 2021, 210, 107513. [Google Scholar] [CrossRef]
- Tan, Z.; Liu, H.; Shao, S.; Liu, J.; Chen, J. Efficiency of Chinese ECA policy on the coastal emission with evasion behavior of ships. Ocean. Coast. Manag. 2021, 208, 105635. [Google Scholar] [CrossRef]
- Zhang, M.; Taimuri, G.; Zhang, J.; Hirdaris, S. A deep learning method for the prediction of 6-DoF ship motions in real conditions. Proc. Inst. Mech. Eng. Part M J. Eng. Marit. Environ. 2023, 14750902231157852. [Google Scholar] [CrossRef]
- Duan, H.; Ma, F.; Miao, L.; Zhang, C. A semi-supervised deep learning approach for vessel trajectory classification based on AIS data. Ocean. Coast. Manag. 2022, 218, 106015. [Google Scholar] [CrossRef]
- Liu, H.; Liu, Y.; Li, B.; Qi, Z. Ship Abnormal Behavior Detection Method Based on Optimized GRU Network. J. Mar. Sci. Eng. 2022, 10, 249. [Google Scholar] [CrossRef]
- Liu, T.; Ma, J. Ship Navigation Behavior Prediction Based on AIS Data. IEEE Access 2022, 10, 47997–48008. [Google Scholar] [CrossRef]
- Rong, H.; Teixeira, A.P.; Soares, C.G. Ship collision avoidance behaviour recognition and analysis based on AIS data. Ocean. Eng. 2022, 245, 110479. [Google Scholar] [CrossRef]
- Liu, Z.; Zhang, B.; Zhang, M.; Wang, H.; Fu, X. A quantitative method for the analysis of ship collision risk using AIS data. Ocean. Eng. 2023, 272, 113906. [Google Scholar] [CrossRef]
- Kaluza, P.; Kölzsch, A.; Gastner, M.T.; Blasius, B. The complex network of global cargo ship movements. J. R. Soc. Interface 2010, 7, 1093–1103. [Google Scholar] [CrossRef] [PubMed]
- Veenstra, A.W.; Harmelink, R.L. Process mining ship arrivals in port: The case of the Port of Antwerp. Marit. Econ. Logist. 2022, 24, 584–601. [Google Scholar] [CrossRef]
- Acharya, T.D.; Yoo, K.W.; Lee, D.H. GIS-based spatio-temporal analysis of marine accidents database in the coastal zone of Korea. J. Coast. Res. 2017, 79, 114–118. [Google Scholar] [CrossRef]
- Fu, S.; Zhang, Y.; Zhang, M.; Han, B.; Wu, Z. An object-oriented Bayesian network model for the quantitative risk assessment of navigational accidents in ice-covered Arctic waters. Reliab. Eng. Syst. Saf. 2023, 238, 109459. [Google Scholar] [CrossRef]
- Kehrer, J.; Hauser, H. Visualization and visual analysis of multifaceted scientific data: A survey. IEEE Trans. Vis. Comput. Graph. 2012, 19, 495–513. [Google Scholar] [CrossRef]
- Hogan, A.; Blomqvist, E.; Cochez, M.; d’Amato, C.; Melo, G.D.; Gutierrez, C.; Kirrane, S.; Gayo, J.E.L.; Navigli, R.; Neumaier, S.; et al. Knowledge graphs. ACM Comput. Surv. (CSUR) 2021, 54, 1–37. [Google Scholar] [CrossRef]
- Singhal, A. Official Google Blog: Introducing the Knowledge Graph: Things, Not Strings [EB/OL]. Available online: https://blog.google/products/search/introducing-knowledge-graph-things-not/ (accessed on 27 October 2022).
- Fu, S.; Yu, Y.; Chen, J.; Xi, Y.; Zhang, M. A framework for quantitative analysis of the causation of grounding accidents in arctic shipping. Reliab. Eng. Syst. Saf. 2022, 226, 108706. [Google Scholar] [CrossRef]
- Kim, H.; Kim, G.; Na, H.; Lee, S. An Implementation of Detecting Abnormal Ship Navigation and Ship Safety Navigation Guidance. J. Digit. Contents Soc. 2021, 22, 1903–1912. [Google Scholar] [CrossRef]
- Wang, X.; Xia, G.; Zhao, J.; Wang, J.; Yang, Z.; Loughney, S.; Fang, S.; Zhang, S.; Xing, Y.; Liu, Z. A novel method for the risk assessment of human evacuation from cruise ships in maritime transportation. Reliab. Eng. Syst. Saf. 2023, 230, 108887. [Google Scholar] [CrossRef]
- Pan, W.; Zhou, X.; Zhou, T.; Chen, Y. Fake license plate recognition in surveillance videos. Signal Image Video Process. 2022, 17, 937–945. [Google Scholar] [CrossRef]
- Zhang, M.; Zhang, D.; Fu, S.; Kujala, P.; Hirdaris, S. A predictive analytics method for maritime traffic flow complexity estimation in inland waterways. Reliab. Eng. Syst. Saf. 2022, 220, 108317. [Google Scholar] [CrossRef]
- Wei, Z.; Xie, X.; Zhang, X. AIS trajectory simplification algorithm considering ship behaviours. Ocean. Eng. 2020, 216, 108086. [Google Scholar] [CrossRef]
- Song, R.; Wen, Y.; Tao, W.; Zhang, Q.; Papadimitriou, E.; van Gelder, P. Semantic Modeling of Ship Behavior in Cognitive Space. J. Mar. Sci. Eng. 2022, 10, 1347. [Google Scholar] [CrossRef]
- Wen, Y.; Zhang, Y.; Huang, L.; Zhou, C.; Xiao, C.; Zhang, F.; Peng, X.; Zhan, W.; Sui, Z. Semantic modelling of ship behavior in harbor based on ontology and dynamic bayesian network. ISPRS Int. J. Geo-Inf. 2019, 8, 107. [Google Scholar] [CrossRef]
- Li, Q.; Li, F.; Li, S.; Li, X.; Liu, K.; Liu, Q.; Dong, P. Improving Entity Linking by Introducing Knowledge Graph Structure Information. Appl. Sci. 2022, 12, 2702. [Google Scholar] [CrossRef]
- Hu, L.; Ding, J.; Shi, C.; Shao, C.; Li, S. Graph neural entity disambiguation. Knowl. Based Syst. 2020, 195, 105620. [Google Scholar] [CrossRef]
- Dong, J.; Jing, X.; Lu, X.; Liu, J.; Li, H.; Cao, X.; Du, C.; Li, J.; Li, L. Process knowledge graph modeling techniques and application methods for ship heterogeneous models. Sci. Rep. 2022, 12, 2911. [Google Scholar] [CrossRef]
- Yan, J.; Wang, C.; Cheng, W.; Gao, M.; Zhou, A. A retrospective of knowledge graphs. Front. Comput. Sci. 2018, 12, 55–74. [Google Scholar] [CrossRef]
- Zhong, S.; Wen, Y.; Huang, Y.; Cheng, X.; Huang, L. Ontological Ship Behavior Modeling Based on COLREGs for Knowledge Reasoning. J. Mar. Sci. Eng. 2022, 10, 203. [Google Scholar] [CrossRef]
- Li, D.; Mei, H.; Shen, Y.; Su, S.; Zhang, W.; Wang, J.; Zu, M.; Chen, W. ECharts: A declarative framework for rapid construction of web-based visualization. Vis. Inform. 2018, 2, 136–146. [Google Scholar] [CrossRef]
- Chen, J.; Ye, J.; Zhuang, C.; Qin, Q.; Shu, Y. Liner shipping alliance management: Overview and future research directions. Ocean. Coast. Manag. 2022, 219, 106039. [Google Scholar] [CrossRef]
- Wang, X.; Liu, Z.; Yan, R.; Wang, H.; Zhang, M. Quantitative analysis of the impact of COVID-19 on ship visiting behaviors to ports-A framework and a case study. Ocean. Coast. Manag. 2022, 230, 106377. [Google Scholar] [CrossRef]
- Zhang, M.; Montewka, J.; Manderbacka, T.; Kujala, P.; Hirdaris, S. A big data analytics method for the evaluation of ship-ship collision risk reflecting hydrometeorological conditions. Reliab. Eng. Syst. Saf. 2021, 213, 107674. [Google Scholar] [CrossRef]
- Xu, L.; Di, Z.; Chen, J.; Shi, J.; Yang, C. Evolutionary game analysis on behavior strategies of multiple stakeholders in maritime shore power system. Ocean. Coast. Manag. 2021, 202, 105508. [Google Scholar] [CrossRef]
- Li, M.G.; Chen, J.J.; Xu, A.J.; Xia, X.H.; Wang, J.H. Case study of innovative top-down construction method with channel-type excavation. J. Constr. Eng. Manag. 2014, 140, 05014003. [Google Scholar] [CrossRef]
- Widenius, M.; Axmark, D. MySQL Reference Manual: Documentation from the Source; O’Reilly Media, Inc.: Sebastopol, CA, USA, 2002. [Google Scholar]
- Gong, Z.; Yu, X.; Fu, W.; Che, X.; Mao, Q.; Zheng, X. The Construction of Knowledge Graph for Personalized Online Teaching. In Proceedings of the Data Mining and Big Data: 6th International Conference, DMBD 2021, Guangzhou, China, 20–22 October 2021; Proceedings, Part II 6. Springer: Singapore, 2021; pp. 98–107. [Google Scholar]
- Webber, J. A programmatic introduction to neo4j. In Proceedings of the 3rd Annual Conference on Systems, Programming, and Applications: Software for Humanity, Tucson, AZ, USA, 21–25 October 2012; Volume 10, pp. 217–218. [Google Scholar]
Figure 1.
Research framework of the identification of ship’s illegal behaviors using knowledge graph.
Figure 1.
Research framework of the identification of ship’s illegal behaviors using knowledge graph.
Figure 2.
Data processing.
Figure 2.
Data processing.
Figure 3.
Douglas–Peuker algorithm.
Figure 3.
Douglas–Peuker algorithm.
Figure 4.
Semantic design for the identification of ship’s illegal behaviors.
Figure 4.
Semantic design for the identification of ship’s illegal behaviors.
Figure 5.
Ontology construction.
Figure 5.
Ontology construction.
Figure 6.
Entity construction.
Figure 6.
Entity construction.
Figure 7.
Ship behavior feature extraction.
Figure 7.
Ship behavior feature extraction.
Figure 8.
Defined ship trajectory using AIS data.
Figure 8.
Defined ship trajectory using AIS data.
Figure 9.
Fake ship license plates inference.
Figure 9.
Fake ship license plates inference.
Figure 10.
Ship semantic model.
Figure 10.
Ship semantic model.
Figure 11.
Ship relationship graph.
Figure 11.
Ship relationship graph.
Figure 12.
Key waypoints determination using DP algorithm with the various threshold parameters.
Figure 12.
Key waypoints determination using DP algorithm with the various threshold parameters.
Figure 13.
Ship trajectories clustering using K-means algorithm.
Figure 13.
Ship trajectories clustering using K-means algorithm.
Figure 14.
Ship multiple trajectory abnormalities.
Figure 14.
Ship multiple trajectory abnormalities.
Figure 15.
Monitoring checkpoint search.
Figure 15.
Monitoring checkpoint search.
Table 1.
Data source.
| Dataset | Information |
|---|
| Basic ship information | Ship number, Chinese and English names of the ship, ship type, ship length, ship tonnage, ship owner, ship registration location, ship location, ship status. |
| Ship company | Serial number, Chinese and English names of the ship, legal representative, telephone number. |
| Key tracking ship | Tracking number, ship registration number, Chinese and English names of the ship, port of registry, MMSI, tracking reason code, tracking reason name, and date of creation, among others; these data mainly have data redundancy and missing data. |
| Ship nationality certificates | Ship number, Chinese name of the ship, MMSI, owner of the ship, contact number, starting validity, expiry date, registration authority, certificate printing number. |
| Ship entry and exit reports | Ship number, ship registration number, Chinese and English names of the ship, MMSI, ship type, gross tonnage, net tonnage, gross engine power, passenger capacity, ship length, beam, depth, ship owner, port name, port number, type of port, name of port, reporting time, berthing code, berth of call, actual cargo volume, local port volume, goods, passenger. |
| Ship violation inspection | Inspection number, inspection code, inspection content, inspection results, problems, description. |
| Ship AIS | MMSI, Chinese and English names of the ship, heading, course, speed, longitude, latitude, draft, received time. |
Table 2.
DP algorithm for the abnormal ship spatial trajectory extraction.
Table 2.
DP algorithm for the abnormal ship spatial trajectory extraction.
| DP Algorithm |
|---|
3: If d > dm
4: index = i
5: dm = d
6: End if
7: End if
8: If dm >= €
9: WaypointLList = DP (CL [1……index], ε)
10: WaypointRList = DP (CL [index……n], ε)
11: Waypoints = {WaypointLList, WaypointRList}
12: Else
13: Waypoints = {CL [1], CL [n]}
14: End if
15: Return Waypoints |
Table 3.
Ship trajectories clustering method using K-means algorithm.
Table 3.
Ship trajectories clustering method using K-means algorithm.
| K-Means Algorithm |
|---|
Input:
Dataset, , clustering number , the maximum number of iterations
Output:
Clustering
Process:
1. Select K trajectories as the centre trajectories ;
2. Initially cluster division ;
3. For n = 1, 2, ..., N:
4. For i = 1, 2, ..., m:
5. Calculate distance between the trajectory xi and ;
6. Mark category as corresponding the smallest ;
7. End for
8. For j = 1, 2, ..., K:
9. Calculate the centre trajectories based on the new clustering result
10. End for
11. If the clustering result remains consistent:
12. Go to line 17;
13. Else:
14. Go to line 4;
15. End if
16. End for
17. Output . |
Table 4.
Ship behavior feature extraction process.
Table 4.
Ship behavior feature extraction process.
| No. | Features | Calculation Methods | Procedures |
|---|
| 1 | Multiple ship tracks | K-means multiple trajectory clustering | 1. Calculate the ship history trajectory;
2. Obtain the number of ship multiple trajectories by K-means multiple trajectory clustering method. |
| 2 | Maritime key monitoring ships | Subgraph inference | 1. Mysql retrieves data on ships that have been classified as maritime priority monitoring;
2. neo4j queries and identifies ship entities on the retrieved result data. |
| 3 | Ships with expired certificates | Subgraph inference | 1. Mysql to ship certificate relationship data retrieval, find certificate expiry information;
2. neo4j fused results data for ship entity query and identification. |
| 4 | Inconsistent ship tracks with reported ports | Mysql aggregation and associated query | 1. Calculate the historical trajectory of a ship;
2. Calculate the ship’s route to report port;
3. Compare ship history trajectories with ship reporting paths based on spatial similarity;
4. Judge the consistency of the ship’s trajectory with the reported port path. |
| 5 | Ships not reporting ports for a long time | Mysql aggregation and associated query | 1. Mysql combines multiple ship reporting relationship tables for correlation analysis and generates results data for ships that have not reported to port for a long time;
2. neo4j fused results data for ship entity query and identification. |
Table 5.
Weighted features of fake ship license plates.
Table 5.
Weighted features of fake ship license plates.
| Feature | Weight |
|---|
| Inland waterway ship | 0.2 |
| Ship information matches | 0.4 |
| Certificate is invalid | 0.1 |
| Not reported port for a long time | 0.2 |
| The port report is inconsistent with the trajectory | 0.1 |
| Key monitoring ship | 0.1 |
Table 6.
Weight for fake ship license plates.
Table 6.
Weight for fake ship license plates.
| Number | Ship Number | Ship Name | Inland Ship | Ship Information Mismatch | Invalid Certificate | Abnormal Ship Reporting | Key Monitoring | Weight |
|---|
| No Port Reporting | Inconsistent Trajectory |
|---|
| 1 | 60117000047 | runcheng9 | 0.2 | | | | | | 0.2 |
| 2 | 70106000226 | jinfuxin28 | 0.2 | | | | | | 0.2 |
| 3 | 80112000047 | dafeng3 | 0.2 | | 0.1 | 0.2 | | 0.1 | 0.6 |
| 4 | 60019000021 | fanzhou10 | 0.2 | | 0.1 | 0.2 | | 0.1 | 0.6 |
| 5 | 80617000090 | jinjiangpeng29 | 0.2 | | 0.1 | | | | 0.3 |
| 6 | 60115000027 | shunqiang68 | | | | | | | |
| 7 | 60016000039 | ninghua417 | | | | | | | |
| 8 | 270117000007 | ningshuangshun5568 | 0.2 | 0.4 | 0.1 | 0.2 | | 0.1 | 1 |
| Disclaimer/Publisher’s Note: The statements, opinions and data contained in all publications are solely those of the individual author(s) and contributor(s) and not of MDPI and/or the editor(s). MDPI and/or the editor(s) disclaim responsibility for any injury to people or property resulting from any ideas, methods, instructions or products referred to in the content. |
© 2023 by the authors. Licensee MDPI, Basel, Switzerland. This article is an open access article distributed under the terms and conditions of the Creative Commons Attribution (CC BY) license (https://creativecommons.org/licenses/by/4.0/).


