Article

Regime Shifts in the Damage Caused by Tropical Cyclones in the Guangdong–Hong Kong–Macao Greater Bay Area of China

1
College of Life Sciences and Oceanography, Shenzhen University, Shenzhen 518000, China
2
College of Physics and Optoelectronic Engineering, Shenzhen University, Shenzhen 518000, China
3
Shenzhen Marine Development & Promotion Center, Shenzhen 518000, China
*
Authors to whom correspondence should be addressed.
J. Mar. Sci. Eng. 2023, 11(10), 1889; https://doi.org/10.3390/jmse11101889
Submission received: 5 August 2023 / Revised: 21 September 2023 / Accepted: 22 September 2023 / Published: 28 September 2023

Abstract

:
Tropical cyclones (TCs) pose a significant threat in terms of wind-induced damage and storm risk to the Guangdong–Hong Kong–Macao Greater Bay Area (GBA) of China. In this research, annual power dissipation index (PDI) and storm surge and wave destructive potential (SDP) index from June to November were used to estimate the damage caused by the TC events in the buffer zone of the GBA. The regime shifts in 1993 and 2013 were identified through the Bayesian changepoint detection in six TC datasets. The TC-induced damage during 1994–2012 (the low-damage period) was weaker than that in 1977–1993 and 2013–2020 (the high-damage periods). The intensity and size of stronger TCs are the dominant factors responsible for the interdecadal changes in the TC damage. This may be explained by the influences of sea surface temperature (SST), surface latent heat flux and mid-level relative humidity. During high-damage periods, TCs can extract more energy from the ocean, leading to increased TC intensity and larger size. Conversely, during low-damage periods, TCs undergo a decrease in energy intake, resulting in reduced TC power and smaller size. The variations in the SST are relative to the Luzon Strait transport. In addition, the reduction in TC translation speed is unfavorable for the development of TCs in low-damage periods. Further research suggested that mid-level steering flow affects the TC movement velocity. The results offer valuable insights into the variations in the TC-induced damage in the GBA.

1. Introduction

The Guangdong–Hong Kong–Macao Greater Bay Area (GBA) encompasses eleven cities, comprising two special administrative regions and nine other cities around the Pearl River Estuary. It is one of the most economically developed regions globally, contributing approximately one-tenth of China’s GDP. However, the GBA is prone to severe tropical cyclones (TCs), which represent some of the most devastating disasters in the area. On average, the GBA experiences about four TCs per year. For instance, in 2018, the super typhoon Mangkhut directly hit the GBA, resulting in intense storm surges and wind-induced damages that seriously threatened its citizens’ safety. The economic losses from this event were estimated at 24.57 hundred million. Consequently, there is an urgent need for an in-depth study of the TC damage in this region.
The damage caused by TCs includes wind-induced damage and storm surge risk due to rising water levels. TC frequency, duration, intensity and size control the damage caused by TCs [1,2]. These parameters constantly affected by environmental factors such as sea surface temperature (SST), subtropical high, atmosphere vertical velocity, relative humidity and vertical wind shear [3,4,5,6,7,8,9]. These environmental factors are always regulated by climatic signals, e.g., El Niño–Southern Oscillation (ENSO), Pacific Decadal Oscillation (PDO) and Indian Ocean Dipole (IOD) [10,11,12,13,14]. Limited research has been conducted on the annual TC size, highlighting the significant influence of TC intensity in regulating TC size. Additionally, environmental factors such as SST play a secondary role in adjusting the size of TCs [15]. The TC lifespan also depends on the TC intensity.
The TCs affecting the GBA belong to the TC clusters in the South China Sea (SCS). On the interdecadal timescale, many studies analyze interdecadal variations in TC formation over the SCS during the summer season. These studies have identified two significant shifts in TC frequency in the years 1993/1994 and 2002/2003 [3,5,6,7,8]. During the period between 1993/1994 and 2002/2003, the frequency of TCs was observed to be higher compared to other periods. This finding is associated with the zonal SST gradient between the northern Indian Ocean (NIO) and the western North Pacific (WNP) [5,16]. Furthermore, other studies have examined the intensity of TCs and have found a decrease in intensity from the mid-1990s to the mid-2000s [9,17]. This decrease in intensity has been attributed to the vertical moisture transport. Recent research has also focused on the movement speed of TCs in the SCS and has found that the movement speed was lower during the period from the early 1990s to the early 2000s compared to other periods [18].
However, there is limited research on the impact of TCs on the GBA, with most studies focusing on the South China region or specific city clusters within it. One study has discussed the significant changes in the power dissipation index (PDI) of TCs making landfall in South China, identifying two periods of high PDI (1960–1975 and 1989–1996) and two periods of low PDI (1976–1988 and 1997–2011) [19], while another study found no significant changes [20]. Some research has reported a notable increase in storm surge along the GBA coast in recent decades [21,22], with the size, intensity and translation speed of TCs playing a role in these changes. Additionally, the frequency and intensity of storm surge along the GBA coast on an interdecadal timescale are related to the PDO [23,24]. Other studies have provided explanations for the increasing intensity of TCs making landfall in South China in recent decades [19,25,26]. These studies attribute the intensification of TCs to the warmer sea water in the South China Sea, which has led to a greater number of TCs reaching their lifetime maximum intensity closer to the coast of South China. Consequently, there has been an increase in the landfall intensity in this region. Furthermore, some studies have analyzed the frequency of TCs affecting Shenzhen and have observed a decrease in recent periods [27,28].
Previous studies have primarily focused on assessing the TC damage during or after landfall, often overlooking the significance of the pre-landfall period. However, based on valuable insights from forecasters, it is crucial to consider the potential effects of storm surges when TC events approach within 300 km of a specific location. Therefore, it is equally important to investigate TC events approaching the GBA before landfall. Additionally, due to the lack of data on the size of TCs, few researchers have conducted studies on TC size and the associated storm surge [29]. There is ongoing debate regarding the interdecadal changes in the TC damage to the GBA, with inconclusive findings. These limitations highlight the need for extensive research into the interdecadal variations in both wind-induced TC damage and surge-related impacts affecting the GBA before and after landfall.
In this study, we investigate the interdecadal changes in wind- and surge-induced damage caused by TCs before and after landfall. It is important to highlight that the TC clusters analyzed in this study include not only those TCs that make landfall in the GBA but also those that have an impact on the GBA during both the pre-landfall and post-landfall periods. Furthermore, we identify the unique regulatory factors accountable for these variations. The subsequent sections of this paper are structured as follows. Section 2 introduces the datasets and methodology. Section 3 shows the proof of interdecadal changes in the TC damage and investigates the possible mechanism contributing to such changes. Finally, discussion and conclusions are given in Section 4 and Section 5, respectively.

2. Materials and Methods

2.1. Data

The TC datasets are acquired from the Japan Meteorological Agency (JMA), the Joint Typhoon Warning Center (JTWC), the China Meteorological Administration–Shanghai Typhoon Institute (CMA [28]) and the Hong Kong Observatory (HKO). These best track data are extracted from the International Best Track Archive for Climate Stewardship (IBTrACS), version 4, at 6 h intervals [29]. The datasets contain many variables, such as maximum sustained wind speed near the TC center, TC size, as well as the corresponding time and center location of TCs. The maximum sustained wind speed near TC center is measured in different timescales across different datasets. To ensure uniformity, these datasets employ a 10 min averaging time, accompanied by an adjustment factor of 0.88 (0.89) to account for the conversion from 1 to 10 min (2 to 10 min) sustained wind speeds. This approach guarantees a standardized measurement across the different datasets and enhances the academic rigor and coherence of the analysis [30,31,32,33]. In this study, the research period is selected from 1977 to 2020 during the TC season, i.e., June to November [34,35], since all institutions share this common period. For the TC size dataset, JMA has sufficient research data on radii (30 kts, 50 kts) for 1977–2020. CMA has data on TC size for 1981–2016 [36]. The TC size in this dataset is defined as the radius (unit: km) of 34 kts (1 kts ≈ 0.5 m/s). JTWC has the dataset on the radii (34 kts, 50 kts, 64 kts) in four quadrants since 2001, and it can assist verification in the research.
The data on TC wind radii (64 kts, 50 kts, 34 kts, 23.3 kts) can be obtained from the QuikSCAT Tropical Cyclone Radial Structure Dataset (QSCAT-R). It is provided by the NASA Jet Propulsion Laboratory (JPL) and IBTrACS. Here, version 3 of the dataset includes the aim TC clusters in the research for the years 2000–2008, during which the QuikSCAT satellite was operational. It is used to aid validation.
The Advanced Dvorak Technique–Hurricane Satellite (HURSAT)-B1 dataset is applied [37,38,39,40]. It is referred to as the SAT in the following. The SAT covers 1981–2016 and the time length is relatively shorter compared to that in IBTrACS [36]. Otherwise, the SAT records do not capture every occurrence of a TC. However, the SAT continues to be extensively employed in research exploring long-term variations in TC damage [41,42,43].
Monthly atmospheric data with a horizontal resolution of 0.25° × 0.25° and 43 pressure levels from 1000 to 1 hPa are derived from the ERA5. SST and horizontal current velocities originate from the ORAS5 monthly mean data prepared by the ECMWF, with a horizontal resolution of 0.25° × 0.25°.

2.2. TC Information Extraction

The region affected by a TC is usually within 300 km from the TC eye [26], and the wind rate within the region is always higher than 10.8 m/s, which not just affects high-voltage power lines but causes higher damage [9,44]. In this study, based on the regional boundary of the GBA, a buffer zone with a radius of 300 km is built. The TC events that occur within the buffer zone are selected as our research target (Figure 1).
Figure 2 shows the tracks of these TC events during their whole lifespan. There are 231 TC tracks registered in the buffer zone during the TC season from 1977 to 2020. The TC clusters come from the WNP or the SCS. An average of 5 TCs enter the buffer zone each year, with a maximum of 8 and a minimum of 2. The aim of this study is to investigate the TC events in the buffer zone, not the TCs in their whole lifespan.

2.3. Damage Assessment Index

PDI is used to assess the destructiveness of TC wind. It is defined by the author of [2] as follows:
P D I i = 1 N 0 τ w 3 d t
where w is the TC intensity, τ is the time of TCs in the buffer zone, and N is the number of TCs. The PDI in the buffer zone (the region within the red curve in Figure 1) is also accumulated each year in the TC season.
Otherwise, the storm surge and wave destructive potential (SDP) index is a good indicator of the storm surge damage. The definition is provided in [45,46] as follows:
S D P = 0.959 + 0.009 R 18 8.88 × 10 6 R 18 305.98 2 + 0.005 R 33 1.04 × 10 4 R 33 113.15 2
where R 18 ( R 33 ) is the radius of TC reach at 18 m/s (33 m/s) calculated from the TC size and TC intensity obtained using linear interpolation.
The radius data in CMA only have a radius of 17 m/s, which cannot be used for linear interpolation. The radius of maximum sustained wind speed near TC center should be known. Otherwise, the maximum sustained wind speed radius near TC center in JMA should be known. Prior research provided many parametric formulas for the radius of maximum wind; here, we use the following parametric formula [47]:
R m = 1.119 × 10 3 × ( 1010 p c ) 0.805
where R m is the radius of maximum wind, and p c is the minimum central pressure. In this paper, the data on the SDP index in the buffer zone (the region within the red curve in Figure 1) are also included for the TC season of each year.

2.4. Bayesian Changepoint Method for Interdecadal Changes

To detect notable interdecadal transitions in the time series of TCs, we employ the Bayesian changepoint method proposed by Zhao and Chu [48]. This method is tailored to identify multiple changepoints within an extreme event time series, which is represented as a Poisson process with a rate distributed according to gamma distribution. Previous studies have demonstrated the efficacy of this method in pinpointing the corresponding changepoints of various extreme events, including TC activity [5,49].
Consider a time series X = {x1, x2, ……, xn} whose first and second segments fluctuate, due to some exogenous factors, around two different mean levels denoted by μ1 and μ2, respectively, but with the same variance, σ 2 . Assume that the single change point has occurred at time point τ, and the time series follow the normal distribution of Equation (4):
X i ~ N μ 1 ,   σ 2 ,   i = 1 ,   ,   τ
X i ~ N μ 2 ,   σ 2 ,   i = τ + 1 ,   ,   n
where N μ k ,   σ 2 represents a normal distribution with density function given as Equation (5):
f μ k ,   σ 2 = 1 σ 2 π e x p ( x u k ) 2 2 σ 2 ,   x R
The parameters τ, µ1, µ2 and σ2 represent the change point, the mean before and after the shift and the variance of the series, respectively. The prior distributions of µ1 and µ2 are assumed to be the same normal distributions denoted by Equations (6) and (7):
μ 1 ~ N μ 0 ,   σ 0 2
μ 2 ~ N μ 0 ,   σ 0 2
With large σ 0 2 values, these distributions will approach the noninformative prior distributions.
The variance of the series σ2 is assumed constant and estimated by Equation (8):
σ 2 = 1 n x i x ¯ 2 ( n 1 ) ,   x ¯ = 1 n x i n
After a sample of time series X is observed, the posterior distribution of the mean levels µ1 and µ2 can be determined using Bayes’ theorem by Equations (9) and (10):
µ 1 | X τ ~   N μ 1 * , σ 1 * 2
µ 2 | X τ + 1 ~   N μ 2 * , σ 2 * 2
where:
μ 1 * = n * μ 0 + τ + 1 n X i n * + τ ,   σ 1 * 2 = σ 2 n * + τ ,   μ 2 * = n * μ 0 + τ + 1 n X i n * + n τ ,   σ 2 * 2 = σ 2 n * + n τ ,   n * = σ 2 σ 0 2
The likelihood function for τ, µ1 and µ2 can be derived using the following formula:
L X | τ ,   μ 1 , μ 2 = i = 1 τ e ( x i μ 1 ) 2 2 σ 2 2 π σ 2 i = τ + 1 n e ( x i μ 2 ) 2 2 σ 2 2 π σ 2
Using the Bayes’ theorem, the posterior distribution of the change point location τ is calculated using Equation (11):
π τ | X ,   μ 1 , μ 2 = L X | τ ,   μ 1 , μ 2 p ( τ ) 1 n 1 L X | j ,   μ 1 , μ 2 p ( j )
where p(j) represents the prior distribution of the change point location τ assumed to follow a uniform distribution; that is, p(j) = 1/(n − 1), j = 1,..., n − 1. Thus, Equation (12) is as follows:
π τ | X ,   μ 1 , μ 2 = L X | τ ,   μ 1 , μ 2 1 n 1 L X | j ,   μ 1 , μ 2

2.5. Mann–Whitney U Test

The classical nonparametric Mann–Whitney U test is used in this study to examine the significance of the difference in the large-scale environmental variables in the three subperiods [50,51]. The Mann–Whitney U statistics can then be calculated. This study employs the classical nonparametric Mann–Whitney U test to assess the significance of differences in large-scale environmental variables [50,51,52]. The formula is as follows:
U 1 = n 1 n 2 + n 1 n 1 + 1 2 R 1
U 2 = n 1 n 2 + n 2 n 2 + 1 2 R 2
where R 1 and R 2 represent the sums of the ranks in subsamples, and n 1 and n 2 are the sizes of subsamples. The U statistics at each grid point are compared with their corresponding critical values to ascertain whether the null hypothesis, which posits that the two samples originate from identical distributions, should be refuted [5].

3. Results

3.1. Interdecadal Variations in TC Damage

3.1.1. Interdecadal Variations in PDI and SDP

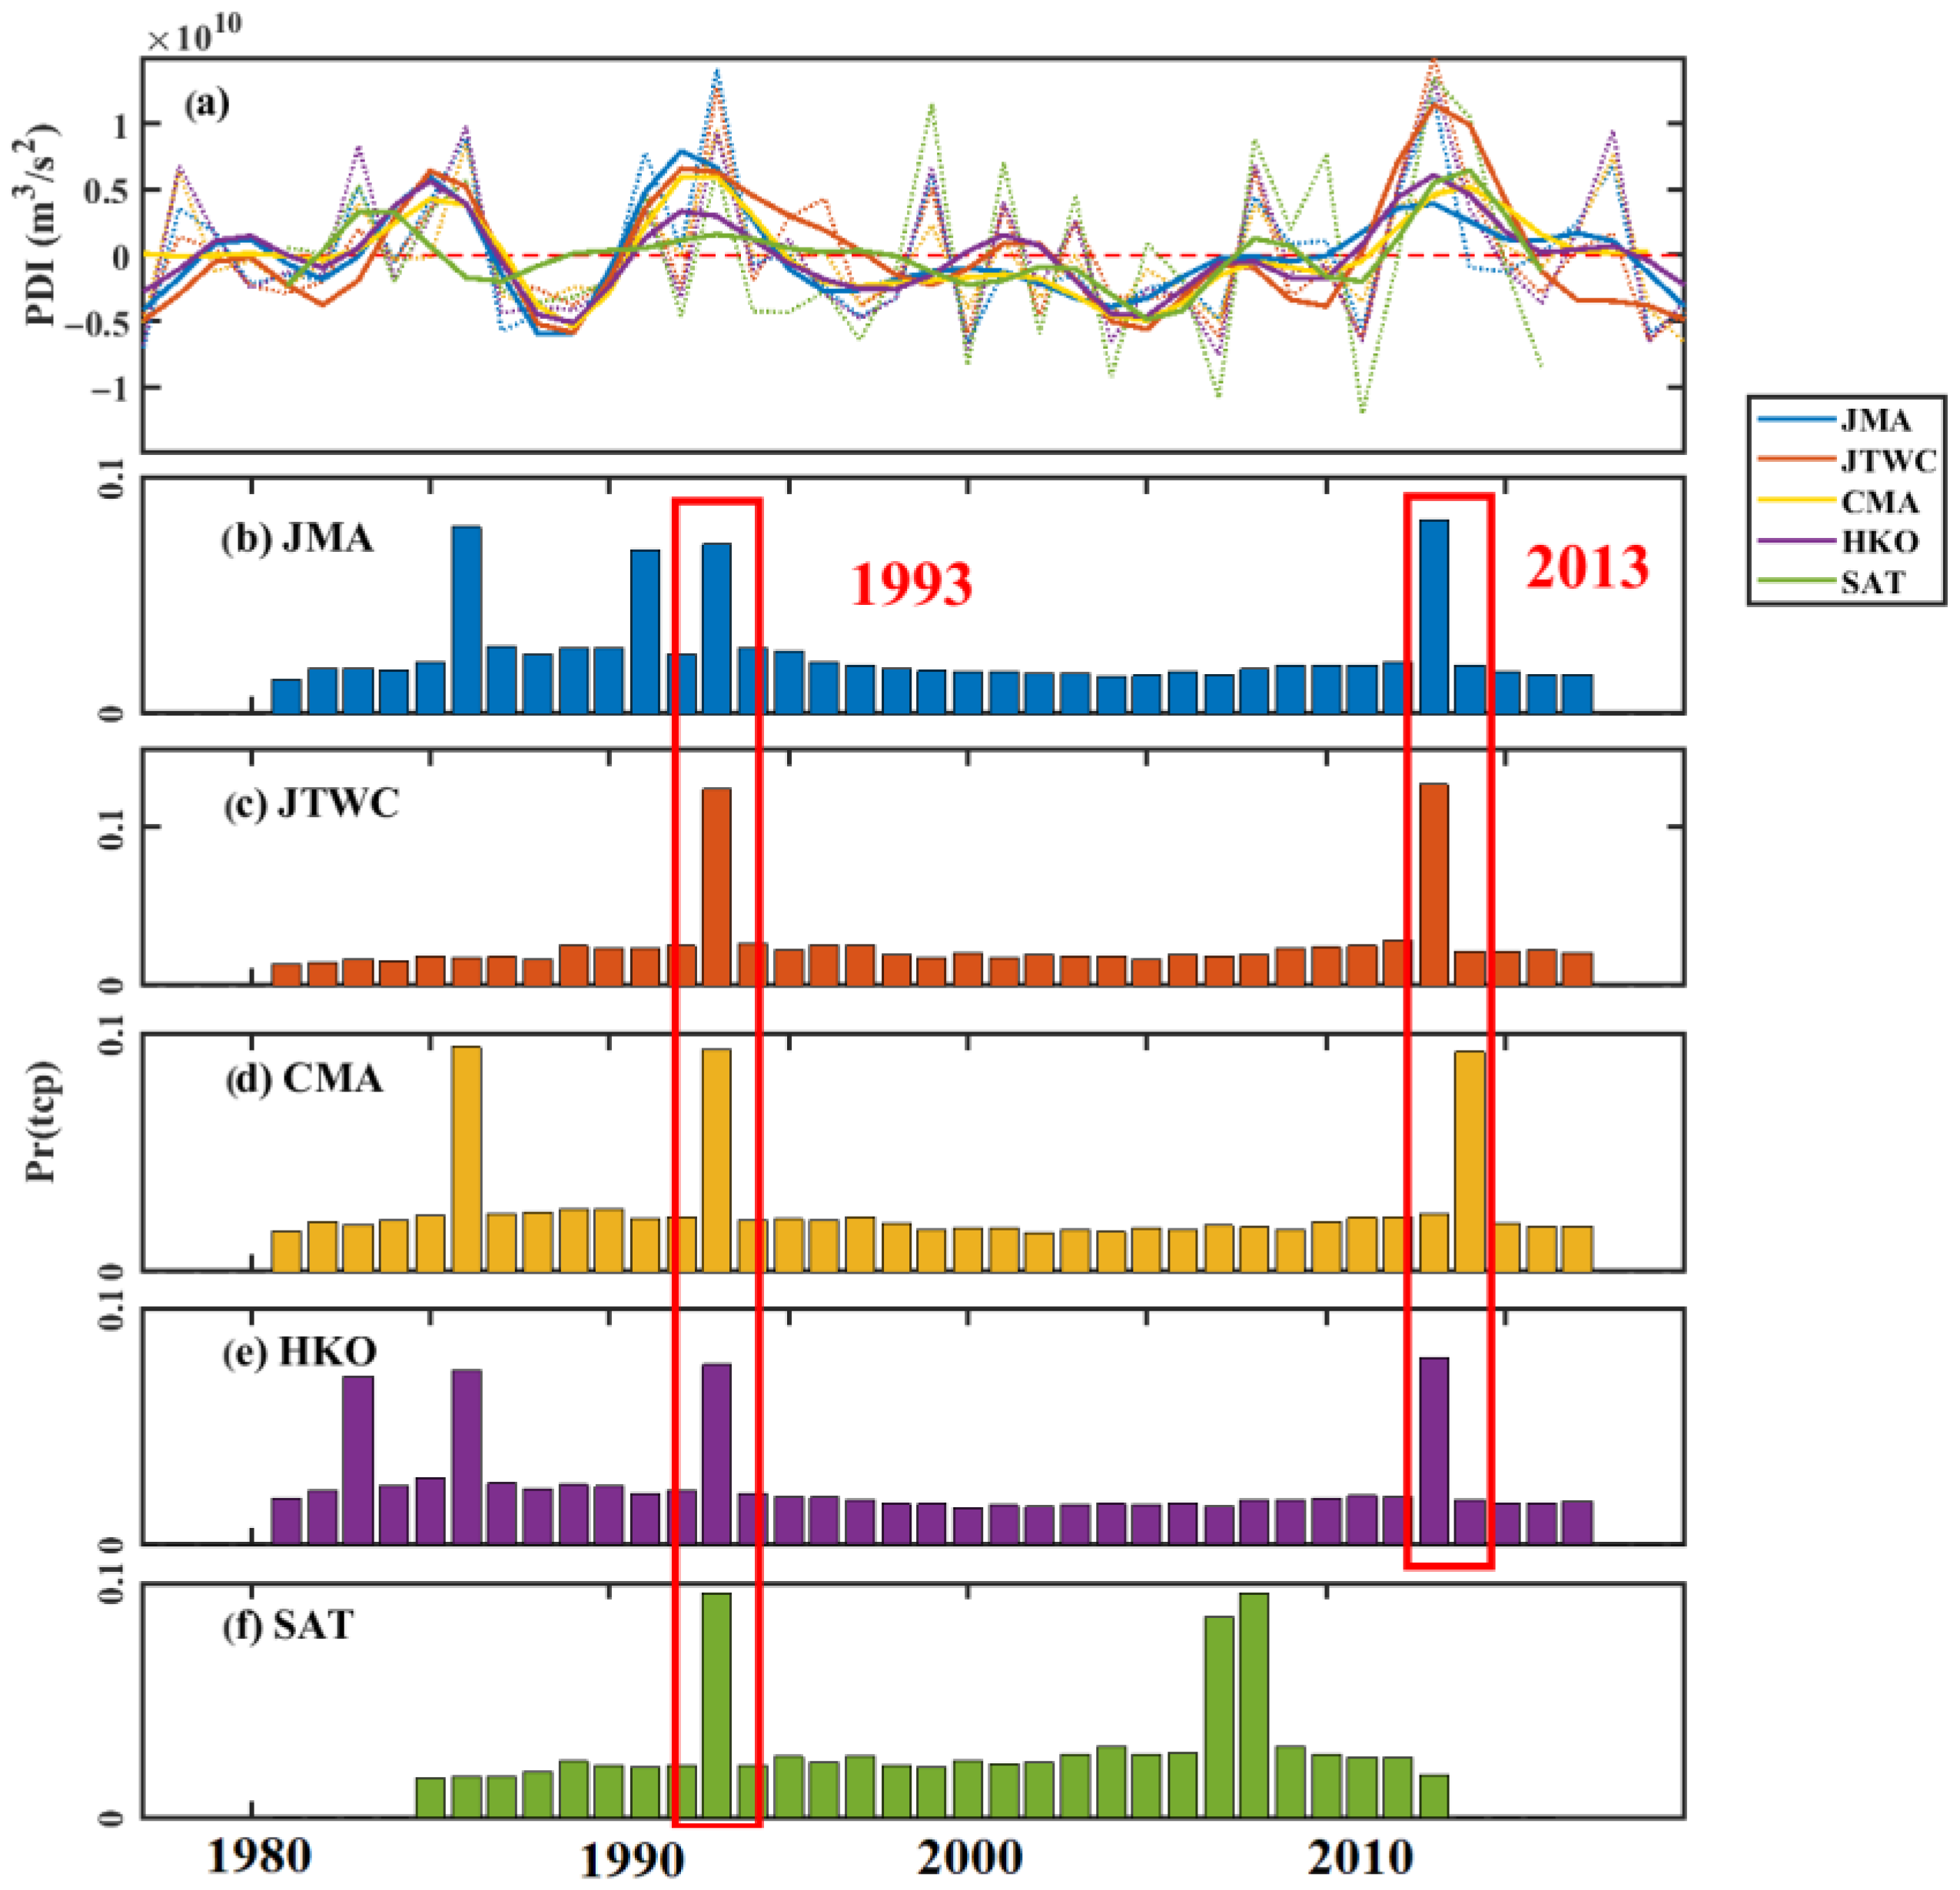
To measure the wind-induced damage of the TCs in the buffer zone, the zero-mean detrended annual PDI values during 1977–2020 in the TC season from five datasets are shown in Figure 3a. To obtain the interdecadal signal, a 5-year low-pass filter is applied to the annual PDI. The correlation analysis between the time series data from the five institutions reveals significant values, all greater than 0.8. This indicates a strong correlation between the datasets. The analysis shows an apparent decrease in the PDI starting from the mid-1990s and continuing till the mid-2010s. This decline in the PDI is consistent across all five datasets and is considered robust.
We employed the Bayesian change point method to calculate the posterior probabilities of each observation serving as a potential changepoint, enabling us to objectively detect any sudden changes in the TC PDI (Figure 3b–f). The analysis results indicate a posterior probability of a shift in 1993 and subsequently in 2013 (except for the data in the CMA, where the second abrupt change year is 2014). For the convenience of statistics, the abrupt change point is set at 2013. This suggests that it is more likely for the changes to occur during the period of 1994–2012.
The zero-mean detrended SDP measuring the storm surge damage is shown in Figure 4a. The annual signal and 5-year low-pass filter signals are all depicted. Similar to the PDI, the SDP exhibited a consistent decline from the mid-1990s to the mid-2010s. This decrease is observed in both the CMA and JMA datasets. To validate the reliability of the CMA and JMA data, the QSCAT-R and JTWC datasets are utilized. The significant positive correlation between the CMA and JTWC (QSCAT-R) reaches 0.6 (0.8), and the significant positive correlation between the JMA and JTWC (QSCAT-R) reaches 0.5 (0.6); they have similar performances.
Since the time length in the CMA and JMA is longer than that in the QSCAT-R and JTWC, and because they show conformance, the results of the CMA and JMA are used in the analysis (Figure 4b,c). Although the time length for the SDP is shorter than that for the PDI, abrupt change points can be detected in 1993 and 2013. This implies that not only wind-induced damage in the buffer zone of the GBA but also the risk of storm surge were heightened during the period of 1977–1993 and after 2013. Conversely, during the period of 1994–2012, the wind-induced damage and storm surge risk were weakened.
The abrupt changes in the PDI and SDP index in the buffer zone encouraged us to categorize them into three subperiods. There are significant interdecadal variations observed in the TC damage assessment within the buffer zone, with two high-damage periods (1977–1993 and 2013–2020, represented by P1 and P3 hereafter, respectively) and a low-damage period (1994–2012, represented by P2 hereafter). Table 1 and Table 2 provide an overview of the PDI and SDP values for the three subperiods. The PDI values in P1 and P3 are 0.3 × 10¹⁰ m3/s2 higher compared to P2 almost in all the five datasets. Likewise, the SDP values in P1 and P3 exceed 20, while the mean value in P2 falls below this threshold in both the CMA and JMA datasets. Moreover, the SDP value in P3 slightly surpasses that in P1.

3.1.2. The Performance of Different Incorporated Parameters in Three Epochs

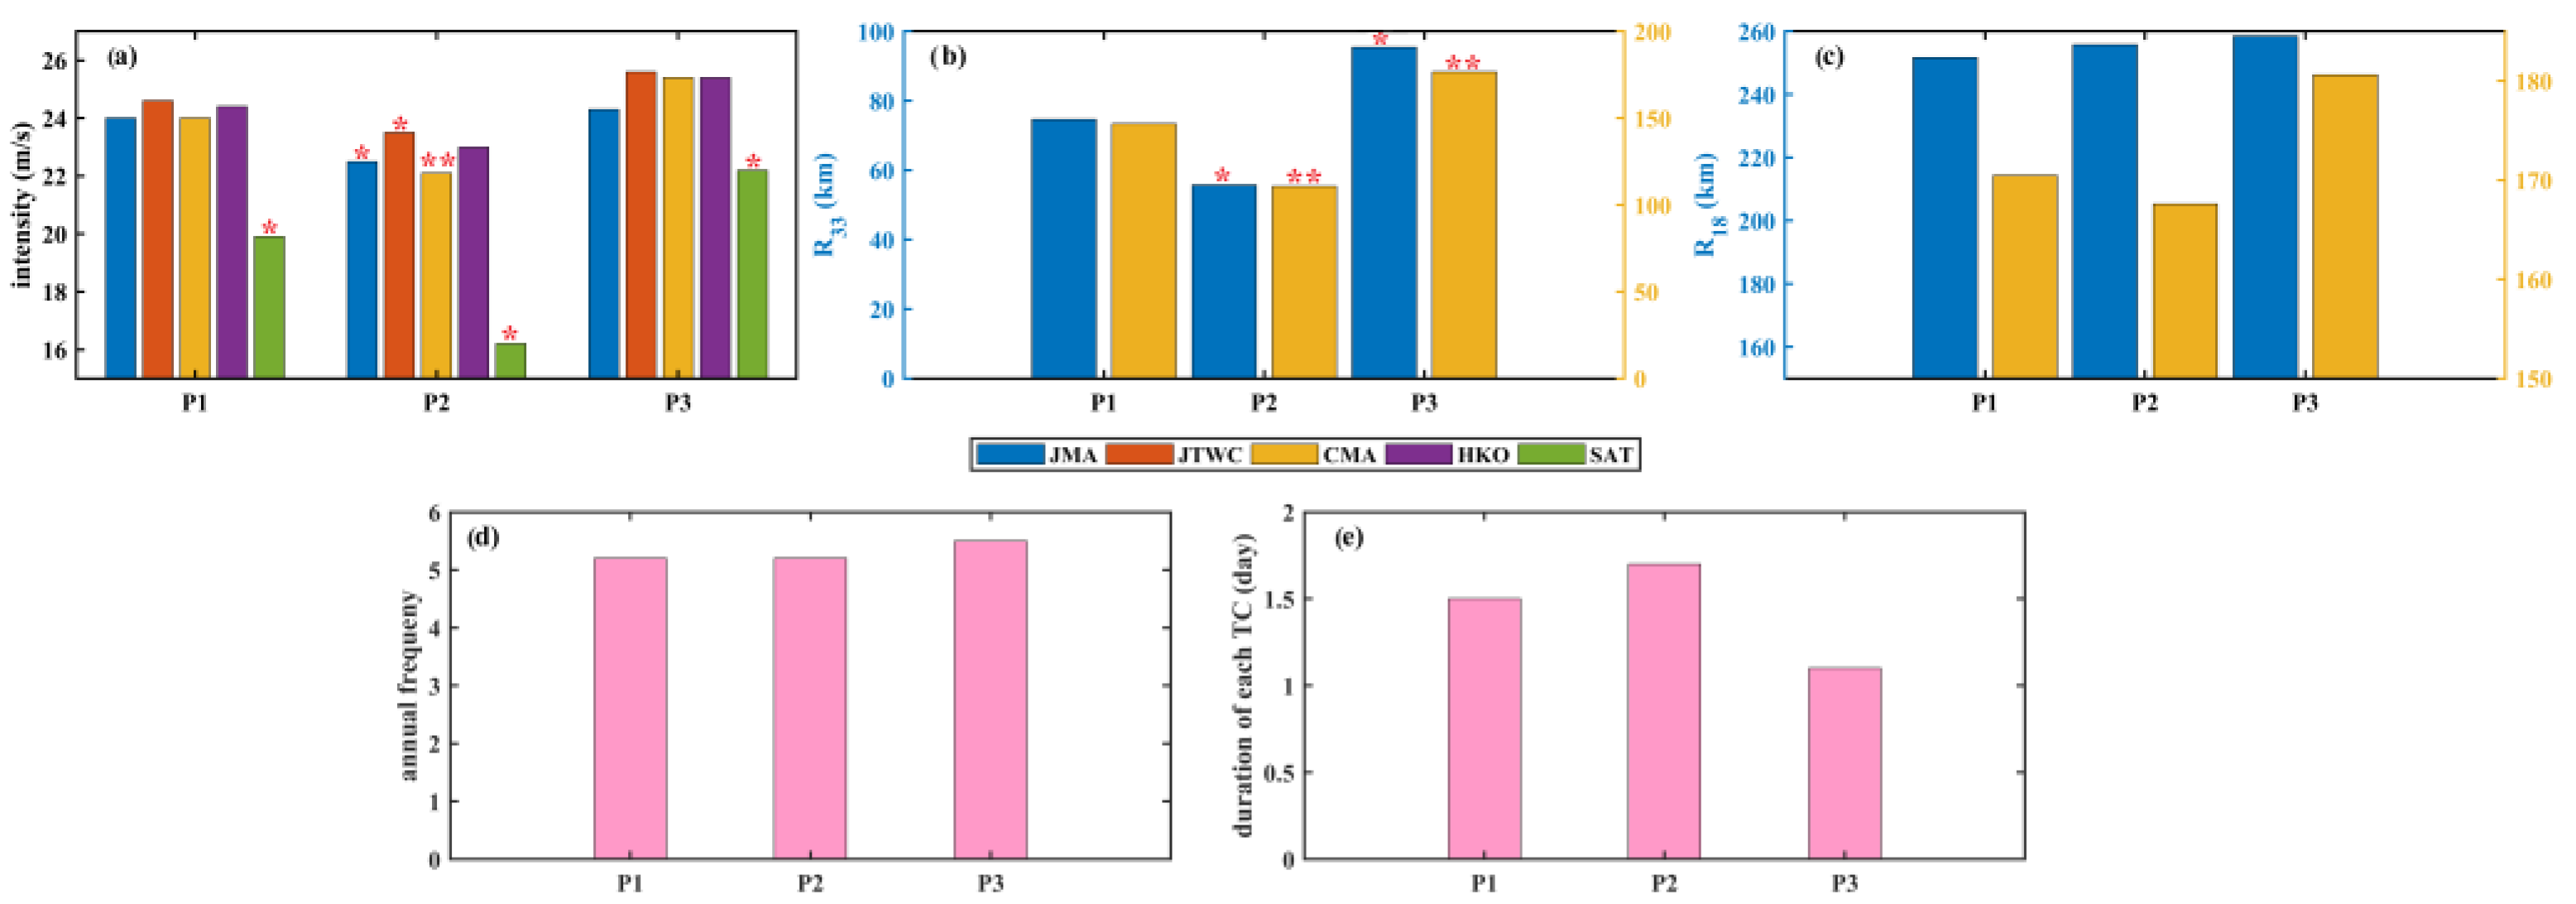
Section 2.3 suggests that the PDI is related to the TC intensity, duration and frequency in the buffer zone, and that the SDP is linked to the TC size ( R 18 and R 33 ), duration and frequency. Figure 5 shows the mean state of these associated parameters in the three subperiods. This includes the TC intensity in the buffer zone, the TC size ( R 18 and R 33 ), the annual frequency of the TCs entering the buffer zone and the duration of each TC in the buffer zone. Not only is the TC intensity in P2 significantly lower than that in P1 and P3 in all datasets, but R 33 also exhibits the same trend. These factors are crucial in the interdecadal variations of wind-induced damage and storm surge risk. However, R 18 in the CMA for P2 is slightly smaller than that for P1 and P3, while R 18 in the JMA shows a consistent increase over time. This implies that the size of stronger TCs has interdecadal changes, while the size of weak TCs does not. On the contrary, the duration in the buffer zone of each TC in P2 is longer than that in P1 and P3, and the annual frequency shows no difference. These parameters cannot account for the interdecadal variations in the TC damage. Thus, it can be concluded that the intensity and size of stronger TCs are the main drivers of the interdecadal changes in the TC damage.

3.2. Possible Mechanisms

3.2.1. Environmental Factor

It has been known that the interdecadal changes in the TC damage in the buffer zone can mainly be attributed to the variations in the intensity and size of stronger TC events. Many studies proved that the TC intensity has a close positive relationship with the TC size [53,54]. Convective activities driven by large-scale environmental factors play an important role in regulating the TC intensity and size [1,2,55,56,57,58,59,60]. This section evaluates various dynamic and thermodynamic parameters related to TCs to unravel the mechanisms behind this association.
Figure 6a,b show the composite difference in SST between the high- and low-damage periods. The long-term trend in the SST is removed. It is evident that the SST in P1 is 0.1 °C higher than that in P2 along 20° N and the northern SCS, where the buffer zone is situated. In P3, this temperature difference can reach as high as 0.3 °C. Numerous observational experiments and numerical studies have shown that the formation and development of TCs are accompanied by significant changes in the ocean thermodynamic structure, with the most apparent phenomenon being the change in SST. The development of TCs is accompanied by an increase in surface wind stress, which increases the energy provided by high SST in the form of heat fluxes and moisture transport, thereby enabling TCs to continue to develop. Thus, the higher SST in the high-damage periods favors more the TC development and intensity in the buffer zone than in the low-damage period, especially in P3.
Figure 6c,d present the situation of surface latent heat flux (SLHF, negative represents the heat transport from surface to atmosphere). The SLHF in the SCS displays a significantly greater negative value reaching −5 W/m2 in the high-damage periods compared to the low-damage period. Similar to the SST, the negative magnitude in P3 is greater than in P1. The SLHF is affected by the SST and surface wind. The SST is higher in the high-damage periods in the north of the SCS which can transport more heat from the ocean to the atmosphere locally. The difference in the SLHF values between the high- and low-damage periods in the south of the SCS may be explained by the 10 m wind (Figure 7). The climatological mean from June to November of the 10 m wind is shown in Figure 7a, southwest wind appears in the south of the SCS, and east wind appears in the north of the SCS (quiver). The absolute wind speed (shading) in the SCS is higher, with the utmost value at 10° N, 110° E. Figure 7b,c exhibit an enhanced rate of the 10 m wind in the south of the SCS in the high-damage period. This increased wind rate facilitates the transfer of more heat flux from the sea to the atmosphere. Consequently, when more latent heat is released from the sea in the high-damage period, it induces an upward motion and transports the water vapor and heat to TCs in the buffer zone.
Figure 6e,f show the difference of 500 hPa in relative humidity (RH). Compared with P2, RH shows a significant increase of 1.5% in the northwest of the SCS in P1, while the increase in this value in P3 is 2.5%. Compared with the difference in the SST values (Figure 6a,b), the increased region of the difference in RH is the same as that of SST, i.e., the higher SST in the north of the SCS in the high-damage periods favor the increase in the overhead RH. In addition, RH in the southern SCS is also increased. The buffer zone is located in the area where humidity increases during the high-damage period. The high mid-level relative humidity can raise the intensity of the TC events in the buffer zone.
Other environmental factors, such as 200–850 hPa vertical wind shear, are investigated; however, they are not the key factors that regulate the three stages. In general, in the high-damage periods, the higher SST and more latent heat content from the sea surface to the atmosphere near the buffer zone can enhance the low-level water vapor convergence and strengthen the upward motion; more water vapor may be transported to the mid layer. These large-scale environmental conditions all contribute to the development of TC events in the buffer zone, and vice versa in the low-damage period. Moreover, these factors are more favorable in P3 than in P1, which is the reason why the TC intensity in the buffer zone in P3 is a little higher compared to P1.

3.2.2. TC Translation Speed

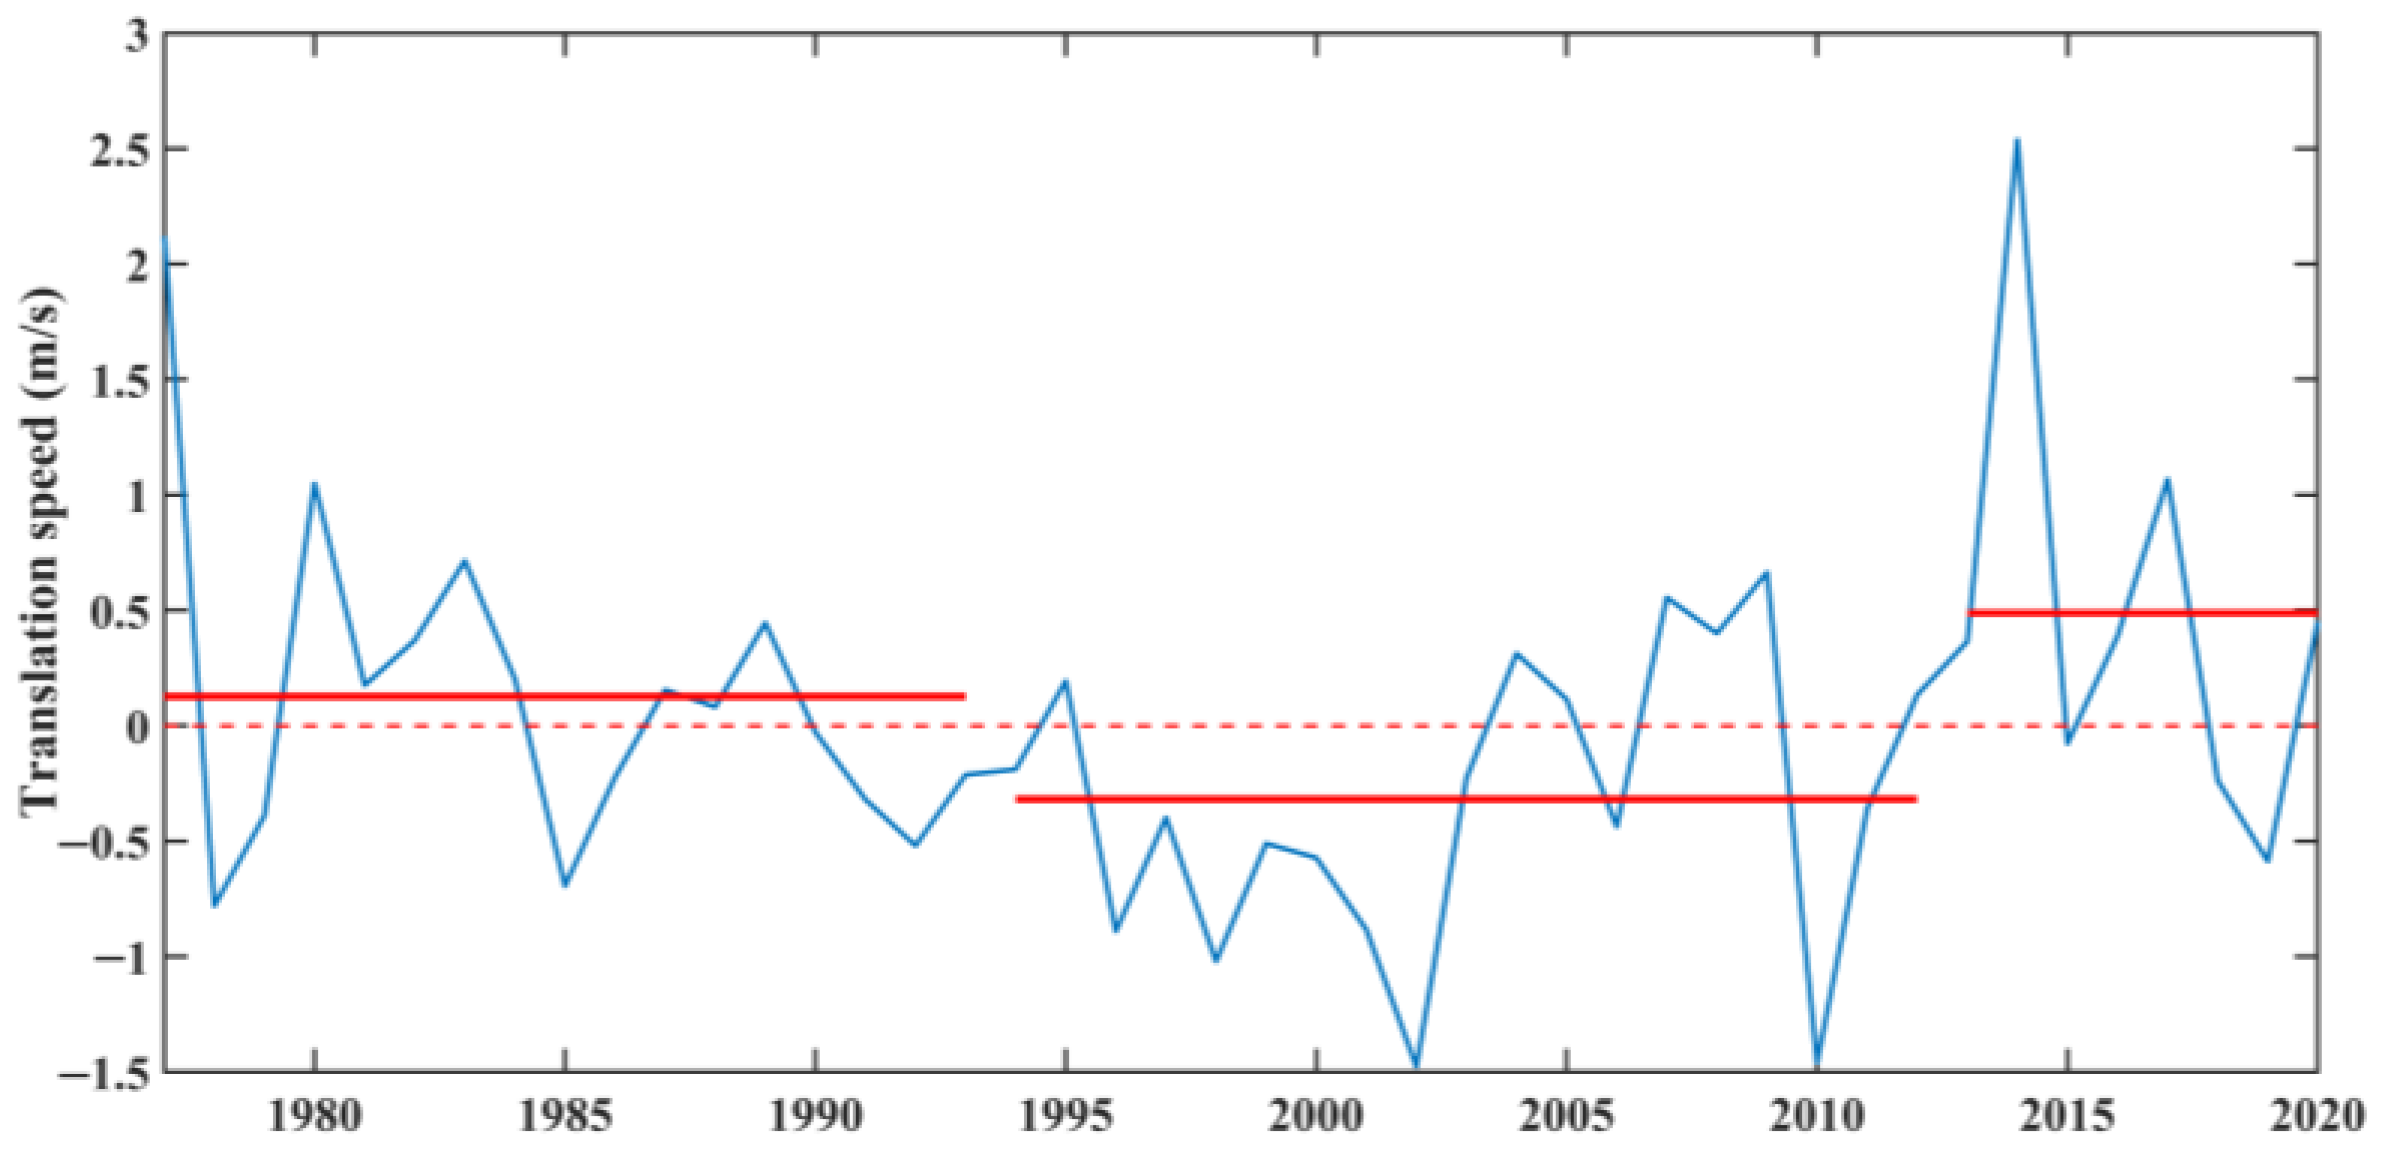
Apart from the environmental factors, the TC translation speed can influence TC development [17,61,62]. The slowdown of the TC movement will inhibit the TC intensification. The zero-mean detrended annual translation speed of the target TC clusters is shown in Figure 8. It shows that the translation speed during the TC lifespan in the high-damage periods is higher than zero, while it is lower than zero in the low-damage period. The translation speed shows the highest mean value during P3. The mean value in P1 is 0.4 m/s lower than in P3, and 0.5 m/s higher than in P2. The slowdown movement of TCs results in more energy being transported from the TC to the sea waters underneath. Consequently, this causes increased mixing in the upper ocean, leading to enhanced cooling of the sea surface. Eventually, the intensity of the heat flux from the sea to the TC decreases, thereby hampering the TC from becoming stronger. This is another factor that regulates the intensity in the three epochs.

4. Discussion

4.1. The Relationship between the NSCS SST and Luzon Strait Transport

Based on the discussion above, it has been observed that the SST near the Luzon Strait and the northern SCS (NSCS, in the region of 105–120° E, 10–25° N) in the high-damage periods was higher than that in the low-damage period. Some researchers report that the interdecadal changes in SST are related to the PDO [63,64]. As an extension, we further investigated the relationship between the PDO and NSCS’s SSTs, revealing a weak correlation of only 0.2. The weak correlation suggests that the PDO is not the immediate cause of the changes in the NSCS’s SST, and other dominant factors should be explored. Some studies reported that the relatively warm upper water from the western Pacific is transported through the Luzon Strait into the SCS and affects the SCS’s SST [65,66]. Further analysis showed that the SST in the NSCS during the TC season is related to the Luzon Strait transport from December (−1) to March. The normalized time series of the Luzon Strait transport and the SST in the NSCS are shown in Figure 9. The Luzon Strait transport is determined by calculating the net flow across 120.5° E from December (−1) to March in the upper layer (0–1000 m). Negative values in the pink line indicate the strengthening of the Luzon Strait transport to the SCS (westward transport) and vice versa. A clear opposition in phases can be observed between the Luzon Strait transport and the NSCS’s SST, with a significant correlation of −0.4. Previous research suggests that the Luzon Strait transport volume is dominated by ENSO and PDO [67,68,69].

4.2. TC Translation Speed Modulated by Steering Flow in the SCS

The TC movement has an influence on the TC intensity. Shan et al. [17] found that the TC movement speed in the SCS from July to September during the period from the early 1990s to the early 2000s was lower than at other times. The authors also pointed out that the interdecadal changes in the TC translation speed were primarily caused by the variations in the steering flow over the SCS, which is driven by the zonal SST gradient between the NIO and the WNP ocean basins. Here, the mid-level steering flow is shown in Figure 10. The steering flow signal is detrended. In P2, a significant decrease of approximately 0.3 m/s in the steering flow is observed in the northern SCS, indicating the western wind anomalies here. The region is the aim of the TC clusters that often pass through. The steering flow causes a slowdown in the TC movement during the low-damage period but promotes higher TC translation speed during the periods of high damage, especially in P3. This finding explains the variation in the TC translation speed as depicted in Figure 8.

4.3. Significance and Innovation of This Study

Zheng and Wang [9] studied the interdecadal variations in the intensity of TCs in the SCS and found that the intensity from 1994 to 2002 was lower than that of other periods. They attributed the interdecadal variations in intensity to the location of TCs and the vertical water vapor transport in the SCS. Previous studies have investigated the long-term changes in the intensity and PDI of TCs that have made landfall in southern China. Some studies have found no significant trends in the intensity or PDI [19,70], while Liu and Chan [8,18] studied the destructive power of TCs when they made landfall in southern China and found that the destructive power during landfall was lower than at other times during the period from 1997 to 2011. The factors that regulate the interdecadal changes in the destructive power of TCs when they make landfall are changes in vertical wind shear and ocean thermal potential [8,18,71].
Compared to the above research, this study focuses more on TC events within 300 km of the GBA region. Based on the collective experience of forecasters, it has been observed that in coastal cities, when the distance between a TC event and a specific location is 300 km or less, the city experiences distinct strong winds. Additionally, there is a noticeable rise in the tide level during such occurrences. These conditions contribute to wind-induced damage and pose storm surge hazards associated with TCs. Consequently, it becomes imperative to remain vigilant and continuously monitor the evolving nature of the TCs. If we do not pay more attention to such tropical cyclone events, inadequate preparations may bring serious storm surge and wind disasters to coastal cities. The importance of studying the changes in these particularly hazardous types of TC events is as significant as the importance of studying them at the time of landfall. In addition, previous studies mainly focused on the destructive wind power of TCs, while we not only focused on the destructive power generated by wind but also on the harm caused by storm surge. For the analysis of the underlying regulation mechanisms, most predecessors attributed the interdecadal changes in the landfall intensity in South China to the vertical wind shear and ocean thermal potential. However, we found that the regulation of the vertical moisture transport above the GBA affects the intensity and scale of TCs. On the contrary, due to the change in the region, the effect of vertical wind shear is not obvious. In addition to environmental factors, it has been observed that the movement speed of TCs plays a significant role in regulating their intensity and scale.
Therefore, this study highlights the importance of the TC pre-landfall and post-landfall periods, as well as emphasizes the significance of storm surge. Additionally, we provide a new interpretation of the influencing factors regulating the interdecadal changes in the TC damage in the GBA.

5. Conclusions

The impact of TC clusters on the GBA results in significant losses and damages to society, including wind-induced disasters and the risk of storm surges. Thus, it is urgent to understand the variations of TC damage in the GBA. In this study, PDI and SDP are used to estimate the wind-induced damage and storm surge risk in the buffer zone of the GBA, respectively. Assisted by six datasets, we found that the two regime shifts in the PDI and SDP occurred in 1993 and 2013. Further investigation revealed that these shifts can be attributed to variations in SST, the vertical transport system of heat and moisture and the translation speed of TCs (Table 3 and Figure 11).
Based on the application of change point detection algorithms to several TC datasets (including datasets from the Japan Meteorological Agency, the Joint Typhoon Warning Center, the China Meteorological Administration–Shanghai Typhoon Institute and the Hong Kong Observatory, as well as the QuikSCAT Tropical Cyclone Radial Structure Dataset and the Advanced Dvorak Technique–Hurricane Satellite (HURSAT)-B1 dataset), two high-damage periods (P1: 1977–1993; and P3: 2013–2020) and the low-damage period (P2: 1994–2012) were identified. Further investigation revealed that the TC intensity in the low-damage period was lower than that in the high-damage periods, and the size of stronger TCs had the same impact. This can be attributed to the influences of SST around the GBA, latent heat flux and mid-level relative humidity. During the high-damage periods, TCs acquire more energy from the ocean, resulting in increased intensity and size. Conversely, during the low-damage period, TCs receive less energy from the sea, leading to lower intensity and smaller size. In addition, the TC translation speed in the low-damage period is lower, which increases the total momentum transported from the TCs to the sea waters. This is unfavorable for the development of TCs. The variation in SST around the buffer zone of the GBA is relative to the Luzon Strait transport, and the TC translation speed is regulated by the mid-level steering flow in the northern SCS.

Author Contributions

M.Z.: study design, data analysis, data interpretation, writing—original draft; L.M.: writing—review and editing; W.L.: writing—review and editing; F.W.: writing—review and editing; Y.L.: writing—review and editing. All authors have read and agreed to the published version of the manuscript.

Funding

This research was funded by the Shenzhen Science and Technology Program under KCXFZ20211020164015024 and the Shenzhen Fundamental Research Program under JCYJ20200109110220482.

Institutional Review Board Statement

Not applicable.

Informed Consent Statement

Not applicable.

Data Availability Statement

The International Best Track Archive for Climate Stewardship (IBTrACS)’s data are from https://www.ncei.noaa.gov/data/international-best-track-archive-for-climate-stewardship-ibtracs/v04r00/access/netcdf/ (25 July 2023). The QuikSCAT Tropical Cyclone Radial Structure Dataset (QSCAT-R) is from https://verif.rap.ucar.edu/tcdata/quikscat/dataset/ (25 July 2023). The HURSAT-B1 data are from https://www.ncei.noaa.gov/data/hurricane-satellite-hursat-b1/archive/v06/ (25 July 2023). The ERA5 dataset is from the European Centre for Medium-Range Weather Forecast (https://cds.climate.copernicus.eu/#!/search?text=ERA5&type=dataset) (25 July 2023). The ORAS5 data are from https://cds.climate.copernicus.eu/cdsapp#!/dataset/reanalysis-oras5?tab=overview (25 July 2023).

Conflicts of Interest

The authors declare no conflict of interest.

References

  1. Emanuel, K. Environmental factors affecting tropical cyclone power dissipation. J. Clim. 2007, 20, 5497–5509. [Google Scholar] [CrossRef]
  2. Emanuel, K. Increasing destructiveness of tropical cyclones over the past 30 years. Nature 2005, 436, 686–688. [Google Scholar] [CrossRef] [PubMed]
  3. Yang, L.; Du, Y.; Xie, S.; Wang, D. An interdecadal change of tropical cyclone activity in the South China Sea in the early 1990s. Chin. J. Oceanol. Limnol. 2012, 30, 953–959. [Google Scholar] [CrossRef]
  4. Ha, Y.; Zhong, Z.; Sun, Y.; Lu, W. Decadal change of South China Sea tropical cyclone activity in mid-1990s and its possible linkage with intraseasonal variability. J. Geophys. Res.-Atmos. 2014, 119, 5331–5344. [Google Scholar] [CrossRef]
  5. Zhou, W.; Li, R.C.Y. Interdecadal change in South China Sea tropical cyclone frequency in association with zonal sea surface temperature gradient. J. Clim. 2014, 27, 5468–5480. [Google Scholar] [CrossRef]
  6. Ha, Y.; Zhong, Z. Decadal change in tropical cyclone activity over the South China Sea around 2002/03. J. Clim. 2015, 28, 5935–5951. [Google Scholar] [CrossRef]
  7. Li, H.; Xu, F.; Sun, J.; Lin, Y.; Wright, J.S. Subtropical high affects interdecadal variability of tropical cyclone genesis in the South China Sea. J. Geophys. Res.-Atmos. 2019, 124, 6379–6392. [Google Scholar] [CrossRef]
  8. Liu, K.S.; Chan, J.C.L. Recent increase in extreme intensity of tropical cyclones making landfall in South China. Clim. Dynam. 2020, 55, 1059–1074. [Google Scholar] [CrossRef]
  9. Zheng, M.; Wang, C. Interdecadal changes of tropical cyclone intensity in the South China Sea. Clim. Dynam. 2023, 60, 409–425. [Google Scholar] [CrossRef]
  10. Mok, D.K.H.; Chan, J.C.L.; Chan, K.T.F. A 31-year climatology of tropical cyclone size from the NCEP Climate Forecast System Reanalysis. Int. J. Climatol. 2018, 38, e796–e806. [Google Scholar] [CrossRef]
  11. Weng, H.; Wu, G.; Liu, Y.; Behera, S.K.; Yamagata, T. Anomalous summer climate in China influenced by the tropical Indo-Pacific Oceans. Clim. Dynam. 2009, 36, 769–782. [Google Scholar] [CrossRef]
  12. Chen, W.; Yang, S.; Wu, Z.; Cai, F. Large-scale atmospheric features favoring the tropical cyclone activity affecting the Guangdong–Hong Kong–Macao Greater Bay Area of China. Environ. Res. Lett. 2022, 17, 104057. [Google Scholar] [CrossRef]
  13. Wu, L.; Zhao, H.; Wang, C.; Cao, J.; Liang, J. Understanding of the effect of climate change on tropical cyclone intensity: A review. Adv. Atmos. Sci. 2022, 39, 205–221. [Google Scholar] [CrossRef]
  14. Moon, I.J.; Kim, S.H.; Chan, J.C.L. Climate change and tropical cyclone trend. Nature 2019, 570, E3–E5. [Google Scholar] [CrossRef]
  15. Quiring, S.; Schumacher, A.; Labosier, C.; Zhu, L. Variations in mean annual tropical cyclone size in the Atlantic. J. Geophys. Res. 2011, 116, D9. [Google Scholar] [CrossRef]
  16. Cao, X.; Wu, R.; Zhan, Y. Re-examining the decadal change of tropical cyclogenesis over the South China Sea around the mid-1990s. Int. J. Climatol. 2019, 39, 3188–3200. [Google Scholar] [CrossRef]
  17. Dong, W.; Feng, Y.; Chen, C.; Wu, Z.; Xu, D.; Li, S.; Xu, Q.; Wang, L.; Beardsley, R.C.; Lin, H.; et al. Observational and modeling studies of oceanic responses and feedbacks to typhoons Hato and Mangkhut over the northern shelf of the South China Sea. Prog. Oceanogr. 2021, 191, 102507. [Google Scholar] [CrossRef]
  18. Shan, K.; Chu, P.-S.; Yu, X. Interdecadal change of tropical cyclone translation speed during peak season in South China Sea: Observed evidence, model results, and possible mechanism. J. Clim. 2023, 36, 4531–4541. [Google Scholar] [CrossRef]
  19. Liu, K.S.; Chan, J.C.L. Variations in the power dissipation index in the East Asia region. Clim. Dynam. 2016, 48, 1963–1985. [Google Scholar] [CrossRef]
  20. Li, R.C.Y.; Zhou, W.; Shun, C.M.; Lee, T.C. Change in destructiveness of landfalling tropical cyclones over China in recent decades. J. Clim. 2017, 30, 3367–3379. [Google Scholar] [CrossRef]
  21. Luo, X.; Yang, L.; Chen, S.; Liang, D.; Chan, J.C.L.; Wang, D. The decadal variation of eastward-moving tropical cyclones in the South China Sea during 1980–2020. Geophys. Res. Lett. 2022, 49, e2021GL096640. [Google Scholar] [CrossRef]
  22. Xuan, J.; Ding, R.; Zhou, F. Storm surge risk under various strengths and translation speeds of landfalling tropical cyclones. Environ. Res. Lett. 2021, 16, 124055. [Google Scholar] [CrossRef]
  23. Leung, H.-S. Storm Surge Hazard in Hong Kong under Global Climate Changes. HKU Theses Online (HKUTO). 2011. Available online: https://www.airitilibrary.com/Publication/alDetailedMesh1?DocID=U0029-1812201200019956 (accessed on 6 September 2023).
  24. Ji, T.; Li, G.; Liu, Y.; Liu, R.; Zhu, Y. Spatiotemporal features of storm surge activity and its response to climate change in the southeastern coastal area of China in the past 60 years. J. Geophys. Res.-Atmos. 2021, 126, e2020JD033234. [Google Scholar] [CrossRef]
  25. Liu, K.S.; Chan, J.C.L.; Kubota, H. Meridional oscillation of tropical cyclone activity in the western North Pacific during the past 110 years. Clim. Chang. 2021, 164, 23. [Google Scholar] [CrossRef]
  26. Liu, L.; Wang, Y.; Zhan, R.; Xu, J.; Duan, Y. Increasing destructive potential of landfalling tropical cyclones over China. J. Clim. 2020, 33, 3731–3743. [Google Scholar] [CrossRef]
  27. Yin, Y. Analysis on the characteristics of typhoon affecting Shenzhen City from 1961 to 2018. Adv. Meteor. Sci. Technol. 2022, 12, 50–54. [Google Scholar]
  28. Mingjie, W.; Xiaoli, Z.; Xiaoya, Z.; Yuanzhao, C. Changes in disastrous weather climate events in Shenzhen of Guangdong Province during 1953–2005. Adv. Clim. Chang. Res. 2007, 3, 350–355. (In Chinese) [Google Scholar]
  29. Zhuo, J.; Tan, Z. Physics-augmented deep learning to improve tropical cyclone intensity and size estimation from satellite imagery. Mon. Weather Rev. 2021, 149, 2097–2113. [Google Scholar] [CrossRef]
  30. Knapp, K.R.; Kruk, M.C. Quantifying Interagency differences in tropical cyclone best-track wind speed estimates. Mon. Weather Rev. 2010, 138, 1459–1473. [Google Scholar] [CrossRef]
  31. Yan, Z.; Ping, Z. Comparison of tropical cyclone datasets and a data-correction scheme for data from TC yearly book. J. Trop. Meteorol. 2009, 25, 295–299. [Google Scholar]
  32. Park, D.-S.R.; Ho, C.-H.; Kim, J.-H.; Kim, H.-S. Strong landfall typhoons in Korea and Japan in a recent decade. J. Geophys. Res. 2011, 116, D7. [Google Scholar] [CrossRef]
  33. Von Storch, H.; Feser, F.; Barcikowska, M. Usability of best track data in climate statistics in the Western North Pacific. Mon. Weather Rev. 2012, 140, 2818–2830. [Google Scholar] [CrossRef]
  34. Xiang, B.; Dong, X.; Li, Y. Climate change trend and causes of tropical cyclones affecting the South China Sea during the past 50 years. Atmos. Ocean. Sci. Lett. 2020, 13, 301–307. [Google Scholar] [CrossRef]
  35. Imaoka, K.; Spencer, R.W. Diurnal variation of precipitation over the tropical oceans observed by TRMM/TMI combined with SSM/I. J. Clim. 2000, 13, 4149–4158. [Google Scholar] [CrossRef]
  36. Lu, X.; Yu, H.; Yang, X.; Li, X. Estimating tropical cyclone size in the Northwestern Pacific from geostationary satellite infrared images. Remote Sens. 2017, 9, 728. [Google Scholar] [CrossRef]
  37. Kossin, J.P.; Knapp, K.R.; Vimont, D.J.; Murnane, R.J.; Harper, B.A. A globally consistent reanalysis of hurricane variability and trends. Geophys. Res. Lett. 2007, 34, L04815. [Google Scholar] [CrossRef]
  38. Ansari, S.; Knapp, K.R.; Bain, C.L.; Bourassa, M.A.; Dickinson, M.J.; Funk, C.; Helms, C.N.; Hennon, C.C.; Holmes, C.D.; Huffman, G.J.; et al. Globally gridded satellite observations for climate studies. Bull. Am. Meteorol. Soc. 2011, 92, 893–907. [Google Scholar] [CrossRef]
  39. Knapp, K.R. Calibration Assessment of ISCCP geostationary infrared observations using HIRS. J. Atmos. Ocean. Technol. 2008, 25, 183–195. [Google Scholar] [CrossRef]
  40. Knapp, K. Scientific data stewardship of international satellite cloud climatology project B1 global geostationary observations. J. Appl. Remote Sens. 2008, 2, 023548. [Google Scholar] [CrossRef]
  41. Kossin, J.P.; Olander, T.L.; Knapp, K.R. Trend analysis with a new global record of tropical cyclone intensity. J. Clim. 2013, 26, 9960–9976. [Google Scholar] [CrossRef]
  42. Kossin, J.P.; Emanuel, K.A.; Vecchi, G.A. The poleward migration of the location of tropical cyclone maximum intensity. Nature 2014, 509, 349–352. [Google Scholar] [CrossRef]
  43. Liang, M.; Xu, J.; Chan, J.C.L.; Liu, C.; Xu, H. How does the onset time of El Niño events affect tropical cyclone genesis and intensity over the western North Pacific? Int. J. Climatol. 2021, 42, 1–16. [Google Scholar] [CrossRef]
  44. Chen, L.; Ding, Y. Introduction to Typhoons in the Western Pacific; Science Press: Beijing, China, 1979. (In Chinese) [Google Scholar]
  45. Powell, M.D.; Reinhold, T.A. Tropical Cyclone Destructive potential by integrated kinetic energy. Bull. Am. Meteorol. Soc. 2007, 88, 513–526. [Google Scholar] [CrossRef]
  46. Irish, J.L.; Resio, D.T. A hydrodynamics-based surge scale for hurricanes. Ocean Eng. 2010, 37, 69–81. [Google Scholar] [CrossRef]
  47. Jiang, Z.; Hua, F.; Qu, P. A new scheme for adjusting the tropical cyclone parameters. Adv. Mar. Sci. 2008, 26, 1. (In Chinese) [Google Scholar]
  48. Zhao, X.; Chu, P.-S. Bayesian changepoint analysis for extreme events (typhoons, heavy rainfall, and heat waves): An RJMCMC approach. J. Clim. 2010, 23, 1034–1046. [Google Scholar] [CrossRef]
  49. Hsu, P.-C.; Chu, P.-S.; Murakami, H.; Zhao, X. An abrupt decrease in the late-sseason typhoon activity over the Western North Pacific. J. Clim. 2014, 27, 4296–4312. [Google Scholar] [CrossRef]
  50. Mann, H.B.; Whitney, D.R. On a test of whether one of two random variables is stochastically larger than the other. Ann. Math. Stat. 1947, 18, 50–60. [Google Scholar] [CrossRef]
  51. Wilks, D. Statistical Methods in the atmospheric sciences. Int. Geophys. Ser. 2006, 59, xi. [Google Scholar] [CrossRef]
  52. Gómez, S.I.; Jaramillo, L.M.; Moreno, G.C.; Roa, N.S.; Rodríguez, A. Differential reactivity of salivary IgA and IgG against Streptococcus mutans proteins in humans with different caries experience. Acta Odontol. Latinoam. 2015, 28, 3–12. [Google Scholar]
  53. Yuan, J.; Wang, D.; Wan, Q.; Liu, C. A 28-year climatological analysis of size parameters for Northwestern Pacific tropical cyclones. Adv. Atmos. Sci. 2007, 24, 24–34. [Google Scholar] [CrossRef]
  54. Liu, K.S.; Chan, J.C.L. Size of tropical cyclones as inferred from ERS-1 and ERS-2 Data. Mon. Weather Rev. 1999, 127, 2992–3001. [Google Scholar] [CrossRef]
  55. Chen, Y.; Gao, S.; Li, X.; Shen, X. Key environmental factors for rapid intensification of the South China Sea tropical cyclones. Front. Earth Sci. 2021, 8, 609727. [Google Scholar] [CrossRef]
  56. Hill, K.A.; Lackmann, G.M. Influence of environmental humidity on tropical cyclone size. Mon. Weather Rev. 2009, 137, 3294–3315. [Google Scholar] [CrossRef]
  57. Chan, K.T.F.; Chan, J.C.L. Angular momentum transports and synoptic flow patterns associated with tropical cyclone size change. Mon. Weather Rev. 2013, 141, 3985–4007. [Google Scholar] [CrossRef]
  58. Li, M.; Chu, K.; Gu, J.-F.; Tan, Z.-M. On the relationship between tropical cyclone size and environmental helicity in the South China Sea. Atmos. Ocean. Sci. Lett. 2022, 15, 100205. [Google Scholar] [CrossRef]
  59. Lin, N.; Chavas, D.R.; Dong, W.; Lin, Y. Observedtropical cyclone size revisited. J. Clim. 2016, 29, 2923–2939. [Google Scholar] [CrossRef]
  60. Chen, K.; Chen, G.; Shi, D. Reexamination of the relationship between tropical cyclone size and intensity over the Western North Pacific. Adv. Atmos. Sci. 2022, 39, 1956–1968. [Google Scholar] [CrossRef]
  61. Chang, Y.-T.; Lin, I.I.; Huang, H.-C.; Liao, Y.-C.; Lien, C.-C. The association of typhoon intensity increase with translation speed increase in the South China Sea. Sustainability 2020, 12, 939. [Google Scholar] [CrossRef]
  62. Lin, I.-I.; Liu, W.T.; Wu, C.-C.; Chiang, J.C.H.; Sui, C.-H. Satellite observations of modulation of surface winds by typhoon-induced upper ocean cooling. Geophys. Res. Lett. 2003, 30, 1131. [Google Scholar] [CrossRef]
  63. Chiang, T.; Hsin, Y.; Wu, C. Multidecadal Changes of Upper-Ocean Thermal Conditions in the Tropical Northwest Pacific Ocean versus South China Sea during 1960–2015. J. Clim. 2018, 31, 3999–4016. [Google Scholar] [CrossRef]
  64. Lee, M.A.; Kuo, Y.C.; Chan, J.W.; Chen, Y.K.; Teng, S.Y. Long-term (1982–2012) summertime sea surface temperature variability in the Taiwan Strait. Terr. Atmos. Ocean. Sci. 2015, 26, 183–192. [Google Scholar] [CrossRef]
  65. Qu, T.; Du, Y.; Sasaki, H. South China Sea throughflow: A heat and freshwater conveyor. Geophys. Res. Lett. 2006, 33, L23617. [Google Scholar] [CrossRef]
  66. Thompson, B.; Tkalich, P.; Malanotte-Rizzoli, P. Regime shift of the South China Sea SST in the late 1990s. Clim. Dynam. 2016, 48, 1873–1882. [Google Scholar] [CrossRef]
  67. Yu, K.; Qu, T. Imprint of the Pacific decadal oscillation on the South China Sea throughflow variability. J. Clim. 2013, 26, 9797–9805. [Google Scholar] [CrossRef]
  68. Nan, F.; Xue, H.; Yu, F. Kuroshio intrusion into the South China Sea: A review. Prog. Oceanogr. 2015, 137, 314–333. [Google Scholar] [CrossRef]
  69. Liu, Q.-Y.; Wang, D.; Wang, X.; Shu, Y.; Xie, Q.; Chen, J. Thermal variations in the South China Sea associated with the eastern and central Pacific El Niño events and their mechanisms. J. Geophys. Res.-Ocean. 2014, 119, 8955–8972. [Google Scholar] [CrossRef]
  70. Zhang, Q.; Zhang, W.; Lu, X.; Chen, Y.D. Landfalling tropical cyclones activities in the south China: Intensifying or weakening? Int. J. Climatol. 2012, 32, 1815–1824. [Google Scholar] [CrossRef]
  71. Liu, K.S.; Chan, J.C. Growing threat of rapidly-intensifying tropical cyclones in East Asia. Adv. Atmos. Sci. 2022, 39, 222–234. [Google Scholar] [CrossRef]
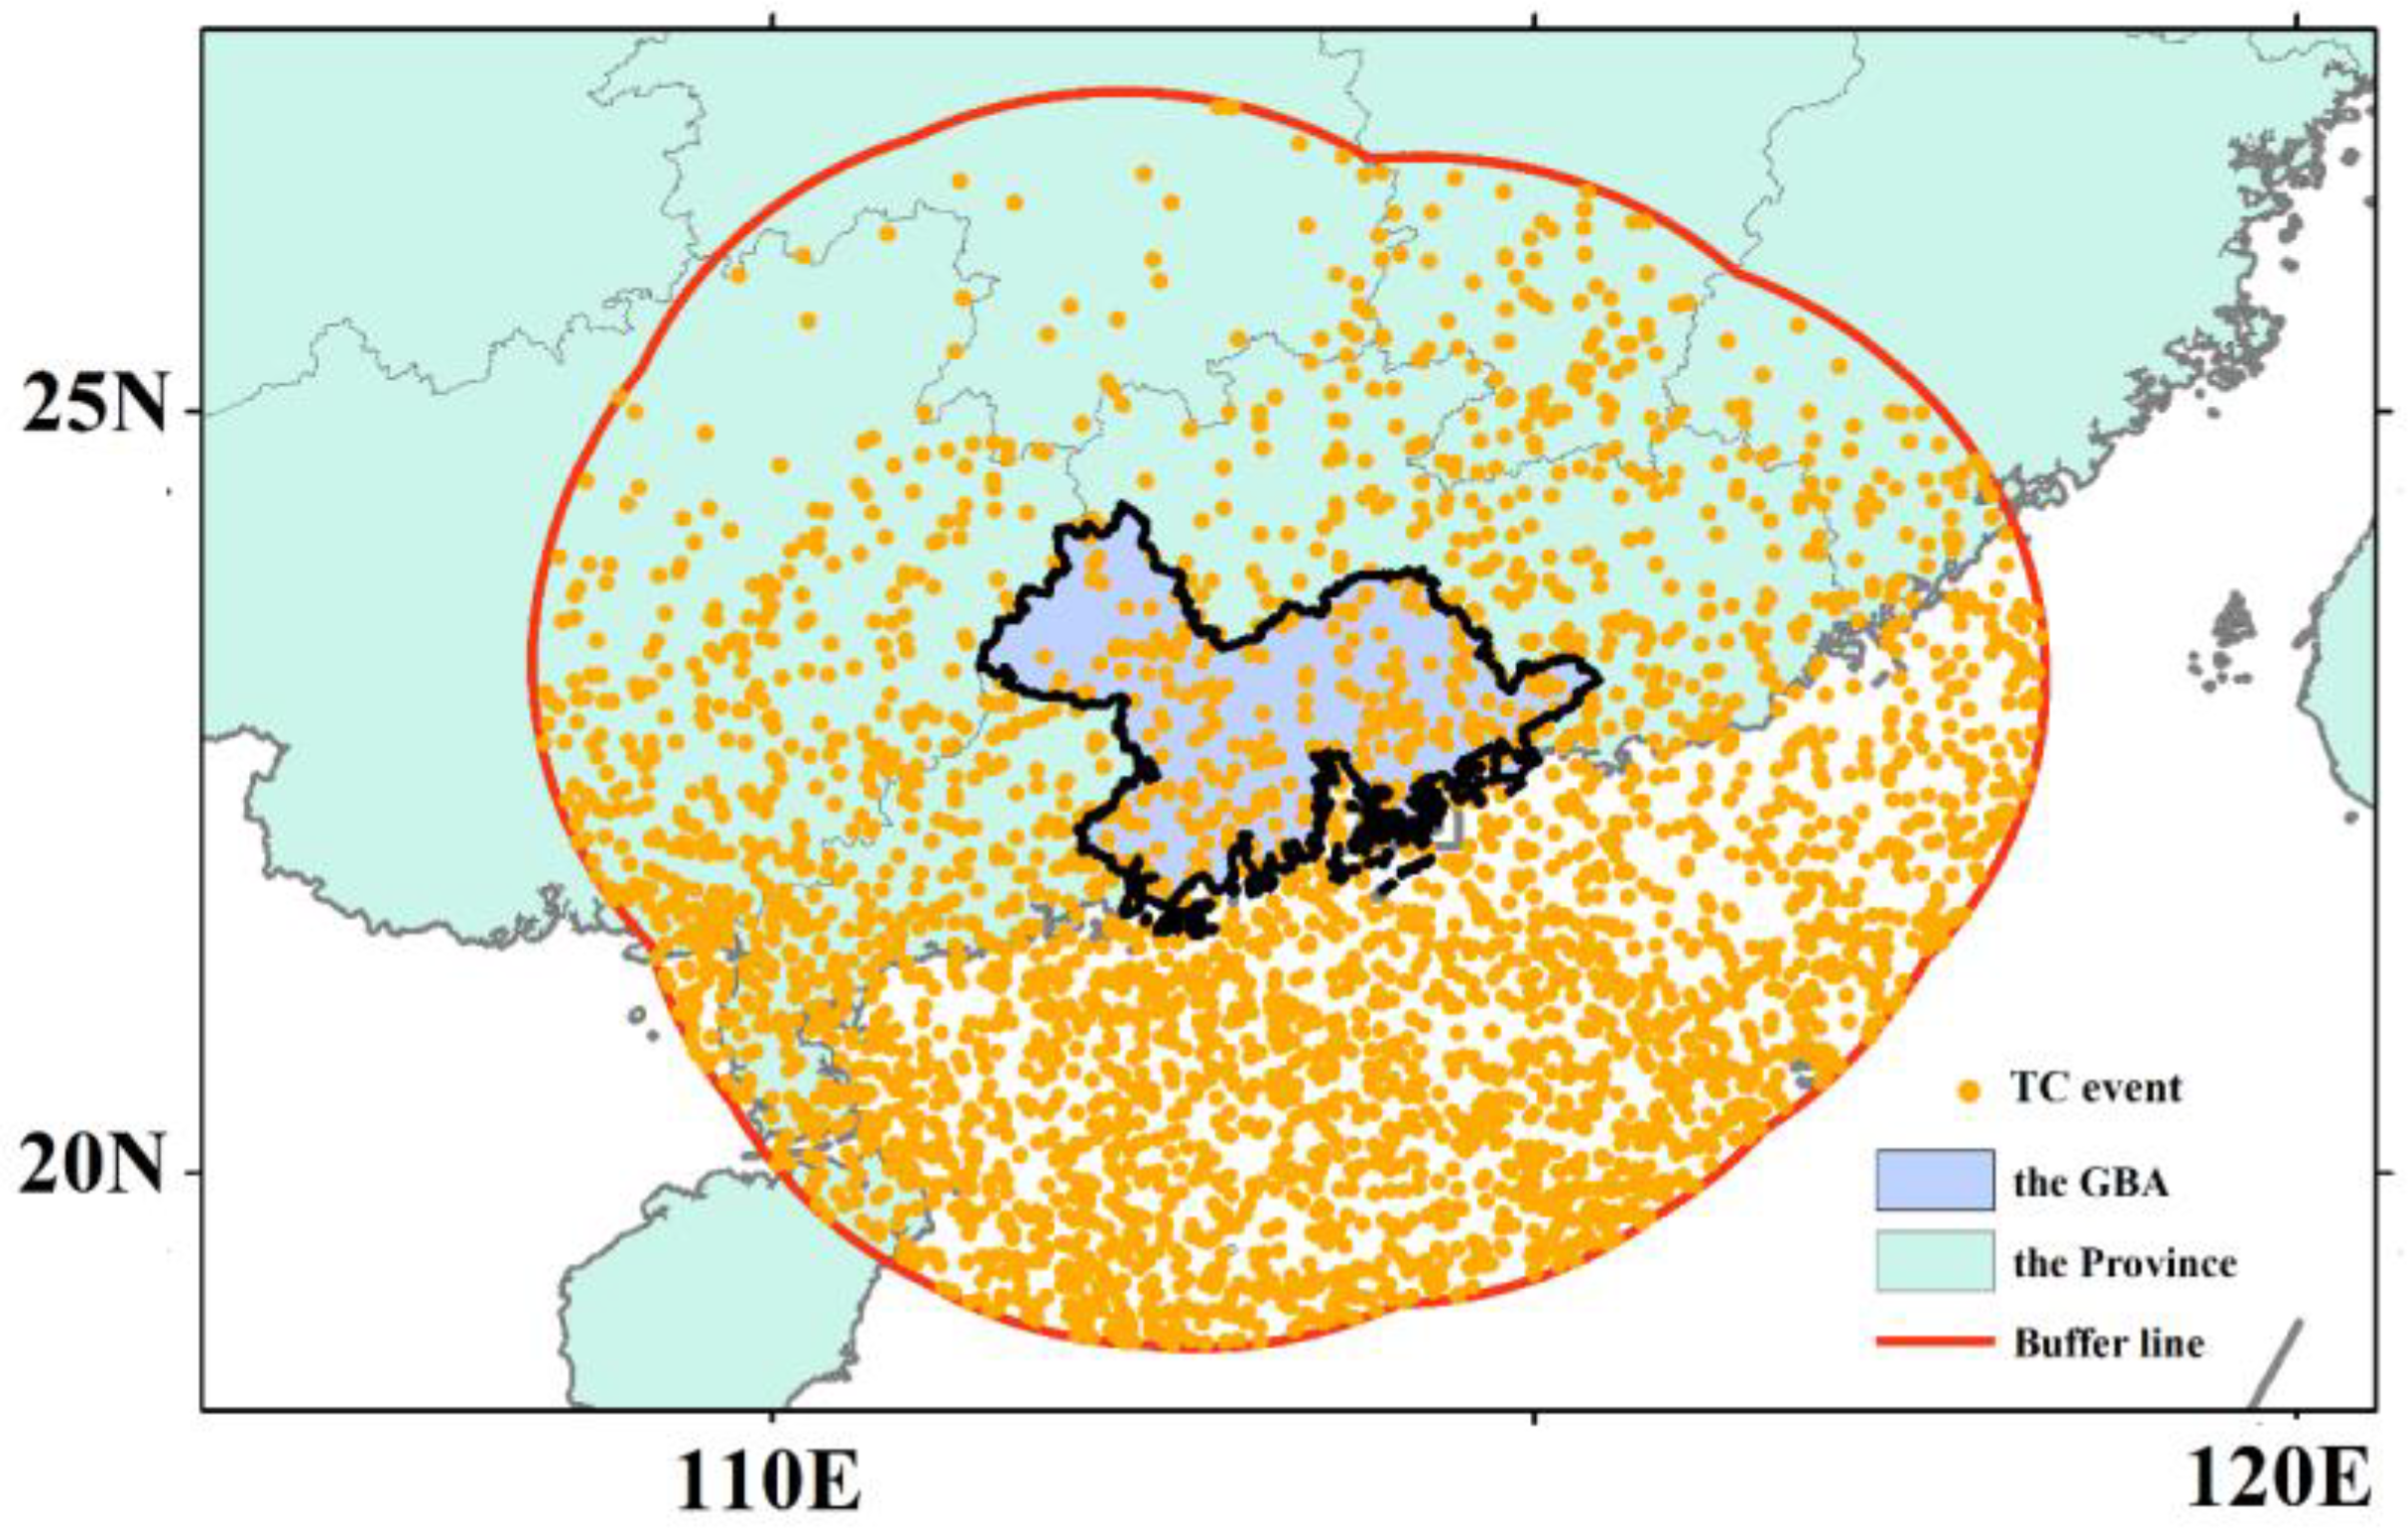
Figure 1. TC events in the buffer zone. The purple area is the location of the GBA, the red curve is the edge of the buffer zone of the GBA, and the orange points are the TC events entering the buffer zone.
Jmse 11 01889 g001
Figure 2. The tracks (yellow lines) and the corresponding passage density (contours) (a), annual frequency (b) as well as intensity probability (c) of the TC clusters that entered the buffer zone.
Jmse 11 01889 g002
Figure 3. Time series of zero-mean detrended annual PDI in the TC season (a) and the posterior probability of changepoints (bf). The statistical object is the TC event in the buffer zone. Dot lines represent the annual signal, and solid lines represent the annual signal with a 5-year low-pass filter. Five TC datasets: JMA (blue), JTWC (orange), CMA (yellow), HKO (purple) and SAT (green). They reflect the data collected in the TC season during 1977–2020, except for the SAT data collected in 1981–2016.
Jmse 11 01889 g003
Figure 4. Time series of zero-mean detrended annual SDP in the TC season (a) and the posterior probability of changepoints (b,c). The statistical object is the TC event in the buffer zone. Dot lines represent the annual signal, and solid lines represent the annual signal with a 5-year low-pass filter. Four TC datasets: JMA (blue), JTWC (orange), CMA (yellow) and QSCAT-R (pink). The JMA data are for 1977–2020, the CMA data are for 1981–2016, the JTWC data are for 2001–2016, and the QSCAT-R data are for 2000–2008.
Jmse 11 01889 g004
Figure 5. Mean state of the parameters accounting for the PDI and SDP during the three subperiods in the buffer zone. All parameters are detrended. (a) is TC intensity, (b,c) are the radii of TCs reaching 33 m/s and 18 m/s, respectively, (d) is annual TC frequency, and (e) is the duration of each TC; ** indicate significant correlation at 90% confidence, and * indicates significant correlation at 70% confidence.
Jmse 11 01889 g005
Figure 6. Composite differences of (a,b) SST, (c,d) surface latent heat flux and (e,f) 500 hPa relative humidity between P1 and P2 (left) and between P3 and P2 (right). The white dots indicate areas where the disparity in means between the two periods is statistically significant at a 10% significance level, as determined by the Mann–Whitney U statistics. Contours indicate the climatological mean. The red curve is the edge of the buffer zone of the GBA.
Jmse 11 01889 g006
Figure 7. Climatological mean (a) and composite differences between P1 and P2 (b) and between P3 and P2 (c) of 10 m wind. The arrow represents the wind vector, and the shading in (a) represents the absolute wind speed. Shading in (b,c) represents the absolute wind speed difference. The red curve is the edge of the buffer zone of the GBA.
Jmse 11 01889 g007
Figure 8. Time series of the zero-mean detrended annual translation speed of TC clusters during their whole lifespan (blue line). Red solid lines indicate the mean values in the three subperiods.
Jmse 11 01889 g008
Figure 9. The normalized annual Luzon Strait transport and the SST in the NSCS. The Luzon Strait transport is computed as the net flow across 120.5° E.
Jmse 11 01889 g009
Figure 10. Composite anomalies of 500 hPa steering flow (vectors) and its anomaly relative to the climatological mean (shading) in P1 (a), P2 (b) and P3 (c). The dotted regions surpass the threshold of significance at the 85% level. The red curve is the edge of the buffer zone of the GBA.
Jmse 11 01889 g010
Figure 11. Schematic diagram depicting the differences in relevant factors for (a) the high- and (b) the low-damage periods. Orange/blue shading indicates SST anomaly. The red/blue ellipse indicates mid-level relative humidity. Red/blue arrows indicate anomalous surface latent heat flux. The rabbit/turtle represents the TC translation speed. The purple area is the location of the GBA, and the red curve is the edge of the buffer zone of the GBA. The high-(low)-damage period is associated with high (low) SST, anomalous upward (downward) latent heat content, high (low) relative humidity, as well as fast (slow) TC translation speed.
Jmse 11 01889 g011
Table 1. Summary of PDI (×1010 m3/s2) statistics during the three periods (** indicate a significant correlation at 95% confidence, and * indicates a significant correlation at 85% confidence).
1977–19931994–20122013–2020
JMA1.00.8 *1.0
JTWC1.11.01.2
CMA1.0 **0.7 **1.2 **
HKO1.00.9 **1.2 *
SAT0.60.5 **0.9 *
Table 2. Summary of SDP statistics in the three periods (** indicate significant correlation at 95% confidence).
1977–19931994–20122013–2020
CMA23.918.6 **27.7
JMA22.312.9 **35.3 **
Table 3. Mean of parameters at different subperiods. The statistical region of environmental factors is the NSCS (105–120° E, 10–25° N).
1977–19931994–20122013–2020
SST (°C)28.628.528.7
SLHF (negative is upward, W/m2)−118.3−117.3−119.0
RH (%)55.354.855.7
TC movement (m/s)5.14.65.4
Disclaimer/Publisher’s Note: The statements, opinions and data contained in all publications are solely those of the individual author(s) and contributor(s) and not of MDPI and/or the editor(s). MDPI and/or the editor(s) disclaim responsibility for any injury to people or property resulting from any ideas, methods, instructions or products referred to in the content.