You are currently viewing a new version of our website. To view the old version click .
Journal of Marine Science and Engineering
  • Article
  • Open Access

11 August 2022

Constructing a Model to Discriminate the Workload Level of Ship Interface Operators

,
,
and
1
College of Mechanical and Electrical Engineering, Harbin Engineering University, Harbin 150001, China
2
Management Department, East University of Heilongjiang, Harbin 150086, China
3
Faculty of Electromechanical and Civil Engineering, Vietnam National University of Forestry, Hanoi 10000, Vietnam
*
Author to whom correspondence should be addressed.
This article belongs to the Section Ocean Engineering

Abstract

Workload level has a significant impact on the human errors of ship operators. Therefore, the accurate discrimination of the operator’s workload level has an important effect on preventing human errors. Firstly, this study analyzed the differences in performance indicators, subjective workload indicators, and eye movement indicators under different workloads. Secondly, according to the correlation analysis result, the NASA Task Load Index (NASA-TLX) score has a correlation with error rate, operation time, NASA-TLX score, pupil dilation, blink rate, saccadic rate, and fixation rate. Thirdly, this study used a typical discriminant analysis method to construct a discrimination model based on these indicators. The validation result indicated that the accurate discrimination rate of the model is 100% for the low and general workload and that is 90.9% for the high workload. It indicated that the constructed model can effectively distinguish the workload level.

1. Introduction

As the improvement of automation continues, ship operators must keep track of more information and manage an increasing number of systems, which increases the operators’ workload [1]. The improvement of workload influences operators work efficiency, physiology, and physiological health [2], and it has become a general issue for various industries [3]. Previous research has revealed that human performance is affected by workload [4]; an appropriate workload level can reduce human error and improve system security [5].
Workload not only includes the cognitive demands of the tasks, but also includes fatigue and stress. At present, the measurement methods are mainly divided into three categories, namely, performance measurement methods, subjective rating, and physiology measurement [6]. The subjective method is easy to implement and is low in cost. At present, subjective evaluation methods mainly include the circumplex model of affect [7], the Positive Affect and Negative Affect Schedule [8], the Activation–Deactivation Adjective Check List [9], NASA-TLX [10], the Subjective Workload Assessment Technique [11], the Overall Workload Scale [12] and Modified Cooper–Harper Ratings [13]. However, subjective results are susceptible to characteristics such as bias, reaction sets, and protest attitudes [14].
According to current research, there is a certain relationship between the workload and physiology response [15,16]. Compared with subjective evaluation methods, physiology measurement methods are affected by environmental factors. The experimental equipment connected to the participant’s body will affect the operator’s mental state. But physiology measurements require small samples to get accurate results. At present, a large amount of research has been conducted on eye reactions in physiology measurement methods. Eye responses are useful for assessing the design level of the interface and the operator’s workload [17]. The pupil diameter is generally combined with the scanning path, fixation time, and error rate to evaluate workload [18,19]. Blinking is considered a sign of fatigue [20]. When the operators need to process more information, the blinking frequency was decreased [21,22]. The other opinion suggested that the blink frequency was affected by visual demand and workload, which were opposite each other [23]. When the workload increased, the blink duration also decreased [24]. In addition, the parameter of fixation time had a correlation with workload [25,26]. The research results revealed that using fixation time to evaluate workload showed higher reliability [27].
Yan et al. (2019) proposed an artificial neural network model to predict the operator’s workload [28]. Although both the model proposed by Yan and the model proposed in this study are used to predict the workload of operators, there are still great differences between the two research studies. First, the main objectives of previous research are to consider the relationship between operators’ workload and eye responses in the task of operating a marine engine interface. The ultimate objective is to build an artificial neural network model to predict the operators’ workload. However, the main purpose of this study is to construct a discrimination model using typical discriminant methods to evaluate the workload level of operators. Therefore, the difference between the two is that the previous research developed an artificial neural network model, while this research constructed a discriminant model. Second, the artificial neural network model is trained based on the back propagation algorithm. The constructed discriminant model in this study is based on Bayes’ discriminant idea. Therefore, there are differences in the methods of constructing the two models. Third, an artificial neural network model was developed based on integrating eye response data. However, the construction of the discrimination model is based on eye response and human performance (error rate). There are limitations when using a single method to measure the workload level. However, integrating multiple methods can effectively overcome the shortcomings of a single method and improve the accuracy of workload level evaluation. Therefore, this study used the typical discrimination method to establish the discrimination model based on multiple indicators, which achieved the discrimination of the workload level of ship interface operators.

2. Materials and Methods

2.1. Participants

Operators should not only master the operation of marine engines but also have a lot of practical operation experience. However, these operators cannot be contacted at any time. Therefore, this study tested the participants who received specific task training. Twenty-two students were invited to participate in the study, ranging in age from 21 to 25 (age = 22.8 ± 1.4 years). They are novice students from an altogether different domain. All the participants have a good engineering education background and are familiar with computer operations, they are in good health, with normal vision and normal color vision. All participants performed three tasks. Finally, two-thirds of the sample data were used to construct the model, and one-third of the sample data was used to verify the reliability of the model. All students were in good health, with normal vision and normal color vision. All students must ensure adequate sleep on the day before the experiment, and the students were asked to stay in a quiet environment before the experiment began. Each student completed an operational training task before the experiment.

2.2. Equipment

The Neptune simulator MC90 was developed by Kongsberg Maritime Ship Systems Software (Version: MC90-V, Norge, Norway) based on real data. The software is very close to real operating procedures. In MC90 software, the propulsion machinery is based on one MAN B&W 5L90MC, low speed, 5 cylinder configuration, 2-stroke, turbocharged, reversible diesel engines. The main engine is coupled to a propeller shaft with either a fixed pitch propeller or a controllable pitch propeller. The software is an effective training tool for marine engineering professionals. This study used the software for simulation operation.
In this research, eye response was recorded by iView X head-mounted eye tracking device (SensoMotoric Instruments, Teltow, Germany). The recording rate was 50 Hz, the pupil/corneal reflex was <0.1°, and the gaze position accuracy was <0.5° to 1.0°. The software of BeGaze was used to analyze and process the experiment data.

2.3. Experimental Task

This research analyzed the changes of indicators under different workload levels and then analyzed the correlation between workload and each indicator. The three tasks were used to control workload level. The operation procedure of the three tasks is shown in Table 1 and Table 2 and Table 3 [29]. The first task is the emergency generator operating procedures. It is mainly to provide power to the ship when there is a problem with the ship’s power supply system. The operating procedures of the emergency generator are shown in Table 1. The second task is the shaft generator operating procedures. It can supply the ship’s network with electrical energy when the SG is running above 200 rpm. Between 200 and 400 rpm the load is limited to half, and above 400 rpm maximum power is available. The operating procedures of the shaft generator are shown in Table 2. The third task is the operating process for starting the diesel generator, and the operating procedures are shown in 
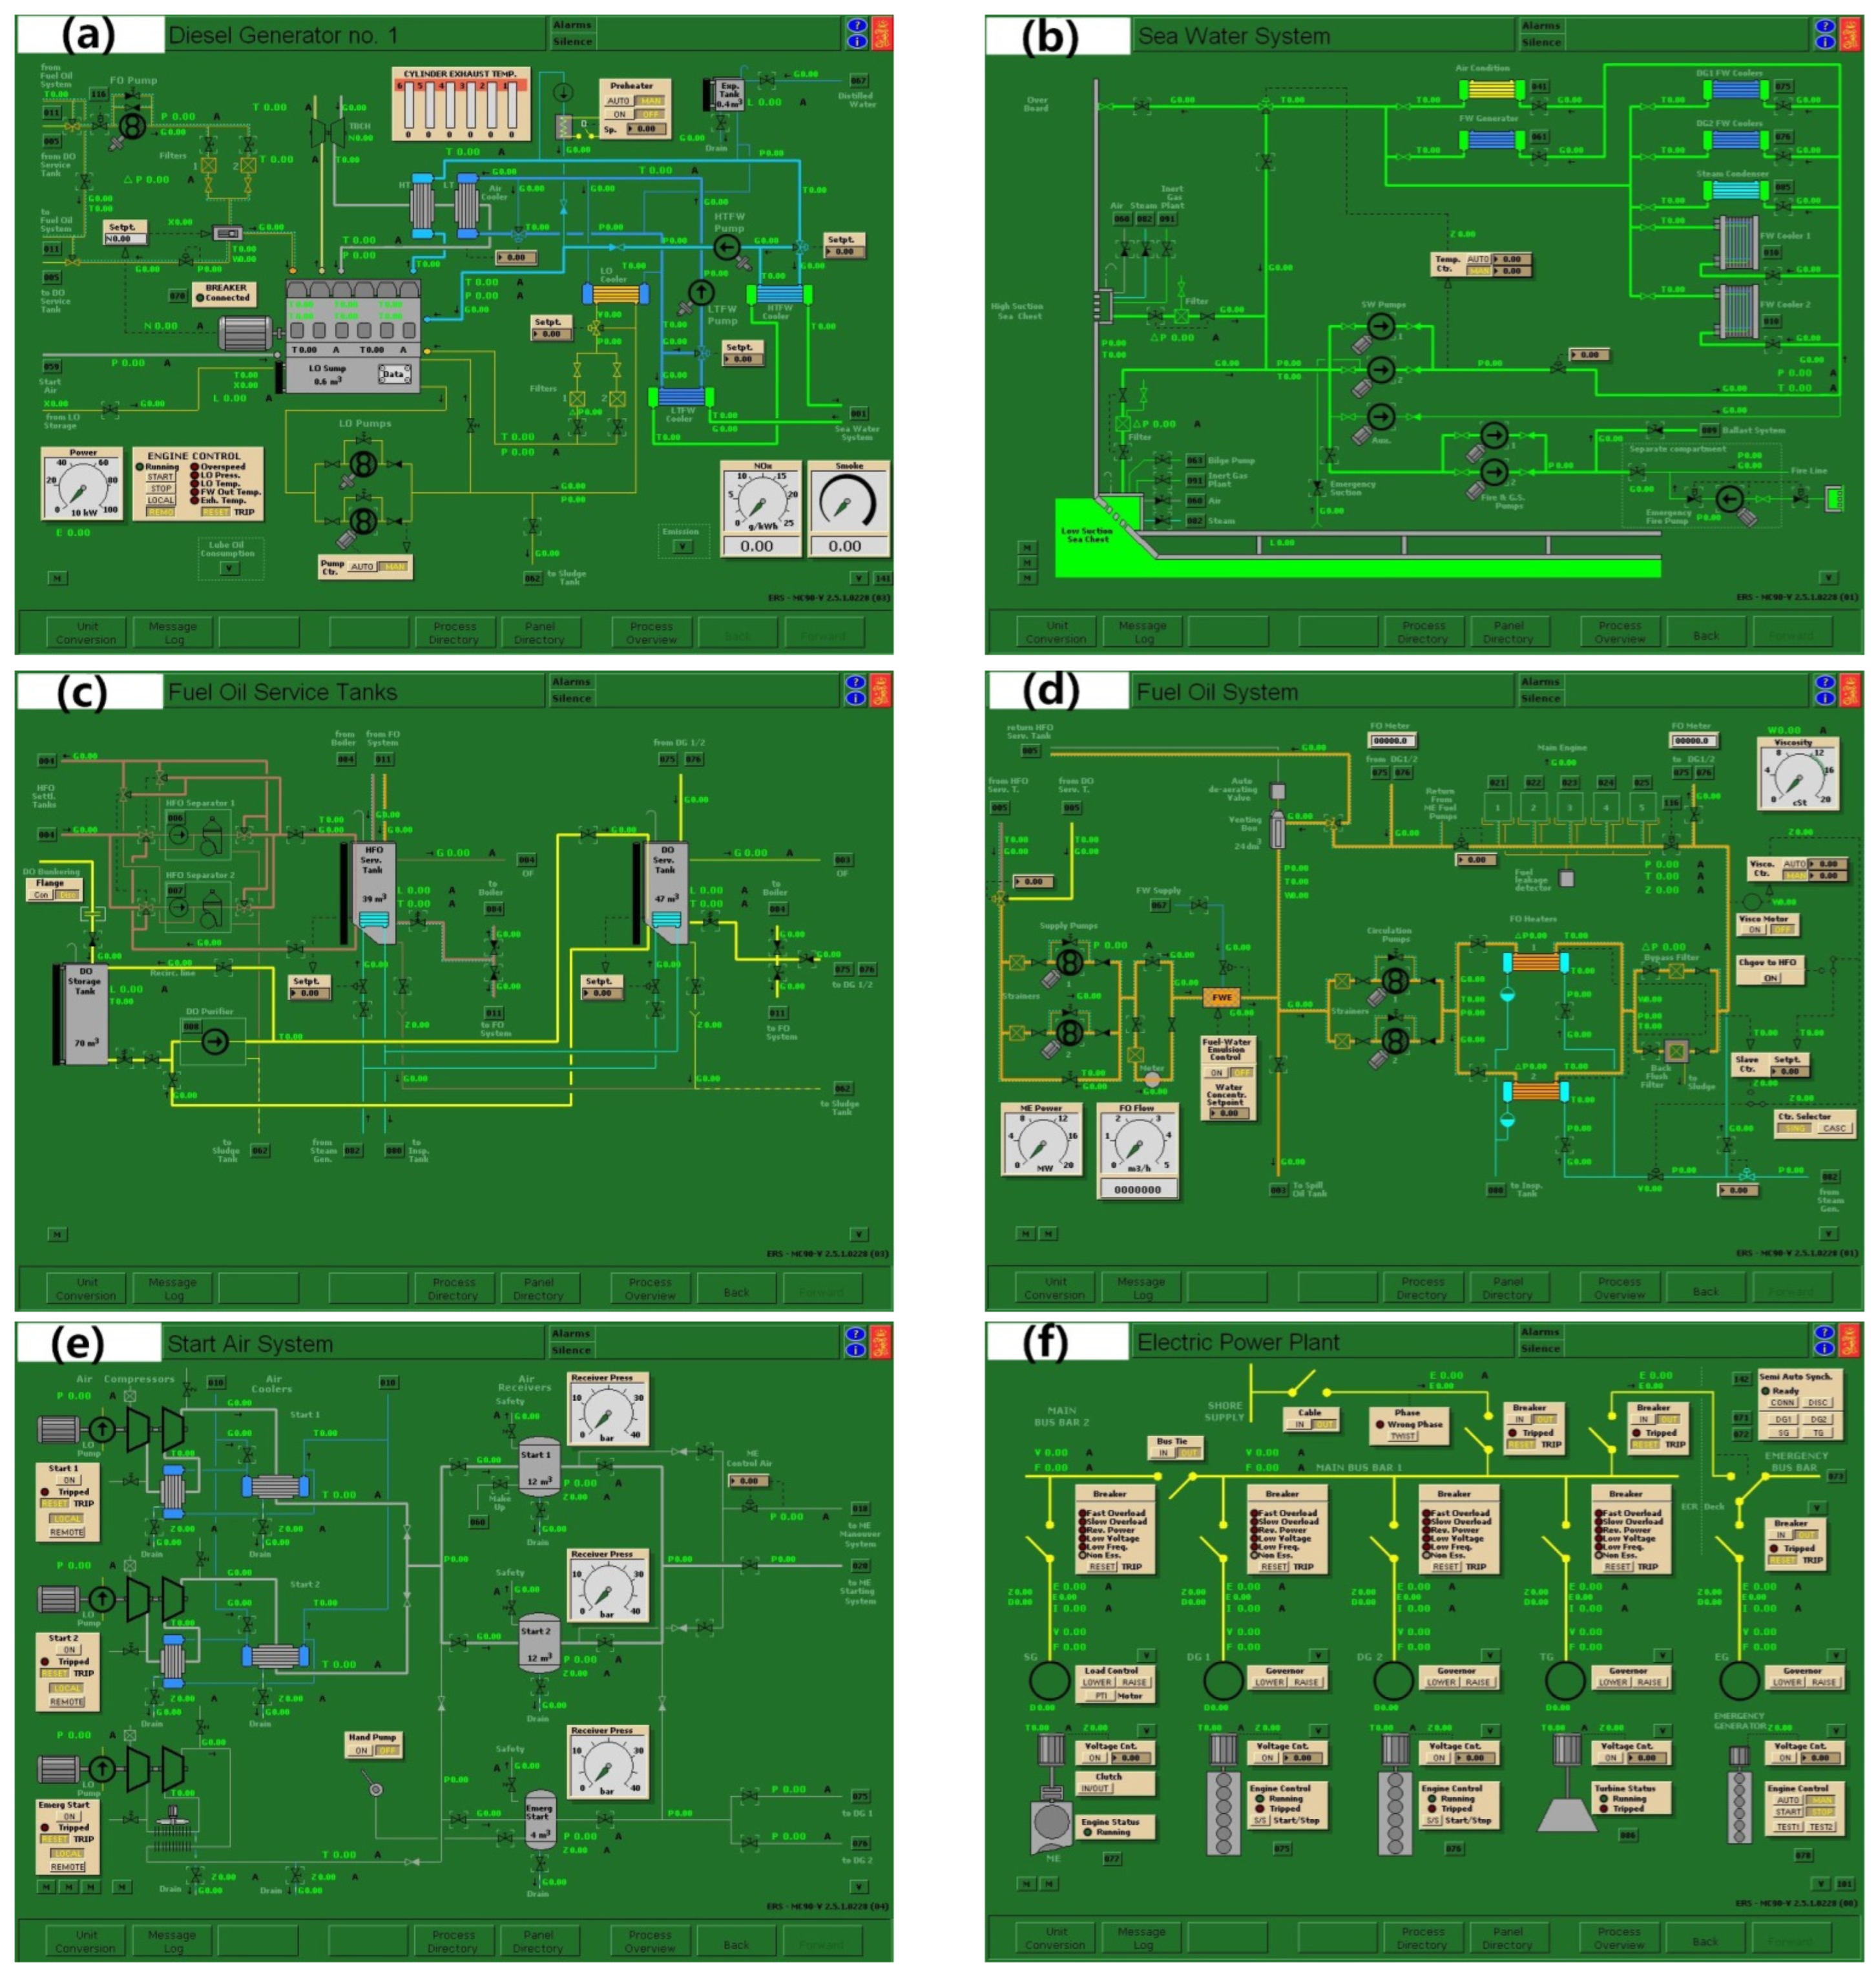
Table 3. According to the number of steps for each operation, the first, second, and third tasks were represented by the low, general, and high workload, respectively. The required human–computer interface of each task procedure is shown in Figure 1.
Table 1. The emergency generator operation process.
Table 2. Shaft generator operation procedure.
Table 3. The operating process for starting the diesel generator.
Figure 1. Neptune simulator MC90 software: (a) MD75 interface, (b) MD01 interface, (c) MD05 interface, (d) MD11 interface, (e) MD59 interface, (f) MD70 interface, (g) MD73 interface, (h) MD77 interface.

2.4. Date Collection and Analysis

2.4.1. Performance Data

Performance indicators were used to evaluate the effectiveness of an object in completing a specific task. Performance evaluation parameters mainly include the number of errors, error rate, operation time, etc. [30]. According to the current research result of performance evaluation methods, this study selected error rate and operation time as performance evaluation indicators.

2.4.2. Subjective Data

The subjective evaluation mainly collects scores when participants use rating scales. Compared with objective evaluation methods, subjective evaluation methods need numerous sample data, and the evaluation results are vulnerable to being influenced by the behavior of the evaluators, such as personal preferences and moods. However, due to the low cost and adaptability of subjective evaluation methods, the application of subjective evaluation methods is still very extensive. This study used the NASA-TLX score to evaluate the operators’ workload. NASA-TLX evaluates workload from six dimensions: mental demand, physical demand, temporal demand, own performance, effort, and frustration. Each dimension used the 0 to 100 scale to evaluate the level. NASA-TLX score was calculated by Equation (1).
N A S A T L X   s c o r e = 1 15 i = 1 6 X i W i
where NASA-TLX is the NASA task load index; Xi is the rating score of the ith dimension; Wi is the relative weight of the ith dimension.

2.4.3. Eye Responds Data

In the BeGaze software interface (Version 2.3, Teltow, Germany), the area of interest (AOI) was selected as the simulated display interface. All recording data beyond the data on the simulated interface was excluded from the analysis. During the experiment, the eye response on the simulated interface was recorded by coordinate values. This study selected the four eye response indicators of pupil diameter, blink rate, saccade rate, and fixation rate as the research objects. Saccade rate has a negative correlation with fixation rate. When the interface information is easy to obtain, the saccade rate will increase and the fixation rate will decrease. On the contrary, when the presentation of interface information does not conform to the operator’s cognition, the operator’s fixation rate will increase and the saccade rate will decrease. Therefore, saccade rate and fixation rate are used to evaluate the workload of operators. Pupil diameter is the average value of the pupils in the vertical and horizontal directions of the left eye. The time between closing eyes and open eyes is considered to be blinking time. The average value of multiple measurements is considered as the blink time in the experiment. The blink rate is the number of blinks per second. The saccadic rate refers to the number of times the eye moves rapidly around in a second. The fixation rate refers to the number of times the eye stays in the area for a long time in one second.

3. Results

3.1. Subjective Evaluation

Table 4 shows the evaluation result of NASA-TLX. It can be seen that the NASA-TLX score and the dimension of frustration have a significant difference between the three workloads. The mental demands (p < 0.05) have a significant difference between the low and general workload, the dimensions of mental demands (p < 0.05), physical demands (p < 0.02), time demands (p < 0.01), and performance (p < 0.01) have a significant difference between the low and high workload, and the dimensions of physical demands (p < 0.05) and time demands (p < 0.05) have a significant difference between the general and high workload.
Table 4. The t-test of NASA-TLX between different workloads.

3.2. Performance Evaluation

The t-test results of the performance are summarized in Table 5. The results showed that the error rate (p < 0.01) has a significant difference between the low and high workloads, and the operation time has a significant difference between the three different workloads. The required operation time to complete a task varies with the complexity of a task. The more task complex, the more time it takes to complete the task. The workload is affected by task complexity, thus, the operation time can indirectly reflect the operator’s workload. It can be summarized that the error rate and the operation time were affected by the workload level.
Table 5. The t-test of performance date between different workloads.

3.3. Eye Respond Result

Table 6 shows the t-test results of eye response under the three workload levels. The results showed that the pupil dilation and saccadic rate have a difference under three workload conditions. The fixation rate has a difference between low workload and general workload (p < 0.05) and between low workload and high workload (p < 0.01). As the workload increased, the pupil diameter, blink rate, and fixation rate also increased, and the saccadic rate decreased.
Table 6. The t-test of eye response between different workloads.
The correlation between the NASA-TLX score and other indicators is shown in Table 7 and Table 8 and Table 9. The analysis result showed that the NASA-TLX score has a positive correlation with an error rate, operation time, pupil dilation, blink rate, and fixation rate under the three workload levels. Also, the NASA-TLX score has a negative correlation with saccadic rate under the three workload levels. In addition, the error rate and operation time, and pupil dilation and blink rate have a positive correlation under all three workloads.
Table 7. Correlation analysis under the low workload.
Table 8. Correlation analysis under the general workload.
Table 9. Correlation analysis under the high workload.

3.4. Constructing Discriminant Model

The basic principle of discriminant analysis is to fit the discriminant function from the samples that have determined the category of observations, then apply the discriminant function to the new data set recorded by the same observation variables, and then judge the category attribution of new samples. According to the experimental results, the typical discriminant analysis method was used to construct the workload discrimination model to evaluate user workload level. The typical discriminant method constructs one or more linear discriminant functions by the idea of variance analysis. The discriminant coefficient is determined by making the variability between different groups as large as possible and the variability within the same group as small as possible. The constructed discriminant formula of the Fisher method is as follows:
y = a 1 x 1 + a 2 x 2 + a 3 x 3 + + a n x n
where y is the value in the lower dimensional space. x1, x2, x3, …, xn are the feature variables of the observation. a1, a2, a3, …, an are coefficients of each variable.
The discriminant model includes several feature variables, such as NASA-TLX score, error rate, operation time, pupil dilation, blink rate, saccadic rate, and fixation rate. In this study, SPSS 22.0 software was used to analyze the experimental data. Discriminating functions (3) and (4) can be obtained after discriminant analysis by SPSS software, and the data analysis results by SPSS software give the centers of gravity. Therefore, according to the analysis results by SPSS software, it can construct the distinguishing function and determine the centers of gravity. The canonical discriminating functions are as follows:
y 1 = 0.051 * x 1 8.929 * x 2 + 0.063 * x 3 + 0.081 * x 4 + 0.381 * x 5 0.263 * x 6 0.577 * x 7 8.321
y 2 = 0.075 * x 1 + 5.777 * x 2 0.017 * x 3 + 0.061 * x 4 5.703 * x 5 0.297 * x 6 + 1.709 * x 7 4.319
where y1 and y2 indicate the value of the discrimination function, the parameters of x1, x2, x3, x4, x5, x6, and x7 represent the NASA-TLX score, errors rate, operation time, pupil dilation, blink rate, saccadic rate, and fixation rate, respectively.
The plane coordinates of each observation sample were calculated based on the discriminant functions, and then the distance to the center of gravity of each category was calculated. The calculation formulas of the distance from each center of gravity are as follows:
Z 1 2 = ( y 1 + 3.158 ) 2 + ( y 2 + 0.163 ) 2
Z 2 2 = ( y 1 + 0.348 ) 2 + ( y 2 0.282 ) 2
Z 3 2 = ( y 1 3.507 ) 2 + ( y 2 + 0.119 ) 2
Based on the feature variables values of x1 to x7, the values of y1 and y2 are calculated and brought into Equations (5)–(7). If the value of Z1 is less than the Z2 and Z3, participants are considered to be at a low workload level. Similarly, if the value of Z2 or Z3 is the smallest of the three values of Z1, Z2, and Z3, the participant’s workload is considered to be at the general or high workload level.
Figure 2 shows the discriminant classification of samples by the constructed discriminant model. The correct discrimination classification of the constructed model is 95.5% for low workload and high workload samples and 91% for general workload samples, which indicates that the constructed model can effectively discriminate the workload level.
Figure 2. Typical discriminant function analysis results.
As shown in Table 10 and Table 11, Wilks’ Lambda is used to test whether each discriminant function is statistically significant. The test results show that the first discriminant function is statistically significant (p = 0.00), and the second function is not statistically significant. However, considering that the first function accounts for more than 99.5% of the variance variation, the established discriminant function is acceptable.
Table 10. Characteristic value results.
Table 11. Wilks’ Lambda results.

3.5. Validating the Reliability of the Model

In this study, two-thirds of the experimental data were used to construct the discrimination model, and the remaining one-third of the data were used to validate the accuracy of the discriminant model in the classification of workload level. In the correlation analysis results, the correlation between NASA-TLX and several other indicators is proved. It is indicated that the other indicators can indirectly reflect the workload level, and it shows the rationality of the indicators selected for constructing the model. For the reliability verification of the developed model, it is needed to judge whether the classification results of the workload by the model are correct. In this study, the sample data that did not participate in the construction of the model was used to verify the accuracy of the developed model in discriminating the workload level. The discriminant results of the discriminant model in the classification of workload level are shown in Table 12. It can be seen that the discriminant accuracy is 100% for low workload and general workload, and that it is 90.9% for the high workload. Therefore, combining characteristic value results and Wilks’ lambda result, it can be considered that the discrimination model can effectively distinguish the workload level.
Table 12. The workload discrimination results.

4. Discussion and Conclusions

Workload has a great influence on information acquisition and feedback time, which may lead to human errors. This study constructed a discrimination model to discriminant the operator’s workload level. Three task procedures were used to represent three workload levels.
According to the number of steps for each operation, the workload of the three tasks was divided into the low workload, general workload, and high workload. The t-test result of NASA-TLX showed that the NASA-TLX score has a significant difference between the three tasks, which indicated that the workload has a significant difference under different tasks. The dimension of mental demand has the highest score among the three tasks, which indicated that the operation process required a high degree of concentration. The high effort score indicated that users needed to spend more effort to complete the operation task.
The operation time has a significant difference between the three tasks, and the error rate has a significant difference between low workload and high workload. The increase in workload requires more cognitive resources, but cognitive resources are limited, which may lead to an increase in error rate. At the same time, the increase in the number of operation steps also requires the operator to spend more time completing a task.
The t-test result showed that the pupil dilation and saccadic rate have a significant difference between the three workloads. The fixation rate also has a significant difference between low workload and general workload and between low workload and high workload. The increased task steps leads to the workload increasing. As the increase of workload, the amount of information that the eyes need to obtain increases, which leads to the expansion of pupil diameter. In addition, it is more difficult to search the required information under a high workload, which leads to a decrease in saccade rate and an increase in fixation rate. The blink rate is affected by both workload and visual demand. Therefore, the workload did not have a significant effect on the blink rate.
According to the above analysis, these indicators can reflect the workload levels. The correlation analysis showed that the NASA-TLX score has a correlation with the error rate, operation time, and eye response indicators. Therefore, these indicators were used to construct the discriminant model. This research constructed a discriminant model based on the indicators of NASA-TLX score, error rate, operation time, pupil diameter, blink rate, saccadic rate, and fixation rate. The validation results indicated that the discrimination model can effectively distinguish the operators’ workload level.
However, there are still some limitations to this study. Firstly, the quantity of samples is small. Secondly, the experiment was performed on a simulation platform, which is different from the real operating environment. Therefore, the reliability of the model needs to be further verified in practical application.

Author Contributions

Conceptualization, S.Y., Y.W. and F.L.; software, C.C.T.; validation, Y.W., S.Y. and F.L.; writing—original draft preparation, Y.W.; supervision, S.Y. All authors have read and agreed to the published version of the manuscript.

Funding

This research received no external funding.

Institutional Review Board Statement

The study was conducted in accordance with the Declaration of Helsinki, and approved by the Institutional Review Board of Harbin engineering university.

Data Availability Statement

Not Applicable.

Acknowledgments

This study was conducted in the Lab of the College of Mechanical Engineering at Harbin Engineering University, Harbin, Heilongjiang, China. The author thanks the reviewers for their valuable comments. In addition, the authors are grateful to the experts and students who helped with the research.

Conflicts of Interest

The authors declare no conflict of interest.

References

  1. Wulvik, A.S.; Dybvik, H.; Steinert, M. Investigating the Relationship between Mental State (Workload and Affect) and Physiology in a Control Room Setting (Ship Bridge Simulator). Cogn. Technol. Work. 2019, 22, 95–108. [Google Scholar] [CrossRef]
  2. Wei, Z.M.; Wanyan, X.R.; Zhuang, D.M. Measurement and evaluation of mental workload for aircraft cockpit display interface. J. Beijing Univ. Aeronaut. Astronaut. 2014, 40, 86–91. [Google Scholar]
  3. Kum, S.; Furusho, M.; Duru, O.; Satir, T. Mental workload of the VTS operators by utilising heart rate. Trans. Nav. 2007, 1, 145–151. [Google Scholar]
  4. Nachreiner, F. Standards for ergonomics principles relating to the design of work systems and to mental workload. Appl. Ergon. 1995, 26, 259–263. [Google Scholar] [CrossRef]
  5. Moray, N. Mental workload since 1979. Int. Rev. Ergon. 1988, 2, 123–150. [Google Scholar]
  6. Chen, Y.; Yan, S.; Tran, C.C. Comprehensive evaluation method for user interface design in nuclear power plant based on mental workload. Nucl. Eng. Technol. 2019, 51, 453–462. [Google Scholar] [CrossRef]
  7. Russell, J.A. A circumplex model of affect. J. Pers. Soc. Psychol. 1980, 39, 1161–1178. [Google Scholar] [CrossRef]
  8. Watson, D.; Clark, L.A.; Tellegen, A. Development and validation of brief measures of positive and negative affect: The PANAS scales. J. Pers. Soc. Psychol. 1988, 54, 1063–1070. [Google Scholar] [CrossRef] [PubMed]
  9. Thayer, R.E. Activation-deactivation adjective check list: Current overview and structural analysis. Psychol. Rep. 1986, 58, 607–614. [Google Scholar] [CrossRef]
  10. Hart, S.G.; Staveland, L.E. Development of NASA-TLX (Task Load Index): Results of empirical and theoretical research. Adv. Psychol. 1988, 52, 139–183. [Google Scholar]
  11. Reid, G.B. The Subjective Workload Assessment Technique: A Scaling Procedure for Measuring Mental Workload; Elsevier Science Publishers: Amsterdam, The Netherlands, 1988. [Google Scholar]
  12. Vidulich, M.A.; Tsang, P.S. Absolute magnitude estimation and relative judgement approaches to subjective workload assessment. Proc. Hum. Factors Soc. Ann. Meet. 1987, 31, 1057–1061. [Google Scholar] [CrossRef]
  13. Wierwille, W.W.; Casali, J.G. A validated rating scale for global mental workload measurement applications. Proc. Hum. Factors Soc. Ann. Meet. 1983, 27, 129–133. [Google Scholar] [CrossRef]
  14. Dyer, R.; Matthews, J.J.; Stulac, J.F.; Wright, C.E.; Yudowitch, K. Questionnaire Construction Manual. Annex: Literature Survey and Bibliography; Bibliographies, 1976. Available online: https://eric.ed.gov/?id=ED147359 (accessed on 29 June 2022).
  15. Andreassi, J.L. Psychophysiology: Human Behavior and Physiological Response; Psychology Press: London, UK, 2010. [Google Scholar]
  16. Boucsein, W. Electrodermal Activity; Springer Science & Business Media: New York, NY, USA, 2012. [Google Scholar]
  17. Rosch, J.L.; Vogel-Walcutt, J.J. A review of eye-tracking applications as tools for training. Cognit. Technol. Work. 2013, 15, 313–327. [Google Scholar] [CrossRef]
  18. Brookings, J.B.; Wilson, G.F.; Swain, C.R. Psychophysiological responses to changes in workload during simulated air traffic control. Biol. Psychol. 1996, 42, 361–377. [Google Scholar] [CrossRef]
  19. Van Orden, K.F.; Jung, T.-P.; Makeig, S. Combined eye activity measures accurately estimate changes in sustained visual task performance. Biol. Psychol. 2000, 52, 221–240. [Google Scholar] [CrossRef]
  20. Benedetto, S.; Pedrotti, M.; Minin, L.; Baccino, T.; Re, A.; Montanari, R. Driver workload and eye blink duration. Transp. Res. Part F Trafc. Psychol. 2011, 14, 199–208. [Google Scholar] [CrossRef]
  21. Recarte, M.A.; EPérez Conchillo, A.; Nunes, L.M. Mental workload and visual impairment: Differences between pupil, blink, and subjective rating. Span. J. Psychol. 2008, 11, 374–385. [Google Scholar] [CrossRef] [PubMed]
  22. Summala, H.; Hakkanen, H.; Mikkola, T. Task effects on fatigue symptoms in overnight driving. Ergonomics 1999, 42, 798–806. [Google Scholar] [CrossRef] [PubMed]
  23. Yan, S.; Tran, C.C.; Wei, Y.; Habiyaremye, J.L. Driver’s Mental Workload Prediction Model Based on Physiological Indices. Int. J. Occup. Saf. Ergon. 2017, 25, 476–484. [Google Scholar] [CrossRef]
  24. Kramer, A.F. Physiological Metrics of Mental Workload: A Review of Recent Progress; Defense Technical Information Center: Fort Belvoir, Virginia, 1990; pp. 279–328. [Google Scholar]
  25. Recarte, M.A.; Nunes, L.M. Effects of verbal and spatial-imagery tasks on eye fixations while driving. J. Exp. Psychol. Appl. 2000, 6, 31. [Google Scholar] [CrossRef]
  26. Tole, J.R.; Stephens, A.T.; Harris, R.L.; Ephrath, A.R. Visual scanning behavior and mental workload in aircraft pilots. Aviat. Space Environ. Med. 1982, 53, 54–61. [Google Scholar] [PubMed]
  27. Di Stasi, L.L.; Antolí, A.; Cañas, J.J. Evaluating mental workload while interacting with computer-generated artificial environments. Entertain. Comput. 2013, 4, 63–69. [Google Scholar] [CrossRef]
  28. Yan, S.; Wei, Y.; Tran, C.C. Evaluation and prediction mental workload in user interface of maritime operations using eye response. Int. J. Ind. Ergon. 2019, 71, 117–127. [Google Scholar] [CrossRef]
  29. Kongsberg, M. Operator’s manual Part 3. Machinery & operation, Kongsberg maritime. In Report: SO-1136-D/11-Oct-05, Engine Room Simulator L11 5L90MC–VLCC; Machinery & Operation MC90-IV: Kongsberg, Norway, 2005. [Google Scholar]
  30. Gawron, V.J. Human Performance, Workload, and Situational Awareness Measures Handbook; CRC Press: Boca Raton, FL, USA, 2008. [Google Scholar]
Publisher’s Note: MDPI stays neutral with regard to jurisdictional claims in published maps and institutional affiliations.

Article Metrics

Citations

Article Access Statistics

Multiple requests from the same IP address are counted as one view.