1. Introduction
Marine litter may be defined as any persistent, manufactured or processed solid material discarded into the sea, rivers, or on beaches; brought indirectly to the sea with rivers, sewage, stormwater, or winds; or discarded or lost at sea [
1,
2]. In addition, marine litter can be characterized by different levels of detail and thus can be detected and analyzed. The lowest level of detail is the type of material that makes up a litter item while the highest level of detail may be size classes of individual litter items, such as plastic bottles with a volume of less or more than 0.5 L. Marine litter can be classified into the following categories based on the material it is made of: chemicals, clothing/textiles, food waste (organic), glass/ceramics, artificial polymers/plastics, paper/cardboard, rubber, and processed wood. In terms of size, marine litter is commonly classified into the following size classes: macrolitter larger than 25 mm, mesolitter from 5 mm to 25 mm, and microlitter up to 5 mm [
3]. It is generally accepted that sampling the different size classes of marine litter (macro-, meso-, micro-) requires different methodological approaches.
It is estimated that globally 8 million tons of plastic litter end up in the oceans daily, of which only 1% of plastic marine litter floats on the sea surface [
4]. Microplastic is defined as plastic particle with a diameter of <5 mm, which also contain particles in the nano size range (1 nm) [
1]. It can come from a direct source or be formed by the decomposition process of plastics due to UV radiation, wind, currents and other natural factors. Such plastic particles also pollute the ocean from sewage treatment systems since they may pass through particular water filters. Plastic litter poses a threat to marine organisms (fish, crustaceans, mollusks, mussels, etc.) as they can be accidentally contaminated by microplastics.
The Mediterranean Sea is named one of the world’s most affected areas by marine litter and is considered a plastic pollution hotspot because it is a semi-enclosed basin [
5,
6,
7]. Many authors confirm the widespread distribution of microplastics on the water surface of the Mediterranean Sea and the ingestion of macro and microplastics by marine organisms [
8,
9,
10,
11]. High pollution can be attributed to the densely populated coastal areas with a range of intensive activities (tourism, fishing, shipping, industry) combined with the limited surface water runoff, such as the anti-estuarine water exchange with the Atlantic, which leads to an exceptionally high surface water residence time [
12,
13].
Studies where marine litter collected across the Mediterranean Sea coasts were classified by origin and material, and its abundance in habitats investigated, proved that plastic is the most abundant litter material while fishing and tourism are recognized as the most polluting activities [
14,
15]. Similar conclusions have been made, stating that tourism (mainly beach users) and commercial fishing, followed by land runoff, are the primary sources of plastic litter all year round, with the highest peaks during the summer season [
16,
17].
A quantitative assessment of marine litter distribution across the Mediterranean Sea showed that, after plastic, abandoned or discarded fishing gear (mainly fishing lines) was the second predominant type of marine litter, representing a source responsible for entangling and harming marine fauna [
18,
19].
Similarly, microplastics significantly dominated in macro- and micro-level analysis in different Adriatic Sea areas, including Marine Protected Areas (MPA) [
20,
21]. The same problem was confirmed in Italy. The authors in [
10] confirmed the domination of microplastics in the coastal waters of Tuscany and proved that the greater the distance from the coast, the higher the concentration of floating microplastics. At the same time, it seems that seasonality does not affect the abundance of microplastics in that area.
In the particular case of Spain, many studies dealing with marine litter on different sampling points on coasts and beaches across Spain showed that plastic materials are the predominant ones, followed by fishing gear, metal, and glass [
22,
23,
24]. Furthermore, three Spanish sea areas with the highest plastic pollution concentration are the Alboran Sea, the Gulf of Alicante, and the Barcelona area, most likely due to fishing, industrial activities, and high population density. Microplastic pollution was also detected at three beaches on the coast of Granada, namely La Herradura, Motril Beach, and La Rábita [
25]. The data showed higher contamination by microplastics at a beach in an enclosed bay (La Herradura) than on surrounding open-type beaches. It has been observed that the distribution and size of the particles are influenced by the geomorphological and sedimentary characteristics of these beaches, which are different from all others in Spain and the Mediterranean Sea in general.
Based on the existing literature, it has been determined that most of the previous research deals with the analysis of marine litter collected on the coastline, mainly manually on beaches. The novelty of this work is that the sea bin device was used as a method to collect floating marine litter in the ports of Mallorca and the composition of the collected litter was analyzed.
The present paper assesses the amount, weight, and composition of marine litter collected by seabin devices installed in Port of Cristo and Port of Colonia de Sant Jordi on Mallorca Island. The term “sea bin device” (plastic trap bin device) refers to a device designed to catch and remove any floating litter from the sea surface by filtering the seawater. Such devices are usually floating and mounted on a fixed installation near the shore or port infrastructure. Generally, these devices can collect natural material and artificial material (litter), i.e., any floating object which is not too large in a way that cannot enter the trap. In addition, such devices may collect even small patches of floating grease or hydrocarbon liquids depending on construction variations.
The main goal of this work is to withdraw statistical information from the observations about spatial and temporal variability of the floating litter in the study area. The secondary goal is to observe the pollution protection effectiveness of the seabin device and discuss the potential contribution of seabin data to future monitoring. Furthermore, the sampling method and seabin features advantages and drawbacks noted and experienced during the research are presented.
2. Methodology
2.1. Study Area
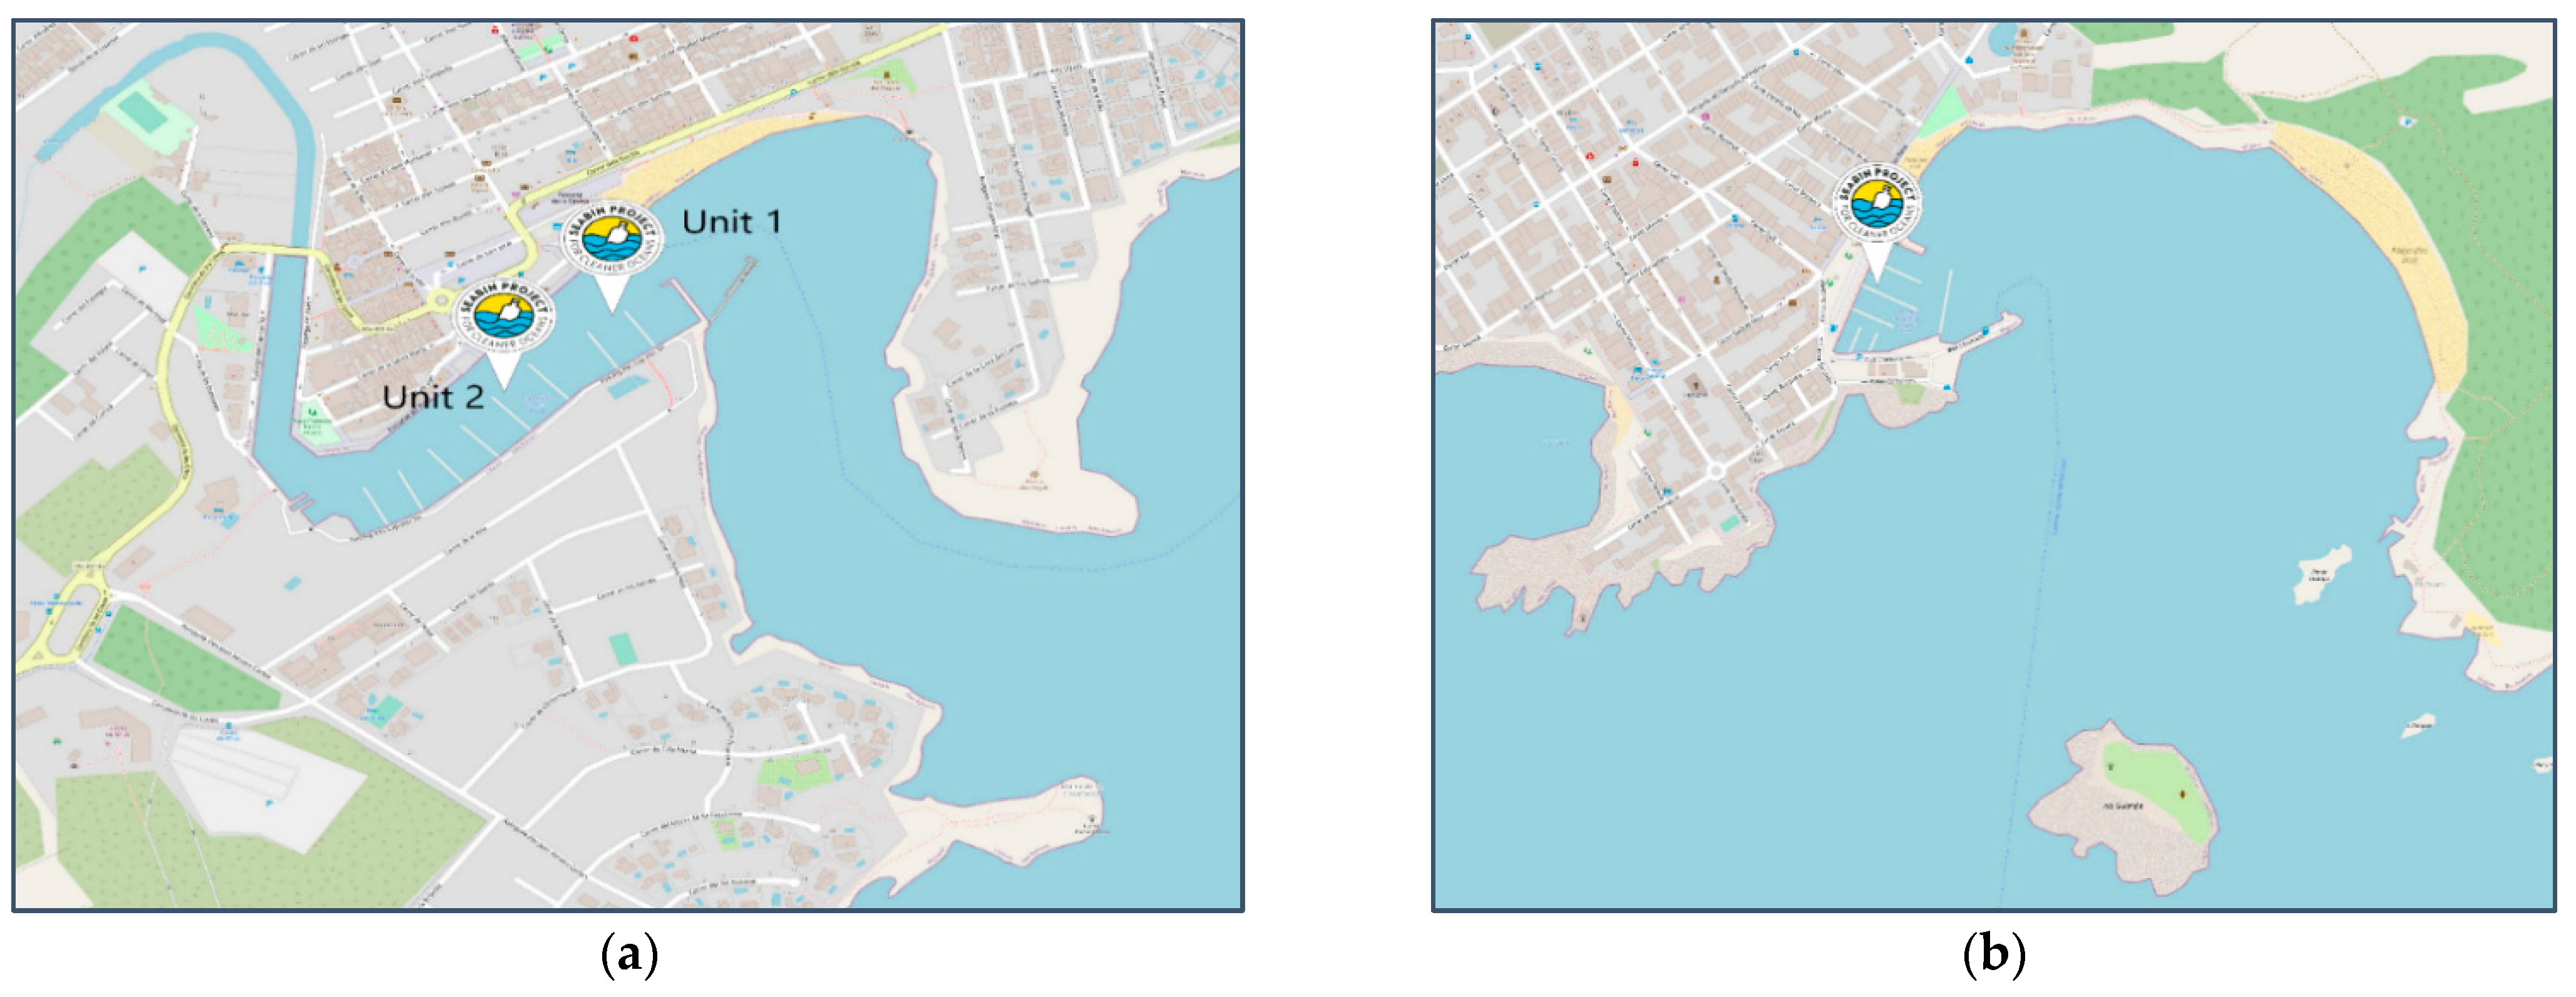
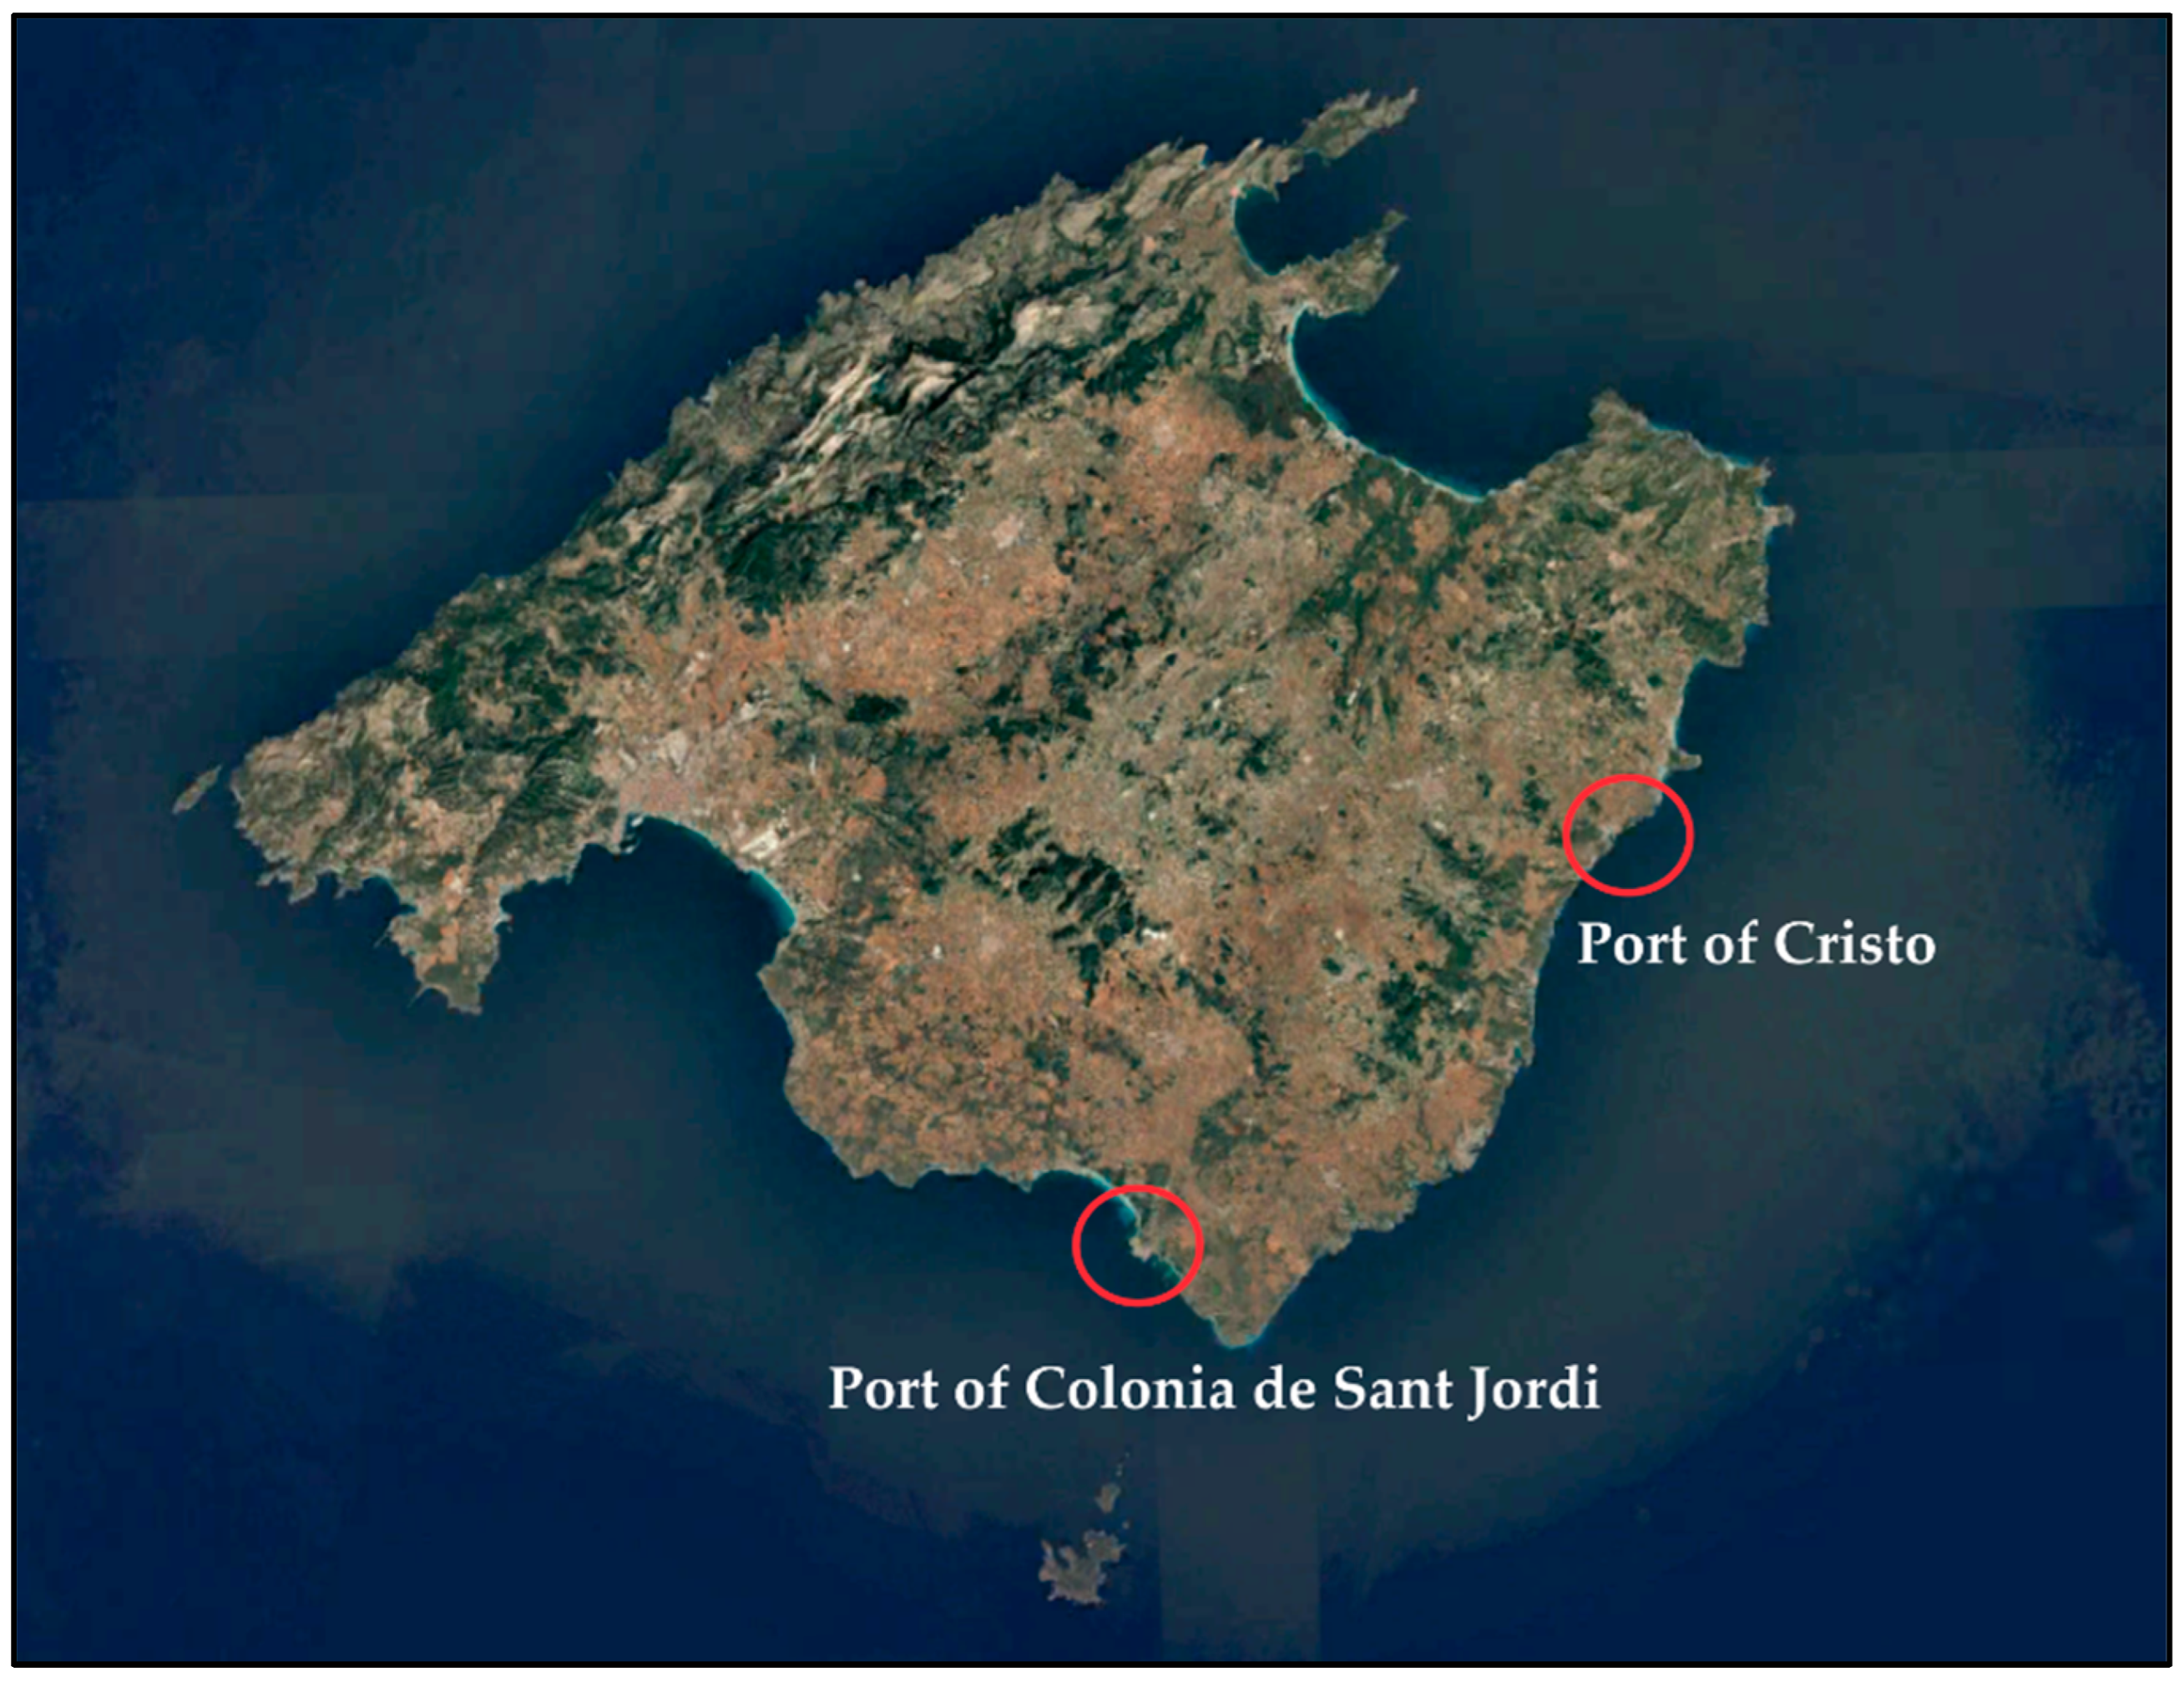
This study was carried out in two Spanish ports on Mallorca Island (
Figure 1), Port of Cristo and Port of Colonia de Sant Jordi, in the framework of the PSAMIDES project (ports small and medium alliance for sustainable development, Interreg MED Programme, co-financed by the European Regional Development Fund).
Port of Cristo is located on the east coast of Mallorca Island, in a small town of the same name (Porto Cristo), 13.8 km from the town and municipality of Manacor. It is a natural port that consists of berths for fishing boats and a marina for pleasure boats and yachts. Port of Cristo is a public port with public ownership, having under 20 employees, and is primarily funded by regional funds. The capacity of the port is 276 berths, with 48,549 m
2 of sheltered area and 60,290 m
2 of unsheltered area (exposed to wind and waves) within the port limits. At the entrance to the port is situated the public beach Platja de Porto Cristo, which certainly impacts the amount and weight of marine litter in the area. The port of Cristo does not have a Waste Management Plan. Therefore, no employees are directly responsible for pollution monitoring and litter collection from the sea surface. Likewise, no procedure or technology is used to collect the litter disposed into the sea. Hence, introducing the floating seabin device was an excellent opportunity to see the advantages of using such technology. For research purposes, two seabin devices were installed in Port of Cristo in to collect data on marine litter (
Figure 2a). The exact geographical positions of devices (given in latitude and longitude) were: 39°32.41′ N 003°20.14′ E (Unit 1) and 39°32.33′ N 003°20.06′ E (Unit 2).
The second port, Port of Colonia de Sant Jordi, is a marina with 318 berths, located in the south of Mallorca near the town of Ses Salines. Besides the pleasure boats and yachts, this port accommodates smaller fishing boats and ferries on lines to the island of Cabrera. Factors that may influence the amount of marine litter in this port are the vicinity of several sandy beaches (Arenal de Sa Ràpita, Platja des Trenc, Platja des Dolç, Platja de ca’n Curt, Platja d’es Carbó, Ses Roquetes, and other), as well as the fact that this port is the largest population centre and tourist resort in the municipality. Therefore, one seabin device was placed inside the marina basin to collect floating marine litter (
Figure 2b). The exact geographical position of the device (given in latitude and longitude) was 39°18.95′ N 002°59.87′ E.
Locations for the installation of seabin devices were selected in accordance with port managers based on observations of the amount of marine litter accumulating in each port and the convenient place for the mounting installation. In addition, the influence of sea currents, wind and waves on the marine litter accumulation was also taken into account when selecting locations for seabin devices, based on experience and subjective assessment of port personnel.
2.2. Sampling Method and Statistical Analysis
Two sea bin devices were installed in Port of Cristo and one in Port of Colonia de Sant Jordi. These devices are relatively small and designed for closed or partially closed water areas like ports, marinas, bays, and canals, where spots of accumulating and retaining litter may be identified and where the oceanographic features are favorable (no high waves or strong currents). The access to the device must be ensured in a way that a responsible person can monitor and empty the collected content regularly.
The tested bin is a product of the Seabin Project company. The size of the catch container is 50 × 50 cm and can collect approximately 3.9 kg of floating litter per day or 1.4 tons per year, depending on weather and litter volumes [
26].
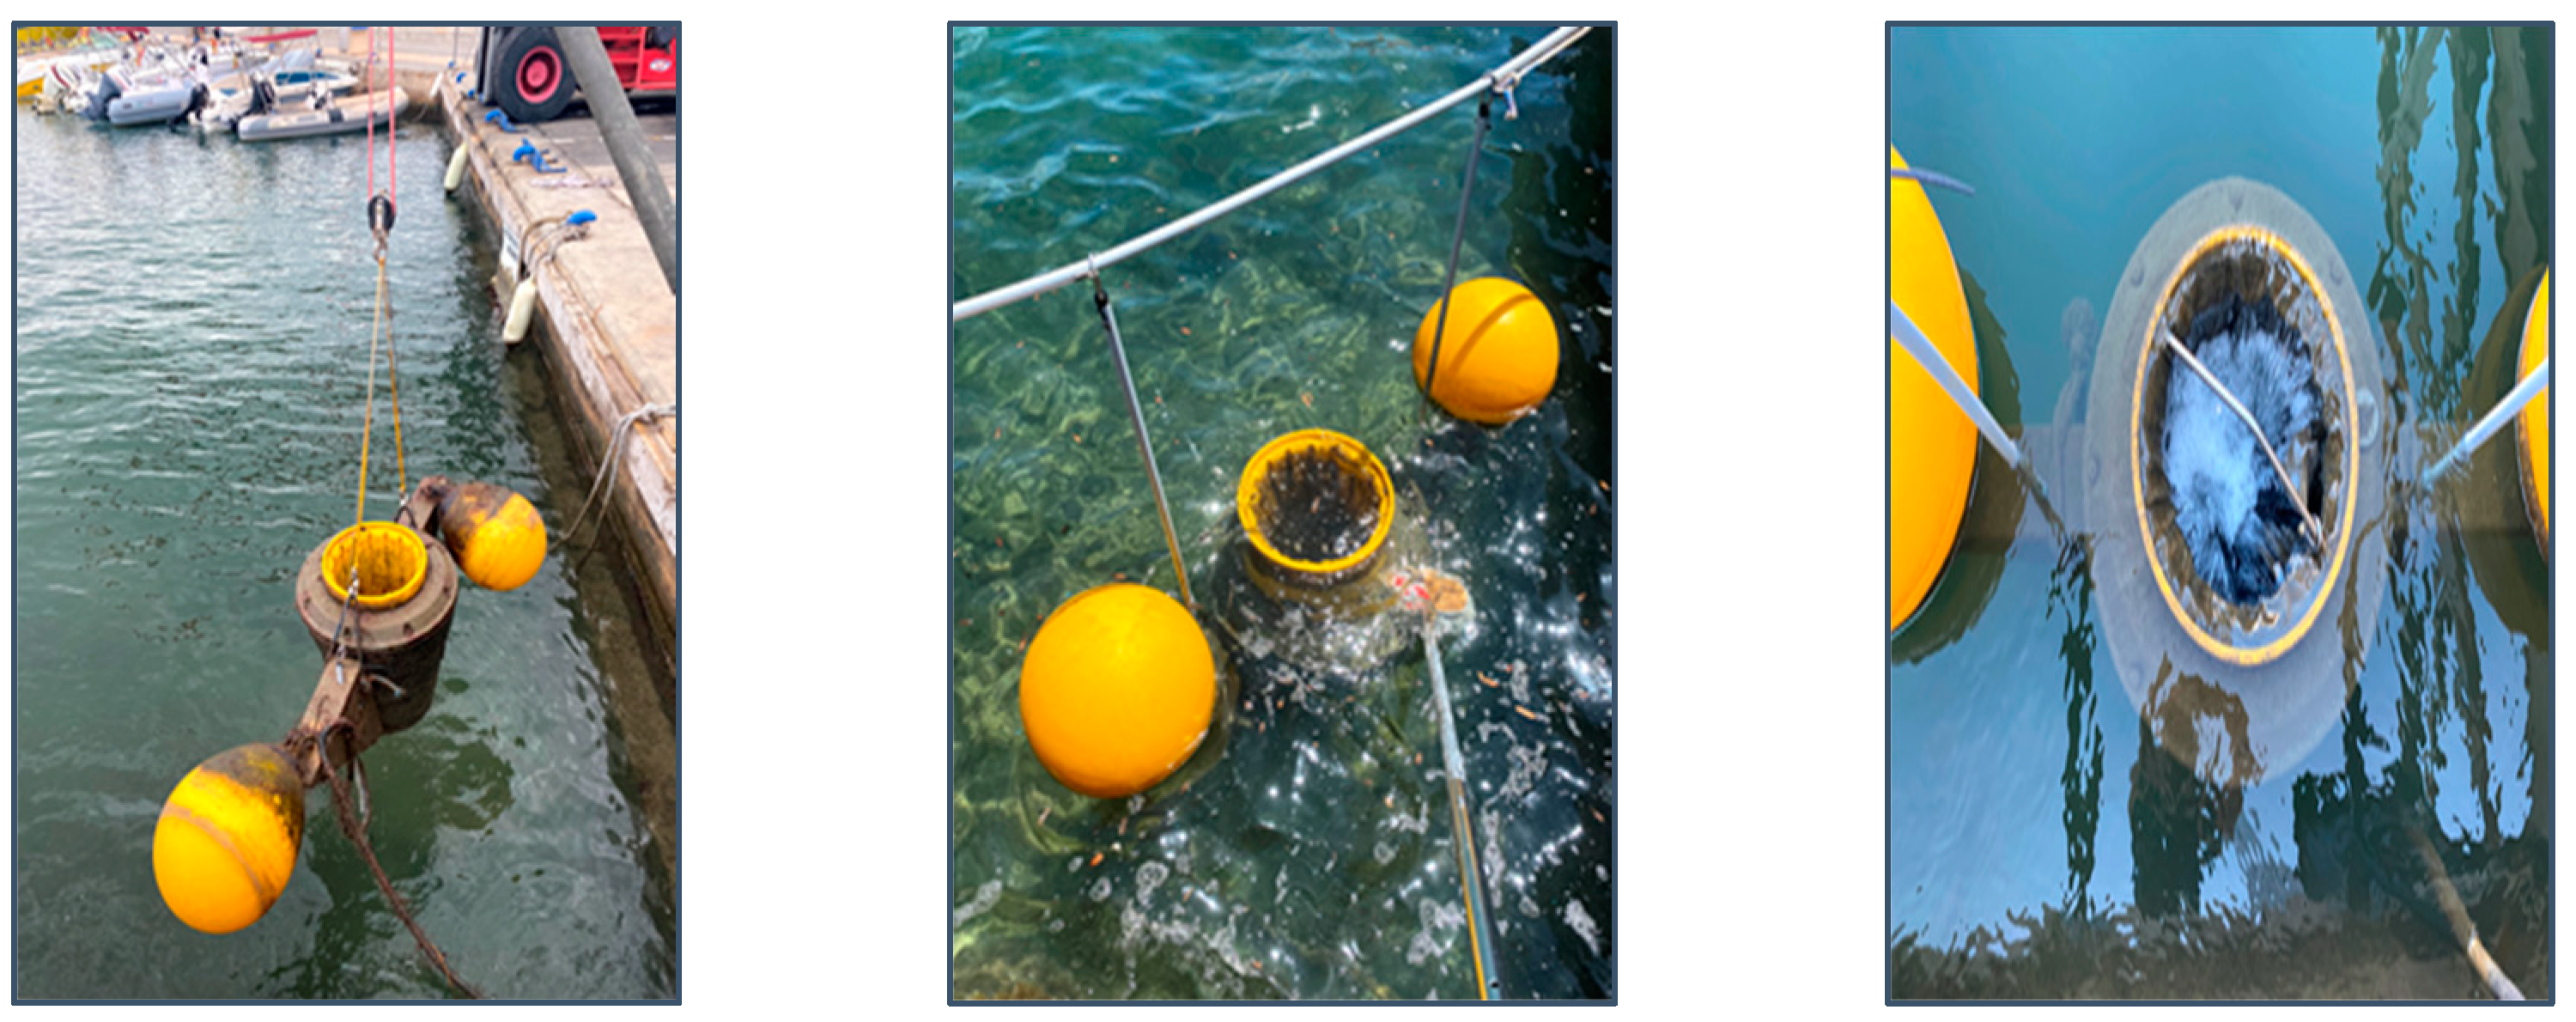
The bin is designed to float and balance on the very surface of the sea, allowing water and litter to pass on top of its edges (
Figure 3).
The surrounding water and litter are attracted to the bin by a weak sea current generated by the water pump whose suction point is on the bottom of the bin.
Once over the edge, water passes through a catch bag placed inside the seabin, while litter is retained in it.
An electric water pump, installed onshore in the vicinity of the device, runs continuously and is capable of displacing 25,000 L/h [
26]. If a piece of litter is too large to be pulled over the edge into the bin, the suction force from the bin’s pump will keep it against the side until it can be retrieved manually.
The tested devices are installed in a way that the bin is supported with two buys designed to keep the bin edge exactly on the sea surface (
Figure 4). In this way, the bin can freely move vertically as the tide level is changing.
The tested device can retain any particle larger than 2 mm, so it is suitable to filter microplastics. The three sites’ device testing and litter collection were performed for five months, from May 2021 to September 2021.
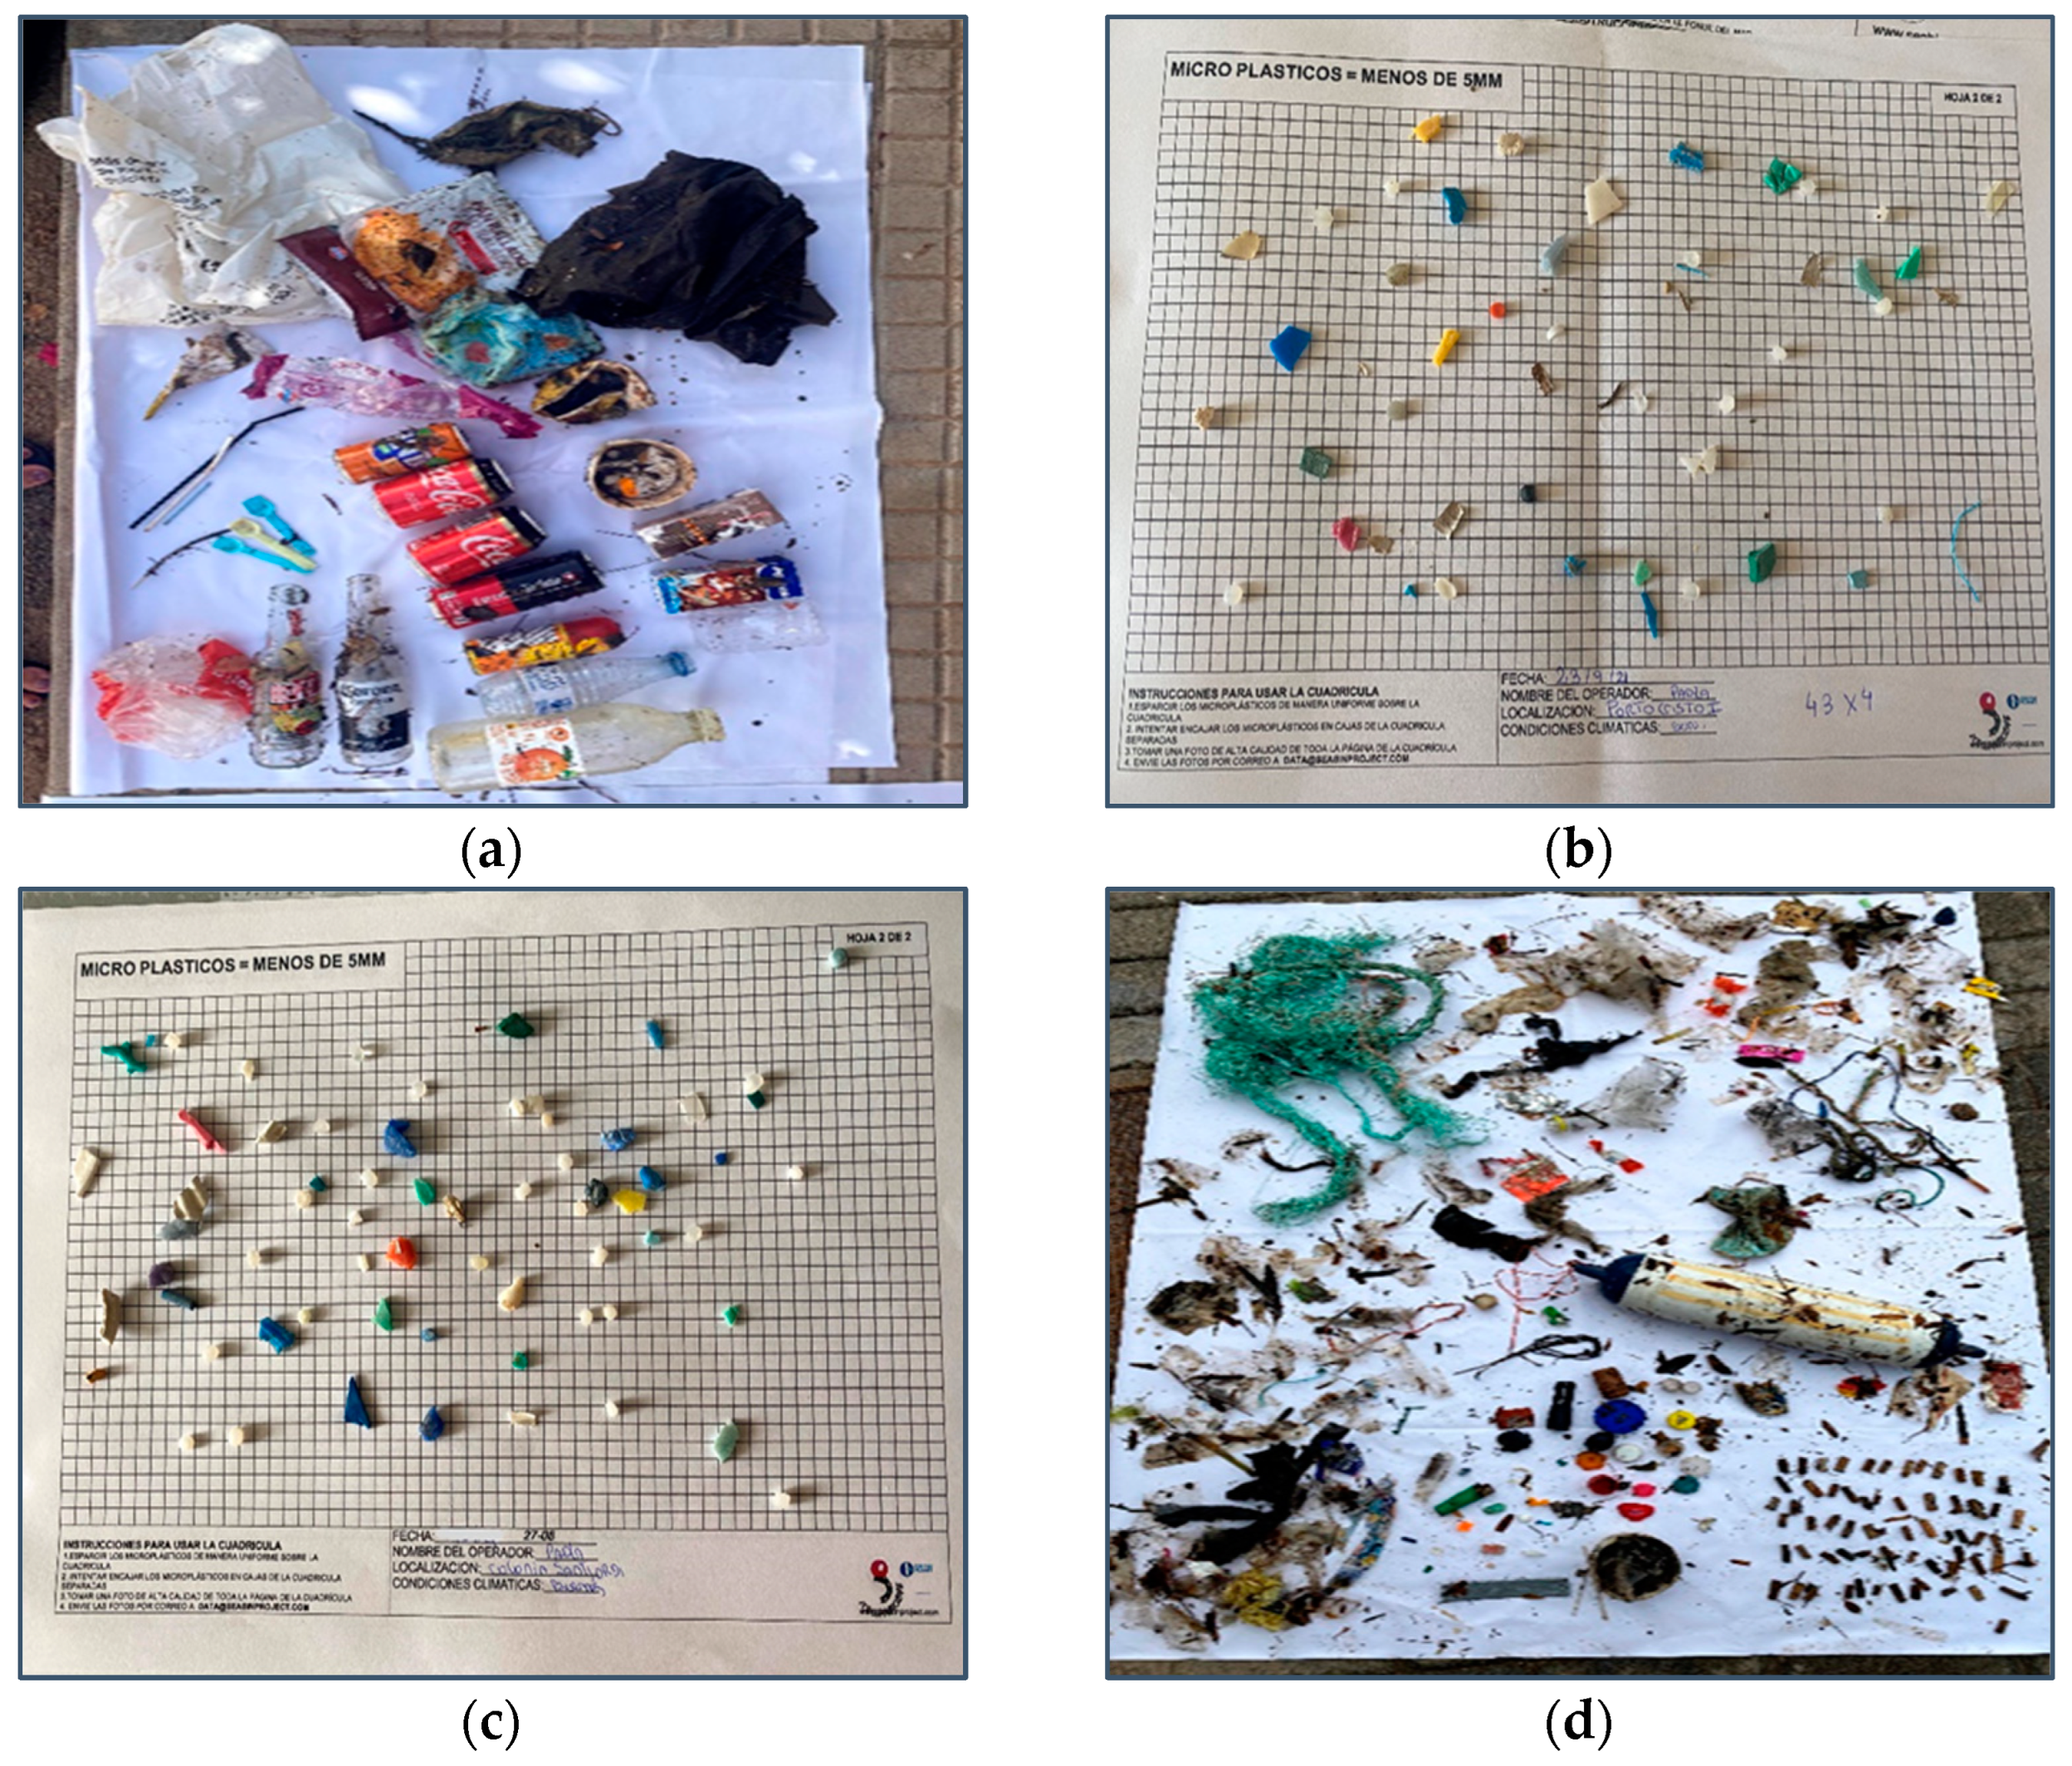
During the research period, all devices were emptied manually every Monday, i.e., once a week at the same time. After each removal, the entire content of the bin was separated on a large white fabric sheet for ease of identification (
Figure 5). Following a thorough inspection, all litter items were placed onto separate sheets based on their material and size. The sorting of all marine litter was done manually with gloves. Small plastic particles were separated with tweezer and measured on a predefined pad for size analysis. After the separation and item count, the weighting took place.
Upon completing the process, the litter was disposed of in the appropriate waste containers.
Methodology of marine litter categorization is done according to the Joint List of Litter Categories Manual for Marine Macro litter Monitoring published by the European Commission [
3].
Statistical analyses based on collected litter data were performed using the Friedman non-parametrical test to determine differences between the amounts of each marine litter category collected by seabin devices in different sampling sites. The test statistic is calculated as follows [
27]:
where:
Rj = the sum of the ranks for sample
j,
n: is the number of independent blocks (here: the number of marine litter categories = 24) and
k is the number of groups or treatment levels (here: the number of sampling sites = 3).
The law of probability of this test statistic is approximated by the chi-square distribution of k − 1 degrees of freedom. A significant level of α = 0.05 was accepted.
Time series analysis is applied to the monthly data on the weight of collected marine litter to search for a time trend. The objective of the time series analysis is to understand how the weight of marine litter collected changes over time (five months). A classical multiplicative time series model consists of a seasonal component, an irregular component, and a trend component. First, the data were visualized, and then the three components of the marine litter collected weight model were extracted: the seasonal component, the trend component, and the irregular (random) component, since month-to-month variations do not follow a pattern.
To perform a time series analysis of the monthly data on the weight of collected marine litter, the Moving Averages (MA) were first calculated when the total number of observed periods was an even number. Three test sites (ports) were observed over a five-month period. Since the observed time period is an odd number, the MAs automatically represent Centred Moving Averages (CMA).
The CMA represents the baseline because it smooths the time series data (five months) to remove the seasonal and irregular components. Next, the differences between the original data and the CMA are extracted to see how much the original data falls on seasonality and irregularity.
3. Results
During 5 months of sampling, in total 15,899 items and 336 kg of floating marine litter was collected from all three seabin devices. The collected litter was sorted according to main material categories for macro litter defined in J-CODE list: artificial polymers (Macro AP), metals, paper, and rubber. In addition, for the overview of main litter categories, the authors added Micro artificial polymers (Micro AP, or microplastic, items < 5 mm) which belongs to the micro litter category (
Table 1). This addition is made because this is one of the predominant categories in collected litter.
The Micro artificial polymers (Micro AP) included mainly unidentified pieces, pellets, and nurdles. The metal detected litter included metal food cans only. The Paper category includes paper and cardboard items, and in this research, all detected items were whole or parts of paper cups (for coffee, ice cream, etc.). In the category Rubber, detected items included mostly rubber balls, toys, and unspecified small pieces.
The data presented in
Table 1 shows that the greatest number of collected items was in Port of Cristo—device no. 2, which is situated approximately in the center of the port basin, with a total of 7123 items (44.8%). This site is followed by the Port of Cristo device no. 1, situated at the entrance of the port basin, with a total of 4946 items (31.1%). Finally, a single device in Port of Colonia de Sant Jordi, situated approximately in the center of the port basin, had the least collected items, with a total of 3830 items (24.1%). The average amount of collected items for individual sites was: 296 for the Port of Cristo device no. 2, 206 for the Port of Cristo device no. 1, and 159 for the Port of Colonia de Sant Jordi considering all categories.
At all sampling sites, the predominant category is Micro AP, followed by Macro AP. Although Port of Colonia de Sant Jordi with one seabin collected the least total amount of litter, the ratio of collected Micro AP (microplastics) at this sampling site was the highest (69%), while in Port of Cristo—device 2 was approximately 62% and at Port of Cristo—device 1 was a a total of 52%.
The absolute number of collected items but also the similarity of the litter composition between sampling sites can be presented by the scatter chart per each main category and per sampling site (
Figure 6). Since the difference in the number of collected items between two main categories (Micro and Macro AP) and all other (Metal, Paper, and Rubber) is substantial, the chart is displayed in logarithmic scale (base 10).
As it can be seen, the predominant category is Micro AP with a total of 9676 collected items (60.86%), followed by Macro AP with a total of 6106 collected items (38.4%). All other categories together are represented in 0.74% (
Figure 7).
Since Macro artificial polymers (larger plastic items) was the second predominant category where items could be identified, a separate
Table 2 is given, providing a detailed breakdown of collected plastic litter per each site. The breakdown is divided into 23 sub categories defined in J-CODE list.
Observing all Macro AP (Macro Artificial Polymers), the predominant category is Unidentified—soft plastic > 5 mm with a total of 1759 collected items (28.8%) and followed by Unidentified—hard plastic > 5 mm with a total of 1528 collected items (25%). All other categories together represent 46.2% of collected Macro AP.
More detailed analysis is showing some particulars; for example, Port of Cristo device no. 1 collected 85% of the total collected plastic drink bottles on all three sampling sites, followed by foamed polystyrene—63%. Port of Cristo device no. 2 collected 69% of plastic crisps packets and wrappers and 53% of unidentified plastic items—hard >5 mm. The seabin in Port of Colonia de Sant Jordi is the only device that collected rubber. Furthermore, the Port of Colonia de Sant Jordi collected 60% syringes and 55% ropes in a total sum of each mentioned category.
The weight was analyzed cumulatively and per month during the research period. The data reveals that the highest accumulation of marine litter was in May and June. In these two months, all devices together collected 57% of the total weight collected during the whole study period (
Figure 8). On the contrary, in July the lowest weight of the total collected litter was at all three sampling sites. The main identified reason for such variation is that the predominantly collected items in this period occupying the catch bag were microplastics < 5 mm, which are exceptionally light.
The greatest total weight of marine litter was collected by the seabin device no. 2 in the Port of Cristo, being 146 kg (43.5%), followed by the seabin device no. 1 in the same port with 118 kg (35.1%), and the device in the Port of Colonia de Sant Jordi with 72 kg (21.4%). The seabin device no. 2 in Port of Cristo collected the most litter by weight in May, being 59.6 kg (56.1%). Altogether, the results show that seabin device no. 2 in the Port of Cristo collected the highest number of items with the highest total weight, followed by seabin device no. 1 in the same port and the seabin device in the Port of Colonia de Sant Jordi.
The Friedman test was performed based on the data on the amount of marine litter collected in each category (
Table 1), while the time series analysis was performed using the data on the weight of collected marine litter (
Figure 8). The Friedman test results (
Table 3) are as follows:
Q = 0.27,
df = 2,
p = 0.87,
p > 0.05, which means that a null hypothesis should not be rejected, indicating that the differences between the means of collected marine litter in different sampling location are not significantly different.
Considering the Friedman test results,
Table 4 presents the time series analysis in terms of seasonality, irregularity, and time trend of monthly time series data on collected marine litter.
The data in
Table 4 show that the seasonality and irregularity components were highest in Port of Cristo—Unit 2 in May (99% above baseline—CMA), while they were lowest in Port of Cristo—Unit 1 in July (60% below baseline—CMA). Then, the irregularity was omitted and only the seasonal component was extracted and quantified (column St). The average seasonal component is highest in May (68% above baseline), followed by June, August, September, and July (51% below baseline). At first glance, it is surprising to see that the weight of marine litter collected is higher in the low season (May and June) than in the high season (July, August, and September). The general assumption is that the weight of marine litter collected is highest in the peak season when the number of users near the test sites is significantly higher.
However, the results are not consistent with this assumption because COVID 19 precautions were taken at the time of technology testing and data collection, so the number of users during the high season was significantly lower than usual. Finally, the linear time trend (Tt) was calculated with an R2 of 52.25%, and presented in
Figure 9, indicating the acceptable significance of the model.
4. Discussion and Conclusions
This paper presented a quantitative and analysis and composition analysis based on visual sorting of marine litter collected by seabin devices installed in two ports on Mallorca Island in Spain.
4.1. Litter Sampling and Analysis
Considering the litter sampling procedure, the seabin proved itself as an very effective device and easy to handle due to its main advantages: small size and limited capacity. Thanks to its innovative design and technical features, the device draws near and efficiently collects drifting floating objects. The collecting size range of objects is limited by the net density (for smallest objects) and bin diameter (for largest objects). Used seabin models can collect particles from 2 mm (e.g., microplastic) to objects up to approximately 40 cm long. Furthermore, the catch bag is detachable where the litter is collected, allowing easy removal, analysis, and later litter disposal.
Regarding the litter analysis, the first of this kind performed in selected ports showed the structure of the litter, which will assist the managing authorities in decision making to apply appropriate measures to improve the environmental protection. The results showed that plastic materials of different sizes comprise the most collected litter (namely microplastic, plastic bottles, utensils, and food packaging). Other predominant litters include paper cups, foam and Styrofoam pieces, rope pieces and fibers. It should be emphasized that no material characterization was performed for in depth litter type analysis, hence the composition analysis is based on visual sorting.
However, the litter composition findings are not surprising, since there is a similarity with many other conducted researches on floating litter in Mediterranean sea and be-yond. If the occasional/seasonal natural debris (from sea and land) are excluded, the plastics in general are the predominant material (mainly degraded to microplastic, bottles, hygiene items, fishing lines, etc.) [
14,
15,
17,
18,
26].
The challenge of the analysis is to prove the major litter sources for a particular litter category. For example, Styrofoam pieces may easily end up in the sea from fishing boats (Styrofoam fish containers), rope pieces and fibers may easily originate from nearby marinas or port areas with the highest concentration of boats and yachts, while food wrappings probably originate from nearby beaches.
The main drawback considering the sampling procedure is the complete dependence on meteorological and oceanographic state. To prove the previously mentioned litter origin hypothesis, further research with seabin devices should be conducted including meteorological and oceanographic measurements. Such measurements would provide information on surface currents, i.e., the current strength, direction and duration (which could significantly differ from currents in deeper sea levels), and wind strength and duration. Furthermore, light winds or winds blowing for short periods may not influence the sea surface enough to change or start the wind-induced sea surface current.
Also, the drift direction of the floating items may not be the same for floating items that are entirely submerged and influenced by currents (e.g., some plastic materials, bags, and paper) and for items that are nearly entirely above the surface and influenced mainly by winds (e.g., empty can or plastic bottle).
Such information is essential to model or assess the speed and direction of different, floating items drifting during a particular meteorological and oceanographic state. Based on that, it is recommended that the emptying of the catch bag occurs before the wind and/or current direction significantly changes, allowing to estimate the direction of the litter source more precisely.
Another recommendation for future researches using this sampling methodology is to evaluate the collected materials in depth using an appropriate material characterization methodology.
4.2. Pollution Protection Effectiveness of the Seabin Device
The pollution protection effectiveness of the seabin device was not the primary aim of the research; hence there were no particular tests on seabin performance. However, several observations and conclusions took place, which should be emphasized. First, since all such devices are attached to a fixed installation, they should be placed in areas within the port where the floating litter accumulates the most. This information should be obtained from competent persons in a port based on their long-term observation and experience or, preferably, from surface current measurements and models. Secondly, there should be a person within the port managing authority designated to inspect and empty the seabin catch bag regularly, preferably on a daily basis. On some occasions, a slight change of wind and/or current direction may significantly increase (or decrease) the accumulation rate of the litter. The amount of collected litter would undoubtedly be more outstanding with such dedication. Thirdly, for highly polluted areas and areas with high naturally generated debris (wood, leaves, seaweed, etc.), the seabin capacity of 20 kg would indeed be too small. Therefore, multiple devices should be installed in such areas, or a different approach should be considered.
To determine the optimal number of sufficient devices to collect the marine litter from the sea surface in the port, the size of the port’s water area should be considered, and the floating litter density should be measured or estimated. This can be done regularly via aerial surveillance monitoring by drones or fixed camera surveillance of the sea surface.
The results of research like this one can contribute to a better understanding of the sea pollution state and could improve the ports’ management in line with sustainable blue growth. Whilst recognizing the mentioned methodological challenges, further research should investigate the residents’ and tourists’ environmental awareness and behavioral patterns to target appropriate measures and corrective actions to reduce marine pollution.


