
Distribution and Bioaccumulation of Essential and Toxic Metals in Tissues of Thaila (Catla catla) from a Natural Lake, Pakistan and Its Possible Health Impact on Consumers


Abstract
1. Introduction
2. Materials and Methods
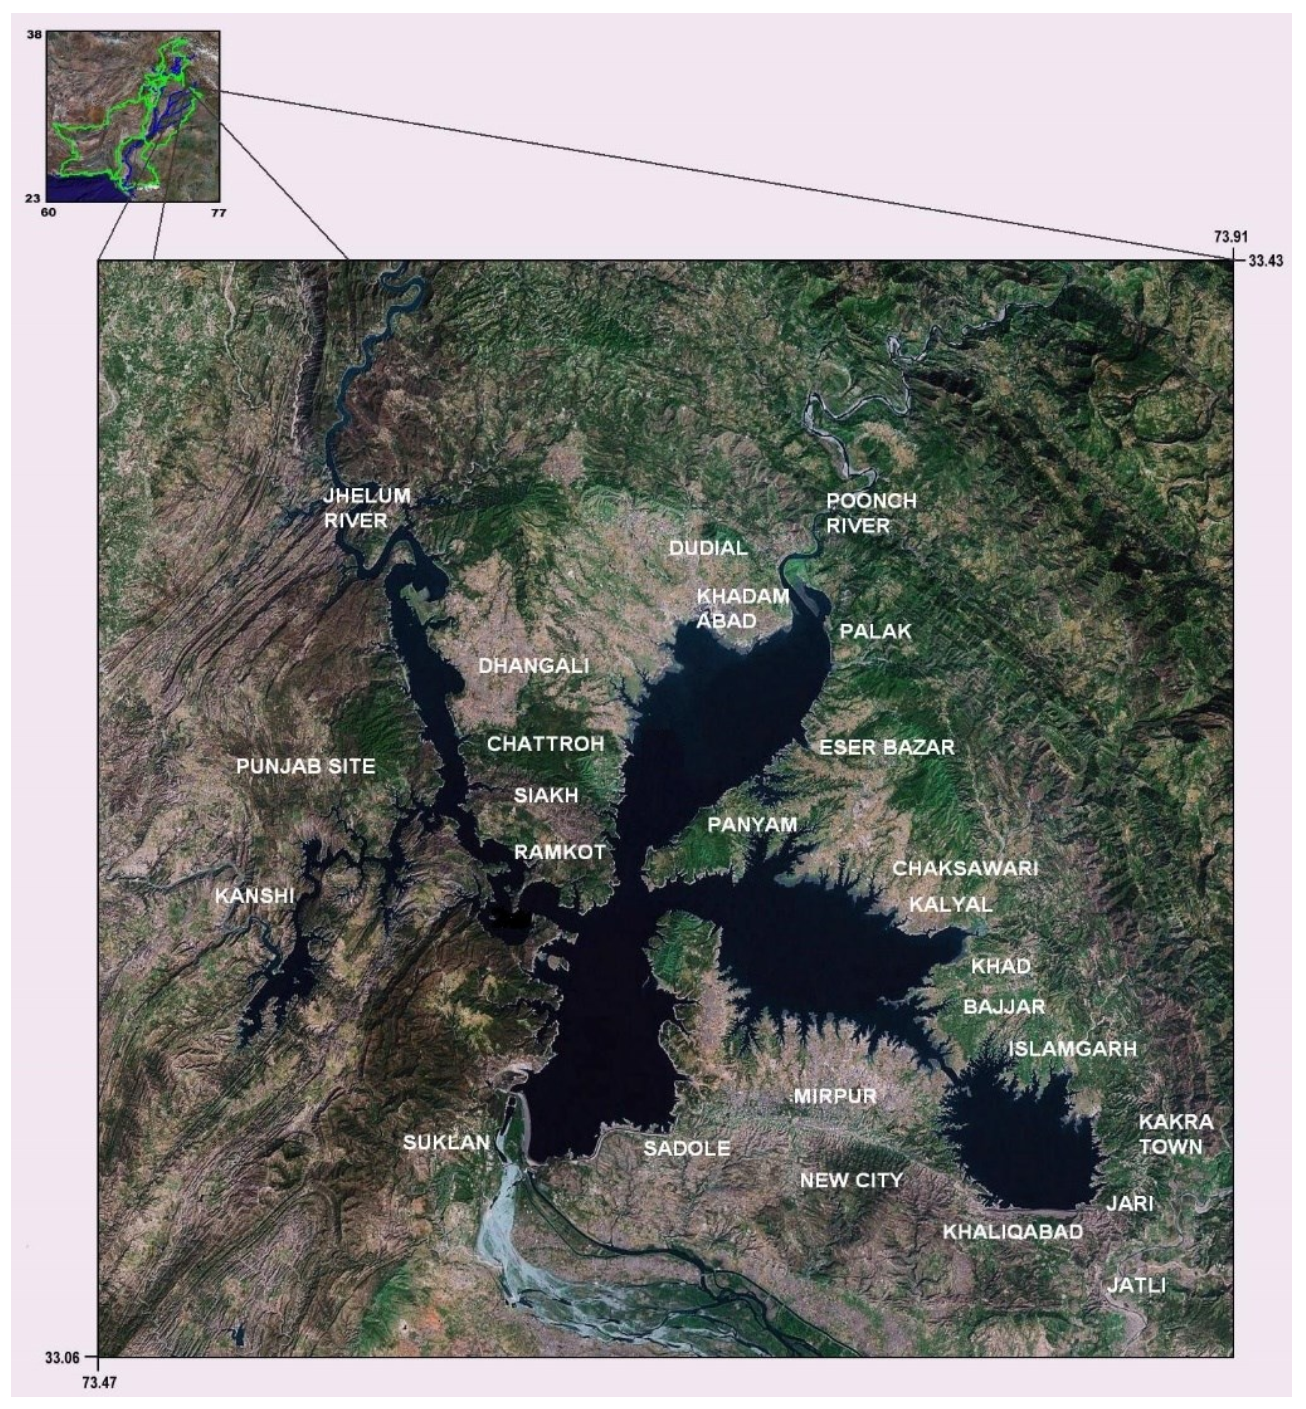
2.1. Study Area
2.2. Sampling
2.3. Sample Preparation and Analysis
2.4. Calculation of Accumulation Levels
2.5. Health Risk Assessment
2.5.1. Coefficient of Condition
2.5.2. Assessment of Daily and Weekly Intakes
2.5.3. Assessment of Target Hazard Quotient (THQ), Hazard Index (HI) and Target Cancer Risk (TCR)
2.6. Statistical Analysis
3. Results and Discussion
3.1. Biometric Data for Catla catla
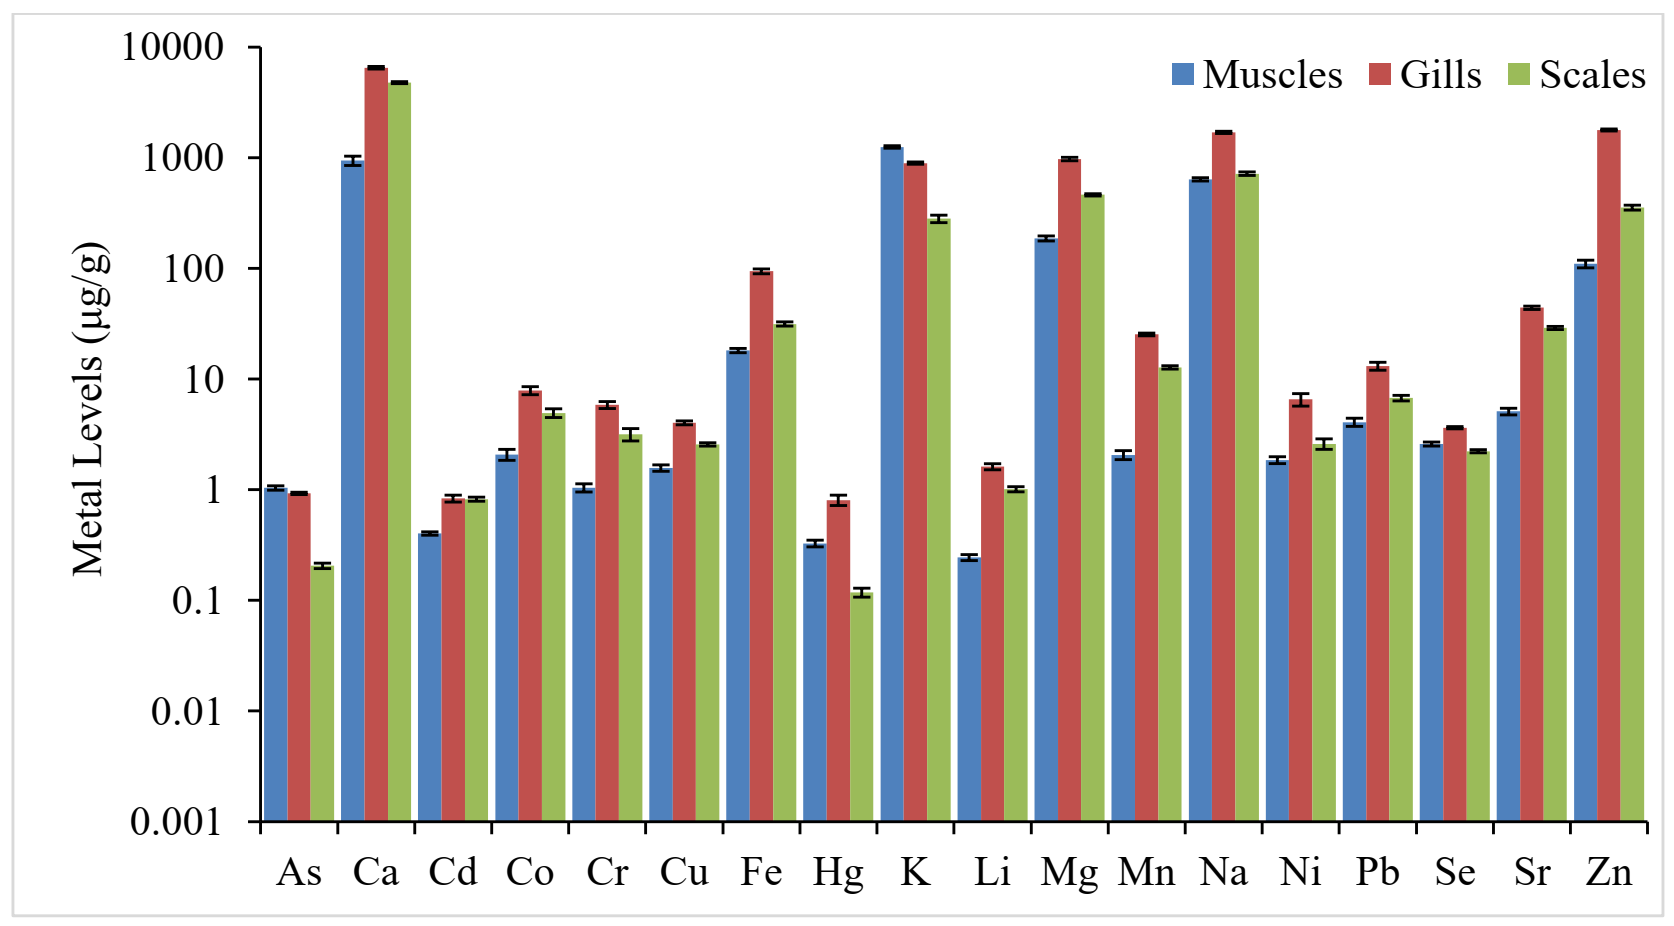
3.2. Metal Concentrations in Tissues of Catla catla
3.3. Comparison of Metal Levels in Fish Tissues
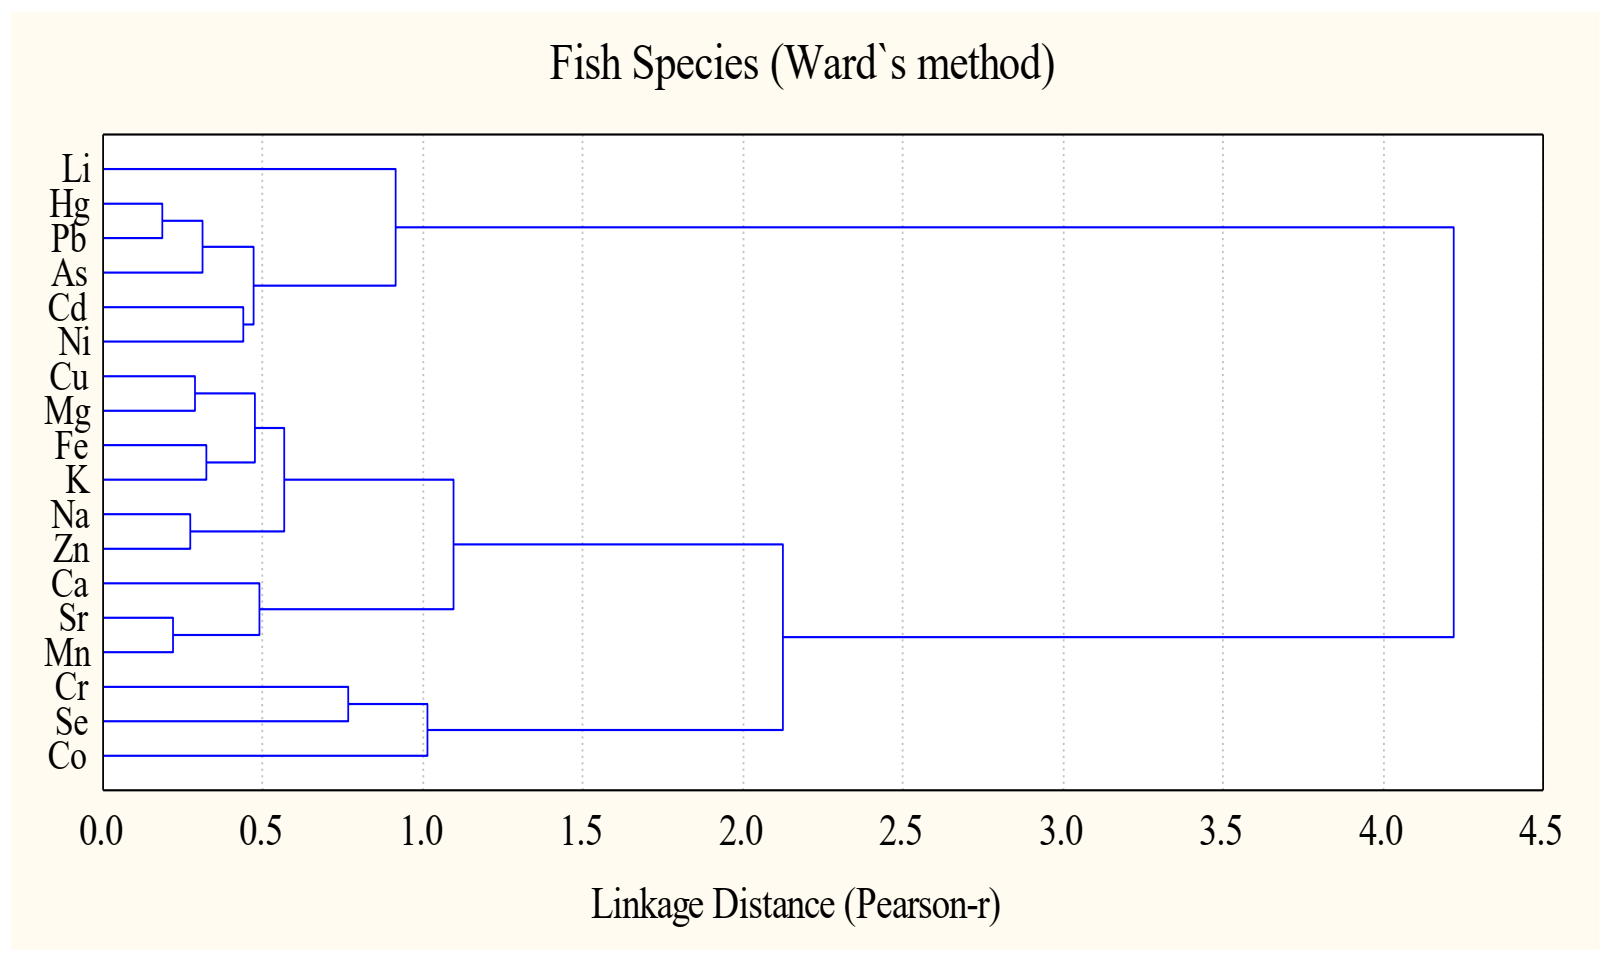
3.4. Multivariate Analyses of Selected Metals in the Fish Species
3.5. Potential Health Risk Assessment
4. Conclusions
Author Contributions
Funding
Institutional Review Board Statement
Informed Consent Statement
Data Availability Statement
Acknowledgments
Conflicts of Interest
References
- Storelli, M.M. Potential human health risks from metals (Hg, Cd, and Pb) and polychlorinated biphenyls (PCBs) via seafood consumption: Estimation of target hazard quotients (THQs) and toxic equivalents (TEQs). Food Chem. Toxicol. 2008, 46, 2782–2788. [Google Scholar] [CrossRef] [PubMed]
- Pieniak, Z.; Verbeke, W.; Scholderer, J. Health-related beliefs and consumer knowledge as determinants of fish consumption. J. Hum. Nutr. Diet. 2010, 23, 480–488. [Google Scholar] [CrossRef] [PubMed]
- Taweel, A.; Shuhaimi-Othman, M.; Ahmad, A.K. Assessment of heavy metals in tilapia fish (Oreochromis niloticus) from the Langat River and Engineering Lake in Bangi, Malaysia, and evaluation of the health risk from tilapia consumption. Ecotoxicol. Environ. Saf. 2013, 93, 45–51. [Google Scholar] [CrossRef] [PubMed]
- Galimberti, C.; Corti, I.; Cressoni, M.; Moretti, V.M.; Menotta, S.; Galli, U.; Cambiaghi, D. Evaluation of mercury, cadmium and lead levels in fish and fishery products imported by air in North Italy from extra-European Union Countries. Food Control 2016, 60, 329–337. [Google Scholar] [CrossRef]
- Ahmed, A.S.S.; Rahman, M.; Sultana, S.; Babu, S.M.O.F.; Sarker, M.S.I. Bioaccumulation and heavy metal concentration in tissues of some commercial fishes from the Meghna River Estuary in Bangladesh and human health implications. Mar. Pollut. Bull. 2019, 145, 436–447. [Google Scholar] [CrossRef]
- Ozden, O.; Ulusoy, Ş.; Erkan, N. Study on the behavior of the trace metal and macro minerals in Mytilus galloprovincialis as a bioindicator species: The case of Marmara Sea, Turkey. J. Verbrauch. Lebensm. 2010, 5, 407–412. [Google Scholar] [CrossRef]
- Copat, C.; Bella, F.; Castaing, M.; Fallico, R.; Sciacca, S.; Ferrante, M. Heavy metals concentrations in fish from Sicily (Mediterranean Sea) and evaluation of possible health risks to consumers. Bull. Environ. Contam. Toxicol. 2012, 88, 78–83. [Google Scholar] [CrossRef]
- Longo, G.; Trovato, M.; Mazzei, V.; Ferrante, M.; Conti, G.O. Ligia italica (Isopoda, Oniscidea) as bioindicator of mercury pollution of marine rocky coasts. PLoS ONE 2013, 8, e58548. [Google Scholar] [CrossRef]
- El-Moselhy, K.M.; Othman, A.I.; El-Azem, H.A.; El-Metwally, M.E.A. Bioaccumulation of heavy metals in some tissues of fish in the Red Sea, Egypt. Egypt. J. Basic Appl. Sci. 2014, 1, 97–105. [Google Scholar] [CrossRef]
- Zohra, B.S.; Habib, A. Assessment of heavy metal contamination levels and toxicity in sediments and fishes from the Mediterranean Sea (southern coast of Sfax, Tunisia). Environ. Sci. Pollut. Res. 2016, 23, 13954–13963. [Google Scholar] [CrossRef]
- Miri, M.; Akbari, E.; Amrane, A.; Jafari, S.J.; Eslami, H.; Hoseinzadeh, E.; Taghavi, M. Health risk assessment of heavy metal intake due to fish consumption in the Sistan region, Iran. Environ. Monit. Assess. 2017, 189, 583. [Google Scholar] [CrossRef]
- Fakhri, Y.; Saha, N.; Miri, A.; Baghaei, M.; Roomiani, L.; Ghaderpoori, M.; Bay, A. Metal concentrations in fillet and gill of parrotfish (Scarus ghobban) from the Persian Gulf and implications for human health. Food Chem. Toxicol. 2018, 118, 348–354. [Google Scholar] [CrossRef]
- Kris-Etherton, P.; Harris, W.; Appel, L. Fish consumption, fish oil, omega-3 fatty acids, and cardiovascular disease. Circulation 2002, 106, 2747–2757. [Google Scholar] [CrossRef]
- Wall, R.; Ross, R.P.; Fitzgerald, G.F.; Stanton, C. Fatty acids from fish: The anti-inflammatory potential of long-chain omega-3 fatty acids. Nutr. Rev. 2010, 68, 280–289. [Google Scholar] [CrossRef]
- Medeiros, R.J.; dos Santos, L.M.G.; Freire, A.S.; Santelli, R.E.; Braga, A.M.C.B.; Krauss, T.M.; Jaco, S.C. Determination of inorganic trace elements in edible marine fish from Rio de Janeiro State, Brazil. Food Control 2012, 23, 535–541. [Google Scholar] [CrossRef]
- Adel, M.; Dadar, M.; Fakhri, Y.; Oliveri Conti, G.; Ferrante, M. Heavy metal concentration in muscle of pike (Esox lucius Linnaeus, 1758) from Anzali international wetland, southwest of the Caspian Sea and their consumption risk assessment. Toxin Rev. 2016, 35, 217–223. [Google Scholar] [CrossRef]
- Arca, M.; Borghi, C.; Pontremoli, R.; De Ferrari, G.M.; Colivicchi, F.; Desideri, G.; Temporelli, P.L. Hypertriglyceridemia and omega-3 fatty acids: Their often overlooked role in cardiovascular disease prevention. Nutr. Metab. Cardiovasc. Dis. 2018, 28, 197–205. [Google Scholar] [CrossRef]
- Hamazaki, K.; Touchida, A.; Takamori, A.; Tanaka, T.; Ito, M.; Inadera, H. Dietary intake of fish and ω-3 polyunsaturated fatty acids and physician-diagnosed allergy in Japanese population: The Japan Environment and Children’s Study. Nutrition 2019, 61, 194–201. [Google Scholar] [CrossRef]
- Jagodic, M.; SnojTratnik, J.; Potocnik, D.; Mazej, D.; Ogrinc, N.; Horvat, M. Dietary habits of Slovenian inland and coastal primiparaous women and fatty acid composition of their human milk samples. Food Chem. Toxicol. 2020, 141, 1–8. [Google Scholar] [CrossRef]
- Molnar, J.; Pal, M. The Effect of Omega-3 Fatty Acids in Health Preservation. J. Food Res. Technol. 2020, 8, 5–7. [Google Scholar]
- Ruhland, S.; Hauser, J.; Kaunziger, I.; Nakamura, Y.; Stollberg, E. Effects of omega-3 fatty acids on working memory in rats with increased sugar intake. J. Funct. Foods 2020, 69, 1–5. [Google Scholar] [CrossRef]
- Amirah, M.N.; Afiza, A.S.; Faizal, W.I.W.; Nurliyana, M.H.; Laili, S. Human health risk assessment of metal contamination through consumption of fish. J. Environ. Pollut. Hum. Health 2013, 1, 1–5. [Google Scholar]
- Fu, J.; Hu, X.; Tao, X.; Yu, H.; Zhang, X. Risk and toxicity assessments of heavy metals in sediments and fishes from the Yangtze River and Taihu Lake, China. Chemosphere 2013, 93, 1887–1895. [Google Scholar] [CrossRef]
- Bastam, K.D.; Afkhami, M.; Mohammadizadeh, M.; Ehsanpour, M.; Chambari, S.; Aghaei, S.; Esmaeilzadeh, M.; Neyestani, M.R.; Lagzaee, F.; Baniamam, M. Bioaccumulation and ecological risk assessment of heavy metals in the sediments and mullet Liza klunzingeri in the northern part of the Persian Gulf. Mar. Pollut. Bull. 2015, 94, 329–334. [Google Scholar] [CrossRef]
- Liu, J.L.; Xu, X.R.; Ding, Z.H.; Peng, J.X.; Jin, M.H.; Wang, Y.S.; Hong, Y.G.; Yue, W.Z. Heavy metals in wild marine fish from South China Sea: Levels, tissue- and species-specific accumulation and potential risk to humans. Ecotoxicology 2015, 24, 1583–1592. [Google Scholar] [CrossRef]
- Omar, W.A.; Saleh, Y.S.; Marie, M.A. Integrating multiple fish biomarkers and risk assessment as indicators of metal pollution along the Red Sea coast of Hodeida, Yemen Republic. Ecotoxicol. Environ. Saf. 2014, 110, 221–231. [Google Scholar] [CrossRef]
- Dadar, M.; Adel, M.; Nasrollahzadeh Saravi, H.; Fakhri, Y. Trace element concentration and its risk assessment in common kilka (Clupeonella cultriventris caspia Bordin, 1904) from southern basin of Caspian Sea. Toxin Rev. 2017, 36, 222–227. [Google Scholar] [CrossRef]
- Sun, X.; Fan, D.; Liu, M.; Tian, Y.; Pang, Y.; Liao, H. Source identification, geochemical normalization and influence factors of heavy metals in Yangtze River Estuary sediment. Environ. Pollut. 2018, 241, 938–949. [Google Scholar] [CrossRef]
- Monroy, M.; Maceda-Veiga, A.; De-Sostoa, A. Metal concentration in water, sediment and four species from Lake Titicaca reveals a large—Scale environmental concern. Sci. Total Environ. 2014, 487, 233–244. [Google Scholar] [CrossRef]
- Jayaprakash, M.; Kumar, R.S.; Giridharan, L.; Sujitha, S.B.; Sarkar, S.K.; Jonathan, M.P. Bioaccumulation of metals in fish species from water and sediments in macrotidal Ennore creek, Chennai, SE coast of India: A metropolitan city effect. Ecotoxicol. Environ. Saf. 2015, 120, 243–255. [Google Scholar] [CrossRef]
- Li, Y.; Liu, H.; Zhou, H.; Ma, W.; Han, Q.; Diao, X.; Xue, Q. Concentration distribution and potential health risk of heavy metals in Mactra veneriformis from Bohai Bay, China. Mar. Pollut. Bull. 2015, 97, 528–534. [Google Scholar] [CrossRef] [PubMed]
- Qian, Y.; Chenglei, C.; Feng, H.; Hong, Z.; Zhu, Q.; Kolenčík, M.; Chang, X. Assessment of metal mobility in sediment, commercial fish accumulation and impact on human health risk in a large shallow plateau lake in southwest of China. Ecotoxicol. Environ. Saf. 2020, 194, 110346. [Google Scholar] [CrossRef] [PubMed]
- Uysal, K.; Köse, E.; Bülbül, M.; Dönmez, M.; Erdogan, Y.; Koyun, M. The comparison of heavy metal accumulation ratios of some fish species in Enne Damme Lake (Kütahya/Turkey). Environ. Monit. Assess. 2009, 157, 355–362. [Google Scholar] [CrossRef] [PubMed]
- Mitra, A.; Chowdhury, R.; Banerjee, K. Concentrations of some heavy metals in commercially important finfish and shellfish of the River Ganga. Environ. Monit. Assess. 2012, 184, 2219–2230. [Google Scholar] [CrossRef]
- Chakraborty, P.; Ramteke, D.; Gadi, S.D.; Bardhan, P. Linkage between speciation of Cd in mangrove sediment and its bioaccumulation in total soft tissue of oyster from the west coast of India. Mar. Pollut. Bull. 2016, 106, 274–282. [Google Scholar] [CrossRef]
- Saha, N.; Mollah, M.Z.I.; Alam, M.F.; Rahman, M.S. Seasonal investigation of heavy metals in marine fishes captured from the Bay of Bengal and the implications for human health risk assessment. Food Control 2016, 70, 110–118. [Google Scholar] [CrossRef]
- Hossain, M.B.; Ahmed, A.S.S.; Sarker, M.S.I. Human health risks of Hg, As, Mn, and Cr through consumption of fish, Ticto barb (Puntius ticto) from a tropical river, Bangladesh. Environ. Sci. Pollut. Res. 2018, 25, 31727–31736. [Google Scholar] [CrossRef]
- Zafarzadeh, A.; Bay, A.; Fakhri, Y.; Keramati, H.; Pouya, R.H. Heavy metal (Pb, Cu, Zn, and Cd) concentrations in the water and muscle of common carp (Cyprinus carpio) fish and associated non-carcinogenic risk assessment: Alagol wetland in the Golestan, Iran. Toxin Rev. 2018, 37, 154–160. [Google Scholar] [CrossRef]
- Chiarelli, R.; Roccheri, M.C. Marine invertebrates as bioindicators of heavy metal pollution. Open J. Met. 2014, 4, 93–106. [Google Scholar] [CrossRef]
- Demirezen, D.; Uruc, K. Comparative study of trace elements in certain fish, meat and meat products. Meat Sci. 2006, 74, 255–260. [Google Scholar] [CrossRef]
- Lafabrie, C.; Pergent, G.; Kantin, R.; Pergent-Martini, C.; Gonzalez, J.L. Trace metals assessment in water, sediment, mussel and seagrass species–validation of the use of Posidonia oceanica as a metal biomonitor. Chemosphere 2007, 68, 2033–2039. [Google Scholar] [CrossRef]
- Fernandez-Maestre, R.; Johnson-Restrepo, B.; Olivero-Verbel, J. Heavy metals in sediments and fish in the Caribbean coast of Colombia: Assessing the environmental risk. Int. J. Environ. Res. 2018, 12, 1–13. [Google Scholar] [CrossRef]
- Anandkumar, A.; Nagarajan, R.; Prabakaran, K.; Bing, C.H.; Rajaram, R.; Li, J.; Du, D. Bioaccumulation of trace metals in the coastal Borneo (Malaysia) and health risk assessment. Mar. Pollut. Bull. 2019, 145, 56–66. [Google Scholar] [CrossRef]
- Authman, M.; Zaki, M.S.; Khallaf, E.A.; Abbas, H.H. Use of fish as bio-indicator of the effects of heavy metals pollution. J. Aquac. Res. Dev. 2015, 6, 328–340. [Google Scholar] [CrossRef]
- Vieira, T.C.; Rodrigues, A.P.C.; Amaral, P.M.G.; de Oliveira, D.F.C.; Rodrigo, A.; Gonçalves Rodrigues e Silva, C.; Vasques, R.O.; Malm, O.; Silva-Filho, E.V.; Godoy, J.M.O.; et al. Evaluation of the bioaccumulation kinetics of toxic metals in fish (A. brasiliensis) and its application on monitoring of coastal ecosystems. Mar. Pollut. Bull. 2020, 151, 110830. [Google Scholar] [CrossRef]
- USEPA, (Environmental Protection Agency), Guidance for Assessing Chemical Contaminant Data for Use in Fish Advisories. Volume 1: Fish Sampling and Analysis, Third Edition from November 2000. Available online: https://www.epa.gov/sites/default/files/2015-06/documents/volume2.pdf (accessed on 3 June 2020).
- Burger, J. Bioindicators: Types, development, and use in ecological assessment and research. Environ. bioindic. 2006, 1, 22–39. [Google Scholar] [CrossRef]
- Sheppard, C.; Al-Husiani, M.; Al-Jamali, F.; Al-Yamani, F.; Baldwin, R.; Bishop, J.; Benzoni, F.; Dutrieux, E.; Dulvy, N.K.; Durvasula, S.R.; et al. The Gulf: A young sea in decline. Mar. Pollut. Bull. 2010, 60, 3–38. [Google Scholar] [CrossRef]
- Naser, H.A. Assessment and management of heavy metal pollution in the marine environment of the Arabian Gulf: A review. Mar. Pollut. Bull. 2013, 72, 6–13. [Google Scholar] [CrossRef]
- Freije, A.M. Heavy metal, trace element and petroleum hydrocarbon pollution in the Arabian Gulf: Review. J. Assoc. Arab. Univ. Basic Appl. Sci. 2015, 17, 90–100. [Google Scholar] [CrossRef]
- BuTayban, N.A.; Preston, M. The distribution and inventory of total and methylmercury in Kuwait Bay. Mar. Pollut. Bull. 2004, 49, 930–937. [Google Scholar] [CrossRef]
- Nejatkhah, P.M.; Zardoost, S.; Vosoughi, A. Variation of heavy metal concentration (Cu, Pb, and Cd) in Nemipterus japonicus (Bloch, 1793) and Scolopsis taeniatus (Cuvier, 1830) in hot and cold season in the coastal waters of Bushehr Province (Persian Gulf). Mar. Sci. 2014, 4, 38–43. [Google Scholar]
- Al-Najare, G.A.; Jaber, A.A.; Talal, A.H.; Hantoush, A.A. The concentrations of heavy metals (copper, nickel, lead, cadmium, iron, manganese) in Tenualosa ilisha (Hamilton, 1822) hunted from Iraqi marine water. Mesop. Environ. J. 2015, 1, 31–43. [Google Scholar]
- Rahimi, E.; Gheysari, E. Evaluation of lead, cadmium, arsenic and mercury heavy metal residues in fish, shrimp and lobster samples from Persian Gulf. Kafkas Üniversitesi Vet. Fakültesi Derg. 2015, 22, 173–178. [Google Scholar]
- Cunningham, P.A.; Sullivan, E.E.; Everett, K.H.; Kovach, S.S.; Rajan, A.; Barber, M.C. Assessment of metal contamination in Arabian/Persian Gulf fish: A review. Mar. Pollut. Bull. 2019, 143, 264–283. [Google Scholar] [CrossRef] [PubMed]
- Gerhardt, A. Bioindicator species and their use in biomonitoring. In Environmental Monitoring; Encyclopedia of Life Support Systems; Inyang, H.I., Daniels, J.L., Eds.; UNESCO Eolss Publisher: Oxford, UK, 2009; Volume 1, pp. 77–123. [Google Scholar]
- Burger, J.; Gochfeld, M. Heavy metals in commercial fish in New Jersey. Environ. Res. 2005, 99, 403–412. [Google Scholar] [CrossRef] [PubMed]
- Ali, M.M.; Ali, M.L.; Islam, M.S.; Rahman, M.Z. Preliminary assessment of heavy metals in water and sediment of Karnaphuli River, Bangladesh. Environ. Nanotechnol. Monit. Manag. 2016, 5, 27–35. [Google Scholar] [CrossRef]
- Machado, K.S.; Al Ferreira, P.A.; Rizzi, J.; Figueira, R.; Froehner, S. Spatial and temporal variation of heavy metals contamination in recent sediments from Barigui River Basin, South Brazil. Environ. Pollut. Clim. Change 2017, 1, 108. [Google Scholar] [CrossRef]
- Liang, H.; Wu, W.L.; Zhang, Y.H.; Zhou, S.J.; Long, C.Y.; Wen, J.; Wang, B.Y.; Liu, Z.T.; Zhang, C.Z.; Huang, P.P.; et al. Levels, temporal trend and health risk assessment of five heavy metals in fresh vegetables marketed in Guangdong Province of China during 2014–2017. Food Control 2018, 92, 107–120. [Google Scholar] [CrossRef]
- Ahmed, M.; Bhowmik, A.C.; Rahman, S.; Haque, M.R. Heavy metal concentration in water, sediments, freshwater mussels and fishes of the river shitalakhya, Bangladesh. Asian J. Water Environ. Pollut. 2010, 7, 77–90. [Google Scholar]
- Islam, G.R.; Habib, M.R.; Waid, J.L.; Rahman, M.S.; Kabir, J.; Akter, S.; Jolly, Y.N. Heavy metal contamination of freshwater prawn (Macrobrachium rosenbergii) and prawn feed in Bangladesh: A market-based study to highlight probable health risks. Chemosphere 2017, 170, 282–289. [Google Scholar] [CrossRef]
- Rahman, M.S.; Hossain, M.S.; Ahmed, M.K.; Akther, S.; Jolly, Y.N.; Akhter, S.; Kabir, M.J.; Choudhury, T.R. Assessment of heavy metals contamination in selected tropical marine fish species in Bangladesh and their impact on human health. Environ. Nanotechnol. Monit. Manag. 2019, 11, 100210. [Google Scholar]
- Zhang, W.; Liu, X.; Cheng, H.; Zeng, E.Y.; Hu, Y. Heavy metal pollution in sediments of a typical mariculture zone in South China. Mar. Pollut. Bull. 2012, 64, 712–720. [Google Scholar] [CrossRef]
- Shibatta, O.A. Reproduçao do pira-brasília, Simpsonichthys boitonei Carvalho (Cyprinodontiformes, Rivulidae), e caracterizaçao de seu habitat na Reserva Ecologica do Instituto Brasileiro de Geografia e Estatística, Brasília, Distrito Federal, Brasil. Rev. Bras. Zool. 2005, 22, 1146–1151. [Google Scholar] [CrossRef]
- Eastwood, S.; Couture, P. Seasonal variations in condition and liver metal concentrations of yellow perch (Perca flavescens) from a metal-contaminated environment. Aquat. Toxicol. 2002, 58, 43–56. [Google Scholar] [CrossRef]
- Dane, H.; Sisman, T. A morpho-histopathological study in the digestive tract of three fish species influenced with heavy metal pollution. Chemosphere 2020, 242, 125212. [Google Scholar] [CrossRef]
- Sheikh, M.; Laghari, M.Y.; Lashari, P.K.; Khooharo, A.R.; Narejo, N.T. Current status of three major carps (Labeo rohita, Cirrhinus mrigala and Catla catla) in the downstream indus river, sindh. Fish Aqua. J. 2017, 8, 1–3. [Google Scholar]
- Mirza, Z.S.; Nadeem, M.S.; Beg, M.A.; Sulehria, A.Q.K.; Shah, S.I. Current status of fisheries in the Mangla Reservoir, Pakistan. Biologia 2012, 58, 31–39. [Google Scholar]
- Saleem, M.; Iqbal, J.; Shah, M.H. Study of seasonal variations and risk assessment of selected metals in sediments from Mangla Lake, Pakistan. J. Geochem. Explor. 2013, 125, 144–152. [Google Scholar] [CrossRef]
- Saleem, M.; Iqbal, J.; Shah, M.H. Seasonal variations, risk assessment and multivariate analysis of trace metals in the freshwater reservoirs of Pakistan. Chemosphere 2019, 216, 715–724. [Google Scholar] [CrossRef]
- USEPA. Technical Standard Operating Procedure, SOP EH-06; adopted from draft ERT/REAC SOP for fish collection; Unites States Environmental Protection Agency: East Helena Site, MT, USA, 2003. [Google Scholar]
- Tekin-Ozan, S.; Kir, I. Seasonal variations of heavy metals in some organs of carp (Cyprinus carpio L., 1758) from Beysehir Lake (Turkey). Environ. Monit. Assess. 2008, 138, 201–206. [Google Scholar] [CrossRef]
- Jones, B.R.; Laslett, R.E. Methods for analysis for trace metals in marine and other samples, Aquatic Environment Protection: Analytical methods. Ministry of Agriculture, Fisheries and Food, Directorate of Fisheries Research. Lowestoft 1994, 11, 1–29. [Google Scholar]
- Low, K.H.; Zain, S.M.; Abas, M.R. Evaluation of microwave-assisted digestion condition for the determination of metals in fish samples by inductively coupled plasma mass spectrometry using experimental designs. Int. J. Environ. Anal. Chem. 2012, 92, 1161–1175. [Google Scholar] [CrossRef]
- Qin, D.; Jiang, H.; Bai, S.; Tang, S.; Mou, Z. Determination of 28 trace elements in three farmed cyprinid fish species from Northeast China. Food Control 2015, 50, 1–8. [Google Scholar] [CrossRef]
- Wang, X.; Liu, X.; He, Y.; Hu, X.; Zha, F.; Liu, G.; Li, H.; Zheng, L.; Dong, Z. Seasonal variations and health risk of heavy metals in the muscle of Crucian carp (Carassius auratus) cultured in subsidence ponds near Suzhou, East-central China. Expo. Health 2016, 8, 79–91. [Google Scholar] [CrossRef]
- Radojevic, M.; Bashkin, V.M. Practical Environmental Analysis; Royal Society of Chemistry: Cambridge, UK, 1999. [Google Scholar]
- Emami, K.; Ghazi-Khansari, F.; Abdollahi, M. Heavy metals content of canned tuna fish. Food Chem. 2005, 93, 293–296. [Google Scholar] [CrossRef]
- Usero, J.; GonzBlez-Regalado, E.; Gracia, I. Trace metals in the bivalve molluscs Ruditapes decussatus and Ruditapes philippinarum from the Atlantic coast of southern Spain. Environ. Int. 1997, 23, 291–298. [Google Scholar] [CrossRef]
- Abdel-Khalek, A.A.; Elhaddad, E.; Mamdouh, S.; Marie, M.A.S. Assessment of metal pollution around sabal drainage in River Nile and its impacts on bioaccumulation level, metals correlation and human risk hazard using Oreochromis niloticus as a bioindicator. Turkish J. Fish. Aquat. Sci. 2016, 16, 227–239. [Google Scholar]
- Łuczyńska, J.; Paszczyk, B.; Łuczyński, M.J. Fish as a bioindicator of heavy metals pollution in aquatic ecosystem of Pluszne Lake, Poland, and risk assessment for consumer’s health. Ecotoxicol. Environ. Saf. 2018, 153, 60–67. [Google Scholar] [CrossRef]
- Datta, S.N.; Kaur, V.I.; Dhawan, A.; Jassal, G. Estimation of length-weight relationship and condition factor of spotted snakehead Channa punctata (Bloch) under different feeding regimes. SpringerPlus 2013, 2, 436. [Google Scholar] [CrossRef]
- Ahmed, E.O.; Ali, M.E.; Aziz, A.A.; Rafi, E.M. Length-weight relationships and condition factors of five freshwater fish species in Roseires reservoir, Sudan. Eur. J. Phys. Agric. Sci. 2017, 5, 26–33. [Google Scholar]
- Gyimah, E.; Mensah, O.A.J.K.; Bortey-Sam, N. Bioaccumulation factors and multivariate analysis of heavy metals of three edible fish species from the Barekese reservoir in Kumasi, Ghana. Environ. Monit. Assess. 2018, 190, 553. [Google Scholar] [CrossRef]
- Dee, K.H.; Abdullah, F.; Nasir, S.N.A.; Appalasamy, S.; Mohd Ghazi, R.; Eh Rak, A. Health risk assessment of heavy metals from smoked Corbicula fluminea collected on Roadside Vendors at Kelantan, Malaysia. BioMed Res. Int. 2019, 9596810, 1–9. [Google Scholar] [CrossRef]
- Iqbal, J.; Shah, M.H. Study of seasonal variations and health risk assessment of heavy metals in Cyprinus carpio from Rawal Lake, Pakistan. Environ. Monit. Assess. 2014, 186, 2025–2037. [Google Scholar] [CrossRef]
- Lin, M.C. Risk assessment on mixture toxicity of arsenic, zinc and copper intake from consumption of milkfish, Chanos chanos (Forsskal), cultured using contaminated groundwater in Southwest Taiwan. Bull. Environ. Contam. Toxicol. 2009, 83, 125–129. [Google Scholar] [CrossRef]
- USEPA. USEPA Region III Risk-Based Concentration Table: Technical Background Information; Unites States Environmental Protection Agency: Washington, DC, USA, 2006. [Google Scholar]
- Alamdar, A.; Eqani, S.A.M.A.S.; Hanif, N.; Ali, S.M.; Fasola, M.; Bokhari, H.; Katsoyiannis, I.A.; Shen, H. Human exposure to trace metals and arsenic via consumption of fish from river Chenab, Pakistan and associated health risks. Chemosphere 2017, 168, 1004–1012. [Google Scholar] [CrossRef]
- USEPA (United States Environmental Protection Agency). Risk-Based Concentration Table. Region 3. Philadelphia, PA. 2010. Available online: http://www.epa.gov/reg3hwmd/risk/human/index.htm (accessed on 1 September 2014).
- USEPA. Risk-Based Concentration Table. 2011. Available online: http://www.epa.gov/reg3hwmd/risk/human/index.htm (accessed on 1 September 2014).
- Iqbal, J.; Shah, M.H. Distribution, correlation and risk assessment of selected metals in urban soils from Islamabad, Pakistan. J. Hazard. Mater. 2011, 192, 887–898. [Google Scholar] [CrossRef]
- StatSoft. STATISTICA for Windows; Computer Programme Manual: Tulsa, OK, USA, 1999. [Google Scholar]
- Bibi, N.; Shah, M.H.; Khan, N.; Mahmood, Q.; Aldosari, A.A.; Abbasi, A.M. Analysis and health risk assessment of heavy metals in some onion varieties. Arab. J. Chem. 2021, 14, 103364. [Google Scholar] [CrossRef]
- Carvalho, M.L.; Santiago, S.; Nunes, M.L. Assessment of the essential element and heavy metal content of edible fish muscle. Anal. Bioanal. Chem. 2005, 382, 426–432. [Google Scholar] [CrossRef]
- Yilmaz, A.B.; Sangun, M.K.; Yaglioglu, D.; Turan, C. Metals (major, essential to non-essential) composition of the different tissues of three demersal fish species from Iskenderun Bay, Turkey. Food Chem. 2010, 123, 410–415. [Google Scholar] [CrossRef]
- Mogobe, O.; Mosepele, K.; Masamba, W.R.L. Essential mineral content of common fish species in Chanoga, Okavango Delta, Botswana. Afr. J. Food Sci. 2015, 9, 480–486. [Google Scholar]
- Kalyoncu, L.; Kalyoncu, H.; Arslan, G. Determination of heavy metals and metals levels in five fish species from Isikli Dam Lake and Karacaoren Dam Lake (Turkey). Environ. Monit. Assess. 2012, 184, 2231–2235. [Google Scholar] [CrossRef] [PubMed]
- Stranges, S.; Navas-Acien, A.; Rayman, M.P.; Guallar, E. Selenium status and cardiometabolic health: State of the evidence. Nutr. Metab. Cardiovasc. Dis. 2010, 20, 754–760. [Google Scholar] [CrossRef] [PubMed]
- Pieczynska, J.; Grajeta, H. The role of selenium in human conception and pregnancy. J. Trace Elem. Med. Biol. 2015, 29, 31–38. [Google Scholar] [CrossRef] [PubMed]
- Amaral, A.F.; Cantor, K.P.; Silverman, D.T.; Malats, N. Selenium and bladder cancer risk: A metaanalysis. Cancer Epidemiol. Biomark. Prev. 2010, 19, 2407–2415. [Google Scholar] [CrossRef] [PubMed]
- Rayman, M.P. Selenium and human health. Lancet 2012, 379, 1256–1268. [Google Scholar] [CrossRef]
- Alam, M.G.M.; Tanaka, A.; Allinson, G.; Laurenson, L.J.B.; Stagnitti, F.; Snow, E.T. A comparison of trace element concentrations in cultured and wild carp (Cyprinus carpio) of Lake Kasumigaura, Japan. Ecotoxicol. Environ. Saf. 2002, 53, 348–354. [Google Scholar] [CrossRef]
- Schenone, N.F.; Avigliano, E.; Goessler, W.; Cirelli, A.F. Toxic metals, trace and major elements determined by ICPMS in tissues of Parapimelodus valenciennis and Prochilodus lineatus from Chascomus Lake, Argentina. Microchem. J. 2014, 112, 127–131. [Google Scholar] [CrossRef]
- Erdogrul, O.; Erbilir, F. Heavy metal and trace elements in various fish samples from Sır Dam Lake, Kahramanmaras, Turkey. Environ. Monit. Assess. 2007, 130, 373–379. [Google Scholar] [CrossRef]
- Edelstein, S.; Sharlin, J. Life Cycle Nutrition: An Evidence-Based Approach; Jones & Bartlett Learning: Sudburry, MA, USA, 2009; Volume 1, p. 198. [Google Scholar]
- Sayre, L.M.; Perry, G.; Atwood, C.S.; Smith, M.A. The role of metals in neurodegenerative diseases. Cell. Mol. Biol. 2000, 46, 731–741. [Google Scholar]
- Adebiyi, F.M.; Sonibare, J.A.; Adedosu, T.A.; Daramola, A.A.; Omode, P.E.; Obanijesu, E.O. Assessment of the effects of air pollution using road-side roasted meats (Suya) as indicators. Environ. Bioindic. 2008, 3, 172–179. [Google Scholar] [CrossRef]
- Rasmussen, M.L.; Folsom, A.R.; Catellier, D.J.; Tsai, M.Y.; Garg, U.; Eckfeldt, J.H. A prospective study of coronary heart disease and the hemochromatosis gene (HFE) C282Y mutation: The Atherosclerosis Risk in Communities (ARIC) study. Atherosclerosis 2001, 154, 739–746. [Google Scholar] [CrossRef]
- Atolaiye, B.O.; Babalola, J.O.; Adebayo, M.A.; Aremu, M.O. Equilibrium modeling and pH dependence of the adsorption capacity of Vitex doniana leaf for metal ions in aqueous solutions. Afr. J. Biotechnol. 2009, 8, 507–514. [Google Scholar]
- Hao, Y.; Chen, L.; Zhang, X.; Zhang, D.; Zhang, X.; Yu, Y.; Fu, J. Trace elements in fish from Taihu Lake, China: Levels, associated risks, and trophic transfer. Ecotoxicol. Environ. Saf. 2013, 90, 89–97. [Google Scholar] [CrossRef]
- Kumar, M.; Gupta, N.; Ratn, A.; Awasthi, Y.; Prasad, R.; Trivedi, A.; Trivedi, S.P. Biomonitoring of heavy metals in river ganga water, sediments, plant, and fishes of different trophic levels. Biol. Trace Elem. Res. 2020, 193, 536–547. [Google Scholar] [CrossRef]
- WHO. Health criteria other supporting information. In Guidelines for Drinking Water Quality, 2nd ed.; WHO Press: Geneva, Switzerland, 2000; Volume 2, pp. 31–388. [Google Scholar]
- FAO. Compilation of Legal Limits for Hazardous Substances in Fish and Fishery Products. FAO Fishery Circular No. 464; Food and Agriculture Organization of the United Nations: Rome, Italy, 2000; pp. 5–10. [Google Scholar]
- Oruch, R.; Elderbi, M.A.; Khattab, H.A.; Pryme, I.F.; Lund, A. Lithium: A review of pharmacology, clinical uses, and toxicity. Eur. J. Pharmacol. 2014, 740, 464–473. [Google Scholar] [CrossRef]
- El-Said, G.F.; El-Sadaawy, M.M.; Shobier, A.H.; Ramadan, S.E. Human Health Implication of Major and Trace Elements Present in Commercial Crustaceans of a Traditional Seafood Marketing Region, Egypt. Biol. Trace Elem. Res. 2020, 199, 315–328. [Google Scholar] [CrossRef]
- Marshall, T.M. Lithium as a Nutrient. J. Am. Physicians Surg. 2015, 20, 104–109. [Google Scholar]
- Agency for Toxic Substances and Disease Registry. Toxicological Profile for Strontium; Department of Health and Human Services, Public Health Service: Washington, DC, USA, 2004; pp. 1–445. Available online: http://www.atsdr.cdc.gov/toxprofiles/tp159.pdf (accessed on 3 October 2020).
- Chen, M.; Tang, Y.L.; Ao, J.; Wang, D. Effects of strontium on photosynthetic characteristics of oilseed rape seedlings. Russ. J. Plant Physiol. 2012, 59, 772–780. [Google Scholar] [CrossRef]
- Sivaperumal, P.; Sankar, T.V.; Nair, P.G. Heavy metal concentration in fish, shellfish and fish products from internal markets of India vis-a-vis international standards. Food Chem. 2007, 102, 612–620. [Google Scholar] [CrossRef]
- Anandkumar, A.; Nagarajan, R.; Prabakaran, K.; Rajaram, R. Trace metal dynamics and risk assessment in the commercially important marine shrimp species collected from the Miri coast, Sarawak, East Malaysia. Reg. Stud. Mar. Sci. 2017, 16, 79–88. [Google Scholar] [CrossRef]
- MAFF. Monitoring and Surveillance of Non-Radioactive Contaminants in the Aquatic Environment and Activities Regulating the Disposal of Wastes at Sea, 1997; Aquatic Environment Monitoring Report Number 52; Ministry of Agriculture, Fisheries and Food (MAFF): Lowestoft, UK, 2000. [Google Scholar]
- Sengil, A.; Ozacar, M.; Turkmenler, H. Kinetic and isotherm studies of Cu (II) biosorption onto valonia tannin resin. J. Hazard. Mater. 2009, 162, 1046–1052. [Google Scholar] [CrossRef]
- Arulkumar, A.; Paramasivam, S.; Rajaram, R. Toxic heavy metals in commercially important food fishes collected from Palk Bay, Southeastern India. Mar. Pollut. Bull. 2017, 119, 454–459. [Google Scholar] [CrossRef]
- Storelli, A.; Barone, G.; Dambrosio, A.; Garofalo, R.; Busco, A.; Storelli, M.M. Occurrence of trace metals in fish from South Italy: Assessment risk to consumer’s health. J. Food Compos. Anal. 2020, 90, 103487. [Google Scholar] [CrossRef]
- USEPA. Methods for Chemical Analysis of Water and Waste, EPA Report 600/4-79-020; Office of Water, Unites States Environmental Protection Agency: Cincinnati, OH, USA, 1983. [Google Scholar]
- França, S.; Vinagre, C.; Caçador, I.; Cabral, H.N. Heavy metal concentrations in sediment, benthicinvertebrates and fish in three salt marsh areas subjected to different pollution loads in the Tagus Estuary (Portugal). Mar. Pollut. Bull. 2005, 50, 993–1018. [Google Scholar] [CrossRef]
- Dey, S.K.; Roy, S. Effects of chromium on certain aspects of cellular toxicity. Iran. J. Toxicol. 2009, 2, 260–267. [Google Scholar]
- Forti, E.; Salovaara, S.; Cetin, Y. In vitro evaluation of the toxicity induced by nickel soluble and particulate forms in human airway epithelial cells. Toxicol. Vitr. 2011, 25, 454–461. [Google Scholar] [CrossRef]
- Gumpu, M.B.; Sethuraman, S.; Krishnan, U.M.; Rayappan, J.B.B. A review on detection of heavy metal ions in water–An electrochemical approach. Sens. Actuators 2015, B 213, 515–533. [Google Scholar] [CrossRef]
- Eisler, R. Nickel Hazards to Fish, Wildlife, and Invertebrates: A Synoptic Review; US Department of the Interior, US Geological Survey, Patuxent Wildlife Research Center: Prince George’s County, MD, USA, 1998; pp. 1–95. [Google Scholar]
- WHO. Guidelines for Drinking-Water Quality, 4th ed.; World Health Organization: Geneva, Switzerland, 2011. [Google Scholar]
- Barringer, J.L.; Szabo, Z.; Reilly, P.A. Occurrence and mobility of mercury in groundwater. In Current Perspectives in Contaminant Hydrology and Water Resources Sustainability; Intech Publishing: Rijeka, Croatia, 2012; pp. 117–147. [Google Scholar]
- Atique Ullah, A.K.M.; Maksud, M.A.; Khan, S.R.; Lutfa, L.N.; Quraishi, S.B. Dietary intake of heavy metals from eight highly consumed species of cultured fish and possible human health risk implications in Bangladesh. Toxicol. Rep. 2017, 4, 574–579. [Google Scholar] [CrossRef] [PubMed]
- European Commission. Regulation (EC) No 1881/2006 of 19 December 2006. Setting Maximum Levels for Certain Contaminants in Foodstuffs; European Commission: Brussels, Belgium, 2006. [Google Scholar]
- Velusamy, A.; Satheeshkumar, P.; Anirudh, R.; Chinnadurai, S. Bioaccumulation of heavy metals in commercially important marine fishes from Mumbai harbour, India. Mar. Pollut. Bull. 2014, 81, 218–224. [Google Scholar] [CrossRef] [PubMed]
- Garcia-Leston, J.; Mendez, J.; Pasaro, E.; Laffon, B. Genotoxic effects of lead: An updated review. Environ. Int. 2010, 36, 623–636. [Google Scholar] [CrossRef] [PubMed]
- Azizullah, A.; Khattak, M.N.K.; Richter, P.; Hader, D.P. Water pollution in Pakistan and its impact on public health—A review. Environ. Int. 2011, 37, 479–497. [Google Scholar] [CrossRef]
- Rahman, M.S.; Molla, A.H.; Saha, N.; Rahman, A. Study on heavy metals levels and its risk assessment in some edible fishes from Bangshi River, Savar, Dhaka, Bangladesh. Food Chem. 2012, 134, 1847–1854. [Google Scholar] [CrossRef]
- Jamil, T.; Lias, K.; Norsila, D.; Syafinaz, N.S. Assessment of heavy metal contamination in squid (Loligo spp.) tissues of Kedah-Perlis waters, Malaysia. Malays. J. Anal. Sci. 2014, 18, 195–203. [Google Scholar]
- Dikanovic, V.; Skoric, S.; Gacic, Z. Concentrations of metals and trace elements in different tissues of nine fish species from the Meduvrsje Reservoir (West Morava River Basin, Serbia). Arch. Biol. Sci. 2016, 68, 811–819. [Google Scholar] [CrossRef]
- Ranjbar, G.H.A.; Sotoudehnia, F. Heavy Metals in Muscle of Mugli auratus from Caspian Sea in Relation to Length, Age and Sex. Iran. J. Fish. Sci. 2005, 14, 1–17. [Google Scholar]
- Salamat, N.; Khalifi, K.; Movahedinia, A. Health Concerns Related to Consumption of Fish from Anzali Wetland. Clean Soil Air Water 2016, 44, 115–123. [Google Scholar] [CrossRef]
- Kucuksezgin, F.; Gonul, L.T.; Tasel, D. Total and inorganic arsenic levels in some marine organisms from Izmir Bay (Eastern Aegean Sea): A risk assessment. Chemosphere 2014, 112, 311–316. [Google Scholar] [CrossRef]
- Demirak, A.; Yilma, F.; Tuna, A.L.; Ozdemir, N. Heavy metals in water, sediment and tissues of Leuciscus cephalus from a stream in southwestern Turkey. Chemosphere 2006, 63, 1451–1458. [Google Scholar] [CrossRef]
- Qadir, A.; Malik, R.N. Heavy metals in eight edible fish species from two polluted tributaries (Aik and Palkhu) of the River Chenab, Pakistan. Biol. Trace Elem. Res. 2011, 143, 1524–1540. [Google Scholar] [CrossRef]
- Gorur, F.K.; Keser, R.; Akcay, N.; Dizman, S. Radioactivity and heavy metal concentrations of some commercial fish species consumed in the Black Sea Region of Turkey. Chemosphere 2012, 87, 356–361. [Google Scholar] [CrossRef]
- Wang, L.F.; Yang, L.Y.; Kong, L.H.; Li, S.; Zhu, J.R.; Wang, Y.Q. Spatial distribution, source identification and pollution assessment of metal content in the surface sediments of Nansi Lake, China. J. Geochem. Explor. 2014, 140, 87–95. [Google Scholar] [CrossRef]
- Dong, R.; Jia, Z.; Li, S. Risk assessment and sources identification of soil heavy metals in a typical county of Chongqing Municipality, Southwest China. Process Saf. Environ. Prot. 2018, 113, 275–281. [Google Scholar] [CrossRef]
- Wang, X.; Zhang, L.; Zhao, Z.; Cai, Y. Heavy metal pollution in reservoirs in the hilly area of southern China: Distribution, source apportionment and health risk assessment. Sci. Total Environ. 2018, 634, 158–169. [Google Scholar] [CrossRef] [PubMed]
- Varol, M. Dissolved heavy metal concentrations of the Kralkızı, Dicle and Batman dam reservoirs in the Tigris River basin, Turkey. Chemosphere 2013, 93, 954–962. [Google Scholar] [CrossRef] [PubMed]
- Zhao, L.; Xu, Y.; Hou, H.; Shangguan, Y.; Li, F. Source identification and health risk assessment of metals in urban soils around the Tanggu chemical industrial district, Tianjin, China. Sci. Total Environ. 2014, 468–469, 654–662. [Google Scholar] [CrossRef] [PubMed]
- Li, S.; Zhang, Q. Risk assessment and seasonal variations of dissolved trace elements and heavy metals in the Upper Han River, China. J. Hazard Mater. 2010, 181, 1051–1058. [Google Scholar] [CrossRef]
- Cai, L.; Xu, Z.; Bao, P.; He, M.; Dou, L.; Chen, L.; Zhou, Y.; Zhu, Y. Multivariate and geostatistical analyses of the spatial distribution and source of arsenic and heavy metals in the agricultural soils in Shunde, Southeast China. J. Geochem. Explor. 2015, 148, 189–195. [Google Scholar] [CrossRef]
- Javed, M.; Usmani, N. Accumulation of heavy metals and human health risk assessment via the consumption of freshwater fish Mastacembelus armatus inhabiting, thermal power plant effluent loaded canal. SpringerPlus 2016, 5, 776. [Google Scholar] [CrossRef]
- Li, J.; Huang, Z.Y.; Hu, Y.; Yang, H. Potential risk assessment of trace metals by consuming shellfish collected from Xiamen, China. Environ. Sci. Pollut. Res. 2013, 20, 2937–2947. [Google Scholar] [CrossRef]


| Weight (g) (W) | Length (cm) (L) | Coefficient of Condition (g/cm3) (K) | |
|---|---|---|---|
| Min | 473 | 29.7 | 1.00 |
| Max | 988 | 46.0 | 1.80 |
| Mean | 629 | 36.3 | 1.33 |
| Median | 588 | 35.5 | 1.30 |
| SD | 143 | 4.20 | 0.26 |
| As | Ca | Cd | Co | Cr | Cu | Fe | Hg | K | Li | Mg | Mn | Na | Ni | Pb | Se | Sr | Zn | MPI | ||
|---|---|---|---|---|---|---|---|---|---|---|---|---|---|---|---|---|---|---|---|---|
| Muscles | Min | 0.67 | 550 | 0.28 | 0.12 | 0.45 | 0.88 | 11.6 | 0.17 | 955 | 0.12 | 129 | 1.04 | 449 | 0.69 | 1.72 | 1.55 | 2.60 | 61.2 | 3.73 |
| Max | 1.58 | 2081 | 0.56 | 4.08 | 1.88 | 2.78 | 26.8 | 0.57 | 1632 | 0.38 | 312 | 4.33 | 896 | 3.06 | 7.81 | 3.55 | 9.27 | 215 | 12.7 | |
| Mean | 1.04 | 944 | 0.40 | 2.08 | 1.05 | 1.57 | 18.1 | 0.33 | 1254 | 0.24 | 187 | 2.07 | 639 | 1.86 | 4.09 | 2.59 | 5.10 | 110 | 7.57 | |
| Median | 1.01 | 769 | 0.40 | 2.15 | 1.06 | 1.41 | 17.5 | 0.30 | 1249 | 0.25 | 171 | 1.63 | 619 | 1.93 | 3.72 | 2.71 | 4.78 | 101 | 7.20 | |
| SD | 0.24 | 458 | 0.07 | 1.18 | 0.44 | 0.52 | 4.06 | 0.11 | 162 | 0.08 | 48.8 | 0.96 | 110 | 0.67 | 1.74 | 0.54 | 1.76 | 43.8 | ||
| Gills | Min | 0.71 | 4817 | 0.36 | 3.08 | 2.34 | 2.47 | 58.3 | 0.21 | 711 | 0.76 | 716 | 17.7 | 1306 | 1.33 | 5.93 | 2.77 | 30.4 | 1463 | 15.4 |
| Max | 1.17 | 8288 | 1.39 | 14.0 | 10.1 | 5.26 | 132 | 1.59 | 1119 | 2.43 | 1383 | 31.7 | 2110 | 12.8 | 24.8 | 4.41 | 59.4 | 2180 | 40.7 | |
| Mean | 0.93 | 6520 | 0.83 | 7.89 | 5.84 | 4.03 | 94.3 | 0.81 | 896 | 1.62 | 976 | 25.3 | 1698 | 6.55 | 13.1 | 3.64 | 44.1 | 1785 | 27.9 | |
| Median | 0.92 | 6409 | 0.84 | 8.24 | 5.88 | 4.02 | 98.4 | 0.82 | 898 | 1.73 | 936 | 25.9 | 1692 | 8.15 | 12.6 | 3.64 | 43.3 | 1788 | 28.4 | |
| SD | 0.11 | 890 | 0.30 | 3.29 | 2.10 | 0.82 | 23.7 | 0.43 | 106 | 0.51 | 176 | 3.63 | 197 | 4.23 | 5.42 | 0.42 | 7.73 | 189 | ||
| Scales | Min | 0.12 | 3867 | 0.54 | 1.82 | 0.87 | 1.89 | 20.7 | 0.05 | 126 | 0.71 | 364 | 8.68 | 485 | 0.39 | 3.56 | 1.51 | 19.5 | 209 | 6.78 |
| Max | 0.33 | 5632 | 1.21 | 8.50 | 6.76 | 3.56 | 44.8 | 0.23 | 488 | 1.68 | 571 | 17.0 | 980 | 5.06 | 10.9 | 2.92 | 38.6 | 561 | 19.2 | |
| Mean | 0.21 | 4781 | 0.82 | 4.94 | 3.17 | 2.57 | 31.5 | 0.12 | 281 | 1.01 | 463 | 12.8 | 719 | 2.60 | 6.74 | 2.23 | 29.0 | 355 | 12.5 | |
| Median | 0.19 | 4812 | 0.79 | 5.71 | 2.73 | 2.47 | 31.2 | 0.10 | 287 | 0.93 | 464 | 13.0 | 705 | 2.42 | 6.64 | 2.23 | 29.2 | 344 | 12.2 | |
| SD | 0.06 | 496 | 0.18 | 2.23 | 2.03 | 0.45 | 6.88 | 0.05 | 109 | 0.27 | 54.4 | 2.22 | 132 | 1.41 | 1.96 | 0.37 | 4.79 | 91.1 | ||
| Tolerable and permissible levels of selected metals in the muscles of fish | ||||||||||||||||||||
| USEPA (1983) | - | - | - | - | 8 | 120 | - | - | - | - | - | - | - | - | 4 | - | - | 480 | - | |
| MAFF (2000) | - | - | 0.2 | - | - | 20 | - | - | - | - | - | - | - | - | 2 | - | - | 50 | - | |
| WHO (2000) | 1 | - | 0.5 | 0.5 | 0.15 | 30 | 109 | 0.5 | - | - | - | 1 | - | 30 | 0.5 | - | - | - | - | |
| FAO (2000) | 1 | - | 0.5 | 0.5 | - | 30 | 180 | 0.5 | - | - | - | 0.5 | - | 55 | 2 | - | - | 30 | - | |
| EC Regulation (2006) | - | - | 0.1 | - | - | - | - | 0.5 | - | - | - | - | - | - | 0.3 | - | - | - | - | |
| As | Ca | Cd | Co | Cr | Cu | Fe | Hg | K | Li | Mg | Mn | Na | Ni | Pb | Se | Sr | Zn | References |
|---|---|---|---|---|---|---|---|---|---|---|---|---|---|---|---|---|---|---|
| 1.04 | 944 | 0.40 | 2.08 | 1.05 | 1.57 | 18.1 | 0.33 | 1254 | 0.24 | 187 | 2.07 | 639 | 1.86 | 4.09 | 2.59 | 5.10 | 110 | Present Study |
| - | 132.4 | 2.27 | 2.8 | 13.48 | 1.6 | 12.33 | - | 295 | 23.19 | 202.2 | 9.94 | 467 | 1.57 | 2.41 | - | 10.77 | 24.27 | [99] |
| - | - | 0.745 | 4.917 | 2.389 | 1.293 | 9.835 | - | - | - | - | 0.487 | - | - | 8.796 | - | - | 24.23 | [87] |
| 0.27 | - | <0.01 | 0.058 | 2.23 | 1.35 | 52.1 | - | - | 0.046 | - | 1.58 | - | 1.04 | 1.3 | 2.28 | 22.9 | 20.8 | [105] |
| 0.090 | - | 0.014 | BDL | 0.173 | 0.241 | 7.12 | 0.010 | - | 0.013 | - | 0.1 | - | 0.165 | 0.181 | 0.23 | 1.15 | 6.62 | [76] |
| - | - | 0.006 | 0.01 | 1.26 | 12.31 | 0.76 | - | - | - | - | - | - | 0.02 | - | - | 30.6 | [29] | |
| 0.166 | - | 0.011 | - | 0.4 | - | 15.9 | 0.073 | - | - | - | 1.95 | - | - | 0.047 | - | - | 24.4 | [112] |
| 0.095 | - | 0.009 | 0.005 | 0.067 | 0.249 | 2.729 | - | - | - | - | 0.307 | - | 0.041 | 0.031 | 0.3 | - | 5.433 | [104] |
| - | - | 0.84 | 0.23 | 0.365 | 0.52 | 0.85 | - | - | - | - | - | - | 0.08 | 0.22 | - | - | 0.92 | [113] |
| - | 4130 | - | - | - | 0.2 | 41.5 | - | 2490 | - | 350 | 0.6 | 860 | - | - | - | - | 16.3 | [98] |
| - | - | 0.02 | 0.1 | 0.05 | 0.66 | - | 0.04 | - | - | - | - | - | 0.16 | 0.06 | - | - | 3.42 | [126] |
| PC 1 | PC 2 | PC 3 | PC 4 | PC 5 | |
|---|---|---|---|---|---|
| Eigenvalue | 5.714 | 4.337 | 1.776 | 1.584 | 1.323 |
| Total Variance (%) | 31.74 | 24.10 | 9.869 | 8.799 | 7.347 |
| Cumulative Eigenvalue (%) | 5.714 | 10.05 | 11.83 | 13.41 | 14.73 |
| Cumulative Variance (%) | 31.74 | 55.84 | 65.71 | 74.51 | 81.86 |
| As | - | - | - | - | 0.689 |
| Ca | - | 0.843 | - | - | - |
| Cd | - | - | - | 0.806 | - |
| Co | - | - | 0.736 | - | - |
| Cr | - | - | 0.792 | - | - |
| Cu | 0.836 | - | - | - | - |
| Fe | 0.877 | - | - | - | - |
| Hg | - | - | - | - | 0.872 |
| K | 0.825 | - | - | - | - |
| Li | - | - | - | 0.898 | - |
| Mg | 0.769 | - | - | - | - |
| Mn | - | 0.805 | - | - | - |
| Na | 0.866 | - | - | - | - |
| Ni | - | - | - | 0.769 | - |
| Pb | - | - | - | - | 0.630 |
| Se | - | - | 0.837 | - | - |
| Sr | - | 0.893 | - | - | - |
| Zn | 0.871 | - | - | - | - |
| RfD/RDA (mg/kg/day, Wet Weight) | PTWI * | PTDI * | EWI | EDI | THQ | TCR | |
|---|---|---|---|---|---|---|---|
| As | 0.0003 | 0.015 | 0.002 | 0.026 | 0.004 | 12.36 | 5.56E-03 |
| Ca | 13.33 | 99.33 | 14.19 | 23.59 | 3.370 | 0.253 | |
| Cd | 0.001 | 0.007 | 0.001 | 0.010 | 0.0014 | 1.438 | 8.63E-04 |
| Co | 0.06 | 0.42 | 0.06 | 0.052 | 0.007 | 0.124 | |
| Cr | 0.003 | 0.021 | 0.003 | 0.026 | 0.004 | 1.242 | 1.86E-03 |
| Cu | 0.04 | 3.5 | 0.5 | 0.039 | 0.006 | 0.140 | |
| Fe | 0.7 | 5.6 | 0.8 | 0.453 | 0.065 | 0.093 | |
| Hg | 0.0003 | 0.005 | 0.0007 | 0.008 | 0.001 | 3.900 | |
| K | 78.0 | 548.3 | 78.33 | 31.35 | 4.478 | 0.057 | |
| Li | 0.002 | 0.14 | 0.02 | 0.006 | 0.001 | 0.436 | |
| Mg | 5.83 | 40.83 | 5.833 | 4.675 | 0.668 | 0.115 | |
| Mn | 0.14 | 0.98 | 0.14 | 0.052 | 0.007 | 0.053 | |
| Na | 55 | 385 | 55 | 15.97 | 2.282 | 0.041 | |
| Ni | 0.020 | 0.035 | 0.005 | 0.046 | 0.007 | 0.331 | 1.13E-02 |
| Pb | 0.004 | 0.025 | 0.004 | 0.102 | 0.015 | 7.297 | 1.24E-04 |
| Se | 0.005 | 2.8 | 0.4 | 0.065 | 0.009 | 1.851 | |
| Sr | 0.6 | 4.2 | 0.6 | 0.127 | 0.018 | 0.030 | |
| Zn | 0.3 | 7 | 1 | 2.751 | 0.393 | 1.310 | |
| HI | 31.07 |
Publisher’s Note: MDPI stays neutral with regard to jurisdictional claims in published maps and institutional affiliations. |
© 2022 by the authors. Licensee MDPI, Basel, Switzerland. This article is an open access article distributed under the terms and conditions of the Creative Commons Attribution (CC BY) license (https://creativecommons.org/licenses/by/4.0/).
Share and Cite
Saleem, M.; Iqbal, J.; Shi, Z.; Garrett, S.H.; Shah, M.H. Distribution and Bioaccumulation of Essential and Toxic Metals in Tissues of Thaila (Catla catla) from a Natural Lake, Pakistan and Its Possible Health Impact on Consumers. J. Mar. Sci. Eng. 2022, 10, 933. https://doi.org/10.3390/jmse10070933
Saleem M, Iqbal J, Shi Z, Garrett SH, Shah MH. Distribution and Bioaccumulation of Essential and Toxic Metals in Tissues of Thaila (Catla catla) from a Natural Lake, Pakistan and Its Possible Health Impact on Consumers. Journal of Marine Science and Engineering. 2022; 10(7):933. https://doi.org/10.3390/jmse10070933
Chicago/Turabian StyleSaleem, Muhammad, Javed Iqbal, Zongbo Shi, Scott H. Garrett, and Munir H. Shah. 2022. "Distribution and Bioaccumulation of Essential and Toxic Metals in Tissues of Thaila (Catla catla) from a Natural Lake, Pakistan and Its Possible Health Impact on Consumers" Journal of Marine Science and Engineering 10, no. 7: 933. https://doi.org/10.3390/jmse10070933
APA StyleSaleem, M., Iqbal, J., Shi, Z., Garrett, S. H., & Shah, M. H. (2022). Distribution and Bioaccumulation of Essential and Toxic Metals in Tissues of Thaila (Catla catla) from a Natural Lake, Pakistan and Its Possible Health Impact on Consumers. Journal of Marine Science and Engineering, 10(7), 933. https://doi.org/10.3390/jmse10070933