
Assessment of the Vulnerability of the Lucana Coastal Zones (South Italy) to Natural Hazards

 ,
,  ,
, 
Abstract
:1. Introduction
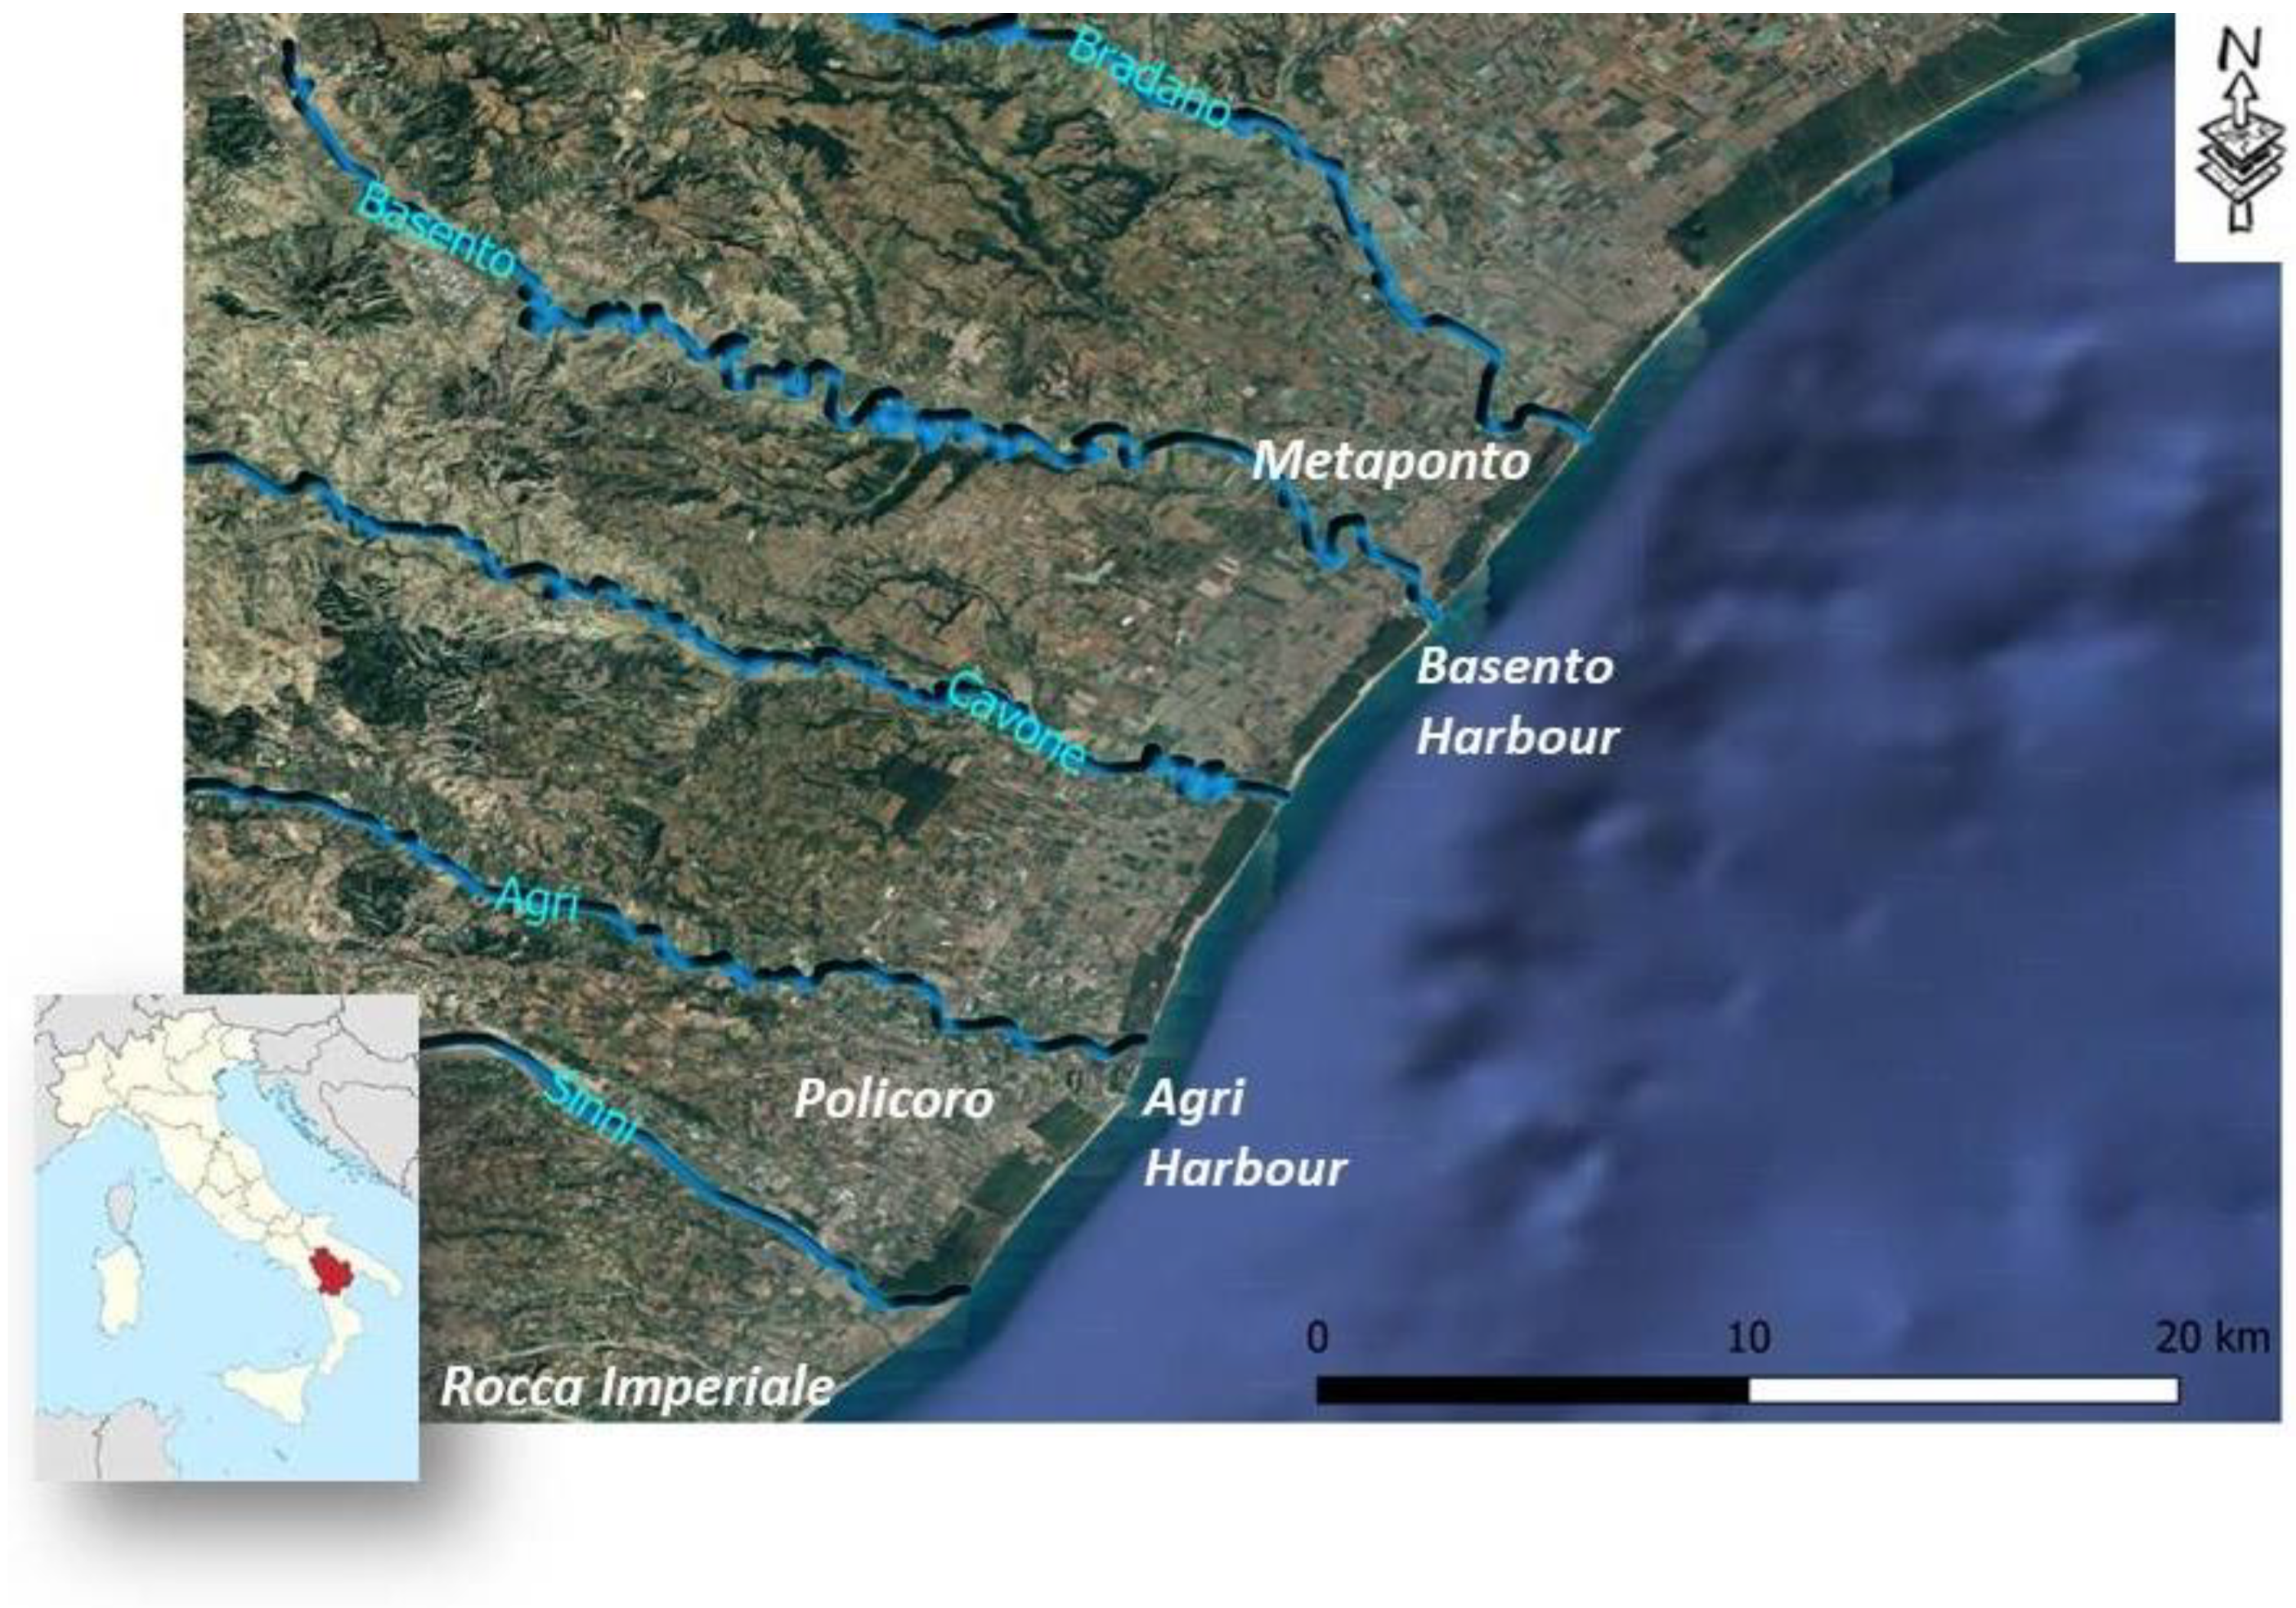
2. Study Area
- -
- From 1873 to 1949/1954: Coastal accretion with a value ranging from +0.7 to +5.5 m/yr, with the highest values being observed at the river mouths.
- -
- After 1955: Coastal erosion, especially between the Bradano and Basento rivers, related to the reduction of the fluvial sediment supply from river catchments due to human activities, land use changes and coastal protections. Coastal accretion still persists between Capo Spulico and Rocca Imperiale due to the presence of different torrential rivers.
3. Methods
- -
- Tr = 1 corresponding to a very high probability
- -
- Tr = 10, high probability
- -
- Tr = 25, medium probability
- -
- Tr = 100, low probability.
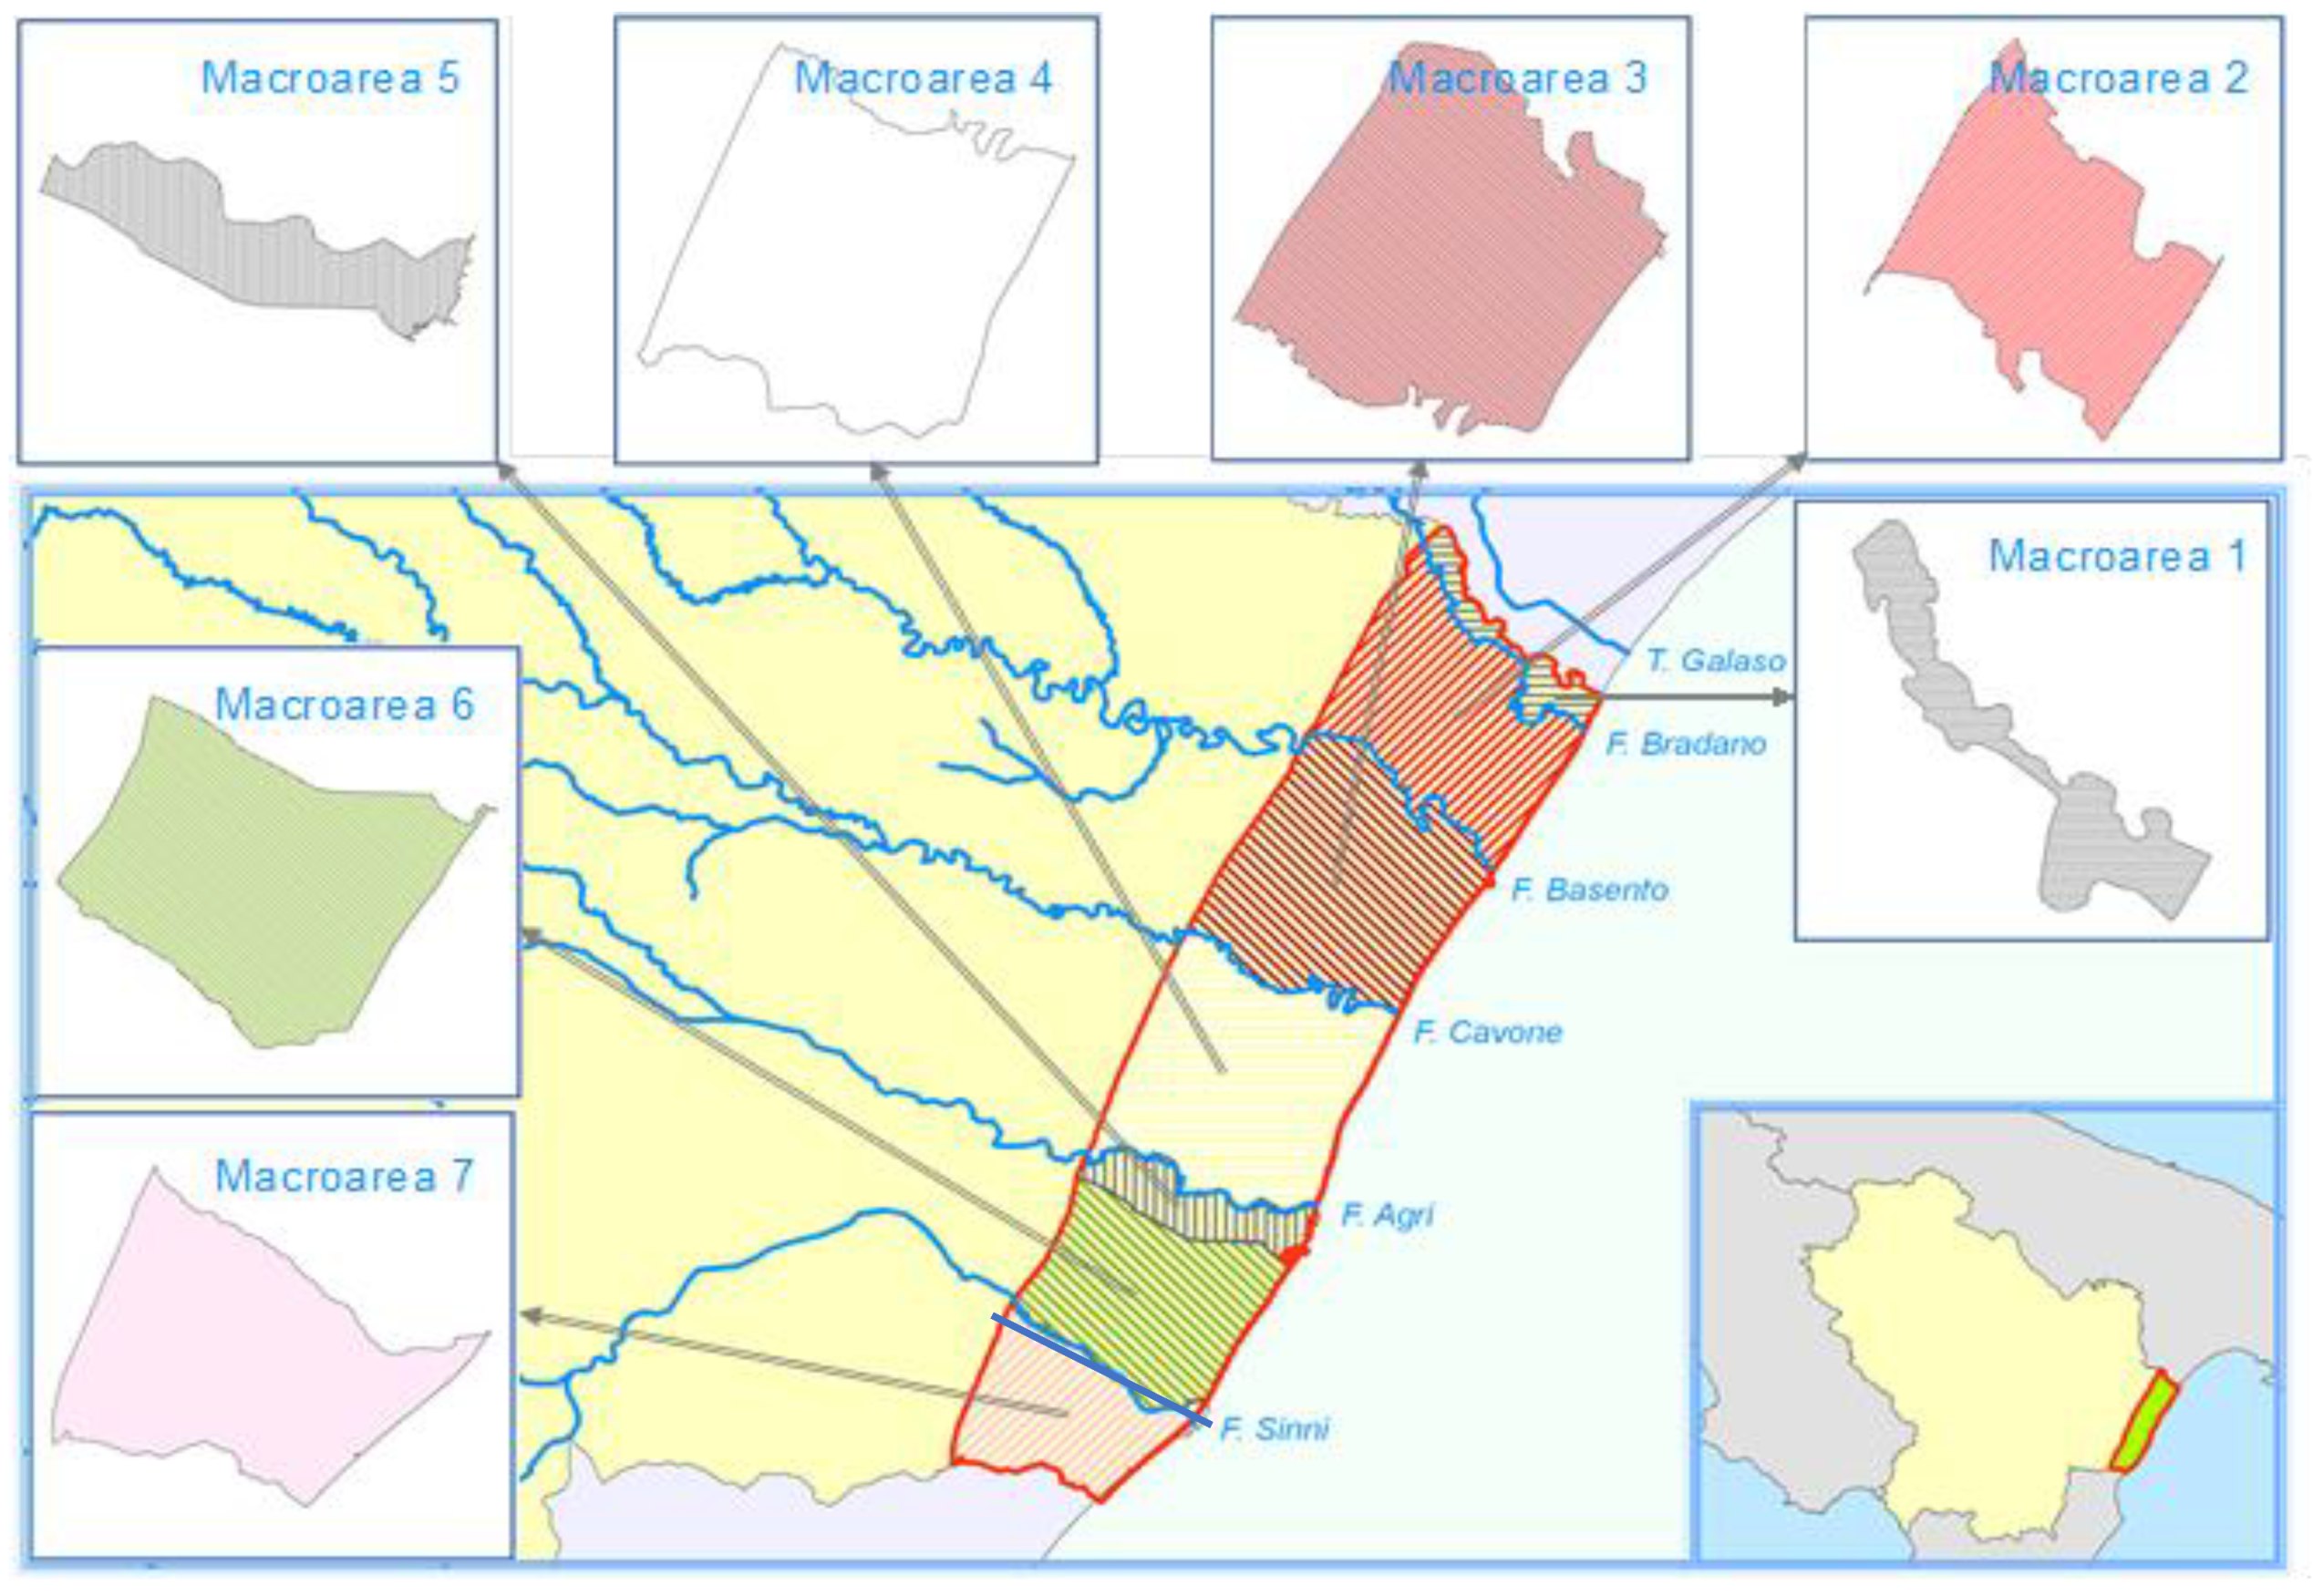
3.1. Division of the Littoral in Homogeneous Stretch and Recent Evolution
3.2. ICC: Multi Hazard Risk Assessment—Flooding and Erosion
3.2.1. Coastal Flooding Index
- ZPI 1: Very high flooding risk;
- ZPI 2: High flooding risk;
- ZPI 3: Medium flooding risk;
- ZPI 4: Low flooding risk.
3.2.2. Coastal Erosion Index
- -
- H: erosion rate, shoreline evolution, exposition and intensity of the sea storms;
- -
- V: presence of coastal dunes, defense structures, variation of the coastal dune length, submerged slope, protected areas, lithological characteristics and harbor structures, coastal waterproof level and distance from the shoreline to the active zone;
- -
- E: loss of the soil value, touristic and productive activities and population.
- -
- RA: representation of the environmental state (Incidence 5);
- -
- FP: facility of population (Incidence 1);
- -
- SI: easiness of interpretation (Incidence 2);
- -
- SC: sensitivity to variation (Incidence 5);
- -
- DF: applicability at different scales (Incidence 1);
- -
- VS: comparability with the threshold value (Incidence 2).
- -
- High 4;
- -
- Moderate 3;
- -
- Good 2;
- -
- Low 1.
- -
- ZPE1 [0.75–1] VERY HIGH RISK;
- -
- ZPE2 [0.50–0.75] HIGH RISK;
- -
- ZPE3 [0.25–0.50] MEDIUM RISK;
- -
- ZPE4 [0–0.25] LOW RISK.
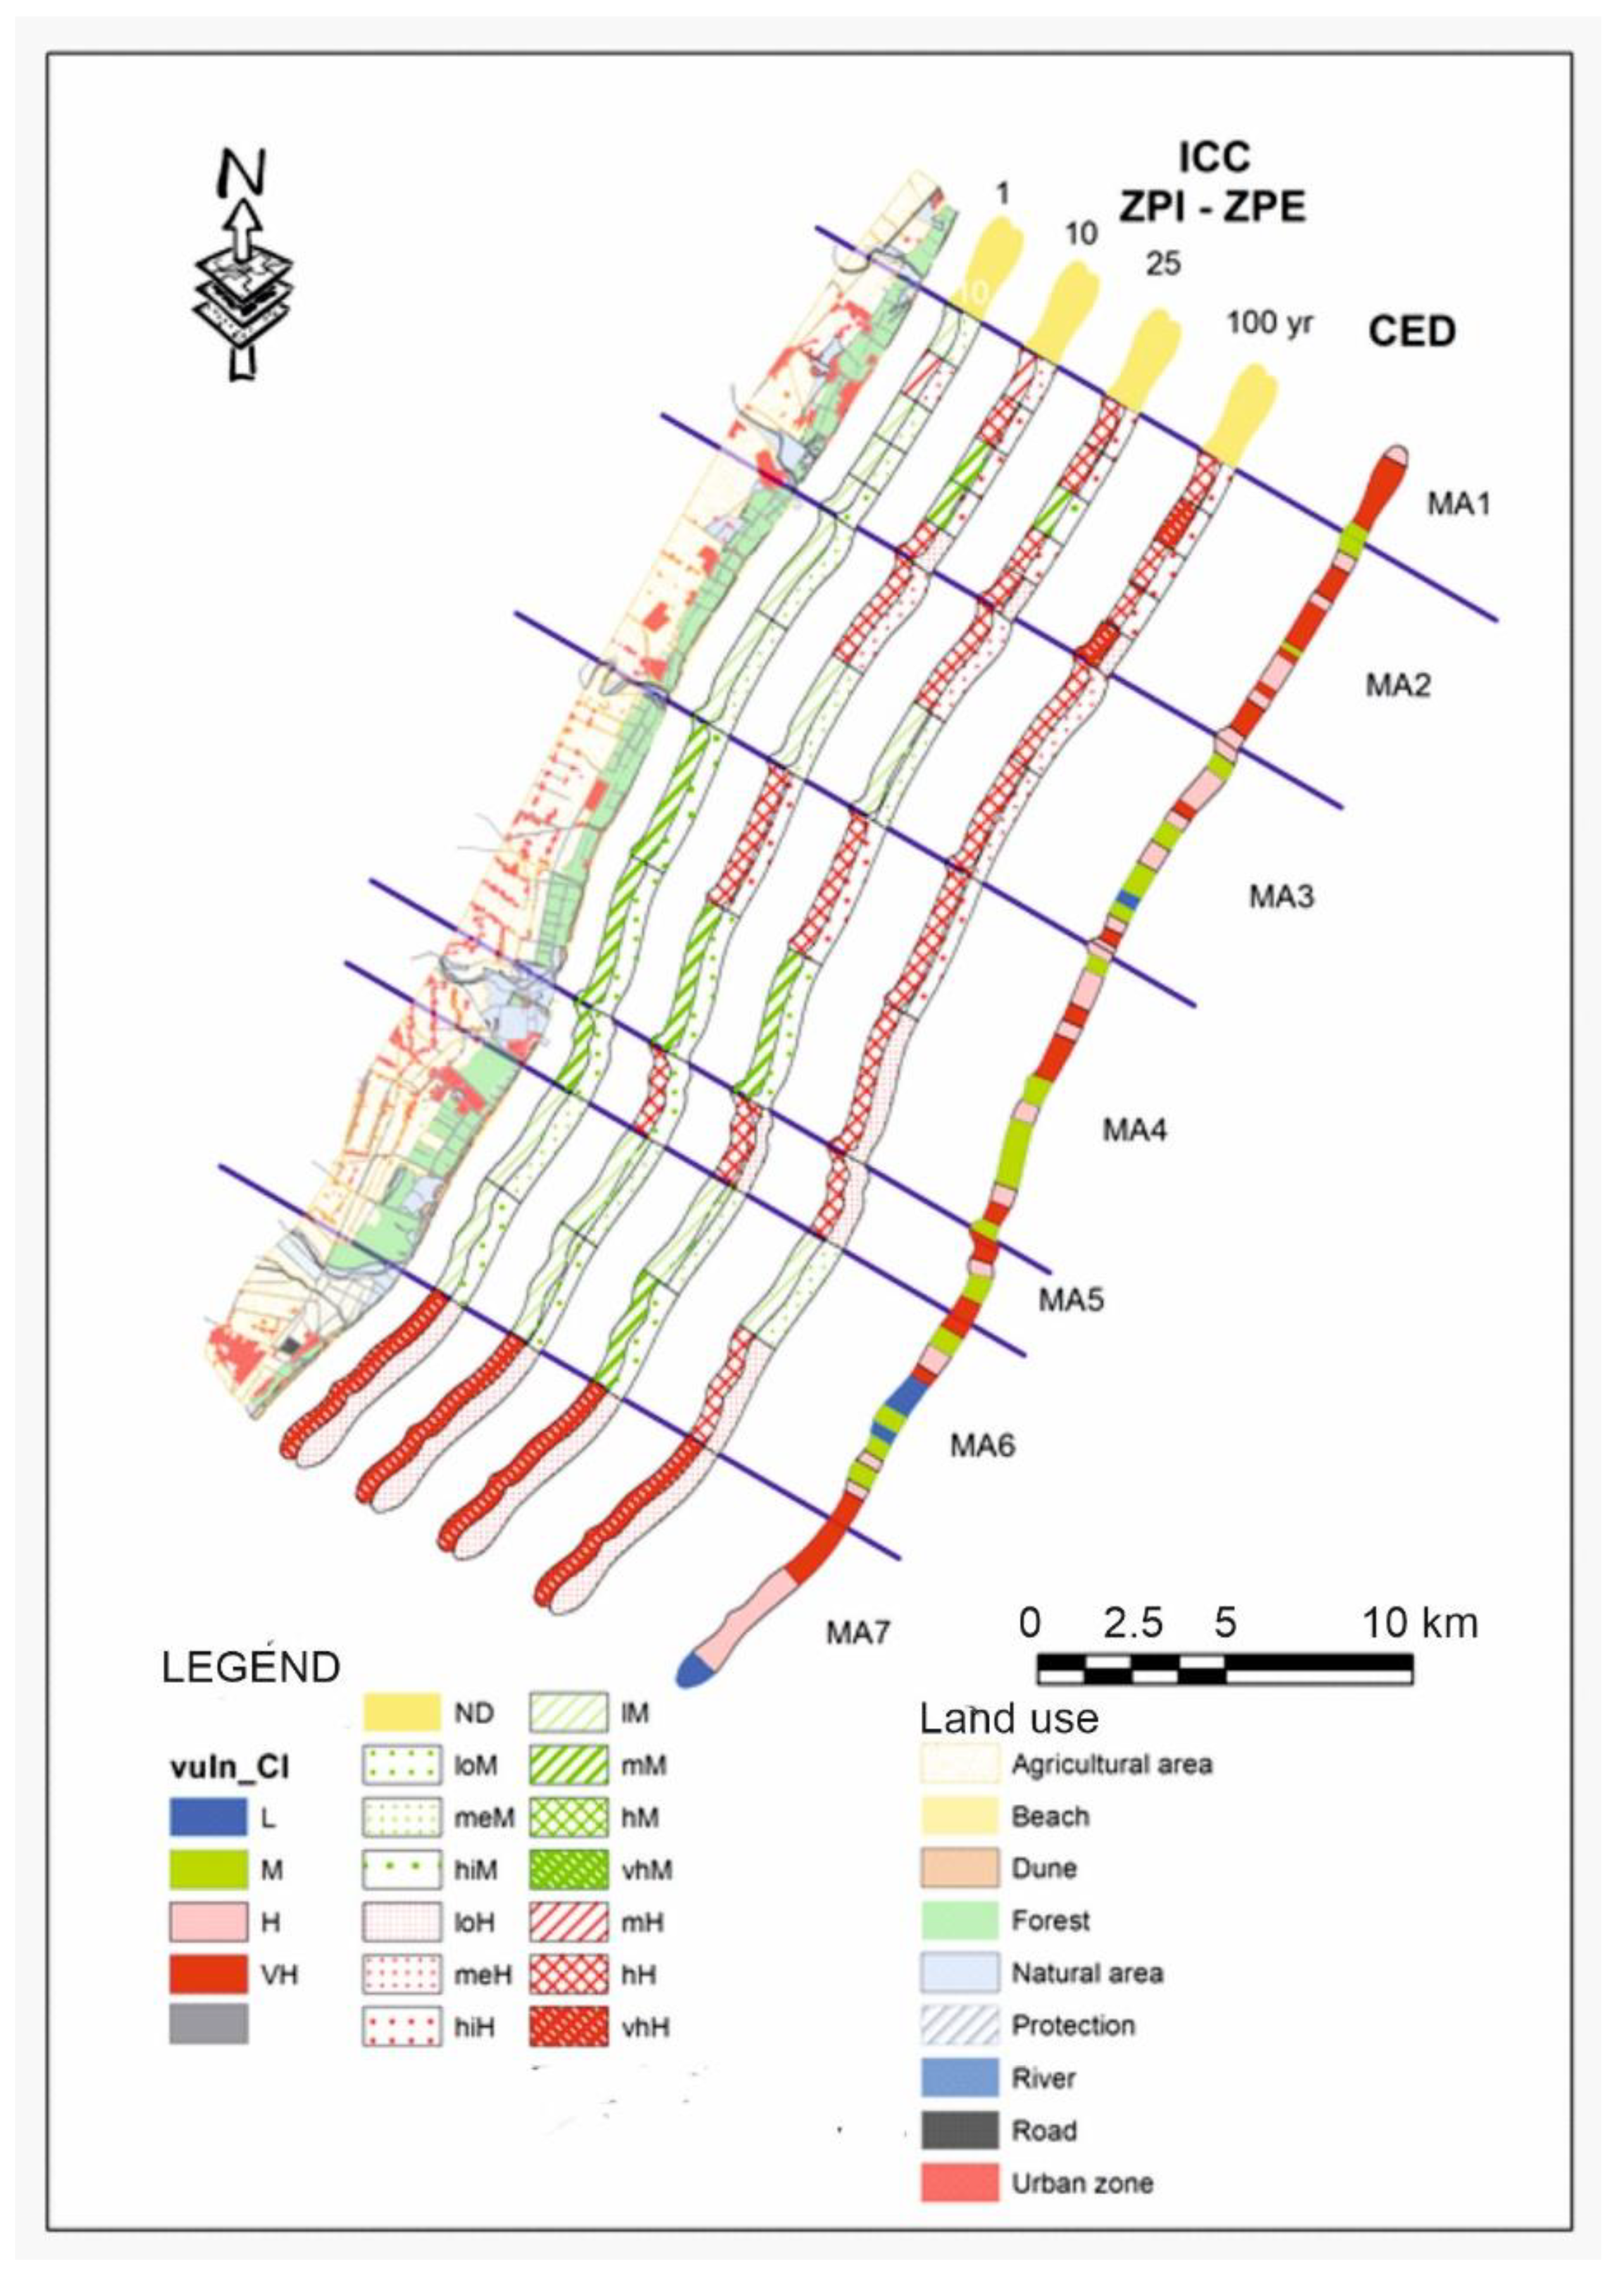
3.2.3. Integrated Coastal Risk Index
- -
- ICC1 [0.75–1]: very high coastal risk
- -
- ICC2 [0.50–0.75]: high coastal risk
- -
- ICC3 [0.25–0.50]: medium coastal risk
- -
- ICC4 [0–0.25]: low coastal risk
3.3. CeD—Multi-Risk Assessment (Physical Vulnerability Index)
- -
- the beach width (beach slope) that limits or prevents coastal marine flooding and
- -
- the medium and long-term shoreline evolution.
- -
- dramatic for a beach width less than 35 m;
- -
- adequate for a beach width ranging between 35 and 60 m;
- -
- excellent for a beach width greater than 60 m.
- -
- A: positive when the long and medium-term trends are positive
- -
- B: mainly positive when the long term is negative and the medium term is positive
- -
- C: mainly negative when the long term is positive and the medium term is negative
- -
- D: negative when the long- and medium-term trends are both in erosion.
4. Results
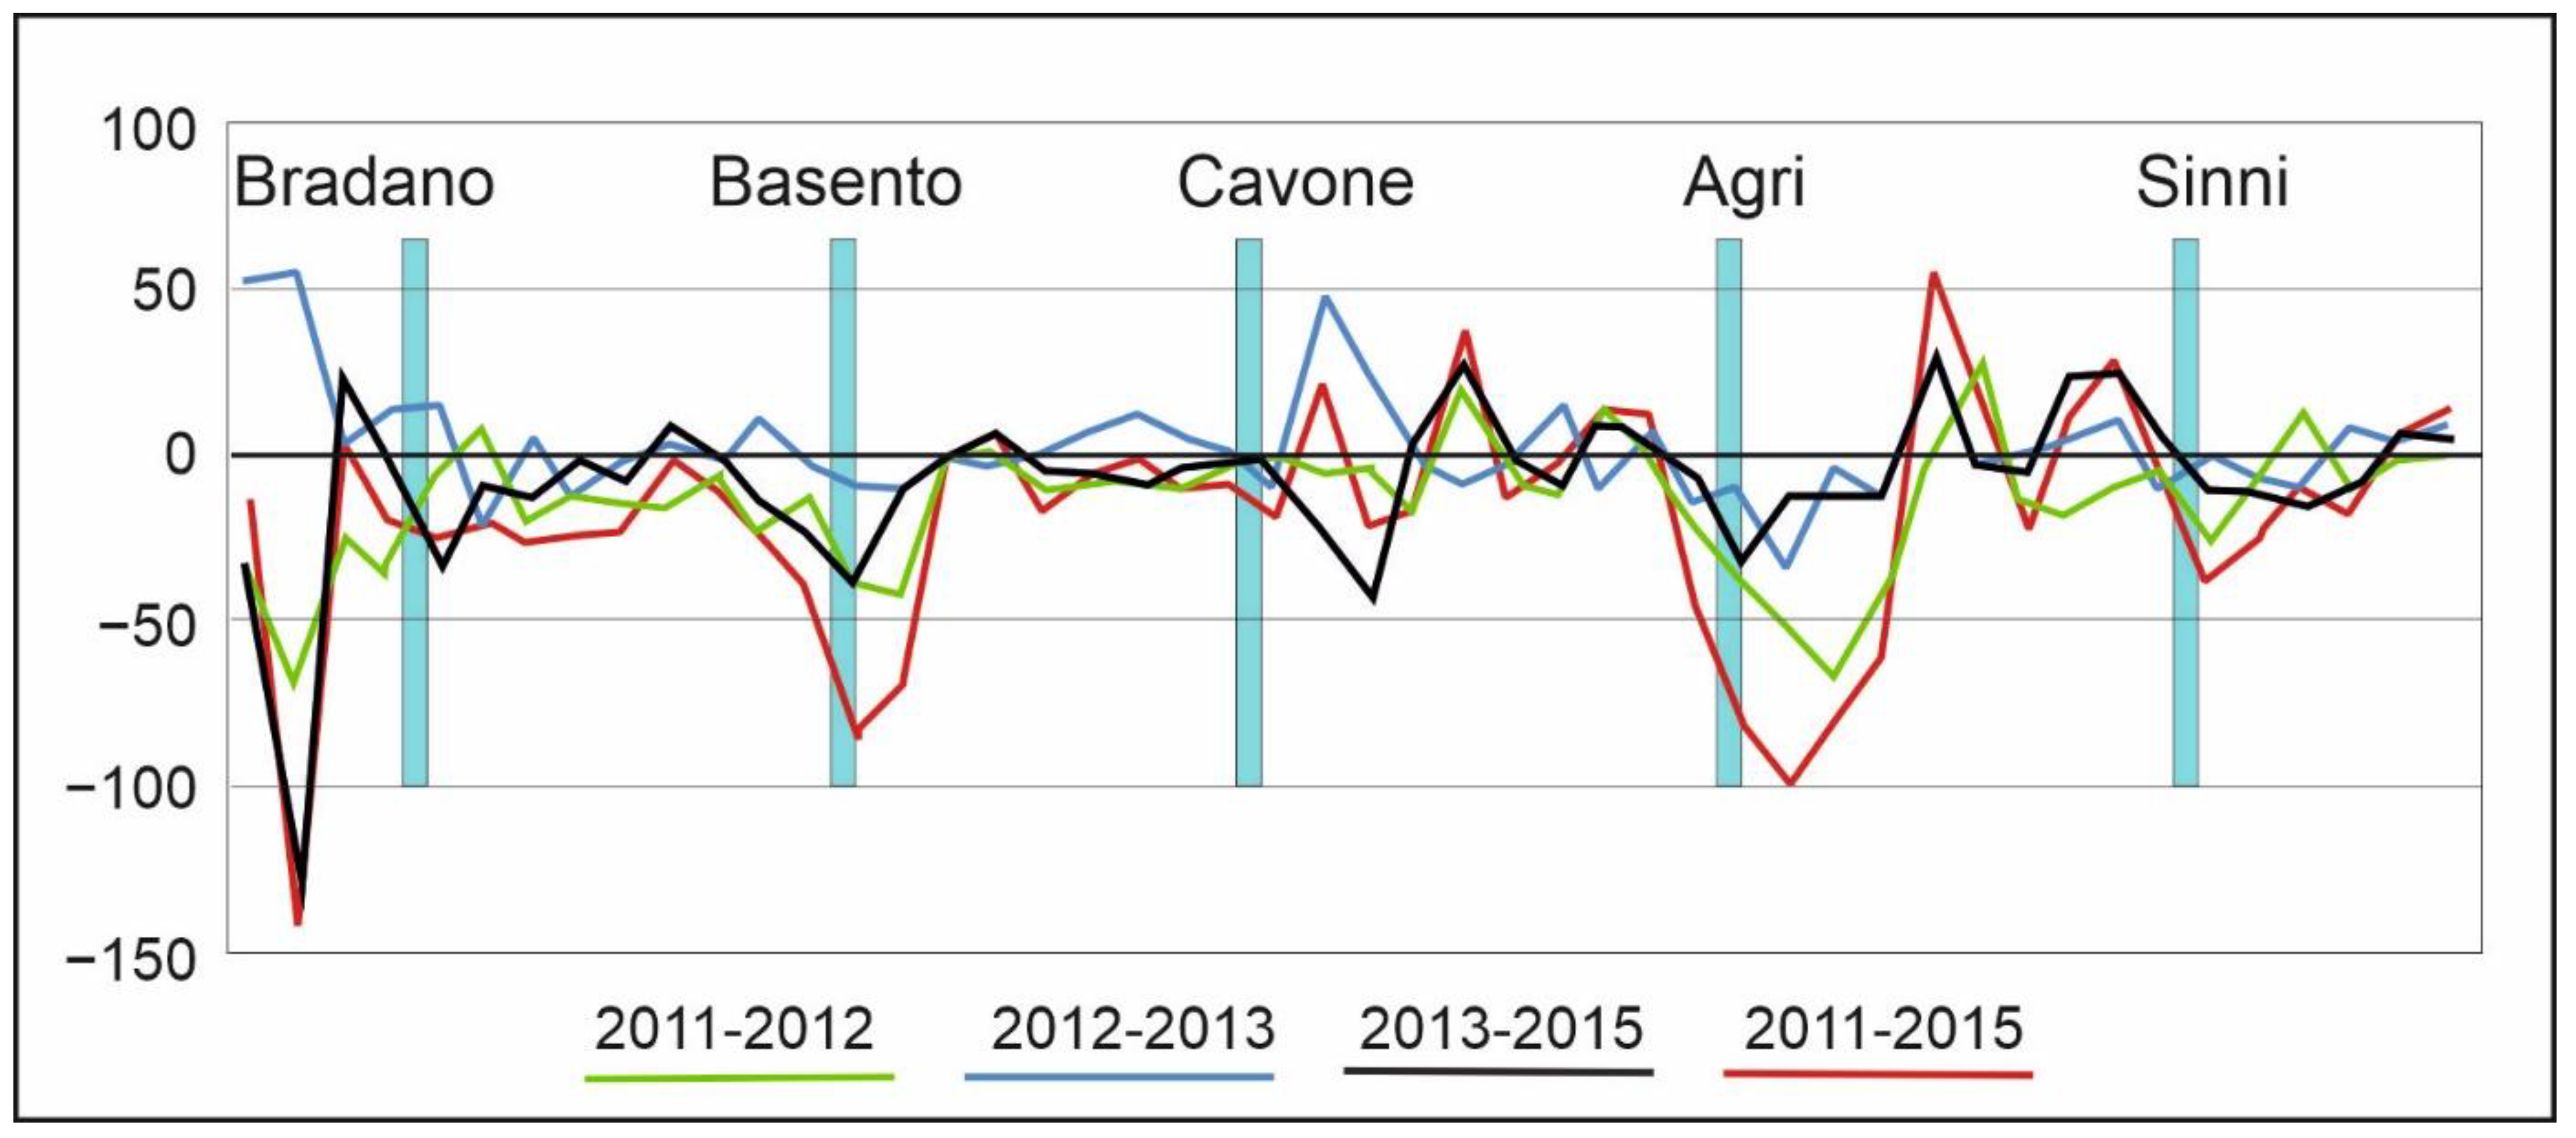
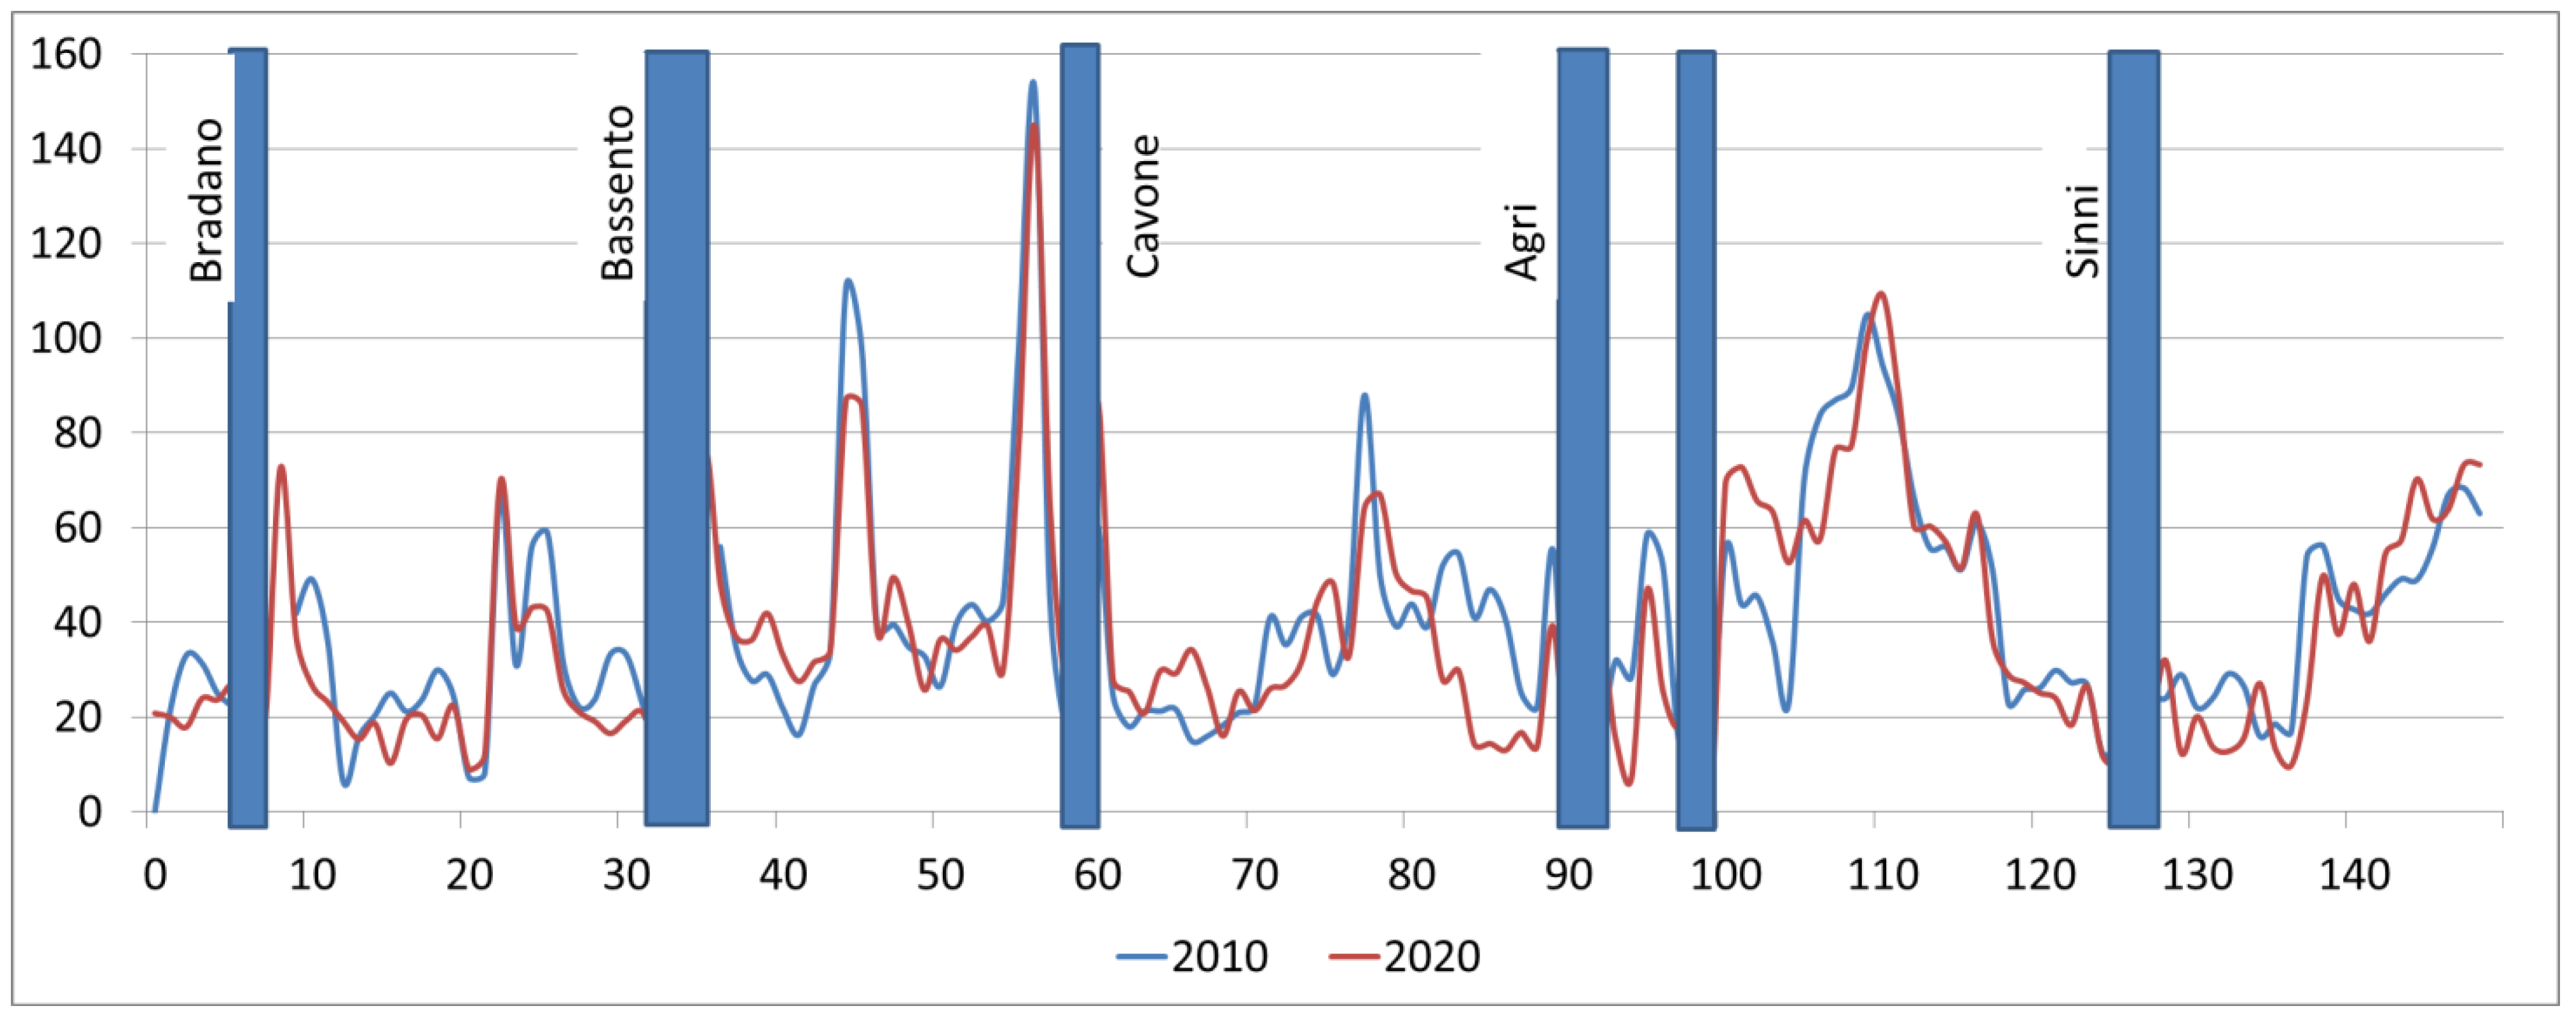
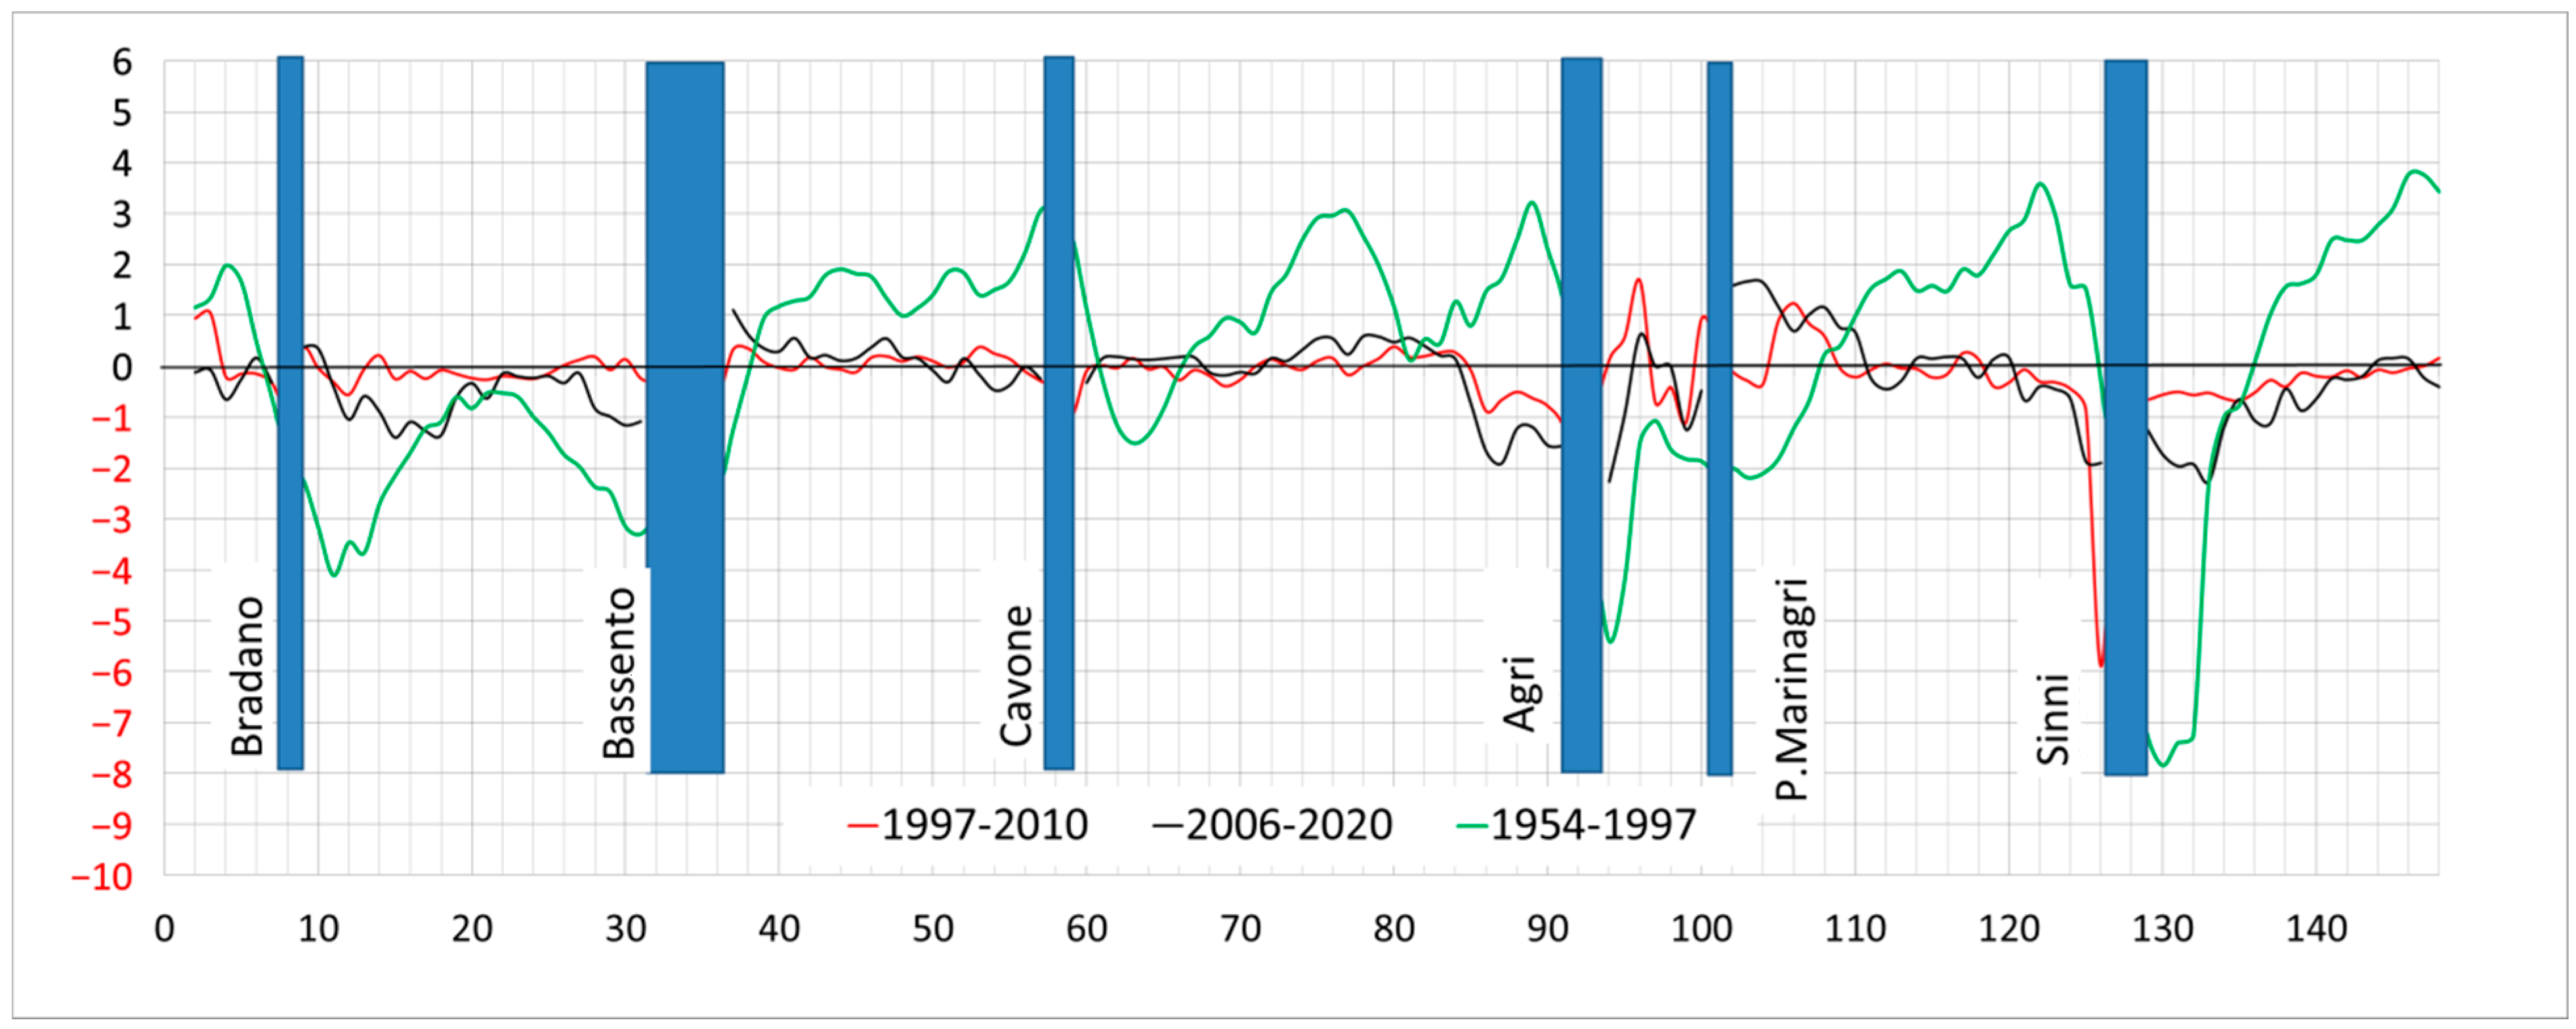
4.1. Macro-Areas and Recent Shoreline Evolution
- -
- A general shoreline retreat occurred almost along the entire coast between 2011 and 2012. Locally, shoreline advance may be observed in the macro-areas 2, 4, 6 and 7;
- -
- A general shoreline stability or advance is observed between 2012 and 2013, but locally, shoreline erosion occurred. In addition, shoreline advance is locally important; for instance, at the right side of the Bradano and Cavone, the shoreline advances more than 50 m;
- -
- From 2013 to 2015, shoreline retreat is generally observed in the macro-areas 2, 3, 5 and 7, especially near the river mouths. The macro-areas 4 and 6 are characterized by a shoreline advance, except at the river mouth area;
- -
- From 2011 to 2015, the macro-areas 2, 3, 5 and 7 are characterized by a shoreline retreat, especially in the river mouth areas (Bradano, Basento, Agri and Sinni). The macro-area 4 is characterized by an alternation of shoreline advance and erosion, while shoreline advance is observed in the macro-area 6.
4.2. Integrated Coastal Risk to Flooding and Erosion
- A low-medium coastal erosion vulnerability is excepted for a 1-year return period along the entirety of the Basilicata Ionian coast, except for profile 8 (right side of the Cavone), which presents a high vulnerability;
- Similar results are observed for the 10-year return period, indicating a general low-medium vulnerability, except for profiles 2, 3 and 4 at Metaponto and profile 8 at the right side of Cavone;
- The coastal erosion vulnerability associated with the 25- and 100-year return periods is generally low to medium along the Basilicata Ionian coast, except for profile 1 at the Bradano mouth, profiles 2, 3 and 4 at Metaponto and profile 8 at Cavone, which indicate a high vulnerability.
4.3. Physical Vulnerability Index (CeD)
5. Discussion
6. Conclusions
- as an example of where physical changes are most likely to occur in relation to erosion or marine flooding; and
- as a planning tool for the Ionian Basilicata region.
Supplementary Materials
Author Contributions
Funding
Institutional Review Board Statement
Data Availability Statement
Conflicts of Interest
References
- Nicholls, R.J.; Wong, P.P.; Burkett, V.R.; Codignotto, J.O.; Hay, J.E.; McLean, R.F.; Ragoonaden, S.; Woodroffe, C.D. Coastal Systems and Low-Lying Areas. Climate Change 2007: Impacts, Adaptation and Vulnerability. Contribution of Working Group II to the Fourth Assessment Report of the Intergovernmental Panel on Climate Change; Parry, M.L., Canziani, O.F., Palutikof, J.P., van der Linden, P.J., Hanson, C.E., Eds.; Cambridge University Press: Cambridge, UK, 2017; pp. 315–356. [Google Scholar]
- Greco, M.; Martino, G. Vulnerability assessment for preliminary flood risk mapping and management in coastal areas. Nat. Hazards 2016, 82, 7–26. [Google Scholar] [CrossRef]
- Anzidei, M.; Doumaz, F.; Vecchio, A.; Serpelloni, E.; Pizzimenti, L.; Civico, R.; Greco, M.; Martino, G.; Enei, F. Sea Level Rise Scenario for 2100 A.D. in the Heritage Site of Pyrgi (Santa Severa, Italy). J. Mar. Sci. Eng. 2020, 8, 64. [Google Scholar] [CrossRef] [Green Version]
- Anfuso, G.; Postacchini, M.; Di Luccio, D.; Benassai, G. Coastal Sensitivity/Vulnerability Characterization and Adaptation Strategies: A Review. J. Mar. Sci. Eng. 2021, 9, 72. [Google Scholar] [CrossRef]
- Douben, K.-J. Characteristics of river floods and flooding: A global overview, 1985–2003. Irrig. Drain. 2006, 55, S9–S21. [Google Scholar] [CrossRef]
- Batista, C.M. Coastal risk. In Encyclopedia of Coastal Science. Encyclopedia of Earth Sciences Series; Springer: Cham, Switzerland, 2018. [Google Scholar] [CrossRef]
- Nicholls, R.J.; Cazenave, A. Sea-Level Rise and Its Impact on Coastal Zones. Science 2010, 328, 1517–1520. [Google Scholar] [CrossRef]
- EEA. The changing faces of Europe’s coastal areas. In EEA Report No. 6/2006; European Environment Agency: Copenhagen, Denmark, 2006; p. 107. [Google Scholar]
- Klein, R.J.T.; Nicholls, R.; Thomalla, F.J. Resilience to natural hazards: How useful is this concept? Glob. Environ. Chang. B Environ. Hazards 2003, 5, 35–45. [Google Scholar] [CrossRef]
- de Schipper, M.A.; Ludka, B.C.; Raubenheimer, B.; Luijendijk, A.P.; Schlacher, T.A. Beach nourishment has complex implications for the future of sandy shores. Nat. Rev. Earth Environ. 2020, 2, 70–84. [Google Scholar] [CrossRef]
- Dilley, M.; Chen, R.S.; Deichmann, U.; Lerner-Lam, A.; Arnold, M.; Agwe, J.; Buys, P.; Kjekstad, O.; Lyon, B.; Yetman, G. Natural disaster hotspots: A global risk analysis. World Bank Disaster Risk Manag. Ser. 2005, 5, 1–132. [Google Scholar] [CrossRef]
- IPCC. Summary for Policymakers. In Climate Change 2021: The Physical Science Basis. Contribution of Working Group I to the Sixth Assessment Report of the Intergovernmental Panel on Climate Change; Masson-Delmotte, V.P., Zhai, A., Pirani, S.L., Connors, C., Péan, S., Berger, N., Caud, Y., Chen, L., Goldfarb, M.I., Gomis, M., et al., Eds.; Cambridge University Press: Cambridge, UK; New York, NY, USA, 2021; pp. 3–32. [Google Scholar] [CrossRef]
- Satta, A. An Index-based method to assess vulnerabilities and risks of Mediterranean coastal zones to multiple hazards. Ph.D. Thesis, Università Ca’ Foscari Venezia, Venice, Italy, 2014. [Google Scholar] [CrossRef]
- Cardona, O.; Aalst, M.; Birkmann, J.; Fordham, M.; Mcgregor, G.; Perez, R.; Pulwarty, R.; Schipper, L.; Sinh, B. Determinants of risk: Exposure and vulnerability. In Managing the Risks of Extreme Events and Disasters to Advance Climate Change Adaptation: Special Report of the Intergovernmental Panel on Climate Change; A Special Report of Working Groups I and II of the Intergovernmental Panel on Climate Change (IPCC. 65-108. 10.1017/CBO9781139177245.005); Cambridge University Press: Cambridge, UK, 2012; pp. 65–108. [Google Scholar]
- UNISDR (United National International Strategy for Disaster Reduction). UNISDR Terminology on Disaster Risk Reduction International Strategy for Disaster Reduction (ISDR). 2009. Available online: https://www.unisdr.org/we/inform/publications/7817 (accessed on 22 May 2022).
- Romieu, E.; Welle, T.; Schneiderbauer, S.; Pelling, M.; Vinchon, C. Vulnerability assessment within climate change and natural hazard contexts: Revealing gaps and synergies through coastal applications. Sustain. Sci. 2010, 5, 159–170. [Google Scholar] [CrossRef]
- Greco, M.; Martino, G.; Guariglia, A.; Trivigno, L.; Losurdo, A.; Sansanelli, V. Development of an integrated SDSS for coastal risks monitoring and assessment. J Coast. Zone Manag. 2017, 20, 446. [Google Scholar] [CrossRef] [Green Version]
- Gallina, V.; Torresan, S.; Critto, A.; Sperotto, A.; Glade, T.; Marcomini, A. A review of multi-risk methodologies for natural hazards: Consequences and challenges for a climate change impact assessment. J. Environ. Manag. 2016, 168, 123–132. [Google Scholar] [CrossRef] [PubMed]
- Kappes, M.S.; Keiler, M.; von Elverfeldt, K.; Glade, T. Challenges of analyzing multi-hazard risk: A review. Nat. Hazards 2012, 64, 1925–1958. [Google Scholar] [CrossRef] [Green Version]
- Carpignano, A.; Golia, E.; Di Mauro, C.; Bouchon, S.; Nordvik, J. A methodological approach for the definition of multi-risk maps at regional level: First application. J. Risk Res. 2009, 12, 513–534. [Google Scholar] [CrossRef]
- Marzocchi, W.; Garcia-Aristizabal, A.; Gasparini, P.; Mastellone, M.A.; Di Ruocco, A. Basic principles of multi-risk assessment: A case study in Italy. Nat. Hazards 2012, 62, 551–573. [Google Scholar] [CrossRef]
- Cotti, D.; Harb, M.; Hadri, A.; Aboufirass, M.; Chaham, K.R.; Libertino, A.; Campo, L.; Trasforini, E.; Krätzschmar, E.; Bellert, F.; et al. Integrated Multi-Risk Assessment for Floods and Drought in the Marrakech-Safi Region (Morocco). Front. Water 2022, 4, 1–17. [Google Scholar] [CrossRef]
- Gallina, V.; Torresan, S.; Zabeo, A.; Critto, A.; Glade, T.; Marcomini, A. A Multi-Risk Methodology for the Assessment of Climate Change Impacts in Coastal Zones. Sustainability 2020, 12, 3697. [Google Scholar] [CrossRef]
- De Serio, F.; Armenio, E.; Mossa, M.; Petrillo, A.F. How to Define Priorities in Coastal Vulnerability Assessment. Geosciences 2018, 8, 415. [Google Scholar] [CrossRef] [Green Version]
- Simeoni, U.; Burla, I.; Fontolan, G.; Gragnaniello, S.; Valpreda, E.; Zamariolo, A. Jumping regressive evolutional trend of the Ionian beaches—Basilicata Region (Southern Italy). In Proceedings of the Sixth International Conference on the Mediterranean Coastal Environment, MEDCOAST 03, Ravenna, Italy, 7–11 October 2003; pp. 1825–1836. [Google Scholar]
- Cocco, E.; De Magistris, M.A.; De Pippo, T. Studi sulle cause dell’arretramento della costa lucano ionica. L’estrazione degli inerti lungo le aste fluviali. Mem. Soc. Geol. Ital. 1978, 19, 369–376. [Google Scholar]
- Biondi, B.; Baldoni, M. Caratteristiche bioclimatiche della penisola italiana. In Proceedings of the Effetti degli inquinanti atmosferici sul clima e la vegetazione, Taormina, Italy, 26–29 September 1991; pp. 225–250. [Google Scholar]
- Aiello, A.; Canora, F.; Pasquariello, G.; Spilotro, G. Shoreline variations and coastal dynamics: A space–time data analysis of the Jonian littoral, Italy. Estuarine Coast. Shelf Sci. 2013, 129, 124–135. [Google Scholar] [CrossRef]
- Bonora, N.; Immordino, F.; Schiavi, C.; Simeoni, U.; Valpreda, E. Interaction between Catchment Basin Management and Coastal Evolution (Southern Italy). J. Coast. Res. 2002, 36, 81–88. [Google Scholar] [CrossRef]
- Guariglia, A.; Buonamassa, A.; Losurdo, A.; Saladino, R.; Trivigno, M.L.; Zaccagnino, A.; Colangelo, A. A multisource approach for coastline mapping and identification of shoreline changes. Ann. Geophys. 2009, 49, 3155. [Google Scholar] [CrossRef]
- Cocco, E. Interpretazione aerofotografica delle variazioni della linea di costa lungo alcune zone del litorale alto ionico (Golfo di Taranto). Geol. Appl. Idrogeol. 1975, 10, 1–54. [Google Scholar]
- Greco, M.; Martino, G. Assessment of maritime erosion index for Ionic-Lucanian coast. Eng. Geol. Soc. Territ. Mar. Coast. Process. 2014, 4, 41–44. [Google Scholar] [CrossRef]
- Vita, M.; Bulfaro, M.; Cavuoti, C.; Pagliaro, S. Interazione Bacino-Costa: Cause e mitigazione della vulnerabilità. Il caso del littorale Jonico Lucano. In Proceedings of the Atti del Convegno: Coste Prevenire, Programmare, Pianificare. Collana dell’Autorità Interregionale di Bacino della Basilicata, Seconda Serie Editoriale, Maratea, Italy, 15–17 May 2008; pp. 29–44. [Google Scholar]
- Mastronuzzi, G. Il litorale settentrionale del golfo di Taranto: Evoluzione morfologica e dinamica attuale. Basilicata Reg. Not. 1996, 1, 27–32. [Google Scholar]
- Marsicano, D.; Trivisani, A. Metaponto una costa da salvare. Basilicata Reg. Not. 1996, 1, 19–20. [Google Scholar]
- Greco, M.; Martino, G. Modelling of Coastal Infrastructure and Delta River Interaction on Ionic Lucanian Littoral. Procedia Eng. 2014, 70, 763–772. [Google Scholar] [CrossRef] [Green Version]
- Greco, M.; Martino, G. Local emergency works for coastal risk defense. In Proceedings of the 7th WSEAS International Conference on Environmental and Geological Science and Engineering (EG14)—Latest Trend in Energy, Environment and Development, Salerno, Italy, 3–5 June 2014; Volume 25, pp. 66–73, ISBN 978-960-474-375-9. [Google Scholar]
- Cooper, N.; Pontee, N. Appraisal and evolution of the littoral ‘sediment cell’ concept in applied coastal management: Experiences from England and Wales. Ocean Coast. Manag. 2006, 49, 498–510. [Google Scholar] [CrossRef]
- Thieler, E.R.; Himmelstoss, E.A.; Zichichi, J.L.; Ergul, A. Digital Shoreline Analysis System (DSAS) Version 4.0—An ArcGIS Extension for Calculating Shoreline Change; Open-File Report 2008-1278; U.S. Geological Survey: Reston, VA, USA, 2009. [CrossRef]
- Benassai, G.; Chirico, F.; Corsini, S. Una metodologia sperimentale per la definizione del rischio di inondazione costiera. Studi Costieri. 2009, 16, 51–72. [Google Scholar]
- Kriebel, D.L.; Dean, R.G. Convolution method for time dependent beach profile response. J. Waterw. Port Coast. Ocean. Eng. 1993, 119, 204–226. [Google Scholar] [CrossRef]
- Montoya, A.L. Natural disasters and development in a globalizing world—by M. Pelling.—Routledge, 2003. Habitat Int. J. Study Hum. Settl. 2004, 28, 499–500. [Google Scholar] [CrossRef]
- Breil, M.; Catenacci, M.; Travisi, M. Impatti del cambiamento climatico sulle zone costiere: Quantificazione economica di impatti e di misure di adattamento–sintesi di risultati e indicazioni metodologiche per la ricerca futura. In Report Prepared for the APAT Workshop on “Cambiamenti Climatici e Ambiente Marino-Costiero: Scenari Futuri per un Programma Nazionale di Adattamento”; APAT and CMCC: Palermo, Italy, 2007; pp. 27–28. [Google Scholar]
- Bernstein, L.; Bosch, P.; Canziani, O.; Chen, Z.; Christ, R.; Riahi, K. IPCC, 2007: Climate Change; Synthesis Report; IPCC: Geneva, Switzerland, 2007; ISBN 2-9169-122-4. [Google Scholar]
- Furlan, E.; Pozza, P.D.; Michetti, M.; Torresan, S.; Critto, A.; Marcomini, A. Development of a Multi-Dimensional Coastal Vulnerability Index: Assessing vulnerability to inundation scenarios in the Italian coast. Sci. Total Environ. 2021, 772, 144650. [Google Scholar] [CrossRef] [PubMed]
- Mentaschi, L.; Besio, G.; Cassola, F.; Mazzino, A. Performance evaluation of Wavewatch III in the Mediterranean Sea. Ocean Model. 2015, 90, 82–94. [Google Scholar] [CrossRef]
- Boruff, B.J.; Emrich, C.; Cutter, S.L. Erosion Hazard Vulnerability of US Coastal Counties. J. Coast. Res. 2005, 215, 932–942. [Google Scholar] [CrossRef] [Green Version]
- Boak, E.H.; Turner, I.L. Shoreline Definition and Detection: A Review. J. Coast. Res. 2005, 214, 688–703. [Google Scholar] [CrossRef] [Green Version]
- Toure, S.; Diop, O.; Kpalma, K.; Maiga, A.S. Shoreline Detection using Optical Remote Sensing: A Review. ISPRS Int. J. Geo-Info. 2019, 8, 75. [Google Scholar] [CrossRef] [Green Version]
- Moore, L.J.; Ruggiero, P.; List, J.H. Comparing Mean High Water and High Water Line Shorelines: Should Proxy-Datum Offsets be Incorporated into Shoreline Change Analysis? J. Coast. Res. 2006, 224, 894–905. [Google Scholar] [CrossRef]
- Whitehouse, R.; Balson, P.; Beech, N.; Brampton, A.; Blott, S.; Burningham, H.; Cooper, N.; French, J.; Guthrie, G.; Hanson, S.; et al. Characterisation and Prediction of Large-Scale, Long-Term Change of Coastal Geomorphological Behaviours; The Environment Agency: Bristol, UK, 2009; 264p. [CrossRef]
- Pethick, J.; Ramesh, R.; Purvaja, R. Coastal Sediment Cells: A Guide for Coastal Managers; National Centre for Sustainable Coastal Management, Ministry of Environment and Forests: Chennai, India, 2013; p. 20.
- Ponte Lira, C.; Nobre Silva, A.; Taborda, R.; Freire de Andrade, C. Coastline evolution of Portuguese low-lying sandy coast in the last 50 years: An integrated approach. Earth Syst. Sci. Data 2016, 8, 265–278. [Google Scholar] [CrossRef] [Green Version]
- Bianco, F.; Conti, P.; García-Ayllon, S.; Pranzini, E. An integrated approach to analyze sedimentary stock and coastal erosion in vulnerable areas: Resilience assessment of San Vicenzo’s coast (Italy). Water 2020, 12, 805. [Google Scholar] [CrossRef] [Green Version]
- Bray, M.J.; Carter, D.J.; Hooke, J.M. Littoral Cell Definition and Budgets for Central Southern England. J. Coast. Res. 1995, 11, 381–400. Available online: http://www.jstor.org/stable/4298347 (accessed on 22 May 2022).
- Motyka, J.M.; Brampton, A.H. Coastal Management: Mapping of Littoral Cells; HR: Wallingford, UK, 1993; Report SR328; Available online: http://eprints.hrwallingford.com/id/eprint/339 (accessed on 22 May 2022).
- Salman, A.; Lombardo, S.; Doody, P. Living with Coastal Erosion in Europe: Sediment and Space for Sustainability; Eurosion Practice Reports. 2004. Available online: http://resolver.tudelft.nl/uuid:483327a3-dcf7-4bd0-a986-21d9c8ec274e (accessed on 22 May 2022).
- Ramesh, R.; Purvaja, R.; Rajakumari, S.; Suganya, G.M.D.; Sarunjith, K.J.; Vel, A.S. Sediment cells and their dynamics along the coasts of India—A review. J. Coast. Conserv. 2021, 25, 1–14. [Google Scholar] [CrossRef]
- Montanari, R.; Marasmi, C. New tools for coastal management in Emilia-Romagna. In Regione Emilia Romagna; Regione Emilia Romagna: Bologna, Italy, 2012; p. 72. [Google Scholar]
- Pranzini, E.; Cinelli, I.; Cipriani, L.E.; Anfuso, G. An Integrated Coastal Sediment Management Plan: The Example of the Tuscany Region (Italy). J. Mar. Sci. Eng. 2020, 8, 33. [Google Scholar] [CrossRef] [Green Version]
- Anfuso, G.; Pranzini, E.; Vitale, G. An integrated approach to coastal erosion problems in northern Tuscany (Italy): Littoral morphological evolution and cell distribution. Geomorphology 2011, 129, 204–214. [Google Scholar] [CrossRef]
- Tsoukala, V.K.; Katsardi, V.; Hadjibiros, K.; Moutzouris, C.I. Beach Erosion and Consequential Impacts Due to the Presence of Harbours in Sandy Beaches in Greece and Cyprus. Environ. Process. 2015, 2, 55–71. [Google Scholar] [CrossRef] [Green Version]
- Molina, R.; Anfuso, G.; Manno, G.; Gracia Prieto, F.J. The Mediterranean Coast of Andalusia (Spain): Medium-Term Evolution and Impacts of Coastal Structures. Sustainability 2019, 11, 3539. [Google Scholar] [CrossRef] [Green Version]
- Williams, A.; Rangel-Buitrago, N.; Pranzini, E.; Anfuso, G. The management of coastal erosion. Ocean Coast. Manag. 2018, 156, 4–20. [Google Scholar] [CrossRef]
- Gutierrez, B.T.; Williams, S.J.; Thieler, E.R. Ocean coasts. In Coastal Sensitivity to Sea-Level Rise: A Focus on the Mid-Atlantic Region; U.S. Climate Change Scientific Program: Washington, DC, USA, 2009; pp. 43–56. [Google Scholar]
- Selicato, F.; Rotondo, F.; Piscitelli, C.; Selicato, S. Planning the coastal management. The Apulia Region Plan. In Proceedings of the 2014 International Conference on Civil Engineering, Santorini Island, Greece, 17–21 July 2014. [Google Scholar]
- Cooper, J.A.G.; McLaughlin, S. Contemporary Multidisciplinary Approaches to Coastal Classification and Environmental Risk Analysis. J. Coast. Res. 1998, 14, 512–524. Available online: http://www.jstor.org/stable/4298806 (accessed on 22 May 2022).
- Gornitz, V. Global coastal hazards from future sea level rise. Palaeogeogr. Palaeoclim. Palaeoecol. 1991, 89, 379–398. [Google Scholar] [CrossRef]
- Gornitz, V.M.; Daniels, R.C.; White, T.W.; Birdwell, K.R. The development of a coastal risk assessment database: Vulnerability to sea-level rise in the U.S. southeast. J. Coast. Res. 1994, SI 12, 327–338. [Google Scholar]
- Ramieri, E.; Hartley, A.; Office, M.; Barbanti, A.; National, I.; Santos, F.D. Methods for assessing coastal vulnerability to climate change. ETC CCA Tech. Pap. 2011, 1, 1–93. [Google Scholar]
- Nguyen, C.; Dang, K.; Ngo, V.; Dang, V.; Truong, Q.; Nguyen, D.; Giang, T.; Pham, T.; Ngo, C.; Hoang, T.; et al. New Approach to Assess Multi-Scale Coastal Landscape Vulnerability to Erosion in Tropical Storms in Vietnam. Sustainability 2021, 13, 1004. [Google Scholar] [CrossRef]
- Martinelli, L.; Zanuttigh, B.; Corbau, C. Assessment of coastal flooding hazard along the Emilia Romagna littoral, IT. Coast. Eng. 2010, 57, 1042–1058. [Google Scholar] [CrossRef]
- Di Paola, G.; Aucelli, P.P.C.; Benassai, G.; Iglesias, J.; Rodríguez, G.; Rosskopf, C.M. The assessment of the coastal vulnerability and exposure degree of Gran Canaria Island (Spain) with a focus on the coastal risk of Las Canteras Beach in Las Palmas de Gran Canaria. J. Coast. Conserv. 2017, 22, 1001–1015. [Google Scholar] [CrossRef]
- Ferreira, O.; Garcia, T.; Matias, A.; Taborda, R.; Alveirinho Dias, J. An integrated method for the determination of set-back lines for coastal erosion hazards on sandy shores. Cont. Shelf Res. 2006, 26, 1030–1044. [Google Scholar] [CrossRef]
- Mclaughlin, S.; Cooper, J.A.G. A multi-scale coastal vulnerability index: A tool for coastal managers? . Environ. Hazards 2010, 9, 233–248. [Google Scholar] [CrossRef]
- Dal Cin, R.; Simeoni, U. A model for determining the classification, vulnerability and risk in the Southern coastal zone of the Marche (Italy). J. Coast. Res. 1994, 10, 18–29. [Google Scholar]
- Balica, S.F.; Douben, N.; Wright, N.G. Flood vulnerability indices at varying spatial scales. Water Sci. Technol. 2009, 60, 2571–2580. [Google Scholar] [CrossRef] [Green Version]


| Horizontal Run Up % | |||||
|---|---|---|---|---|---|
| Xmax < 20 | 20 ≤ Xmax < 40 | 40 ≤ Xmax < 60 | 60 ≤ Xmax < 80 | Xmax ≥ 80 | |
| Runup Index IRu | 0 | 1 | 2 | 3 | 4 |
| Impact Index | Vulnerability Level | Classes |
|---|---|---|
| Ii < 5 | Low vulnerability | V1 |
| 5 ≤ Ii < 6 | Medium vulnerability | V2 |
| 6 ≤ Ii < 8 | High vulnerability | V3 |
| Ii ≥ 8 | Very high vulnerability | V4 |
| Score | 0 | 1 | 2 | 3 |
|---|---|---|---|---|
| PM | 0 | <5000 resident | 5000–20,000 resident | >20,000 resident |
| UM | <10% | 10–20% | 20–40% | >40% |
| EM | <5% | 5–20% | 20–30% | >30% |
| U10 km | <5% | 5–10% | 10–15% | >15% |
| Socio-Economic Vulnerability | |||||
|---|---|---|---|---|---|
| Morphological vulnerability | D4 | D3 | D2 | D1 | |
| V4 | ZPI1 | ZPI2 | ZPI3 | ZPI4 | |
| V3 | ZPI2 | ZPI3 | ZPI4 | ZPI4 | |
| V2 | ZPI3 | ZPI4 | ZPI4 | ZPI4 | |
| V1 | ZPI4 | ZPI4 | ZPI4 | ZPI4 | |
| ZPE1 | ZPE2 | ZPE3 | ZPE4 | |||||
| ZPI1 | ICC11 | ICC2 | ICC3 | |||||
| ZPI3 | ICC1 | ICC2 | ICC3 | |||||
| ZPI2 | ICC2 | ICC3 | ICC4 | |||||
| ZPI1 | ICC2 | ICC3 | ICC4 | |||||
| Class | Value | |
|---|---|---|
| BEACH WIDTH | <35 m | 1 |
| 35–60 m | 2 | |
| >60 m | 3 | |
| + | ||
| Shoreline evolutive trend | + for 1954 to 1997 and for 1997–2010 | 0.25 |
| − for 1954 to 1990 and + for 1997–2010 | 0.50 | |
| + for 1954 to 1990 and for 1997–2010 | 0.75 | |
| − for 1954 to 1997 and for 1997–2010 | 1 | |
| = | ||
| CeD | <1.50 | Not relevant/low |
| 1.50–2.50 | Not negligible/medium | |
| 2.50–3.50 | Significative/high | |
| >3.50 | Important/very high | |
| Macro-Area | Limits | Extension (Km2) | Shoreline Length (km) | Width (km) | Urban Center | SIC-SAC/SPA |
|---|---|---|---|---|---|---|
| 1 | LH Bradano—Apulia Border | 9.8 | 1.1 | 9.0 | C type | |
| 2 | RH Bradano—LH Basento (Porto Argonauti) | 54.7 | 6.8 | 8.8 | Metaponto Lido | C type B type |
| 3 | RH Basento (Porto Argonauti—LH Cavone) | 70.3 | 6.6 | 8.2 | Marina di Pisticci | B type |
| 4 | RH Cavone—LH Agri | 70.8 | 8.2 | 8.2 | Lido di Scanzano | B type |
| 5 | RH Agri—Porto Marinagri | 14.2 | 2.2 | 8.6 | Marinagri | B type |
| 6 | Porto Marinagri—LH Sinni | 49.0 | 6.8 | 7.8 | Policoro | C type |
| 7 | RH Sinni—Calabria Border | 33.8 | 5.7 | 6.8 | Nova Siri Rotondella |
| Profile | PM | UM | EM | U10km | IDC | D | E | S | |
|---|---|---|---|---|---|---|---|---|---|
| MA 2 | Profile 1—RH Bradano | 2 | 2 | 3 | 1 | 8 | D3 | E4 | S3 |
| Profile 2—Metaponto L. Hermitage | 2 | 2 | 3 | 1 | 8 | D3 | E4 | S3 | |
| Profile 3—Metaponto L. Rotonda | 2 | 2 | 3 | 1 | 8 | D3 | E4 | S3 | |
| Profile 4—Metaponto L. Katy | 2 | 2 | 3 | 1 | 8 | D3 | E4 | S3 | |
| Profile 5—LH Basento | 2 | 2 | 3 | 1 | 8 | D3 | E4 | S3 | |
| MA 3 | Profile 6—RH Basento | 1 | 0 | 3 | 3 | 7 | D3 | E4 | S3 |
| Profile 7—LH Cavone | 1 | 0 | 3 | 3 | 7 | D3 | E4 | S3 | |
| MA 4 | Profile 8—RH Cavone | 1 | 0 | 3 | 0 | 4 | D2 | E4 | S2 |
| Profile 9—LH Agri | 1 | 0 | 3 | 0 | 4 | D2 | E4 | S2 | |
| MA 5 | Profile 10—RH Agri | 1 | 0 | 3 | 0 | 4 | D2 | E4 | S2 |
| MA 6 | Profile 11—Lido Policoro | 1 | 0 | 3 | 0 | 4 | D2 | E4 | S2 |
| Profile 12—LH Sinni | 1 | 0 | 3 | 0 | 4 | D2 | E4 | S2 | |
| MA 7 | Profile 13—RH Sinni | 1 | 2 | 1 | 3 | 7 | D3 | E4 | S3 |
Publisher’s Note: MDPI stays neutral with regard to jurisdictional claims in published maps and institutional affiliations. |
© 2022 by the authors. Licensee MDPI, Basel, Switzerland. This article is an open access article distributed under the terms and conditions of the Creative Commons Attribution (CC BY) license (https://creativecommons.org/licenses/by/4.0/).
Share and Cite
Corbau, C.; Greco, M.; Martino, G.; Olivo, E.; Simeoni, U. Assessment of the Vulnerability of the Lucana Coastal Zones (South Italy) to Natural Hazards. J. Mar. Sci. Eng. 2022, 10, 888. https://doi.org/10.3390/jmse10070888
Corbau C, Greco M, Martino G, Olivo E, Simeoni U. Assessment of the Vulnerability of the Lucana Coastal Zones (South Italy) to Natural Hazards. Journal of Marine Science and Engineering. 2022; 10(7):888. https://doi.org/10.3390/jmse10070888
Chicago/Turabian StyleCorbau, Corinne, Michele Greco, Giovanni Martino, Elisabetta Olivo, and Umberto Simeoni. 2022. "Assessment of the Vulnerability of the Lucana Coastal Zones (South Italy) to Natural Hazards" Journal of Marine Science and Engineering 10, no. 7: 888. https://doi.org/10.3390/jmse10070888
APA StyleCorbau, C., Greco, M., Martino, G., Olivo, E., & Simeoni, U. (2022). Assessment of the Vulnerability of the Lucana Coastal Zones (South Italy) to Natural Hazards. Journal of Marine Science and Engineering, 10(7), 888. https://doi.org/10.3390/jmse10070888