Article

Geochronological Evidence Inferring Carbonate Compensation Depth Shoaling in the Philippine Sea after the Mid-Brunhes Event

1
Key Laboratory of Submarine Geosciences, Ministry of Natural Resources, Hangzhou 310012, China
2
Second Institute of Oceanography, Ministry of Natural Resources, Hangzhou 310012, China
3
State Key Laboratory of Marine Geology, Tongji University, Shanghai 200092, China
4
Key Laboratory of Muddy Coastal Geo-Environment, Tianjin Centre, China Geological Survey, Tianjin 300170, China
*
Author to whom correspondence should be addressed.
J. Mar. Sci. Eng. 2022, 10(6), 745; https://doi.org/10.3390/jmse10060745
Submission received: 23 April 2022 / Revised: 21 May 2022 / Accepted: 25 May 2022 / Published: 28 May 2022
(This article belongs to the Section Geological Oceanography)

Abstract

:
Carbonate compensation depth (CCD) is an important factor in the global deep ocean and in global carbon cycling; however, its variabilities have not been well documented in previous studies. In this study, we investigate two deep-sea cores collected from the Philippine Sea in terms of geochronology and geochemical properties over the past ~900 kyr. The principle results are as follows: (1) Two magnetozones are determined from the sediment’s magnetic records, which can be correlated with the Brunhes and Matuyama chrons in the geomagnetic polarity timescale. (2) The age models can be refined by tuning the Ba and Sm intensities of the two studied cores to the global ice volume, and the estimated sediment accumulation rate is ~4 mm/kyr. (3) Chalky mud and the bulk carbon δ13C record vary abruptly at ~430 ka and imply 200 m shoaling of the CCD. Based on these results, a close link is inferred between marine productivity, aeolian dust, and CCD changes, which can be correlated with a major change that occurred during the Mid-Brunhes Event. Therefore, we propose that the sedimentary processes in the Philippine Sea are evidence of global climate change, providing a unique window to observe interactions between various environmental systems.

1. Introduction

Earth’s climate has experienced frequent glacial–interglacial alternations since the late Pliocene [1,2,3]. These cycles have a dominated period of 100 kyr during the past 800 kyr [1,2], and their amplitudes remarkably enlarged at ~430 ka, namely, during the Mid-Brunhes Event (MBE) [4]. Prior to ~430 ka, interglacial intervals were characterized by cooler Antarctic temperature [5] and a lower concentration of atmospheric CO2 [6], while the concentration of atmospheric CH4 [7] and the Asian monsoon [8,9] were likely less affected by the MBE. The corresponding mechanisms for the MBE involve an induced CO2 respiring from the Southern Ocean [10] and/or a slowdown of Antarctic Bottom Water (AABW) formation [11]. However, the relationship between external (orbital forcing) and internal (greenhouse gases and ice volume) factors is complex [12,13], and it is not well understood how the global carbon cycle changed before and after the MBE. Thus, the mechanism of the MBE is one of the most challenging issues in understanding Earth’s climate in the last 800 kyr [14].
Carbonate compensation depth (CCD) is a “snowline” separating carbonate-rich and -deficient sediments in the global deep ocean [15], with a great fluctuation of ~2000 m in the equatorial Pacific in the Cenozoic [16]. CCD variability is an effective indicator of the global carbon cycle [17], determining the mass of carbon stored in abyssal sediments and cycled between Earth’s surface spheres [15]. The long-term changes in the CCD can be understood by analyzing deep-sea sediments [16,17], and for some key intervals in global climate changes, a notable variability of the CCD is consistently observed [3,16,18]. For example, during the Eocene–Oligocene transition, the CCD was about 1000 m deeper than that in pre-Eocene time [16], and this CCD deepening was likely ascribed to Antarctic ice expansion and the carbon cycling shift [19,20]. Considering the fact that the variability of atmospheric CO2 is one of the most amplified processes during the MBE [13], reconstructing the CCD level has great potential to help us understand the mechanism of the MBE.
In this study, two gravity cores (C6 and I8) were collected from the Western Philippine Sea (Figure 1). By integrating magnetostratigraphic and orbital tuning, it was determined that the age of the sedimentary boundary between carbonate-rich and -deficient sediments in the studied cores was about 420 ka, and it appeared during Marine Isotope Stage (MIS) 12. This sedimentary boundary was the result of changes in bulk carbon δ13C. By comparing the paleoenvironmental proxies with the MBE, it could be inferred that the CCD was about 200 m deeper than in post-MBE time, and the CCD shoaling that occurred after the MBE might be ascribed to an interhemispheric carbon shift, which is discussed in detail below.

2. Materials and Methods

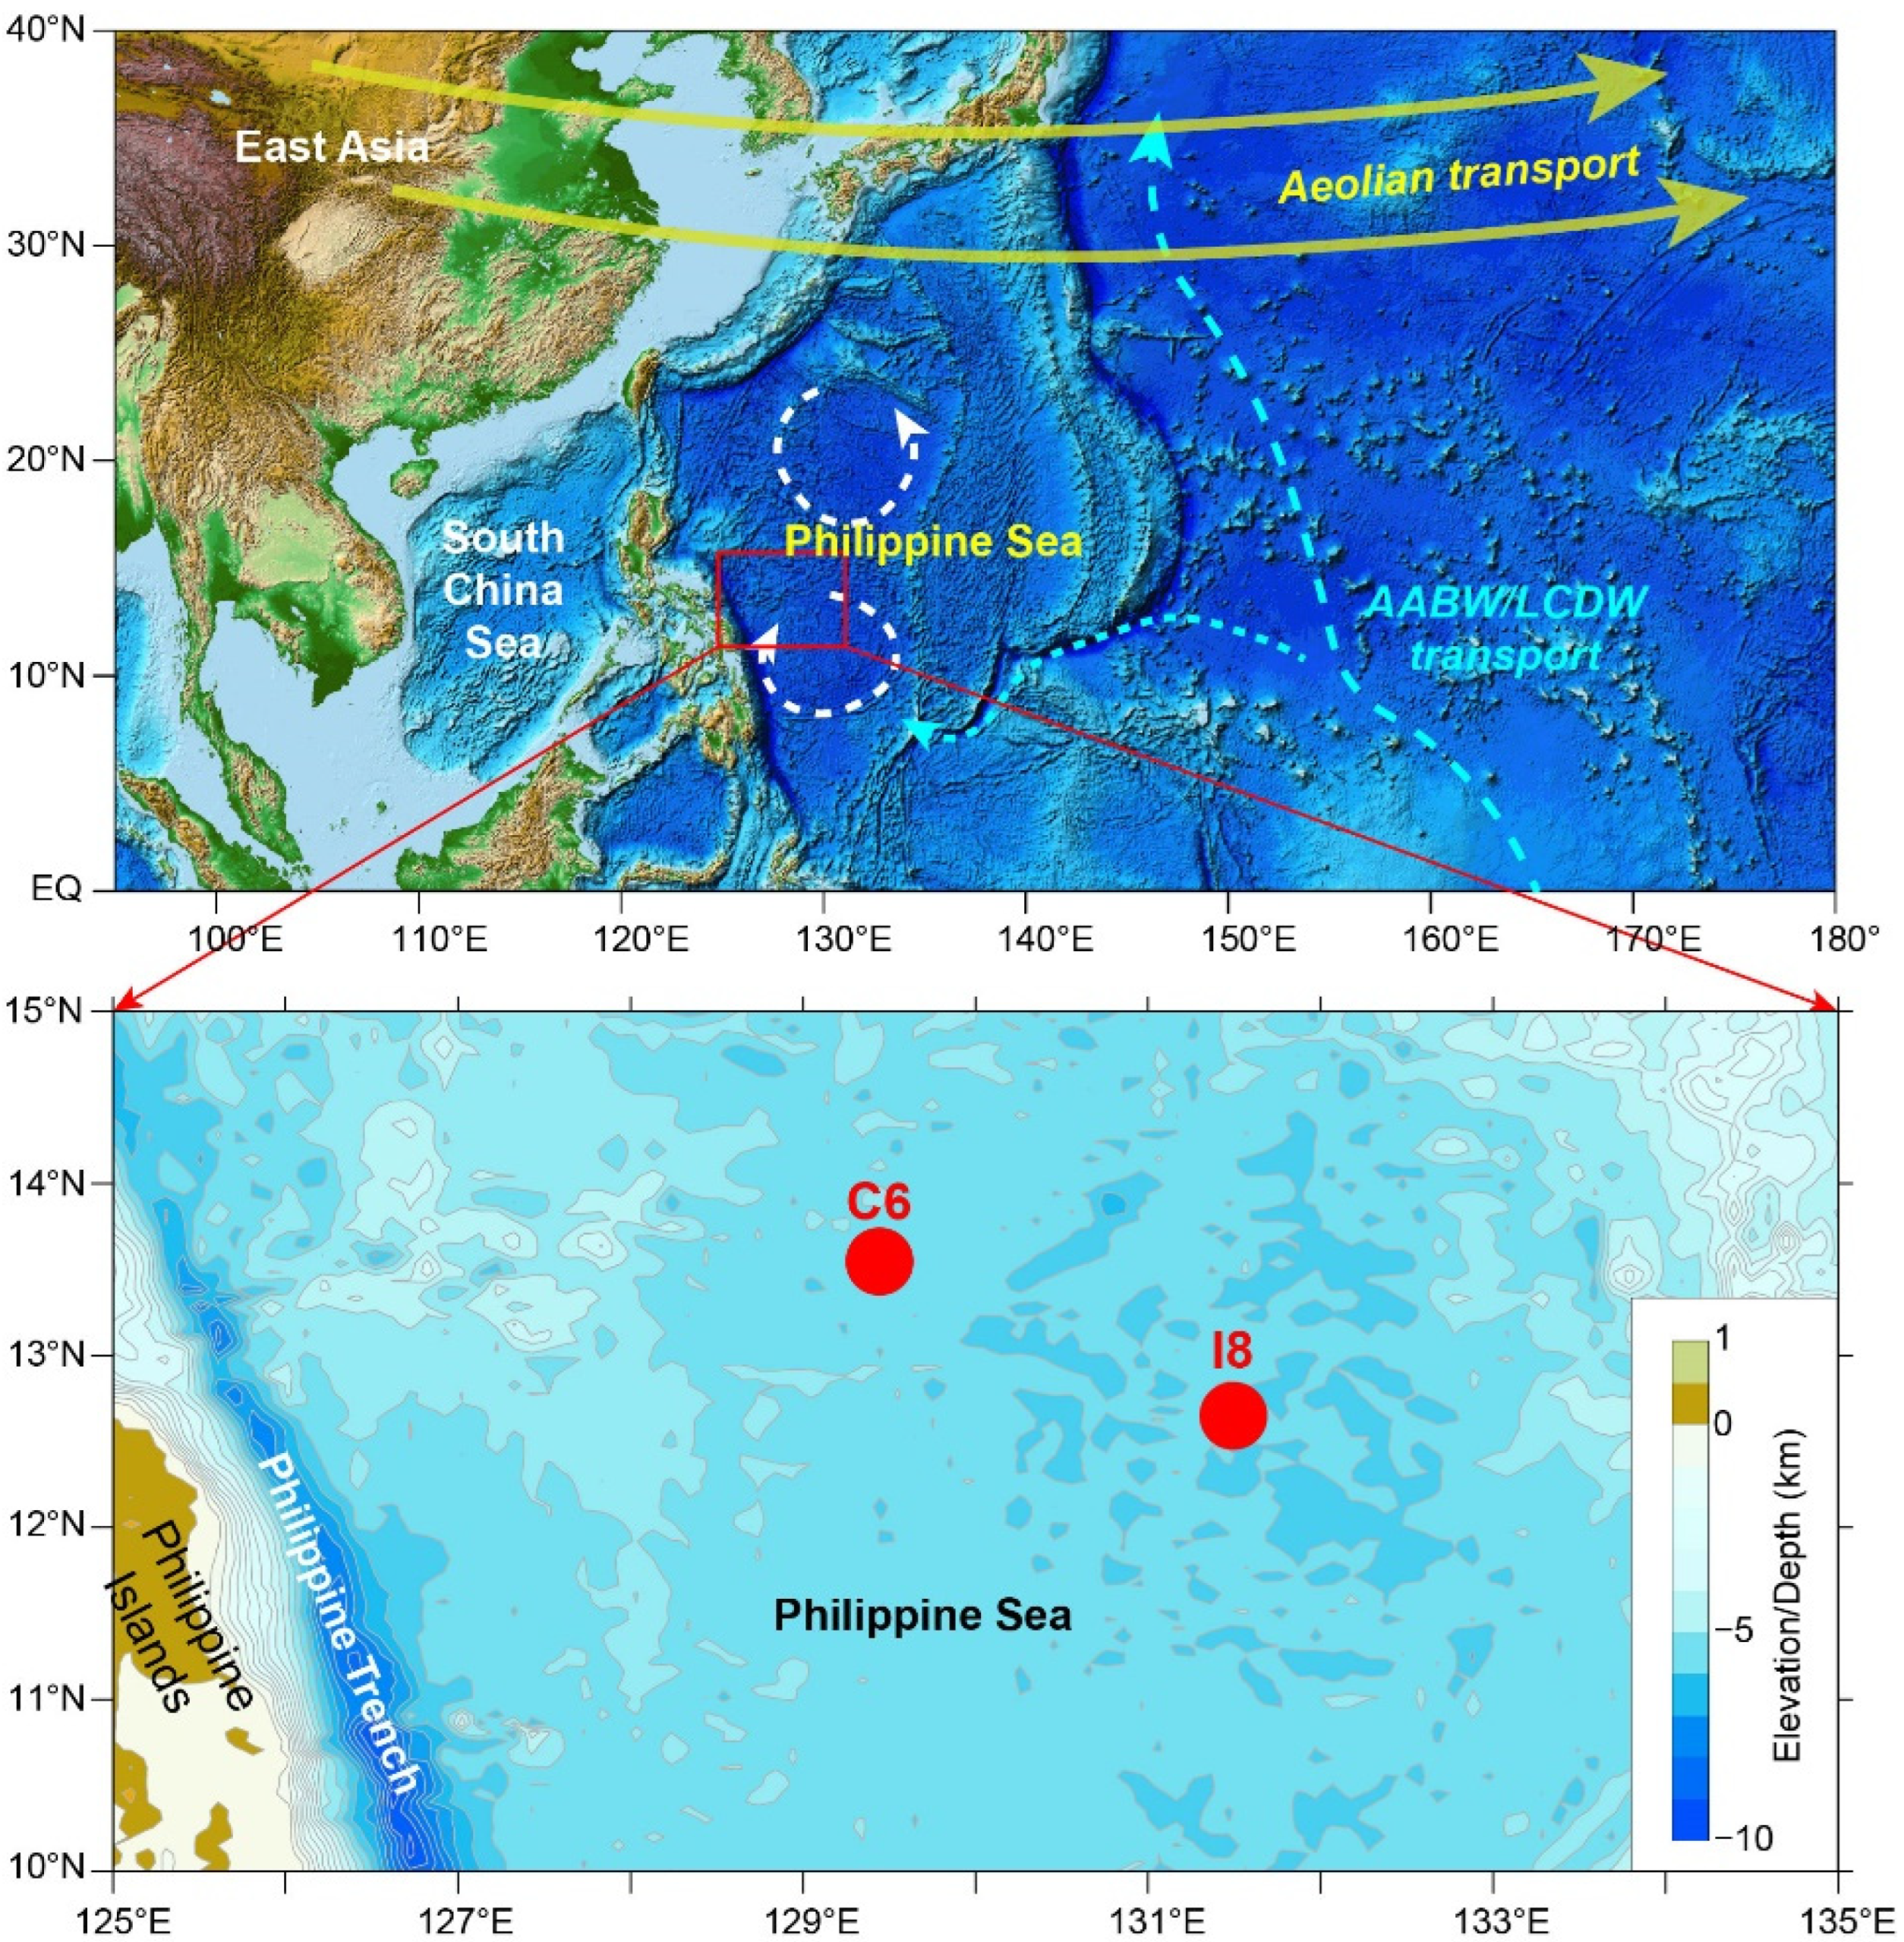
2.1. The Studied Cores

The studied cores, C6 (129.47° E, 13.39° N, 4440 m water depth) and I8 (131.29° E, 12.75° N, 5405 m water depth), were collected from the western part of the Philippine Sea (Figure 1) using a gravity corer. The lengths of cores C6 and I8 are 240 cm and 350 cm, respectively. Most of the sediments of the cores are light brown to brown; homogenous carbonate-free mud and chalky mud were found in the lower part of core C6. The cores were sampled for paleomagnetic and geochemical studies.

2.2. Magnetic Measurements

Samples for paleomagnetic studies were collected by using nonmagnetic plastic U-channels (2 cm × 2 cm × 150 cm). All U-channel samples were subjected to stepwise alternating field (AF) demagnetization up to a peak field of 90 mT (13 steps). Natural remanent magnetization (NRM) was measured (0–244 cm for core C6 and 6–348 cm for core I8) using a three-axis cryogenic magnetometer (2G Enterprise Model 755, USA) installed in a magnetically shielded room (residual fields < 300 nT) at the State Key Laboratory of Marine Geology, Tongji University, and the Key Laboratory of Muddy Coastal Geo-Environment of the Tianjin Center. Characteristic remanent magnetization (ChRM) directions were determined using principal component analysis [23] implemented using the PuffinPlot package [24], with at least five consecutive demagnetization steps and with a maximum angular deviation (MAD) of less than 15°.

2.3. Chemical Scanning

X-ray fluorescence (XRF) scanning allows nondestructive and continuous element analyses of sediment cores [25], and it has been applied to high-resolution climatic reconstructions of various types of sediments over various timescales [26,27,28,29]. Thus, the chemical scanning of the two studied cores was conducted (1.7–239.4 cm for core C6 and 1.0–348.1 cm for core I8) to achieve paleoenvironmental information. The instrument used was the Itrax XRF core scanner at the Second Institute of Oceanography, Ministry of Natural Resources of China, and the used parameters were 10 s count time, 30 kV X-ray voltage, and an X-ray current of 45 mA. Elemental intensities were obtained and are given in counts per second (cps).

2.4. Bulk Sediment’s δ13C

A total of 33 samples from a depth 1–244 cm of core C6 were collected to measure bulk sediment’s δ13C. Untreated freeze-dried and homogenized sediments were packaged and then used to analyze the bulk carbon isotope ratio (δ13C) with an elemental analyzer (Vario EL III, Elementar, Langenselbold, Germany) coupled to an isotope ratio mass spectrometer (Isoprime, Elementar) at State Key Laboratory of Marine Geology, Tongji University. The samples were measured in triplicate, and the analytical precision (standard deviation for repeated measurements of the USGS40 standard) was 0.03‰ for δ13C.

3. Results and Analyses

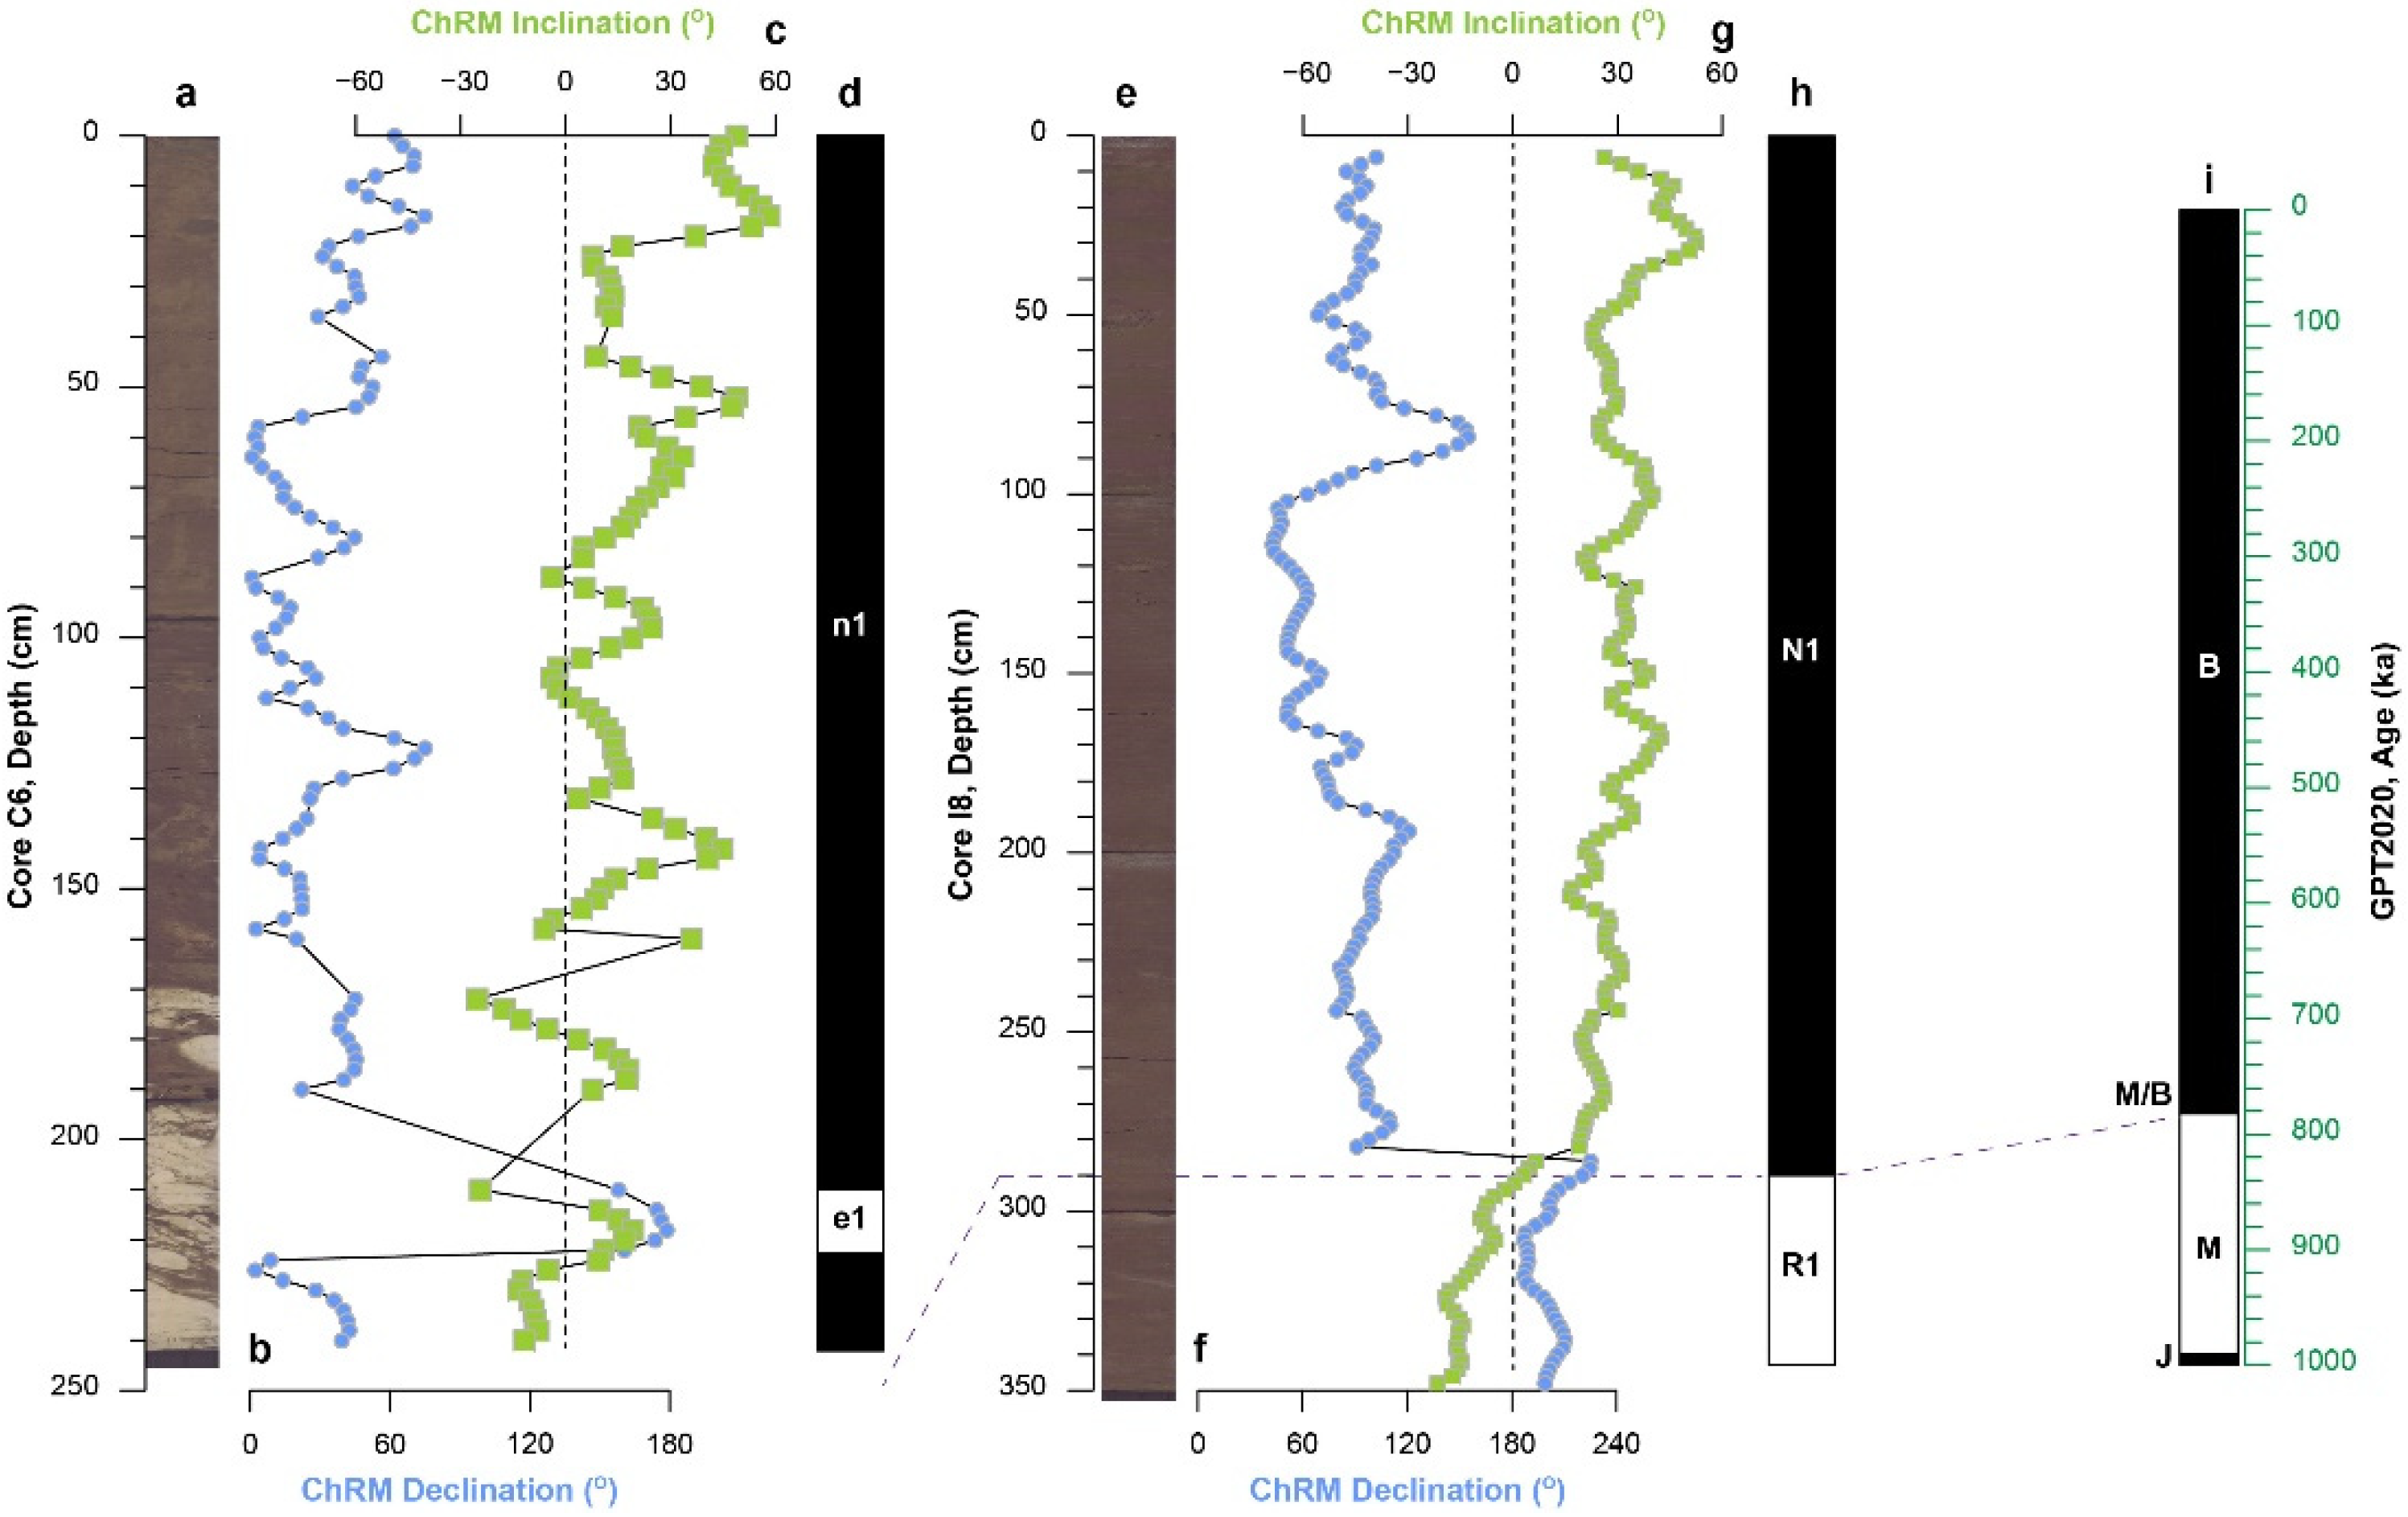
3.1. Magnetostratigraphy

NRMs of cores C6 and I8 changed within a range of 1.05 × 10⁻⁸–2.36 × 10⁻⁶ Am2 and 2.41 × 10⁻⁷–1.27 × 10⁻⁵ Am2, respectively, and gradually decreased when subjected to AF demagnetization: ~50% of NRMs were removed at ~25 mT, while 90–95% of NRMs were removed up to a peak field of 80 mT. ChRMs can be calculated using the data between 20 and 50–90 mT. With the criterion of five continuous AF steps and MAD < 15°, 83% of the measured points (101 from 121 points in total) were observed to contain ChRM in core C6, and all of the measured points (172 points in total) were observed to contain ChRM in core I8 (Figure 2).
Based on the observed ChRMs, two magnetozones in core I8 were determined: one of reversed polarity (R1, 344–292/286 cm) and one of normal polarity (N1, 292/286 cm–top). Considerable sediment accumulation rates (SAR) in the middle Pleistocene of ~100–300 cm/Myr were noted in the center of the Philippine Sea [30]. With an assumption of no major hiatus, we correlated the two magnetozones with the geological polarity timescale (GPT2020) [31] as follows: magnetozone N1 was correlated with the Brunhes; reversed magnetozone R1 was correlated with the Matuyama (Figure 2).
For core C6, magnetic inclination varied greatly, and several intervals with negative values were observed (Figure 2). However, within these intervals, magnetic declination did not turn over to follow inclination changes. The inconsistency between magnetic inclination and declination usually results from two processes: one, hiatus and/or two, the unique properties of tropical regions. Regarding hiatus, although changes in magnetic inclination are large in core C6, the change pattern of magnetic inclination between the two studied cores is comparable. This implies that hiatus may not be the major reason for the inconsistency between inclination and declination. Regarding the unique properties of tropical regions, the latitudes of the two cores are similar. The locality of core C6 is closer to the low-intensity West Pacific Anomaly of Earth’s magnetic field, wherechanges in magnetic inclination are much greater than those in other regions on Earth, and an inconsistency between inclination and declination is usually evident [32]. In addition, the M/B boundary in core I8 can be set at 292 and 286 cm according to magnetic inclination and declination, respectively, inferring a similar inconsistency between inclination and declination. Thus, we identified one magnetozone (n1) with an excursion (e1) for core C6 and correlated magnetozone n1 with the Brunhes chron (Figure 2).

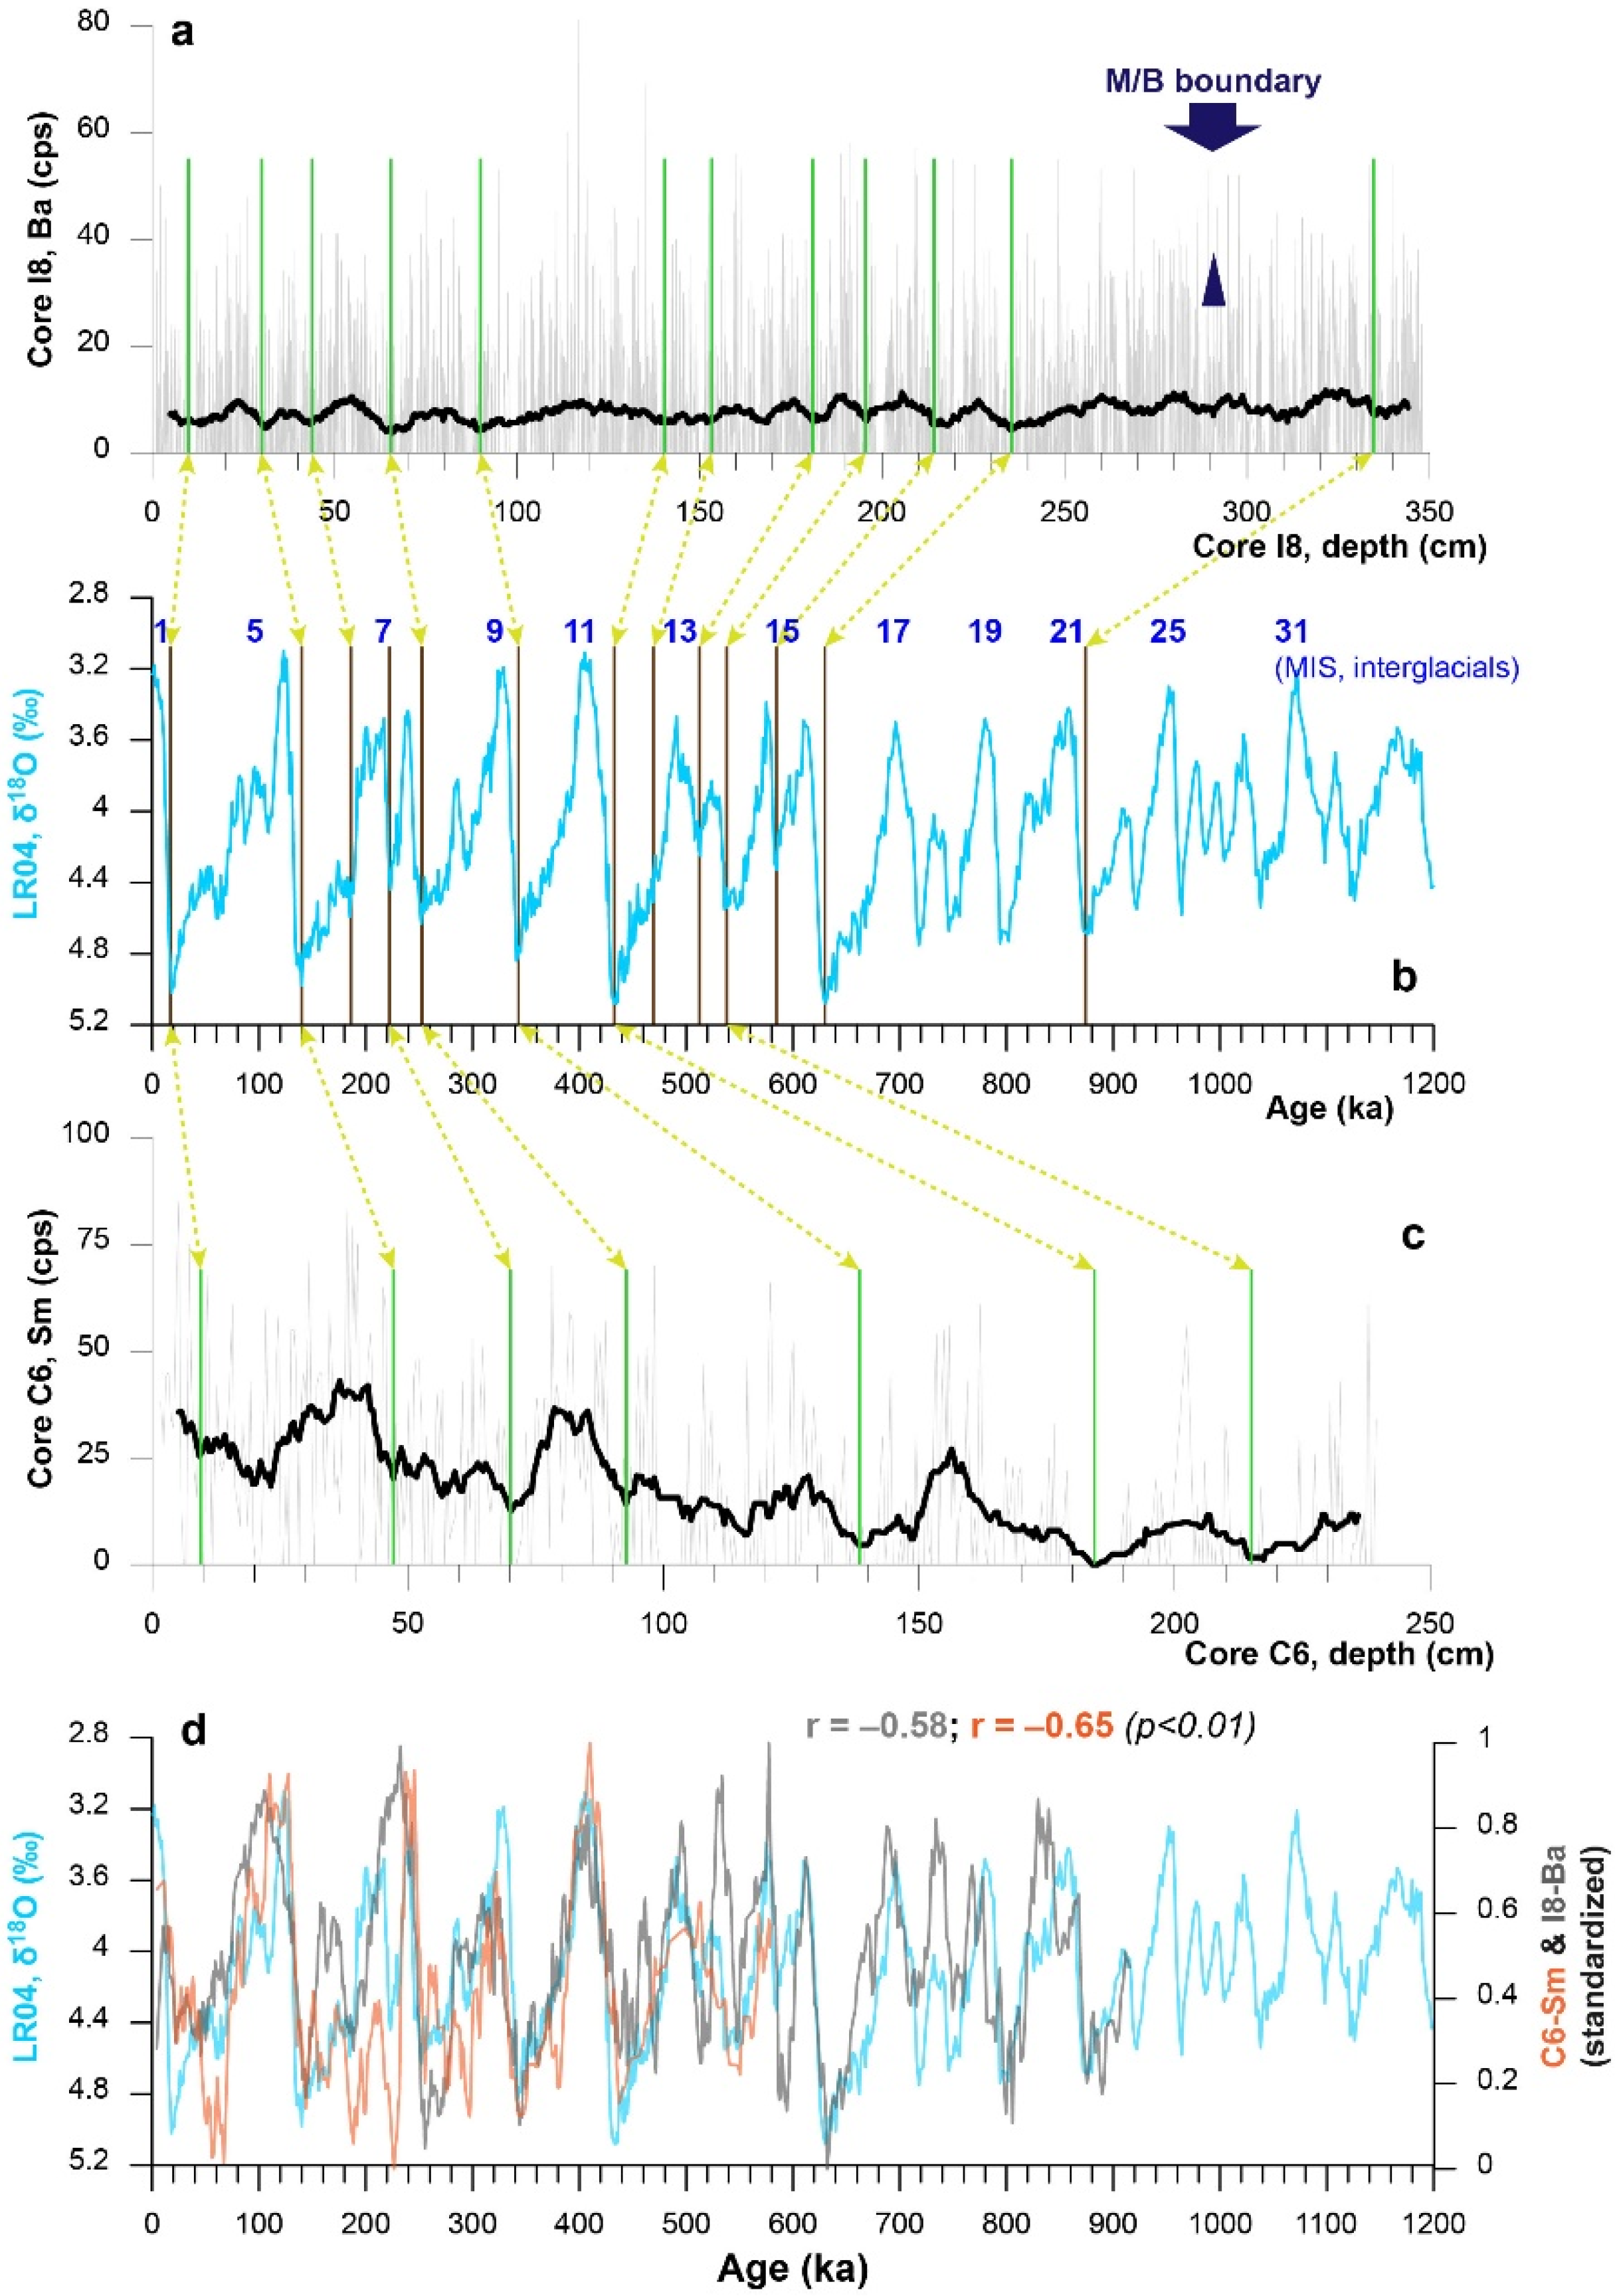
3.2. Tuning Element Contents

Based on the paleomagnetic results of the two studies cores, only one age control was identified, and for further paleoenvironmental inferences, the age model should be refined. As suggested in previous studies [29,33], high-resolution geochemical scanning can be applied to refine age models with paleomagnetic constraints.
Carbonate/calcium content is a traditional proxy in deep-sea sediments for tuning [34,35,36], and the element Ca usually reflects biogenic changes [33,37]. However, probably due to the study site (4440 m and 5405 m) being below the CCD (typically >4000 m in the Pacific) and the locality-specific enhancements of carbonate/calcium content in the sediments between interglacial and glacial alternations [38,39], there is no consistency (r = 0.03, p > 0.5) between Ca contents of the two studied cores and the Northern Hemisphere glaciation, as reflected by the stacked benthic δ18O record (LR04) [2].
We observed a similarity between the LR04 record [2] and changes in Sm (one of rare earth elements) of core C6 and Ba of core I8, thus offering an opportunity to refine the age of the two studied cores for paleoenvironmental inferences. Aeolian dust from the Chinese loess plateau is one of the main components of the sediments in the North Pacific [29,40,41,42], inferred from a similar pattern of rare earth elements. Although there is a debate that whether moisture or aridification induced aeolian dust in the western Pacific [43], this dust was dominated by the Northern Hemisphere glaciation [9,44]. The element Ba is an effective proxy for paleo-productivity changes [45,46], comparable to the biogenic processes of the element Ca. In the two studied cores, the cyclic variability of Sm and Ba intensities is evident and can be correlated with glacial–interglacial alternations (Figure 3). This correlation reflects an increase in marine productivities (Ba) and aeolian dust (Sm) during interglacial intervals, suggesting that the moisture could induce erosion in the Chinese loess plateau and, thus, aeolian transports to the western Pacific [47,48]. In addition, Ba values of core C6 and Sm values of core I8 have too many zeros (54% and 35%, respectively) and little consistency with the LR04 record; thus, they were not included in the subsequent analysis.
Ba intensity in core I8 (5.0–344.1 cm) and Sm intensity in core C6 (5.2–235.9 cm) were employed to refine the age models, taking the Matuyama/Brunhes boundary (773 ka) in core I8 as the tie point (Figure 3). As a result, the low-frequency variation in Sm and Ba intensities was strongly correlated with the LR04 record, inferring a consistent glacial–interglacial pattern over the past ~900 kyr. This correlation further provided several age points (Table 1) and yielded SARs of 4.5 ± 1.8 mm/kyr and 4.1 ± 1.5 mm/kyr for cores C6 and I8, respectively; these data are in close accordance with those of regional studies [29,33,49]. Based on the tuning model, excursion e1 in core C6 can be correlated with a magnetic interval (560–520 ka) with three magnetic excursions [50], including Calabrian Ridge 2 (525 ka), West Eifel 4 (555 ka), and Big Lost (580–560 ka). However, uncertainties in magnetostratigraphic correlations should be noted [29,30], and it is possible that the presented age models could be modified in future research.

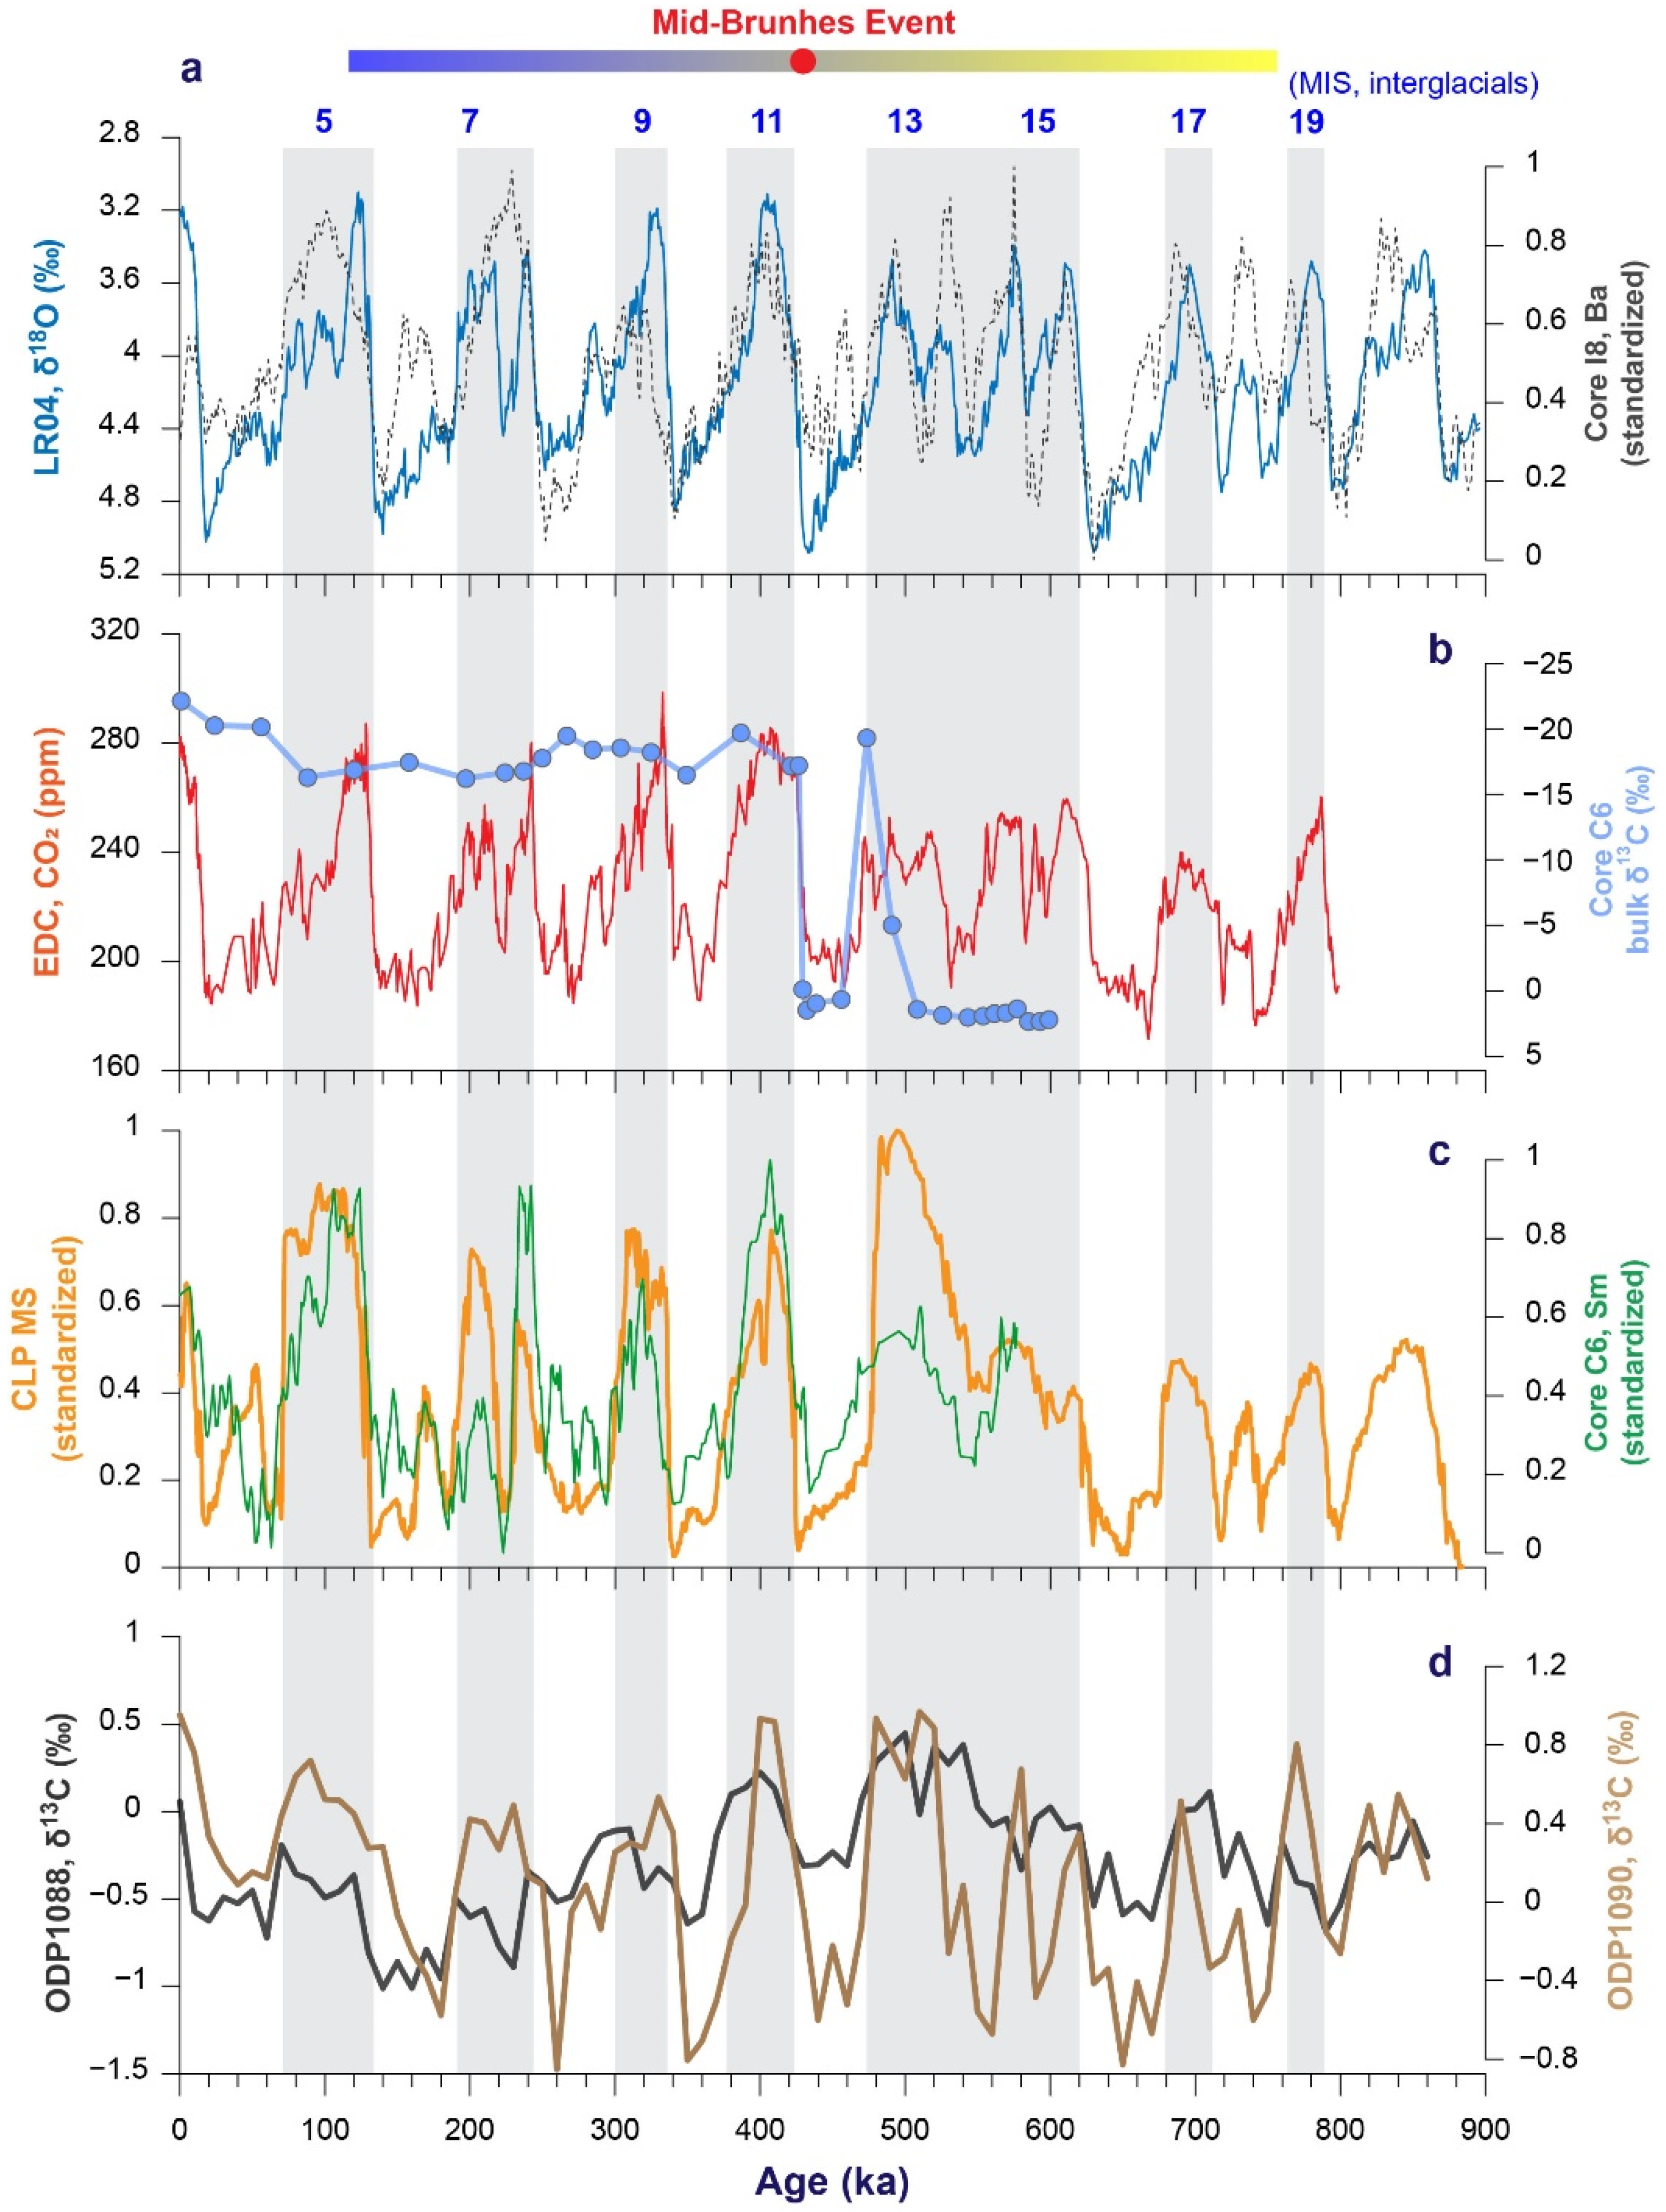
3.3. Carbonate Changes

Based on the refined age models, carbonate changes in the studied area over the past ~900 kyr were revealed as reflected by the scanned Ca intensity and bulk carbon δ13C record (Figure 4). For core C6, changes in Ca intensity can be divided into two groups: (1) ~580–420 ka, Ca intensity varied at a high level, agreeing well with the observed sedimentary properties, namely, chalky mud (Figure 4b); (2) since ~420 ka, Ca intensity dropped to a much lower level, about 10% of that prior to ~420 ka (Figure 4c). For the bulk carbon δ13C record of core C6, the variability is similar. Specifically, δ13C was 1.55 ± 0.69‰ prior to ~420 ka and −18.10 ± 1.66‰ thereafter (Figure 4d). For core I8, no abrupt changes were observed in Ca intensity; the values are about 1% of those in core C6 prior to ~420 ka (Figure 4a). Thus, integrating these observations, we can infer that there is a major transition of carbon cycling in the studied area at ~420 ka.

4. Discussion

The amplitude of glacial and interglacial alternations enlarged since ~430 ka (Figure 5a). During interglacial intervals after the so-called MBE, Antarctic temperatures have warmed [5], and atmospheric CO2 has substantially increased (Figure 5b) [6]. It is hotly debated whether the MBE is a multiple equilibrium [4,51] or a transition from one state to another, singly responding to external force [11,52]. Regardless, the corresponding mechanism involves CO2 storage in the deep ocean. The western Pacific might be one of the main regions to restore CO2 from the Southern Ocean [29,53,54] and possibly change the regional CCD.
Across the MBE, a major shift in the proxies of the two studied cores was observed (Figure 5). These records in the Philippine Sea exhibit similar glacial–interglacial alternations, indicating that both marine productivity and aeolian dust were intensified during interglaciations. These changes well correlated with changes in the LR04 record and bottom water, as suggested by the δ13C records at ODP Sites 1088 and 1090 (Figure 5d) [55]. However, for the MBE transition, the Sm record of core C6 displays evidence relative to proxy of the Asian monsoon (Figure 5c) [44], likely suggesting that aeolian dust in the deep ocean might be somehow reworked by bottom water.
This evidence confirms that the major transition recorded in cores C6 and I8 can be correlated with the MBE; most significant is the finding of chalky mud before the MBE at the shallower site (core C6; 4440 m water depth). The CCD was about 4650 m in the equatorial Pacific before the MEB [16], while it is currently observed at about 4000 m in modern studies [56]. Considering the chalky mud in core C6 and consistent sedimentation in the Philippine Sea [29,33,49,57], we propose that the CCD shoaling about 200–600 m occurred after the MBE in the study area (the depth difference between core C6 and CCD), while tectonic influences might be a minor factor that warrant further examination in the future.
Stable carbon isotopes are good indicators of carbon sources [58]; for example, the δ13C is about 1‰ in deep-sea carbonates and varies between –31‰ and –19‰ in marine organic carbon. The two ranges can be observed in the lower or the upper parts of core C6 (Figure 5b), implying that inorganic carbon deposits have been dissolved in the sediments since the MBE. Considering this implication, we explain changes in cores C6 and I8 observed in this study as follows: During interglacial intervals over the past ~900 kyr, high values of Ba recorded in core I8 may be associated with flourishing biota in the tropical Pacific, and high values of Sm recorded in core C6 likely resulted from the enhanced Asian monsoon. The increased transport of aeolian dust to the western Pacific might contribute to high marine productivity via biogeochemical processes [59,60,61]. After the MBE, the weaker AABW from a modelling perspective [11] and at ODP Site 1088 [55], the intensified Asian monsoon [44], and aeolian dust [47,48] may have significantly induced marine productivity [62]. These factors likely resulted in higher values of Ba and Sm during the warmer interglacial intervals. Moreover, the CCD in the Philippine Sea rose by about 200–600 m to the present level after the MBE, as reflected by the bulk carbon δ13C of core C6 (Figure 5b), inferring that deep-sea carbonates would have been dissolved. The CO2 outgassing from the deep ocean might contribute to the enlarged amplitude of atmospheric CO2 after the MBE, as observed in previous studies [6].
Therefore, we conclude that there is a consistent link the between Asian monsoon, aeolian dust, marine productivity, the CCD level, and carbon storage in the western Pacific during the middle and late Pleistocene.

5. Conclusions

By studying the geochronology and geochemical properties of sediments in the Philippine Sea, three well-dated paleoenvironmental records for the past ~900 kyr, namely, marine productivity, aeolian dusts, and the CCD level, were obtained, and they can be used to infer deep-sea paleoceanography processes in the study area. Our main findings are summarized as follows: (1) Using stepwise demagnetization, two and one magnetozones were observed in cores I8 and C6, respectively, recording the Brunhes and Matuyama chrons. (2) By taking the paleomagnetic constraints of core I8 and the tuning Ba and Sm intensities of cores I8 and C6, respectively, to global ice volume, the age-depth models of the two cores were refined, and the averaged sediment accumulation rate was estimated as ~4 mm/kyr. (3) Bulk carbon δ13C of core C6 was 1.55 ± 0.69‰ prior to ~420 ka and –18.10 ± 1.66‰ thereafter, correlating with inorganic and organic carbons, respectively. Based on these observations, we inferred a CCD shoaling about 200 m after the MBE, which likely contributed global carbon cycling during this key climate transition. Therefore, we propose that after the MBE, the enhanced aeolian dust and marine productivity that occurred during interglaciations coupled with CCD shoaling, and this coupling could have induced the dissolution of deep-sea carbonates and CO2 outgassing from the deep ocean, thus contributing to the MBE.

Author Contributions

Conceptualization and methodology, D.X. and L.Y.; sample collection, D.X.; formal analysis, L.Y., H.Y., D.X. and W.C.; original draft preparation, D.X. and L.Y. All authors have read and agreed to the published version of the manuscript.

Funding

This research was funded by National Key R&D Program of China, grant number 2018YFE0202401; National Programme on Global Change and Air-Sea Interaction, grant number GASI-04-HYDZ-02; and National Natural Science Foundation of China, grant number 42177422.

Institutional Review Board Statement

Not applicable.

Informed Consent Statement

Not applicable.

Data Availability Statement

Data are available on request from the corresponding author ([email protected]).

Acknowledgments

We thank Wang Fu, Tian Lizhu, and Jiang Xingyu at Tianjin Centre, China Geological Survey, for their help in magnetic measurements, and we thank all the onboard crew for collecting samples.

Conflicts of Interest

The authors declare no conflict of interest.

References

  1. Clark, P.U.; Alley, R.B.; Pollard, D. Northern Hemisphere Ice-Sheet Influences on Global Climate Change. Science 1999, 286, 1104–1111. [Google Scholar] [CrossRef]
  2. Lisiecki, L.E.; Raymo, M.E. A Pliocene-Pleistocene stack of 57 globally distributed benthic d18O records. Paleoceanography 2005, 20, PA1003. [Google Scholar] [CrossRef] [Green Version]
  3. Zachos, J.; Pagani, M.; Sloan, L.; Thomas, E.; Billups, K. Trends, Rhythms, and Aberrations in Global Climate 65 Ma to Present. Science 2001, 292, 686–693. [Google Scholar] [CrossRef]
  4. Jansen, J.H.F.; Kuijpers, A.; Troelstra, S.R. A Mid-Brunhes Climatic Event: Long-Term Changes in Global Atmosphere and Ocean Circulation. Science 1986, 232, 619–622. [Google Scholar] [CrossRef]
  5. Jouzel, J.; Massondelmotte, V.; Cattani, O.; Dreyfus, G.; Falourd, S.; Hoffmann, G.; Minster, B.; Nouet, J.; Barnola, J.M.; Chappellaz, J. Orbital and Millennial Antarctic Climate Variability over the Past 800,000 Years. Science 2007, 317, 793–796. [Google Scholar] [CrossRef] [Green Version]
  6. Lüthi, D.; Le Floch, M.; Bereiter, B.; Blunier, T.; Barnola, J.-M.; Siegenthaler, U.; Raynaud, D.; Jouzel, J.; Fischer, H.; Kawamura, K.; et al. High-resolution carbon dioxide concentration record 650,000–800,000 years before present. Nature 2008, 453, 379–382. [Google Scholar] [CrossRef]
  7. Loulergue, L.; Schilt, A.; Spahni, R.; Massondelmotte, V.; Blunier, T.; Lemieux, B.; Barnola, J.M.; Raynaud, D.; Stocker, T.F.; Chappellaz, J. Orbital and millennial-scale features of atmospheric CH4 over the past 800,000 years. Nature 2008, 453, 383–386. [Google Scholar] [CrossRef] [Green Version]
  8. Cheng, H.; Edwards, R.L.; Sinha, A.; Spötl, C.; Yi, L.; Chen, S.; Kelly, M.; Kathayat, G.; Wang, X.; Li, X.; et al. The Asian monsoon over the past 640,000 years and ice age terminations. Nature 2016, 534, 640–646. [Google Scholar] [CrossRef]
  9. Sun, Y.; Clemens, S.C.; An, Z.; Yu, Z. Astronomical timescale and palaeoclimatic implication of stacked 3.6-Myr monsoon records from the Chinese Loess Plateau. Quat. Sci. Rev. 2006, 25, 33–48. [Google Scholar] [CrossRef]
  10. Kemp, A.E.S.; Grigorov, I.; Pearce, R.B.; Naveira Garabato, A.C. Migration of the Antarctic Polar Front through the mid-Pleistocene transition: Evidence and climatic implications. Quat. Sci. Rev. 2010, 29, 1993–2009. [Google Scholar] [CrossRef] [Green Version]
  11. Yin, Q. Insolation-induced mid-Brunhes transition in Southern Ocean ventilation and deep-ocean temperature. Nature 2013, 494, 222–225. [Google Scholar] [CrossRef] [PubMed]
  12. Past Interglacials Working Group of Pages. Interglacials of the last 800,000 years. Rev. Geophys. 2016, 54, 162–219. [Google Scholar] [CrossRef] [Green Version]
  13. Barth, A.M.; Clark, P.U.; Bill, N.S.; He, F.; Pisias, N.G. Climate evolution across the Mid-Brunhes Transition. Clim. Past 2018, 14, 2071–2087. [Google Scholar] [CrossRef] [Green Version]
  14. Brook, E.J.; Buizert, C. Antarctic and global climate history viewed from ice cores. Nature 2018, 558, 200–208. [Google Scholar] [CrossRef]
  15. Woosley, R.J. Carbonate Compensation Depth. In Encyclopedia of Geochemistry: A Comprehensive Reference Source on the Chemistry of the Earth; White, W.M., Ed.; Springer International Publishing: Cham, Switzerland, 2018; pp. 204–205. [Google Scholar]
  16. Pälike, H.; Lyle, M.W.; Nishi, H.; Raffi, I.; Ridgwell, A.; Gamage, K.; Klaus, A.; Acton, G.; Anderson, L.; Backman, J.; et al. A Cenozoic record of the equatorial Pacific carbonate compensation depth. Nature 2012, 488, 609. [Google Scholar] [CrossRef]
  17. Lyle, M. Neogene carbonate burial in the Pacific Ocean. Paleoceanography 2003, 18, 1059. [Google Scholar] [CrossRef]
  18. Greene, S.E.; Ridgwell, A.; Kirtland Turner, S.; Schmidt, D.N.; Pälike, H.; Thomas, E.; Greene, L.K.; Hoogakker, B.A.A. Early Cenozoic Decoupling of Climate and Carbonate Compensation Depth Trends. Paleoceanogr. Paleoclimatol. 2019, PA003601. [Google Scholar] [CrossRef] [Green Version]
  19. Coxall, H.K.; Wilson, P.A.; Pälike, H.; Lear, C.H.; Backman, J. Rapid stepwise onset of Antarctic glaciation and deeper calcite compensation in the Pacific Ocean. Nature 2005, 433, 53–57. [Google Scholar] [CrossRef]
  20. Merico, A.; Tyrrell, T.; Wilson, P.A. Eocene/Oligocene ocean de-acidification linked to Antarctic glaciation by sea-level fall. Nature 2008, 452, 979–982. [Google Scholar] [CrossRef]
  21. Kawabe, M.; Fujio, S. Pacific ocean circulation based on observation. J. Oceanogr. 2010, 66, 389–403. [Google Scholar] [CrossRef]
  22. Zhai, F.; Gu, Y. Abyssal Circulation in the Philippine Sea. J. Ocean Univ. China 2020, 19, 249–262. [Google Scholar] [CrossRef]
  23. Kirschvink, J.L. The least-squares line and plane and the analysis of palaeomagnetic data. Geophys. J. R. Astron. Soc. 1980, 62, 699–718. [Google Scholar] [CrossRef]
  24. Lurcock, P.C.; Wilson, G.S. PuffinPlot: A versatile, user-friendly program for paleomagnetic analysis. Geochem. Geophys. Geosyst. 2012, 13, Q06Z45. [Google Scholar] [CrossRef] [Green Version]
  25. Calvert, S.E.; Pedersen, T.F. Chapter Fourteen Elemental Proxies for Palaeoclimatic and Palaeoceanographic Variability in Marine Sediments: Interpretation and Application. In Developments in Marine Geology; Hillaire–Marcel, C., De Vernal, A., Eds.; Elsevier: Amsterdam, The Netherlands, 2007; Volume 1, pp. 567–644. [Google Scholar]
  26. Haug, G.H.; Hughen, K.A.; Sigman, D.M.; Peterson, L.C.; Röhl, U. Southward Migration of the Intertropical Convergence Zone Through the Holocene. Science 2001, 293, 1304–1308. [Google Scholar] [CrossRef] [PubMed]
  27. Yao, Z.; Liu, Y.; Shi, X.; Suk, B.-C. Paleoenvironmental changes in the East/Japan Sea during the last 48 ka: Indications from high-resolution X-ray fluorescence core scanning. J. Quat. Sci. 2012, 27, 932–940. [Google Scholar] [CrossRef]
  28. Croudace, I.W.; Rothwell, R.G. Micro-XRF Studies of Sediment Cores: Applications of a Non-Destructive Tool for the Environmental Sciences; Springer: Dordrecht, The Netherlands, 2015; Volume 17, p. 668. [Google Scholar]
  29. Yi, L.; Xu, D.; Jiang, X.; Ma, X.; Ge, Q.; Deng, X.; Wang, H.; Deng, C. Magnetostratigraphy and Authigenic 10Be/9Be Dating of Plio-Pleistocene Abyssal Surficial Sediments on the Southern Slope of Mariana Trench and Sedimentary Processes During the Mid-Pleistocene Transition. J. Geophys. Res. Ocean. 2020, 125, e2020JC016250. [Google Scholar] [CrossRef]
  30. Yi, L.; Hu, B.; Zhao, J.; Jiang, X.; Shu, Y.; Wang, X.; Guo, J.; Wang, F.; Ding, X.; Liu, G.; et al. Magnetostratigraphy of Abyssal Deposits in the Central Philippine Sea and Regional Sedimentary Dynamics During the Quaternary. Paleoceanogr. Paleoclimatol. 2022, 37, e2021PA004365. [Google Scholar] [CrossRef]
  31. Gibbard, P.L.; Head, M.J. Chapter 30—The Quaternary Period. In Geologic Time Scale 2020; Gradstein, F.M., Ogg, J.G., Schmitz, M.D., Ogg, G.M., Eds.; Elsevier: Amsterdam, The Netherlands, 2020; pp. 1217–1255. [Google Scholar]
  32. He, F.; Wei, Y.; Maffei, S.; Livermore, P.W.; Davies, C.J.; Mound, J.; Xu, K.; Cai, S.; Zhu, R. Equatorial auroral records reveal dynamics of the paleo-West Pacific geomagnetic anomaly. Proc. Natl. Acad. Sci. USA 2021, 118, e2026080118. [Google Scholar] [CrossRef]
  33. Yi, L.; Wang, H.; Deng, X.; Yuan, H.; Xu, D.; Yao, H. Geochronology and Geochemical Properties of Mid-Pleistocene Sediments on the Caiwei Guyot in the Northwest Pacific Imply a Surface-to-Deep Linkage. J. Mar. Sci. Eng. 2021, 9, 253. [Google Scholar] [CrossRef]
  34. Jakob, K.A.; Pross, J.; Scholz, C.; Fiebig, J.; Friedrich, O. Thermocline state change in the eastern equatorial Pacific during the late Pliocene/early Pleistocene intensification of Northern Hemisphere glaciation. Clim. Past 2018, 14, 1079–1095. [Google Scholar] [CrossRef] [Green Version]
  35. Farrell, J.W.; Prell, W.L. Climatic change and CaCO3 preservation: An 800,000 year bathymetric Reconstruction from the central equatorial Pacific Ocean. Paleoceanography 1989, 4, 447–466. [Google Scholar] [CrossRef]
  36. Bickert, T.; Henrich, R. Chapter 12—Climate Records of Deep-Sea Sediments: Towards the Cenozoic Ice House. In Developments in Sedimentology; HüNeke, H., Mulder, T., Eds.; Elsevier: Amsterdam, The Netherlands, 2011; Volume 63, pp. 793–823. [Google Scholar]
  37. Murray, R.W.; Leinen, M. Chemical transport to the seafloor of the equatorial Pacific Ocean across a latitudinal transect at 135°W: Tracking sedimentary major, trace, and rare earth element fluxes at the Equator and the Intertropical Convergence Zone. Geochim. Cosmochim. Acta 1993, 57, 4141–4163. [Google Scholar] [CrossRef]
  38. Qin, B.; Li, T.; Xiong, Z.; Algeo, T.J.; Jia, Q. Deep-Water Carbonate Ion Concentrations in the Western Tropical Pacific Since the Mid-Pleistocene: A Major Perturbation During the Mid-Brunhes. J. Geophys. Res. Ocean. 2018, 123, 6876–6892. [Google Scholar] [CrossRef]
  39. Anderson, R.F.; Fleisher, M.Q.; Lao, Y.; Winckler, G. Modern CaCO3 preservation in equatorial Pacific sediments in the context of late-Pleistocene glacial cycles. Mar. Chem. 2008, 111, 30–46. [Google Scholar] [CrossRef]
  40. Xu, Z.; Li, T.; Clift, P.D.; Lim, D.; Wan, S.; Chen, H.; Tang, Z.; Jiang, F.; Xiong, Z. Quantitative estimates of Asian dust input to the western Philippine Sea in the mid-late Quaternary and its potential significance for paleoenvironment. Geochem. Geophys. Geosyst. 2015, 16, 3182–3196. [Google Scholar] [CrossRef] [Green Version]
  41. Wang, F.; He, G.; Wang, H.; Ren, J. Geochemistry of rare earth elements in a core from Mariana Trench and its significance. Mar. Geol. Quat. Geol. 2016, 36, 67–75. [Google Scholar]
  42. Deng, Y.; Ren, J.; Guo, Q.; Cao, J.; Wang, H.; Liu, C. Rare earth element geochemistry characteristics of seawater and porewater from deep sea in western Pacific. Sci. Rep. 2017, 7, 16539. [Google Scholar] [CrossRef] [Green Version]
  43. Zhang, Q.; Liu, Q.; Roberts, A.P.; Larrasoaña, J.C.; Shi, X.; Jin, C. Mechanism for enhanced eolian dust flux recorded in North Pacific Ocean sediments since 4.0 Ma: Aridity or humidity at dust source areas in the Asian interior? Geology 2020, 48, 77–81. [Google Scholar] [CrossRef]
  44. Hao, Q.; Wang, L.; Oldfield, F.; Peng, S.; Qin, L.; Song, Y.; Xu, B.; Qiao, Y.; Bloemendal, J.; Guo, Z. Delayed build-up of Arctic ice sheets during 400,000-year minima in insolation variability. Nature 2012, 490, 393–396. [Google Scholar] [CrossRef]
  45. Dymond, J.; Suess, E.; Lyle, M. Barium in Deep-Sea Sediment: A Geochemical Proxy for Paleoproductivity. Paleoceanography 1992, 7, 163–181. [Google Scholar] [CrossRef] [Green Version]
  46. Paytan, A.; Kastner, M. Benthic Ba fluxes in the central Equatorial Pacific, implications for the oceanic Ba cycle. Earth Planet. Sci. Lett. 1996, 142, 439–450. [Google Scholar] [CrossRef]
  47. Nie, J.; Pullen, A.; Garzione, C.N.; Peng, W.; Wang, Z. Pre-Quaternary decoupling between Asian aridification and high dust accumulation rates. Sci. Adv. 2018, 4, eaao6977. [Google Scholar] [CrossRef] [PubMed] [Green Version]
  48. Nie, J.; Stevens, T.; Rittner, M.; Stockli, D.; Garzanti, E.; Limonta, M.; Bird, A.; Andò, S.; Vermeesch, P.; Saylor, J.; et al. Loess Plateau storage of Northeastern Tibetan Plateau-derived Yellow River sediment. Nat. Commun. 2015, 6, 8511. [Google Scholar] [CrossRef] [PubMed] [Green Version]
  49. Yao, H.; Wang, F.; Wang, H.; Yu, M.; Ren, J.-b.; He, G.; Chen, W.; Yi, L. Pleistocene magnetostratigraphy of four cores in the West Philippian Basin and regional sedimentary shift during the Mid-Pleistocene Transition. Geol. J. 2021, 56, 2919–2929. [Google Scholar] [CrossRef]
  50. Roberts, A.P. Geomagnetic excursions: Knowns and unknowns. Geophys. Res. Lett. 2008, 35. [Google Scholar] [CrossRef] [Green Version]
  51. Paillard, D. The timing of Pleistocene glaciations from a simple multiple-state climate model. Nature 1998, 391, 378–381. [Google Scholar] [CrossRef]
  52. Tzedakis, P.C.; Crucifix, M.; Mitsui, T.; Wolff, E.W. A simple rule to determine which insolation cycles lead to interglacials. Nature 2017, 542, 427. [Google Scholar] [CrossRef] [Green Version]
  53. Ford, H.L.; Raymo, M.E. Regional and global signals in seawater δ18O records across the mid-Pleistocene transition. Geology 2020, 48, 113–117. [Google Scholar] [CrossRef] [Green Version]
  54. Hönisch, B.; Hemming, N.G.; Archer, D.; Siddall, M.; McManus, J.F. Atmospheric Carbon Dioxide Concentration Across the Mid-Pleistocene Transition. Science 2009, 324, 1551–1554. [Google Scholar] [CrossRef]
  55. Hodell, D.A.; Venz-Curtis, K.A. Late Neogene history of deepwater ventilation in the Southern Ocean. Geochem. Geophys. Geosyst. 2006, 7, Q09001. [Google Scholar] [CrossRef]
  56. Zhang, H.; Che, H.; Xia, J.; Cheng, Q.; Qi, D.; Cao, J.; Luo, Y. Sedimentary CaCO3 Accumulation in the Deep West Pacific Ocean. Front. Earth Sci. 2022, 10, 857260. [Google Scholar] [CrossRef]
  57. Hu, B.; Yi, L.; Zhao, J.; Guo, W.; Ding, X.; Wang, F.; Chen, W. Magnetostratigraphy of core XT06 and Quaternary sedimentary dynamics of the deep-sea deposits in the West Philippine Basin. Mar. Geol. Quat. Geol. 2021, 41, 61–74. [Google Scholar]
  58. Mackensen, A.; Schmiedl, G. Stable carbon isotopes in paleoceanography: Atmosphere, oceans, and sediments. Earth-Sci. Rev. 2019, 197, 102893. [Google Scholar] [CrossRef]
  59. Martin, J.H. Glacial-interglacial CO2 change: The Iron Hypothesis. Paleoceanography 1990, 5, 1–13. [Google Scholar] [CrossRef]
  60. Coale, K.H.; Johnson, K.S.; Fitzwater, S.E.; Gordon, R.M.; Tanner, S.; Chavez, F.P.; Ferioli, L.; Sakamoto, C.; Rogers, P.; Millero, F.; et al. A massive phytoplankton bloom induced by an ecosystem-scale iron fertilization experiment in the equatorial Pacific Ocean. Nature 1996, 383, 495–501. [Google Scholar] [CrossRef]
  61. Watson, A.J.; Bakker, D.C.E.; Ridgwell, A.J.; Boyd, P.W.; Law, C.S. Effect of iron supply on Southern Ocean CO2 uptake and implications for glacial atmospheric CO2. Nature 2000, 407, 730–733. [Google Scholar] [CrossRef]
  62. Yi, L.; Wang, H.; Liu, G.; Chen, Y.; Yao, H.; Deng, X. Magnetic minerals in Mid-Pleistocene sediments on the Caiwei Guyot, Northwest Pacific and their response to the Mid-Brunhes climate event. Acta Oceanol. Sin. 2021, 40, 1–11. [Google Scholar] [CrossRef]
Figure 1. Schematic map showing the study area and oceanographic setting. All the flows were modified from previous studies [21,22]. The base map data were generated using the open, free software DIVA–GIS 7.5 (http://www.diva-gis.org/, accessed on 10 September 2021).
Jmse 10 00745 g001
Figure 2. Magnetostratigraphy of cores C6 and I8. (a) Photo of core C6; (b,c) ChRM declination and inclination of core C6, respectively; (d) polarity of core C6; (e) photo of core I8; (f,g) ChRM declination and inclination of core I8, respectively; (h) polarity of core I8; (i) geological polarity timescale (GPT2020) [31]. B, Brunhes chron; M, Matuyama chron; J, Jaramillo subchron; M/B, the Matuyama/Brunhes boundary (0.773 ka).
Jmse 10 00745 g002
Figure 3. Tuning element intensities to LR04 δ18O record. (a) Ba record with 81-point moving average of core I8 on depth scale; (b) Benthic δ18O stack LR04 [2]; (c) Sm record with 15-point moving average of core C6 on depth scale; thin lines, original records; bold lines, the moving average. (d) Comparison between element intensities of the two studied cores and LR04 records on glacial–interglacial timescales. The arrows between (ac) represent the correlations, and these data are listed in Table 1.
Jmse 10 00745 g003
Figure 4. Changes in deep-sea carbon record. (a) Ca record of core I8; (b,c) Ca record of core C6; (d) bulk carbon δ13C record of core C6.
Jmse 10 00745 g004
Figure 5. Comparison of various environmental proxies. (a) Benthic δ18O stack LR04 [2] versus the element Ba of core I8; MIS, marine isotope stages, which are labelled as numbers 5–19 on the top; (b) EPICA Dome C ice core CO2 [6] versus the bulk carbon δ13C of core C6; (c) stack magnetic susceptibility (MS) of Chinese Loess Plateau (CLP) [44], versus the element Sm of core C6; (d) Benthic δ13C records of ODP Sites 1088 and 1090, indicating changes in Circumpolar Deep Water [55].
Jmse 10 00745 g005
Table 1. Age models of the two studied cores.
No.Core C6Core I8
Depth (cm)Age (ka)SAR (mm/kyr)Depth (cm)Age (ka)SAR (mm/kyr)
19.2185.07.9184.4
247.21403.131.11401.9
370.22232.843.41852.7
492.72527.864.12523.1
5138.93415.289.93412.9
6184.74344.9138.04345.2
7217.45482.9168.34747.5
8 181.25133.3
9 195.75385.8
10 214.15853.9
11 235.46304.7
12 338.28743.1
Publisher’s Note: MDPI stays neutral with regard to jurisdictional claims in published maps and institutional affiliations.

