Article

Analysis of the Characteristics of Pore Pressure Coefficient for Two Different Hydrate-Bearing Sediments under Triaxial Shear

1
Institute of Marine Science and Technology, Shandong University, Qingdao 266232, China
2
Laboratory for Marine Mineral Resources, Qingdao National Laboratory for Marine Science and Technology, Qingdao 266237, China
3
The Key Laboratory of Geological Safety of Coastal Urban Underground Space, Ministry of Natural Resources, Shandong University, Qingdao 266232, China
4
The Key Laboratory of Gas Hydrate, Ministry of Natural Resources, Qingdao Institute of Marine Geology, Qingdao 266237, China
*
Authors to whom correspondence should be addressed.
J. Mar. Sci. Eng. 2022, 10(4), 509; https://doi.org/10.3390/jmse10040509
Submission received: 25 February 2022 / Revised: 31 March 2022 / Accepted: 4 April 2022 / Published: 6 April 2022

Abstract

:
It is important to determine the volumetric change properties of hydrate reservoirs in the process of exploitation. The Skempton pore pressure coefficient A can characterize the process of volume change of hydrate-bearing sediments under undrained conditions during shearing. However, the interrelationship between A value responses and deformation behaviors remain elusive. In this study, effects of hydrate saturation and effective confining pressure on the characteristics of pore pressure coefficient A are explored systematically based on published triaxial undrained compression test data of hydrate-bearing sand and clay-silt sediments. Results show that there is a higher value of the coefficient A with increasing hydrate saturation at small strain stage during shearing. This effect becomes more obvious when the effective confining pressure increases for hydrate-bearing sand sediments rather than hydrate-bearing clayey-silt sediments. An increasing hydrate saturation leads to a reduction in A values at failure. Although A values at failure of sand sediments increase with increasing effective confining pressure, there are no same monotonic effects on clayey-silt specimens. A values of hydrate-bearing sand sediments firstly go beyond 1/3 and then become lower than 1/3 at failure even lower than 0, while that of hydrate-bearing clayey-silt sediments is always larger than 1/3 when the effective confining pressure is high (e.g., >1 MPa). However, when the effective confining pressure is small (e.g., 100 kPa), that behaves similar to hydrate-bearing sand sediments but always bigger than 0. How the A value changes with hydrate saturation and effective confining pressure is inherently controlled by the alternation of effective mean stress.

1. Introduction

Natural gas hydrates have drawn an increasing interest in recent years as a potential energy source due to the wide distribution and vast reserve around the world [1]. Depressurization based methods are generally accepted for natural gas extraction from hydrate reservoirs [2,3]. During the extraction, hydrate dissociation will reduce the stability of wellbore and its surrounding reservoirs due to excess pore pressure generation which would reduce the effective stress [4,5]. In order to ensure the mechanical stability of the reservoir during the exploitation, it is important to determine various mechanical properties of hydrate-bearing sediments [6]. Examples include permeability coefficients, strength parameters, and volumetric change behaviors. A series of geotechnical tests have been carried out, and the results show that geomechanical properties (i.e., shear strength, stiffness and dilatancy) of hydrate-bearing sediments are largely controlled by the hydrate saturation and hydrate pore habits, such as pore-filling, load-bearing, and cementation [7,8]. Based on these basic understandings, different geomechanical constitutive models have been developed to predict the mechanical response of hydrate-bearing sediments during numerical simulations of hydrate production [9,10].
Deformation of marine deposits is inherently dependent on the effective stress applied to the skeleton. However, it is difficult to directly measure the effective stress in the field, and indirect determination based on the response of pore pressure within deposits is widely used. Increasing pore pressure indicates dilation of sediments, while decreasing pore pressure indicates contrary of sediments. Both dilation and contrary are key volumetric behaviors regarding to the stability of submarine engineering facilities [11]. Especially, deformation induced by consolidation along with excess pore pressure dissipation will become much more obvious under the condition of long-term productions (i.e., commercial production) [12]. Volumetric behaviors of hydrate-bearing sediments are commonly characterized by using volumetric strains (i.e., dilatancy rate D used in drained triaxial compression tests [13]). However, volumetric strains cannot be measured during undrained shear tests in the laboratory since the total volume of saturated samples is regard as constant. In addition, volumetric strains are also difficult to obtain in practical engineering due to the lack of proper facilities and technologies [14,15]. Hence, an easy-to-use method is needed to characterize the process of volume change of hydrate-bearing sediments during hydrate production.
Pore pressure coefficients A and B defined by Skempton [16] are widely used to estimate the pore pressure response resulting from total stress changes. Coefficient A depicts the pore pressure growth during the application of a deviator stress, and coefficient B describes the pore pressure growth induced by the application of a confining pressure [17,18]. These two pore pressure coefficients can be used to determine the effective stress according to the principle of effective stress [19]. Moreover, the coefficient A can also be used to directly quantify the consolidation volumetric response in classical Terzaghi’s problem of hydrate-bearing sediments [20,21] and determine the in-situ undrained shear strength [22]. If a saturated sample behaves as an elastic and isotropic material, A value equals to 1/3 invariably. However, coefficient A is not a constant, and it depends on the change in effective stress paths associated with the deformation behavior during shearing [18]. In addition, A value greater than 1/3 refers to contractive deformations, while A value less than 1/3 represents dilative deformations [23,24]. Thus, coefficient A could describe the process of volumetric response related to changes in the stress state, which plays an important role in assessing the long-term potential risks and evaluating the mechanical response of hydrate-bearing sediments reservoirs under undrained conditions during natural gas production.
To the best of our knowledge, only few studies involved pore pressure coefficients of hydrate-bearing sediments till now. Yun et al. [25] used the pore pressure coefficient A at failure to determine the maximum shear stress of specimens in a triaxial compression test. On the other hand, many studies have focused on the pore pressure response of sediments through the undrained triaxial compression tests [26,27]. The pore pressure response on methane hydrate-bearing sand sediments is different from silty sediments during undrained tests in which sand sediments exhibited a negative pore pressure response, while the silty sediments had a positive response representing that the pore pressure response during shear is predominantly carried by the host sediment grain size [28,29]. Ghiassian and Grozic [30] presented that the pore pressure response of the hydrate-bearing samples is influenced by effective confining pressure and hydrate saturation. Therefore, the effects of hydrate saturation and effective confining pressure are expected to be critical to understanding the A value response in two different host sediments. However, systematic studies with respect to the relationship between the characteristics of coefficient A response and deformation behavior of hydrate-bearing sediments remain insufficient.
This paper mainly aims to investigate the interrelationship between the characteristics of pore pressure coefficient A and the process of volume change in hydrate-bearing sediments. Published triaxial undrained test data are used to calculate the pore pressure coefficient A of two different hydrate-bearing sediments [27,31]. Effects of the hydrate saturation and the effective confining pressure on the A value response are explored systematically. Differences in the A value response between hydrate-bearing sandy and clayey-silt sediments are analyzed. The results have a potential to support the analysis of the deformation characteristics of hydrate-bearing sediments under undrained conditions and the calibration of constitutive models used in simulating the pore pressure response generated by total stress boundaries (i.e., classical Terzaghi’s problem [20]).

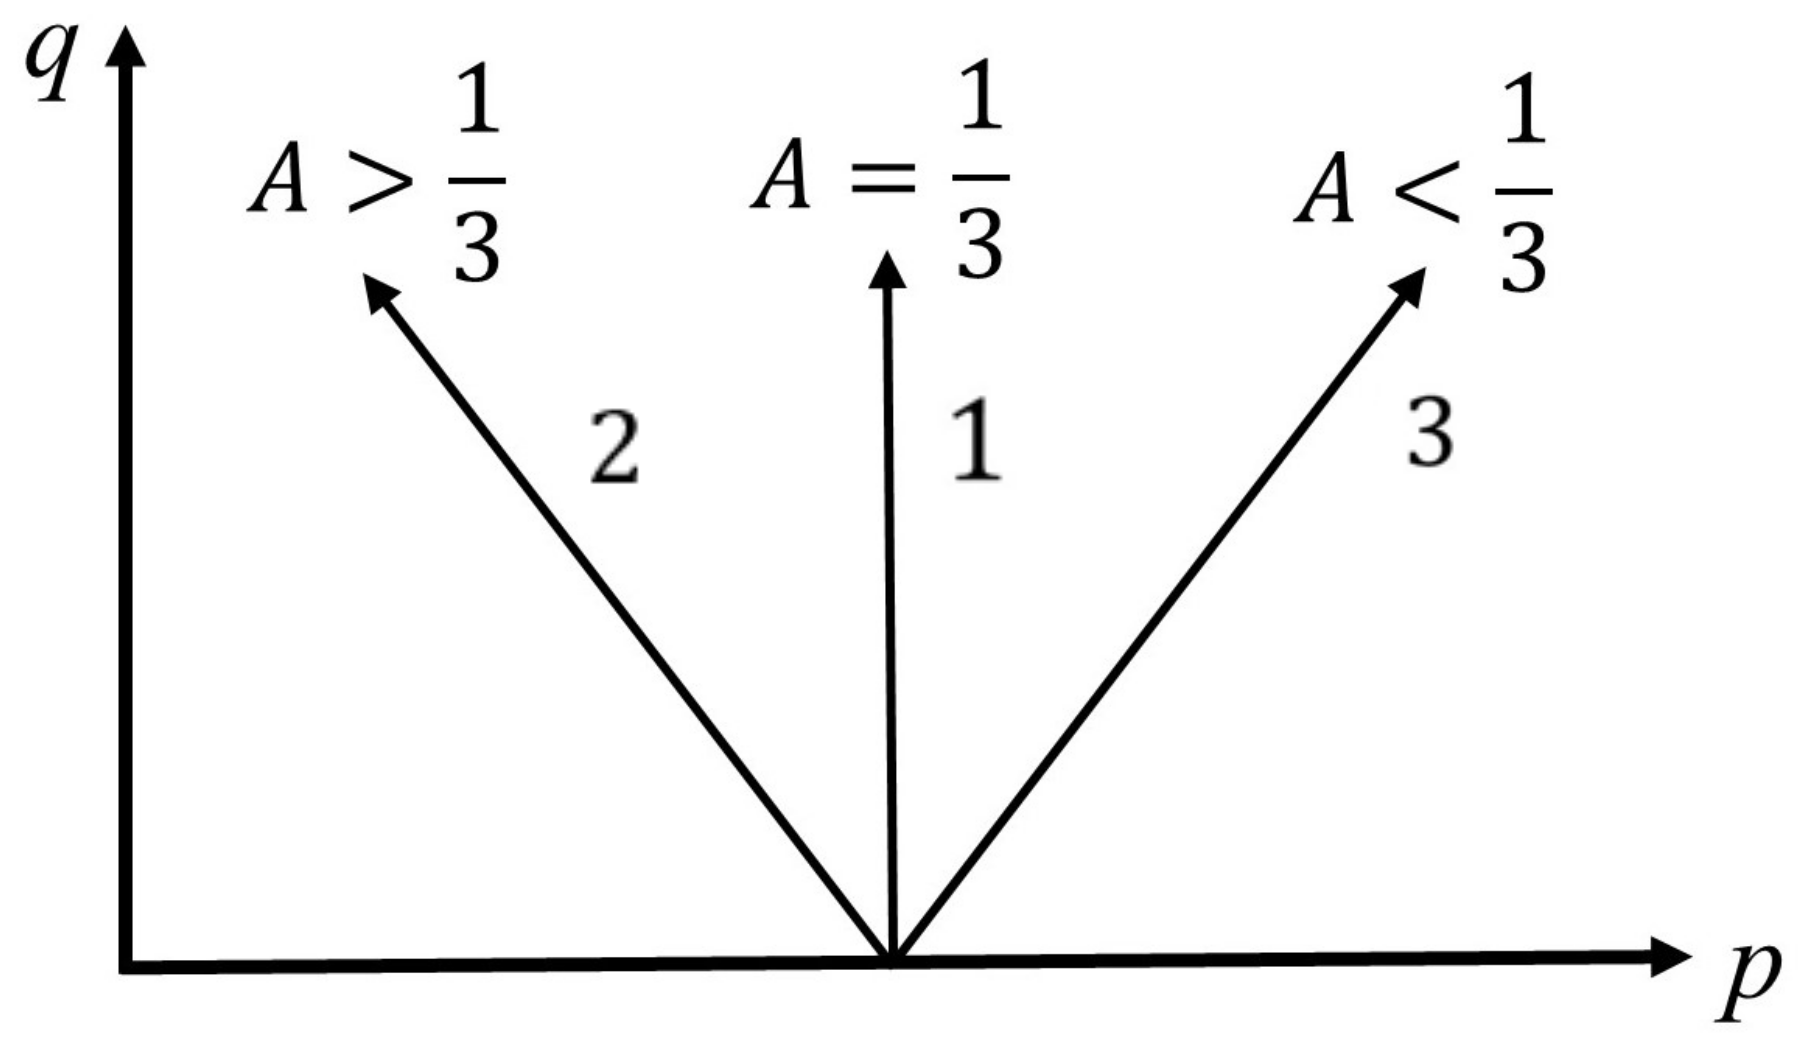
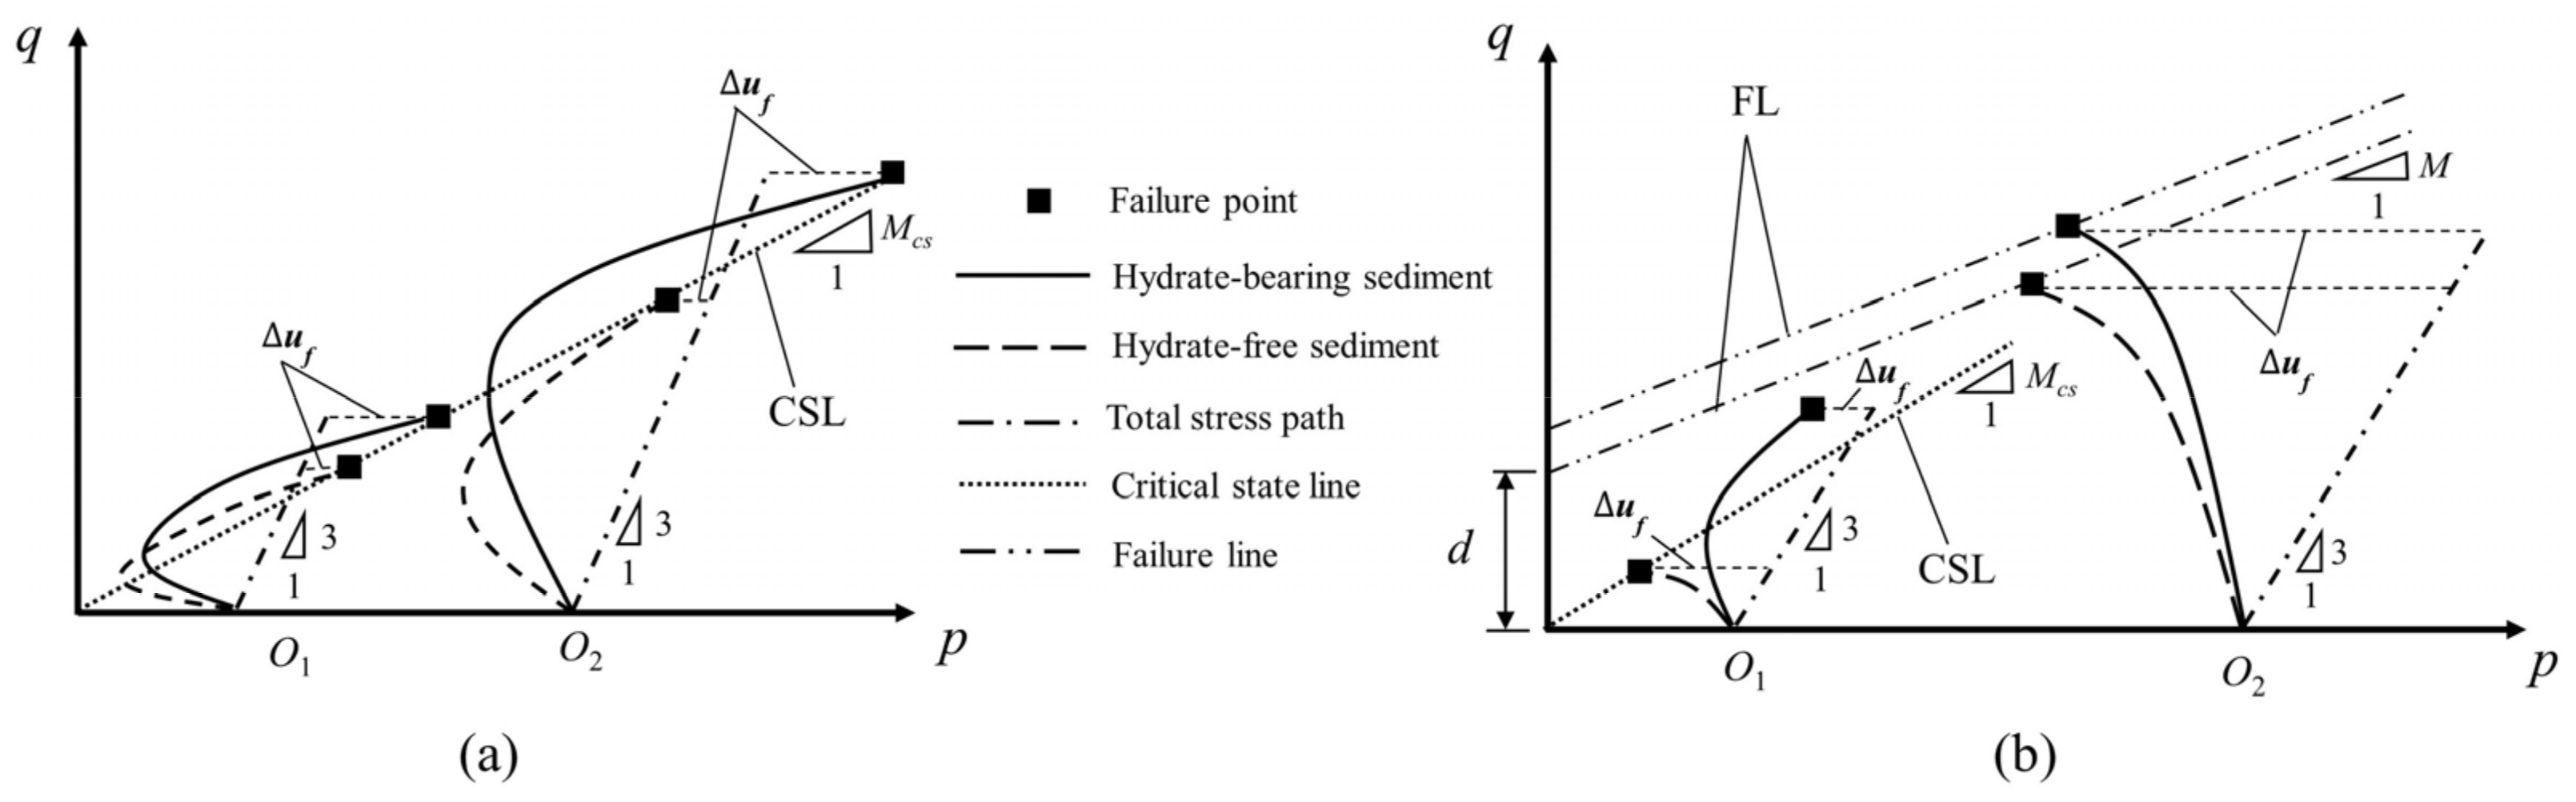
2. Pore Pressure Coefficients

Skempton [16] gives the definition of the change in pore pressure Δ u as a result of a change in total stress using pore pressure coefficients A and B by the Equation (1):
Δ u   =   B Δ σ 3   +   A Δ σ 1     Δ σ 3
where Δ σ 1 and Δ σ 3 are increments of major and minor total principal stresses, respectively.
The pore pressure coefficient B is defined as Equation (2):
B   =   Δ u Δ σ 3
For saturated soils, where B 1 , the Equation (1) can be written as Equation (3):
A   =   Δ u Δ σ 1     σ 3
The A value at failure A f is defined as Equation (4):
A f   =   Δ u f Δ σ 1     σ 3 f
Equations (3) and (4) are defined as a secant type coefficient where is difference from initial value, and a tangent type can be defined as Equation (5):
A   =   d u d σ 1     σ 3
where d indicates an infinitesimal increase at a point. In this paper, A refers to a secant type in accordance with a state from an initial value to a final value, while A corresponds to a tangent type reflecting an instantaneous change tendency at a point, and all the mentioned pore pressure coefficient is the secant type unless otherwise stated.
In a triaxial test ( σ 2   =   σ 3 ), p and q are the mean effective stress and the deviatoric stress, respectively, where p   =   σ 1   +   2 σ 3 / 3 , q   =   σ 1     σ 3 and the stress ratio η   =   q / p . Thus, if B 1 is accepted, the Equation (1) can be rewritten as Equation (6) in terms of the effective stress principle ( Δ p   =   Δ p     Δ u ):
Δ u   =   Δ p   +   A 1 3 Δ q
the first term on the right side of the equation reflects the change in pore pressure induced by Δ p and the second term caused by Δ q . According to Equation (6), if a saturated soil behaves as an elastic, isotropic material, the pore pressure coefficient A is equal to 1/3 revealing that Δ u is only accordance in Δ p rather than Δ q , however, Δ u actually depends on the different stress states leading to the coefficient A being not a constant [32]. To further explain the relationship between A values and the stress state, the Equation (6) can be rearranged to Equation (7):
A   =   1 3     Δ p Δ q
the change in A value is associated with the sign of Δ p in which Δ q is assumed to increase monotonically during loading applied. Figure 1 shows the direction of different A values in q p plane. As shown in Figure 1, if the Δ p is negative, the A value will develop towards greater than 1/3 while a positive Δ p is linked to a tendency towards less than 1/3. Moreover, the change in Δ p can be characterized by effective stress path which represents the process of deformation behavior of soils during shearing in q     p plane. The pore pressure coefficient A is thus considered to be relative to the volume change in hydrate-bearing sediments. In this paper, the main research objective is to investigate the interrelationship between the pore pressure coefficient A response and the process of volumetric change in hydrate-bearing sediments both associated with changes in p , and further discussion is carried out in the following sections.

3. Experiment

Iwai et al. [31] and Wang et al. [27] have conducted a series of undrained triaxial compression tests on synthetized CO2 hydrate-bearing sand specimens and methane hydrate-bearing clayey-silt specimens, respectively. The selected experimental data simulated the typical in-situ submarine hydrate deposit conditions in which the target deposit is at a depth of 100–300 m beneath the seabed surface and both presented the detailed test results involving the response in excess pore pressure related to corresponding deviatoric stress. These previous data are reused to calculate the pore pressure coefficient A through Equation (3) and further analyze the A values response in hydrate-bearing sediments. The Failure of specimens is defined as maximum deviatoric stress attained or the deviatoric stress at 15% axial strain, whichever is obtained first during a test. Table 1 lists the detailed test conditions and results, and more details of testing apparatus and procedures have been presented by Iwai et al. [31] and Wang et al. [27]. Note that the experimental data of CO2 hydrate-bearing sand specimens at P 0   =   2   MPa with S h ranged from 27.8% to 56.9% are not used to compare with that of clayey-silt specimens which lacked corresponding hydrate saturations.
Admittedly, CO2 hydrate is more difficult to be destructed in sediments during the shear process resulting in a slightly higher stiffness and shear strength as well as a smaller volumetric deformation which will lead to a relatively small value of coefficient A compared to methane hydrate-bearing sediments. However, effects of hydrate saturation and effective confining pressure on CO2 hydrate bearing sediments are similar to that on methane hydrate-bearing sediments [33].

4. Results

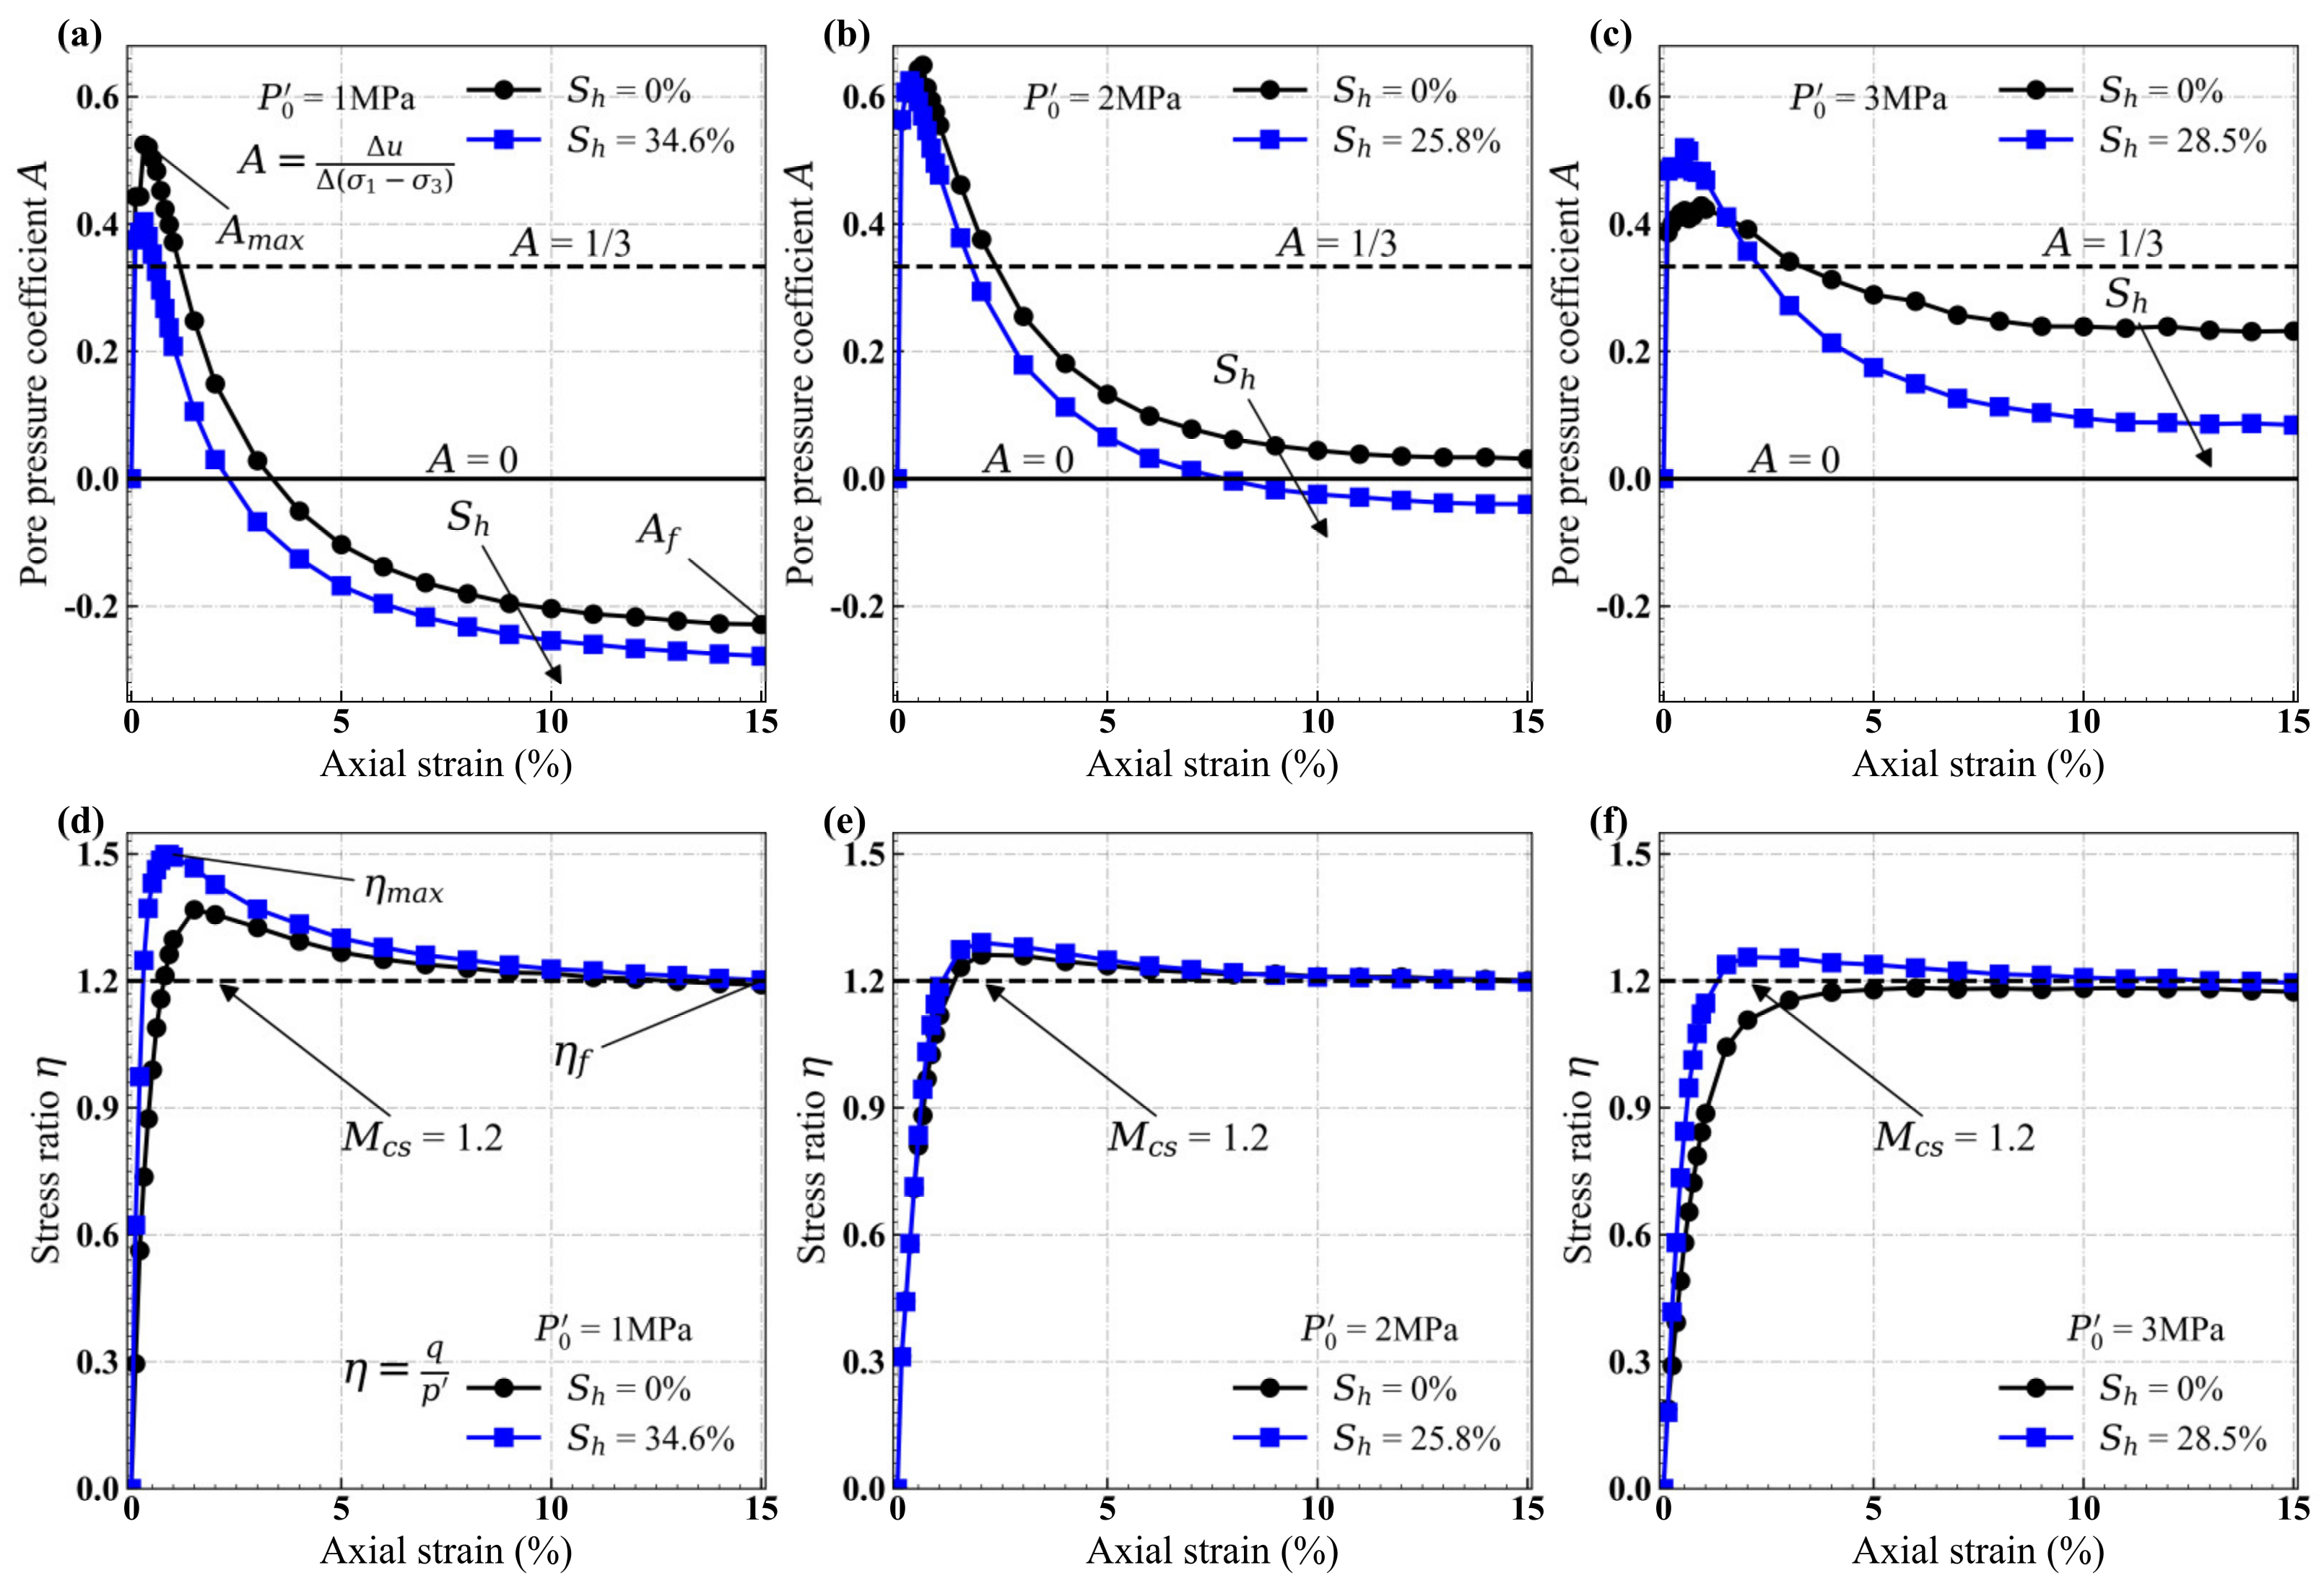
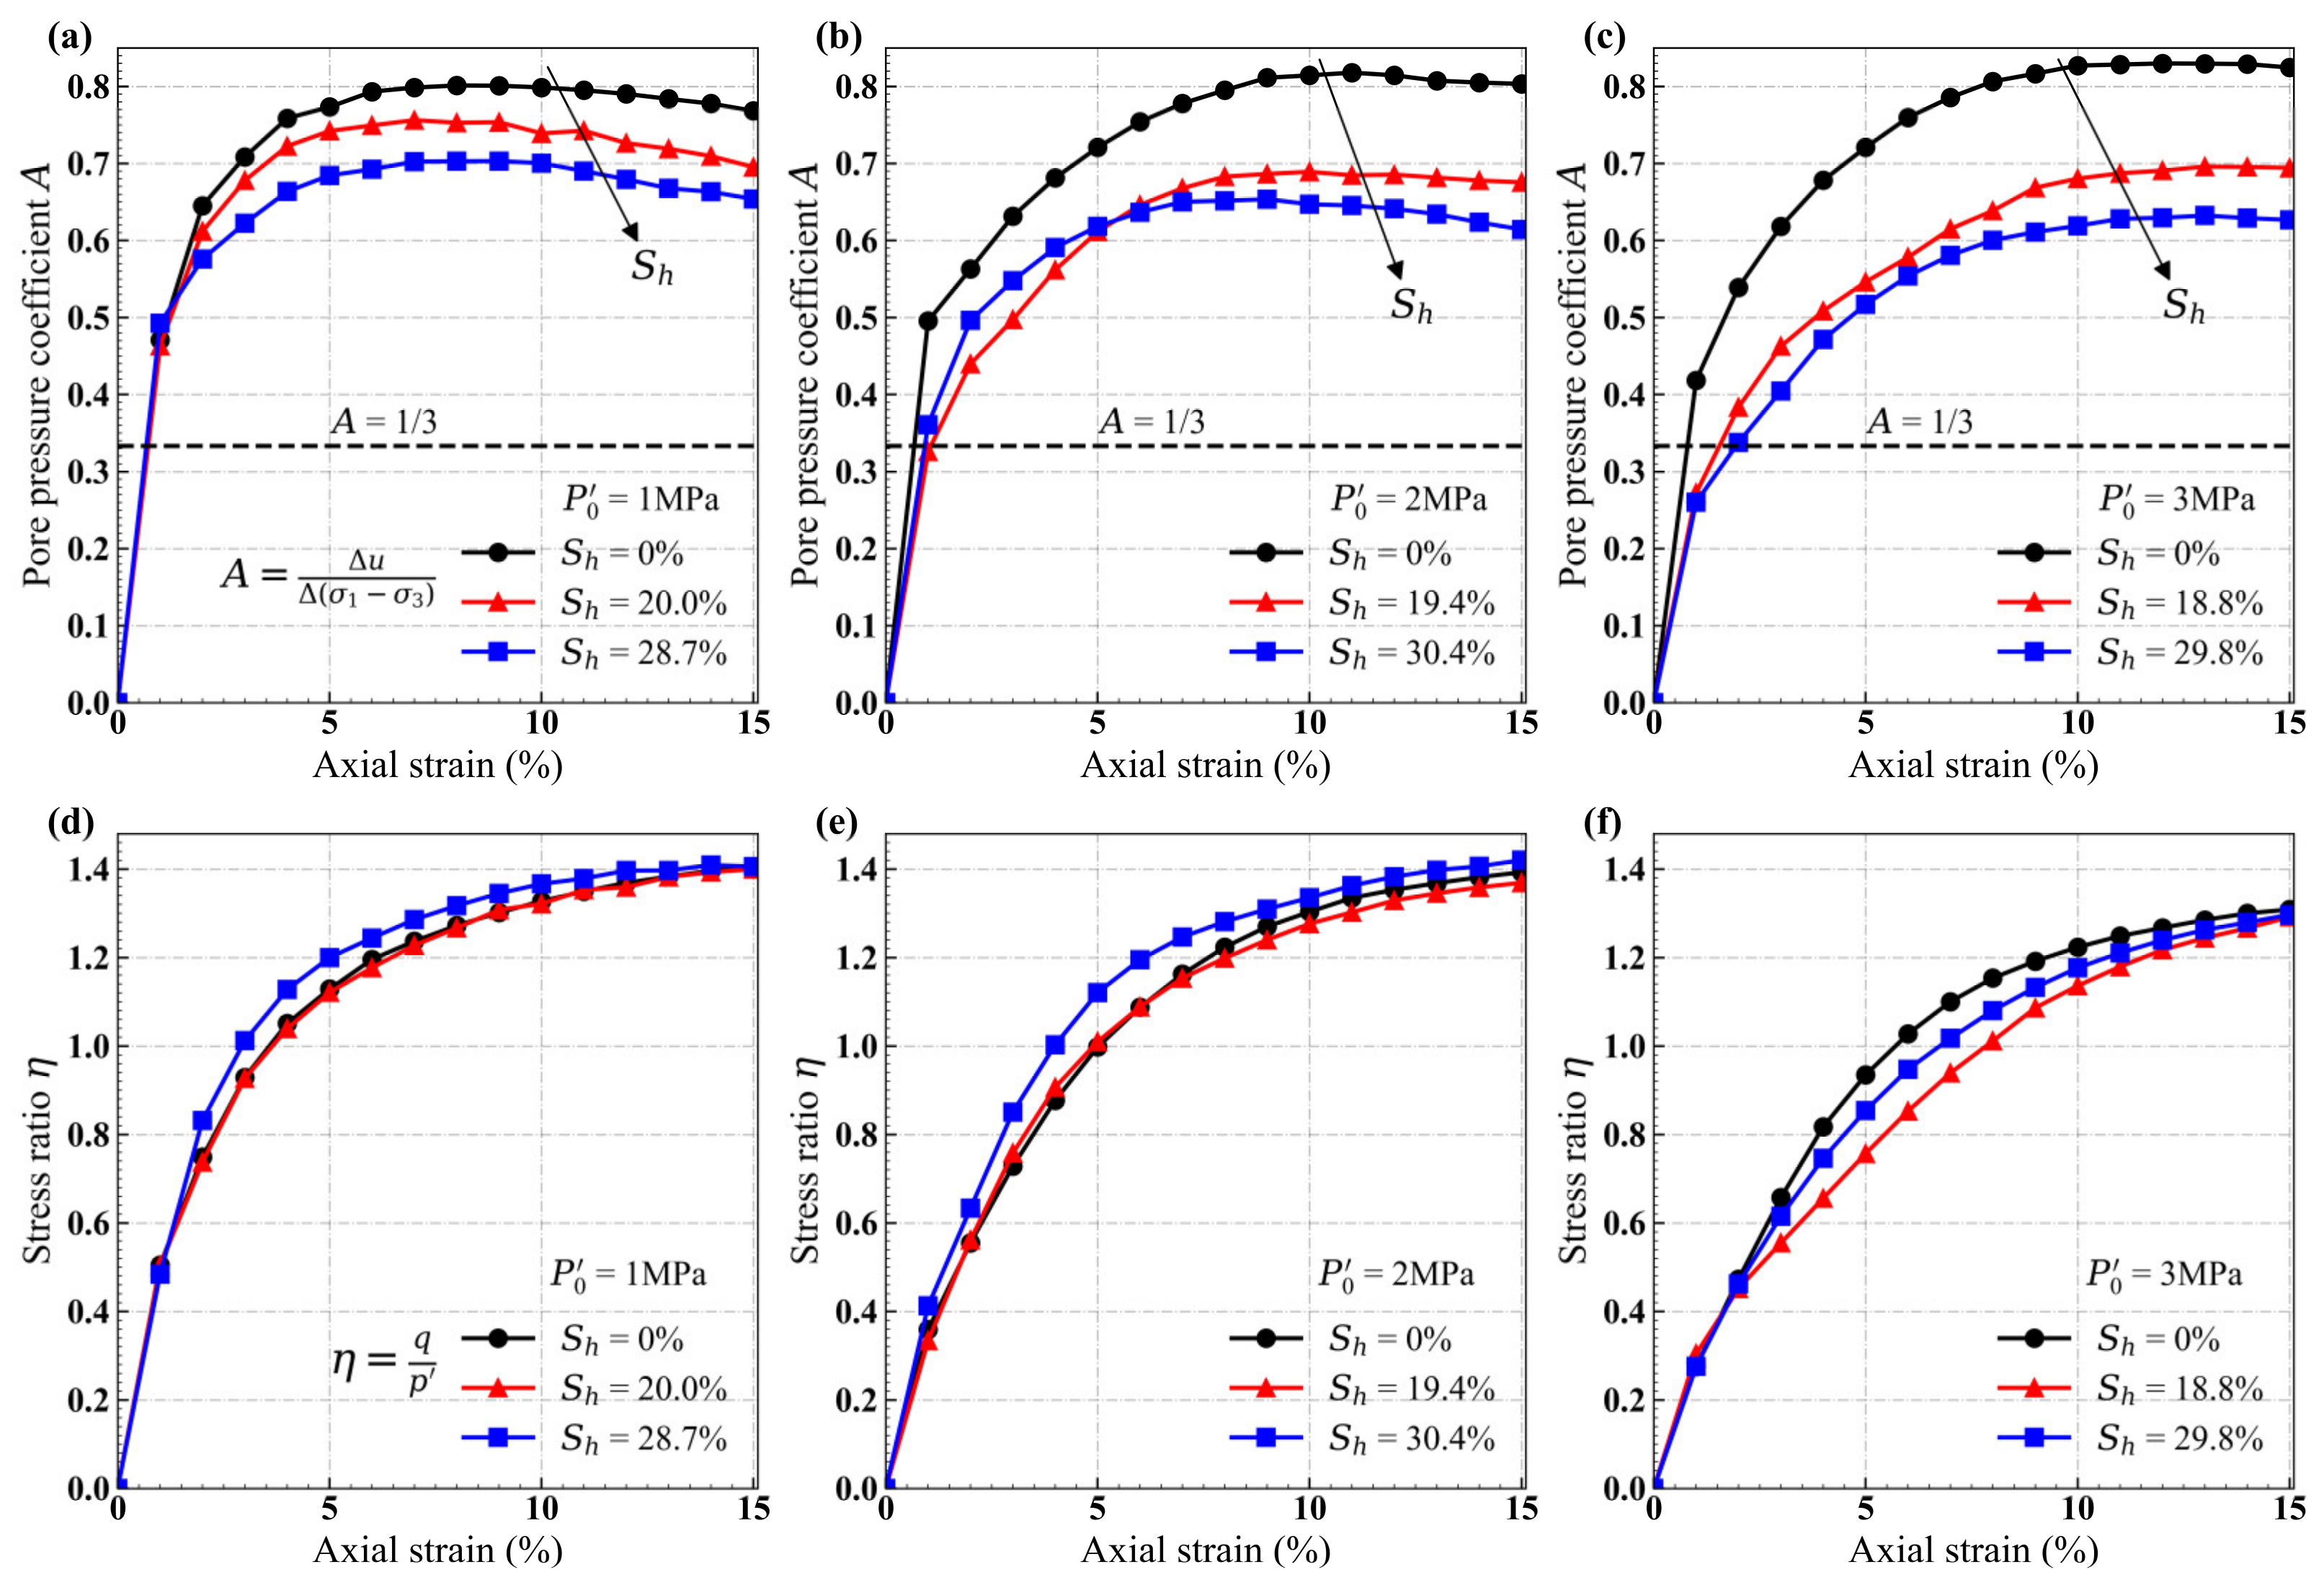
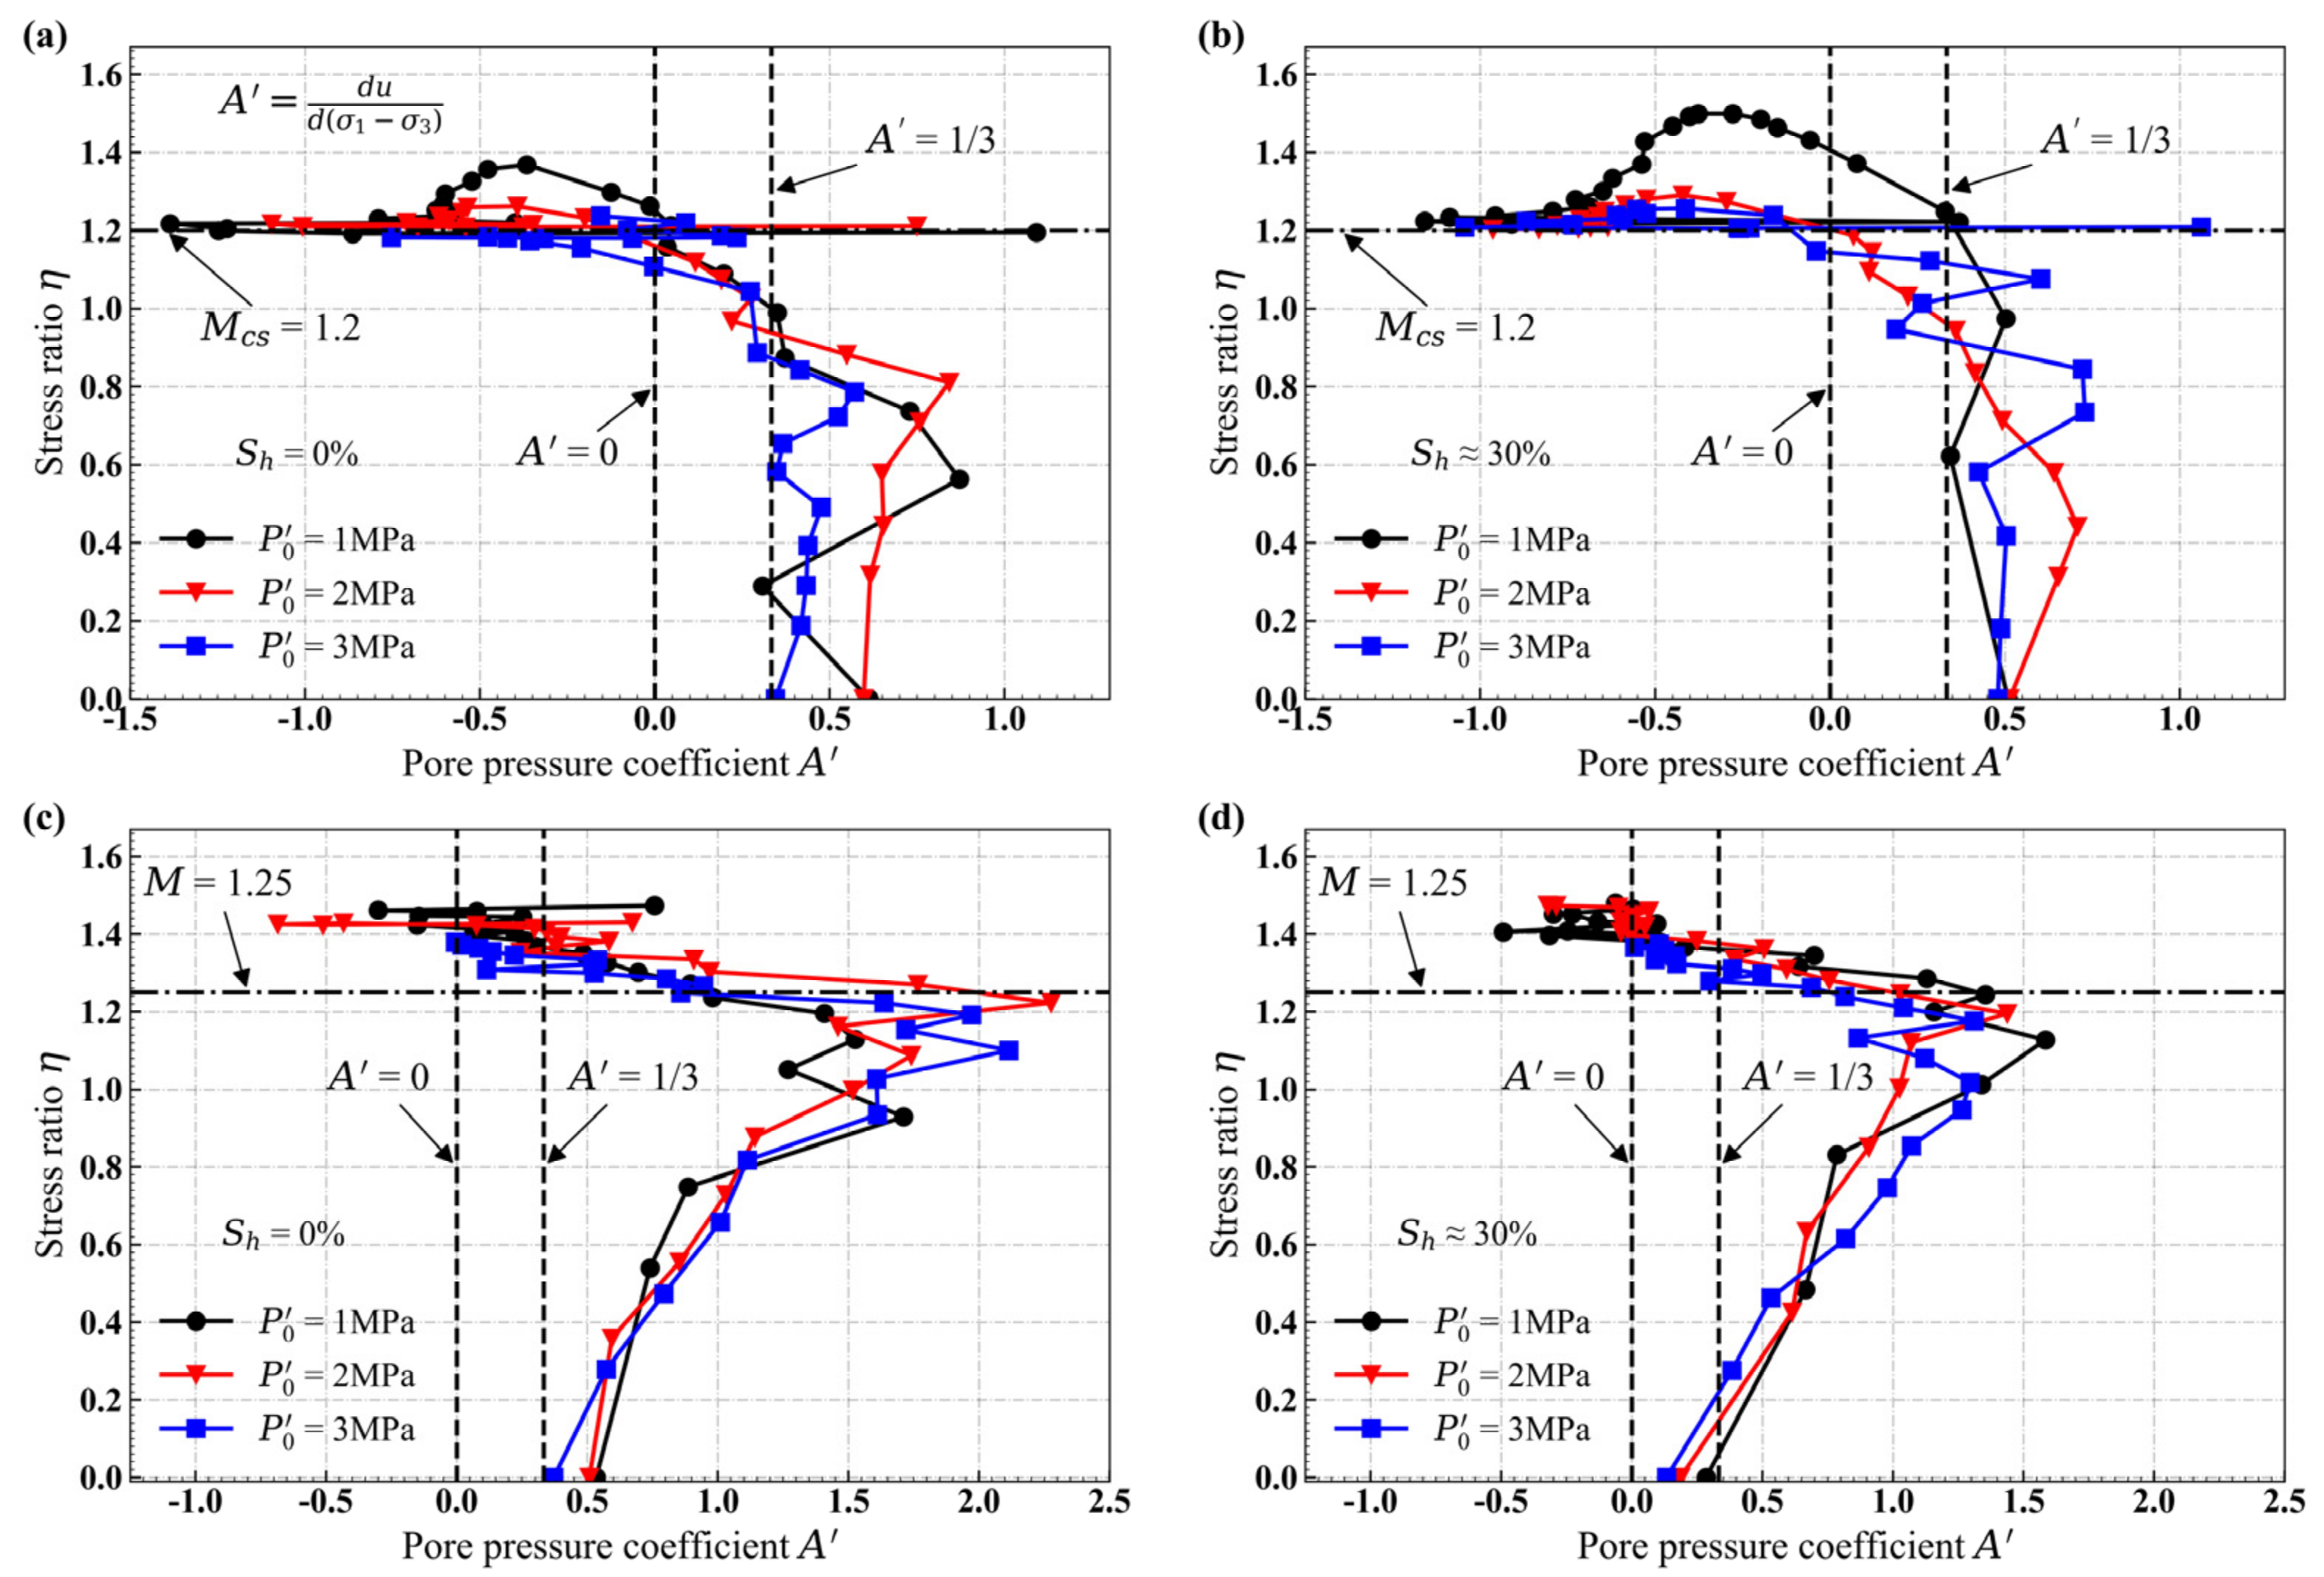
4.1. Effect of Hydrate Saturation

The effect of hydrate saturation on A value and stress ratio η of sand sediments under different effective confining pressures are shown in Figure 2. In Figure 2a,b, A values of hydrate-bearing sand specimens are always less than that of hydrate-free, while in Figure 2c, the curve of hydrate-bearing specimens exceeds that of hydrate-free only at small strain stage which will be further discussed in Section 5.1. All the A f values with hydrate are lower than that without hydrate. It is obviously observed that the A f value changes positive (0.03) to negative (−0.04) at P 0   =   2 MPa . As shown in Figure 2d–f, the stress ratio η with hydrate is greater than that without hydrate, however, all the stress ratios at failure η f reach the same critical state stress ratio M c s . Moreover, η with hydrate exhibits an apparent strain-softening behavior compared with hydrate-free. Especially at P 0   =   3 MPa , the η with S h   =   0 % constantly increases to M c s , but that of specimen with S h   =   28.5 % reaches to the maximum stress ratio η m a x and drops to M c s .
The effect of hydrate saturation on A value and stress ratio η of clayey-silt sediments under different effective confining pressures are shown in Figure 3. As shown in Figure 3a–c, A values increase as the strain increases and remain unchanged or decreases slightly until failure in which A f is approximately equal to A m a x . The A f values decrease with increasing hydrate saturation, such as the A f values are 0.8, 0.67 and 0.61 with hydrate saturation of 0%, 19.4% and 30.4%, respectively at P 0   =   2 MPa . As shown in Figure 3d–f, the η shows strain-hardening behavior, which is almost the same at failure regardless of hydrate saturations.
The A f values of sand and clayey-silt sediments decrease with the increasing hydrate saturation as result of the existence of hydrate enhancing both the stiffness and the dilatancy behavior of host sediments leading to the failure deviatoric stress q f increasing and the failure pore pressure u f decreasing during undrained tests [34].

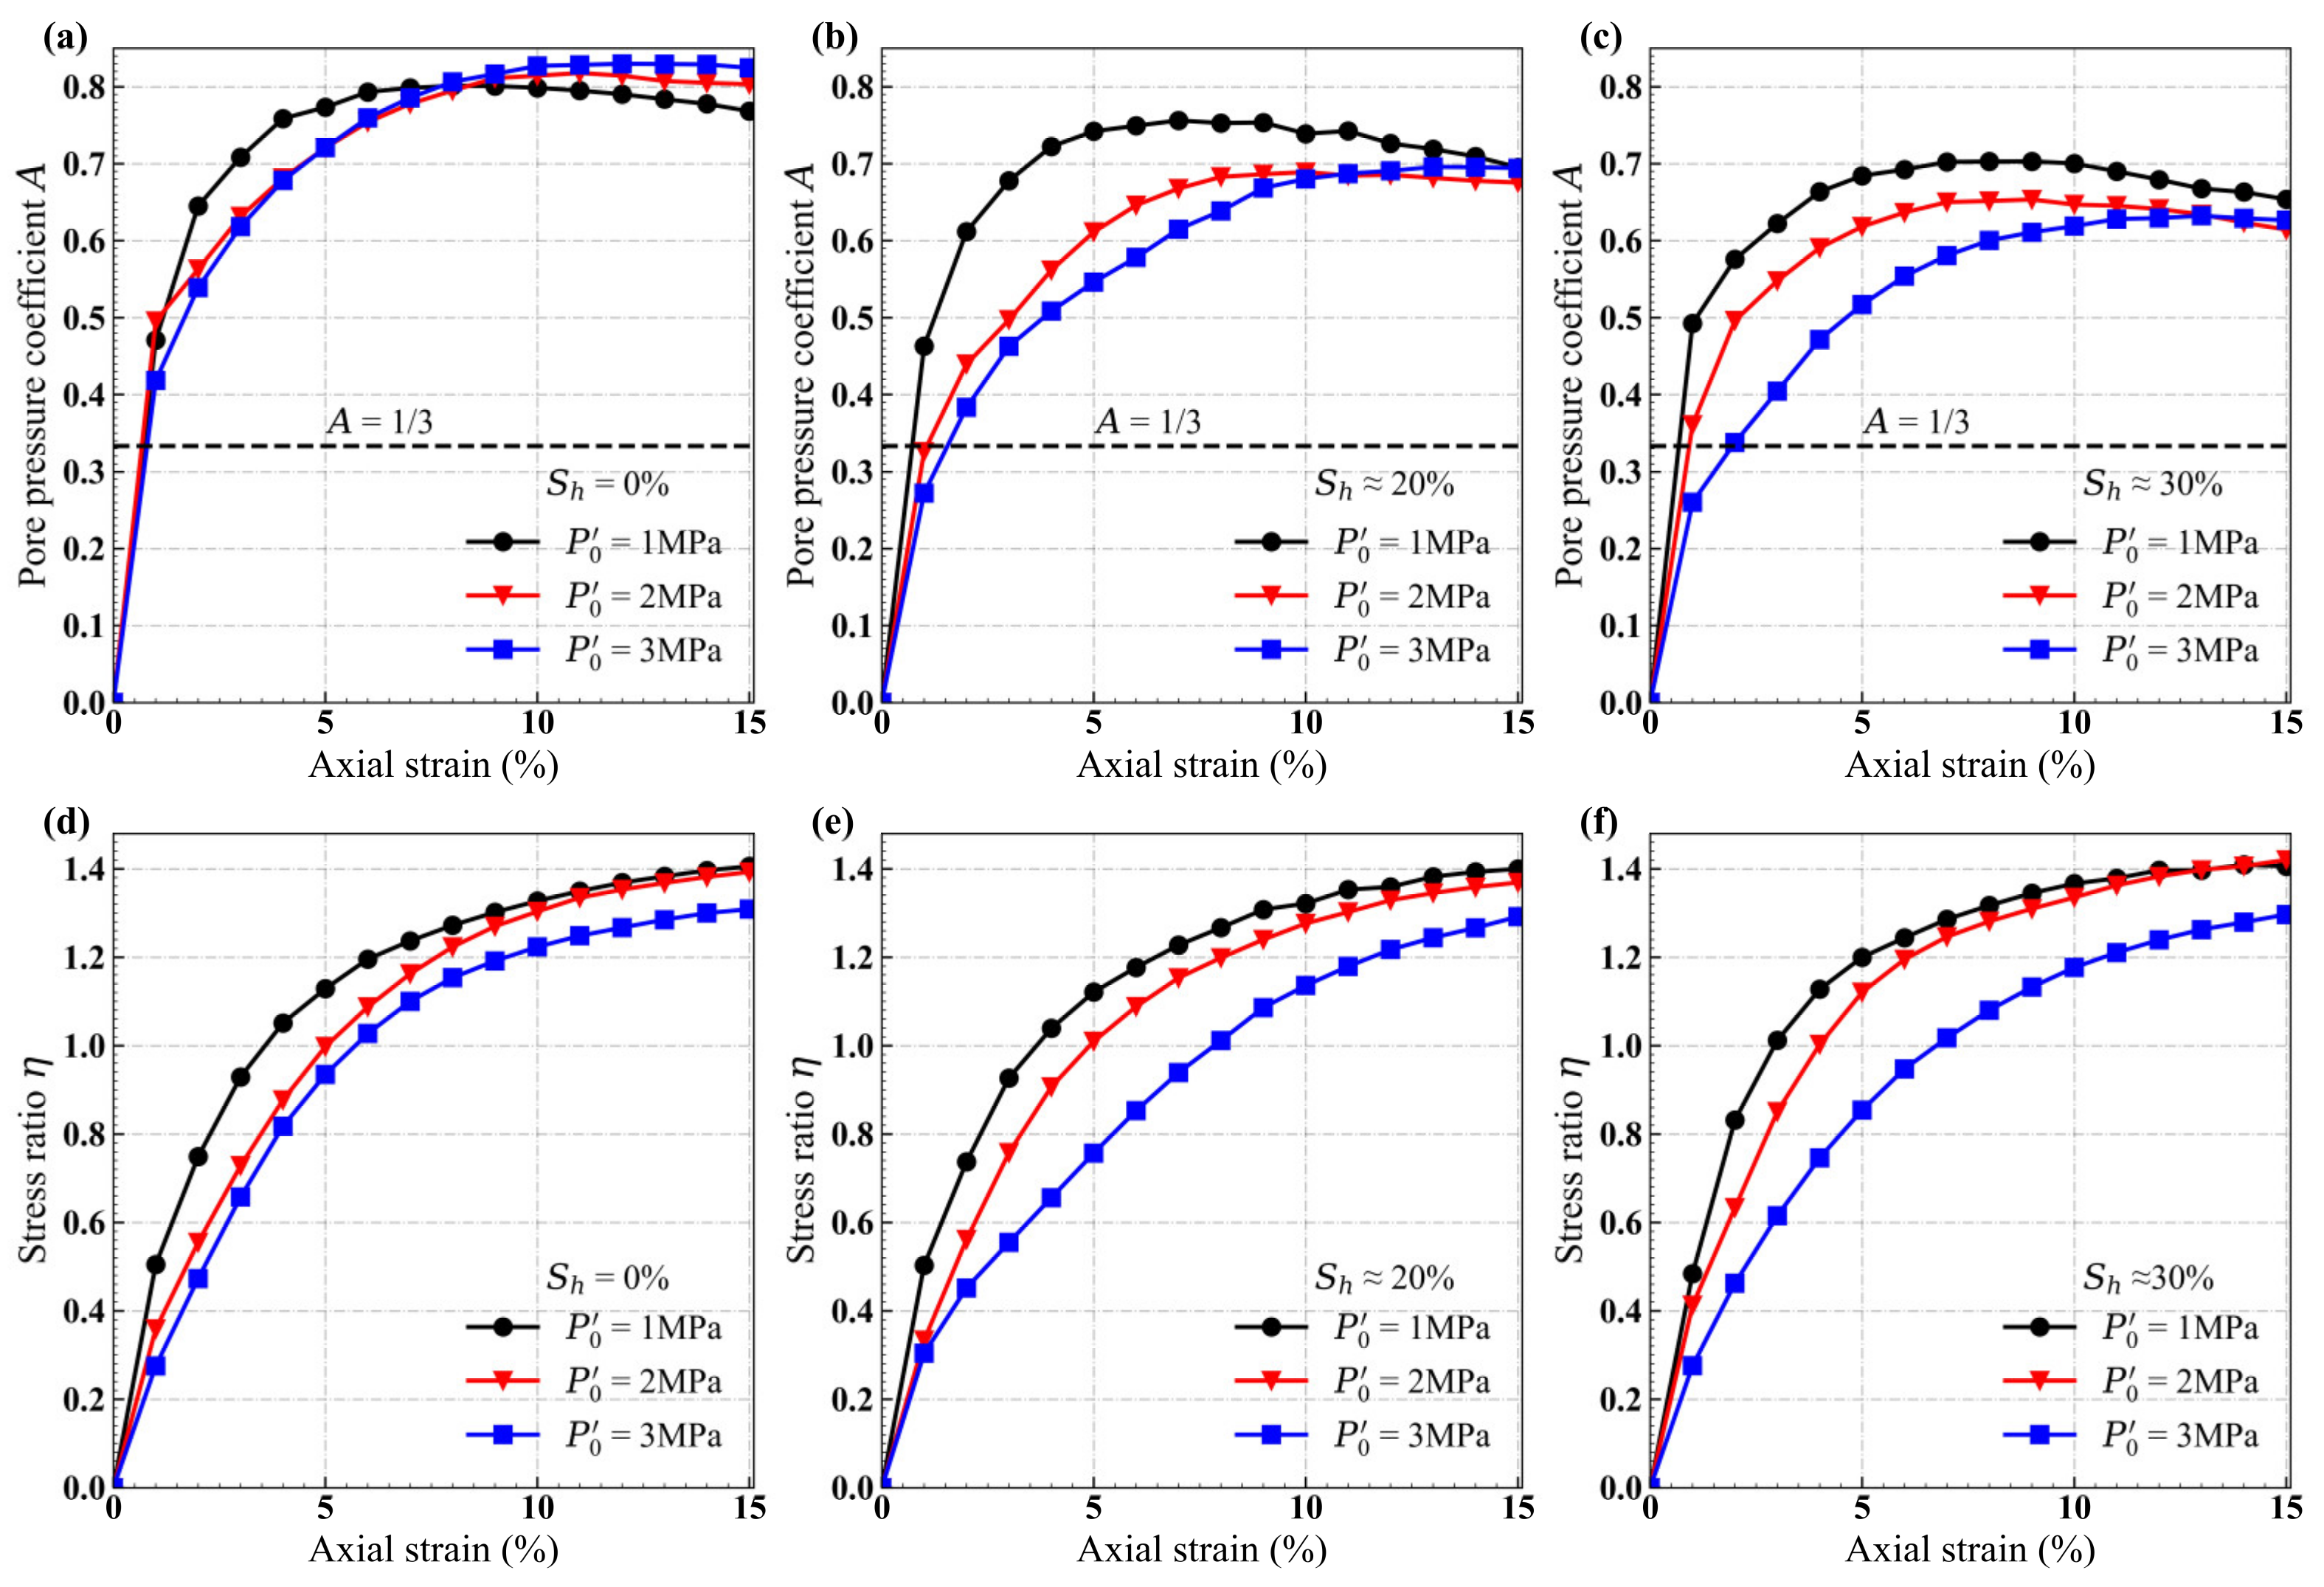
4.2. Effect of Effective Confining Pressure

The effect of effective confining pressure on A value and stress ratio η of sand sediments with different hydrate saturations are shown in Figure 4. The effective confining pressure has complex influences on the different sediments with or without hydrate. As shown in Figure 4a,b, the A value response obviously shows post-peak behavior, however, the A f values increase with increasing effective confining pressure. The curves of A values at P 0   =   3 MPa with different hydrate saturations are relatively flat in which the difference between A f and A m a x is smaller than that at P 0   =   1 MPa and 2 MPa . This will be further discussed in Section 5.1. As shown in Figure 4c,d, the peak stress ratios without hydrate are greater than M c s at P 0   =   1 MPa and P 0   =   2 MPa except P 0   =   3 MPa , while all the peak stress ratios with hydrate are greater than M c s .
The effect of effective confining pressure on A value and stress ratio η of clayey-silt sediments with different hydrate saturations are shown in Figure 5. As shown in Figure 5a, the A f values increase with increasing effective confining pressure, while in Figure 5b,c, that is almost the same. In Figure 5d–f, the η f decreases with increasing confining pressure without reaching an equal value.
The A f values of sand sediments with different hydrate saturations and clayey-silt sediments without hydrate increase with increasing effective confining pressure, while that of hydrate-bearing clayey-silt sediments does not change due to that although q f increase with increasing effective confining pressure and increasing hydrate saturation, u f is affected by the combined effect of effective confining pressure and hydrate saturation [35].

5. Discussion

5.1. Combined Effect of Hydrate Saturation and Effective Confining Pressure on Mechanical Response of the Hydrate-Bearing Sediments

In order to provide further illustration into the combined effect of the hydrate saturation and effective confining pressure, D A is defined as the difference between A f and A m a x of specimens as shown in Equation (8):
D A   =   A m a x A f
D A values of sand sediments under different effective confining pressures against the hydrate saturation are plotted in Figure 6. Highlighting the D A value at P 0   =   3 MPa significantly increase with increasing hydrate saturation while there is little difference between the cases at P 0   =   1 MPa and 2 MPa and the A m a x value with hydrate at P 0   =   3 MPa becomes larger than that without hydrate shown in Figure 2c. These results infer that the presence of hydrates in pores would hinder the consolidation of the hydrate-bearing sediments making it relatively facilitated to be compressed further at small strain level during shearing. This phenomenon is more pronounced with increasing effective confining pressure [36]. Meanwhile, all the A f values decrease with the increase in hydrate saturation implicating that the hydrate in the sand sediments will work as additional small particles during shearing leading to a greater dilatancy behavior at the ultimate state [26]. As shown in Figure 4a,b, a positive A value response illustrates the contraction always greater than the dilatancy in sand specimens before the peak pore pressure. The increase in effective confining pressure might have a more obvious effect on dilatancy behavior firstly in which the A m a x value of sand specimens at P 0   =   2 MPa is greater than that at P 0   =   1 MPa , however, the deformation of pore structure is further restricted under higher effective confining pressure resulting in a significant reduction in A m a x and A f at P 0   =   3 MPa . These explain that that D A values decrease with the increase in effective confining pressure seen in Figure 6 mainly resulting from the high effective confining pressure would constrict both the contractive and dilative deformation of sand sediments.
Although the D A values of clayey-silt specimens almost zero, the curve with S h 30 % is above that with S h 20 % at the small strain stage as shown in Figure 3b which is not consistent with Figure 3a,c. There may have the same hindrance to consolidation of hydrate-bearing clayey-silt sediments [37]. However, test results about the effect of this hindrance on the mechanical response of hydrate-bearing sediments are still insufficient which needs to carry out further experiments.

5.2. Comparison of Different Types of Host Sediments

The stress ratio η versus pore pressure coefficient A relationship curves of different hydrate-bearing sediments with various hydrate saturations are plotted in Figure 7. The η f values of sand sediments are the same with A f values less than 1/3, whereas the η f values of clayey-silt sediments are different with A f values greater than 1/3.
In undrained tests, the ultimate state of sand sediments is the critical state so that its η f is equal to M c s . Although the η f of clayey-silt sediment could be obtained in the test at strain of 15%, the critical state does not appear even for an axial strain of 35% due to the fact that the clayey-silt samples are well-graded [27,38]. However, Smith et al. [39] has reported that the ultimate state of hydrate-free clayey-silt sediments is critical state at P 0   =   100   kPa with particle-size distribution of experimental specimens approximately same as that of South China Sea sediments [27], and the η with hydrate tends to behave as strain-softening.
To further explain the differences between sand and clayey-silt sediments, typical effective stress paths of different sediments in q p plane are plotted in Figure 8. The solid line is the effective stress path of hydrate-bearing sediments, the dash line is the effective stress path of hydrate-free sediments, the dot-dash line is the total stress path, the dot line is the critical state line (CSL), the double-dot-dash line is the failure line (FL), and the square point is the failure point.
In critical state soil mechanics, the critical state line in   q     p plane is defined as Equation (9) [40,41]:
q   =   M c s p
where M c s is the slope of CSL.
The failure line based on the Mohr–Coulomb failure criterion in   q     p plane is defined as Equation (10) [37]:
q   =   M p   +   d
where M and d are the slope and intercept of FL.
The slope of the total stress path is 3. O 1 and O 2 represent beginning points of stress paths with low and high initial effective confining pressure, respectively. The Δ u is represented by the horizontal distance between the total stress path and the effective stress path. The horizontal distance from the failure point to the total stress path is the failure excess pore pressure Δ u f .
The development of different effective stress paths is dependent on the process of volume change in different sediments. In Figure 8a, the effective stress path of hydrate-free sand sediment exceeds its critical state line under low confining pressure rather than high confining pressure, while that of hydrate-bearing sediments always exceeds the critical state line representing that a volumetric expansion occurs under low confining pressure and a volumetric compression appears under high confining pressure in sand sediments [42,43], however, the enhancement of dilation due to the presence of hydrate is significant even under high effective confining pressure [44]. In Figure 8b, the effective stress paths of clayey-silt sediment are more complex. Under the high effective confining pressure, the path with or without hydrate both could not reach the critical state ending on the failure line. Highlighting failure lines are not unique in which slopes are approximately the same, whereas the intercept increases with the increase in hydrate saturations [37]. In contrast, under the low effective confining pressure, only the specimens without hydrate can reach the critical state line, while the path with hydrate exceeds the critical state line and tends to end up before reaching critical state line due to strain localization that shear bands or other kinds of non-uniform deformation occur before the critical state is reached [39]. It seems to illustrate that for clayey-silt sediments, dilation occurs only under low confining pressure rather than high confining pressure reflecting that the influence of hydrates depends on the effective confining pressure. However, more experimental data under undrained conditions would be needed to further investigate this phenomenon.
The combined effects of the hydrate saturation and the effective confining pressure on the pore pressure response works through affecting the Δ p . It can be seen that at the stage of effective stress paths moving along the opposite direction of p axis, a smaller absolute value of Δ p in hydrate-bearing specimens representing a relative increase in p compared to specimens without hydrate as a result of the deformation of pore structures limited by the support of hydrates leading to a reduction in Δ u . Hydrate-bearing sediments are thus able to withstand more stresses in which the effective stress path exceeds its critical state line until the restraint of hydrate on the soil skeleton is invalidated by the increase in q associated with a higher stress path. This indicates that the mode behavior of stress ratio changing from strain-hardening to strain-softening is mostly induced by hydrate breakage for sand sediments under high confining pressure and clayey-silt sediments under low confining pressure.
Additionally, for sand sediments, the pore pressure response first increases caused by compression corresponding to a consistently reduction in p , and then a decrease in pore pressure appears related to a relative increase in p indicating a volumetric expansion due to the fact that sand particles tend to slide, rotate, or turn over around particles [13,42]. However, since the clayey-silt sediments are well-graded, it is difficult for particles to roll across others due to cohesion resulting in a constantly contractive deformation during shearing [27,38].
Briefly, differences in the development of effective stress paths of different sediments indicate that the deformation behavior will lead to the change in p values due to the pore pressure response. Therefore, the pore pressure response could reflect the process of volume change in different hydrate-bearing sediments during shearing.

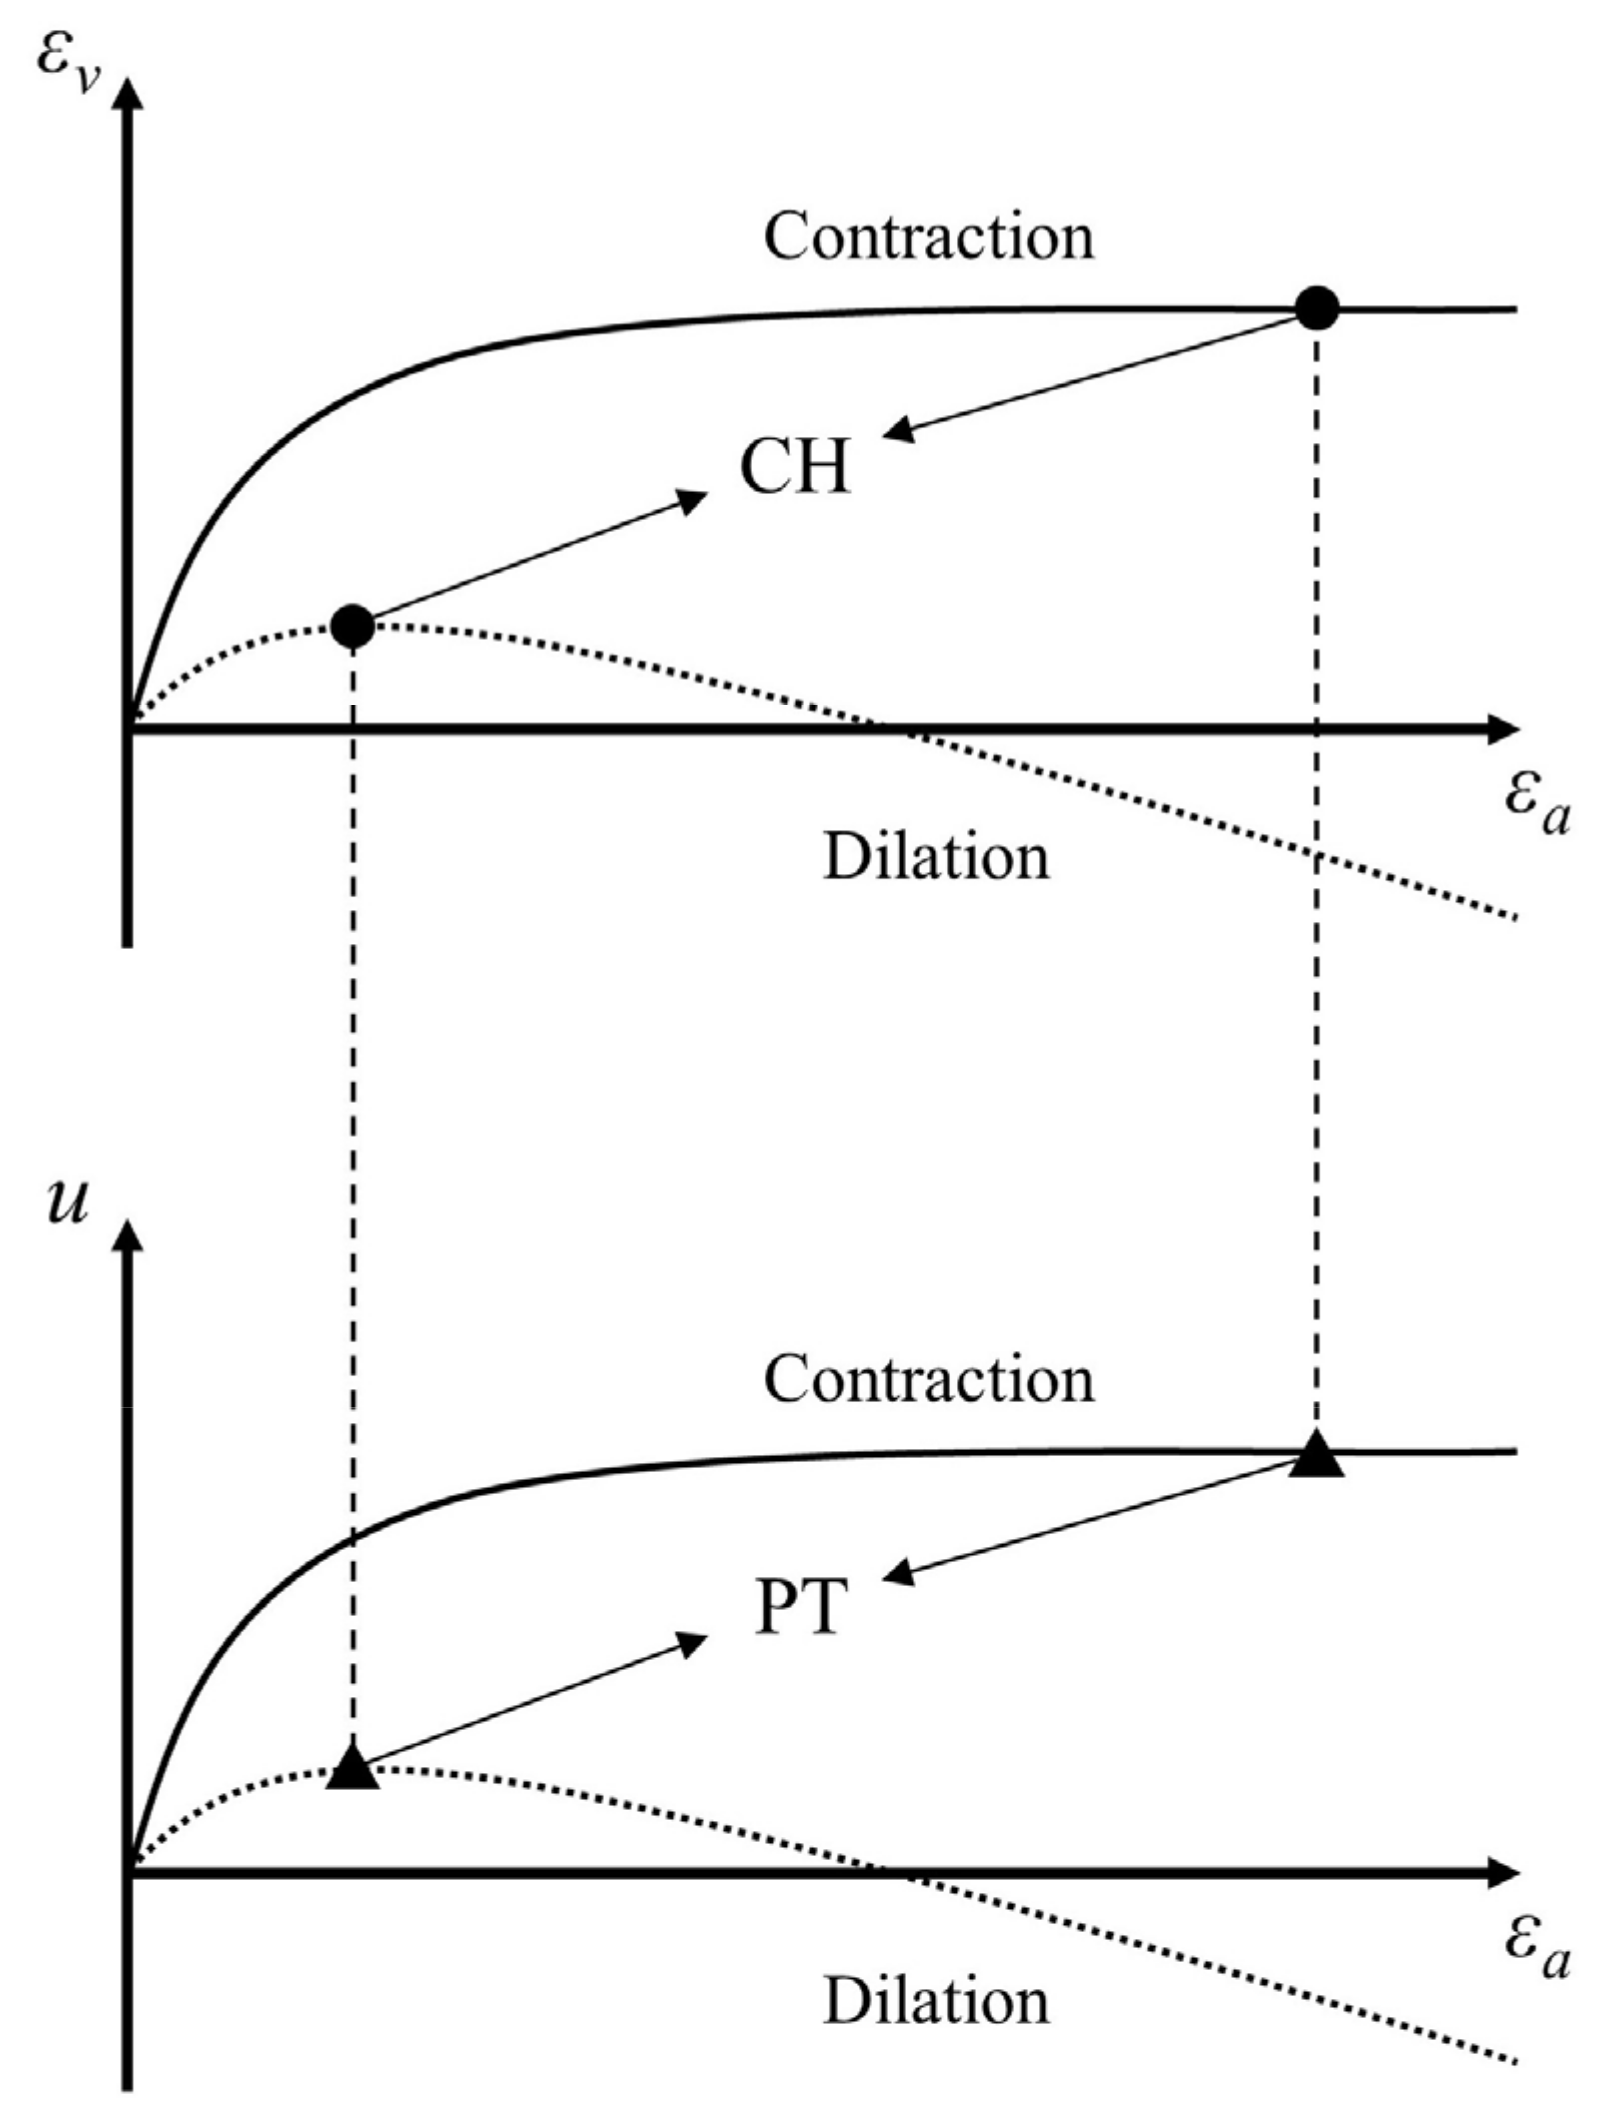
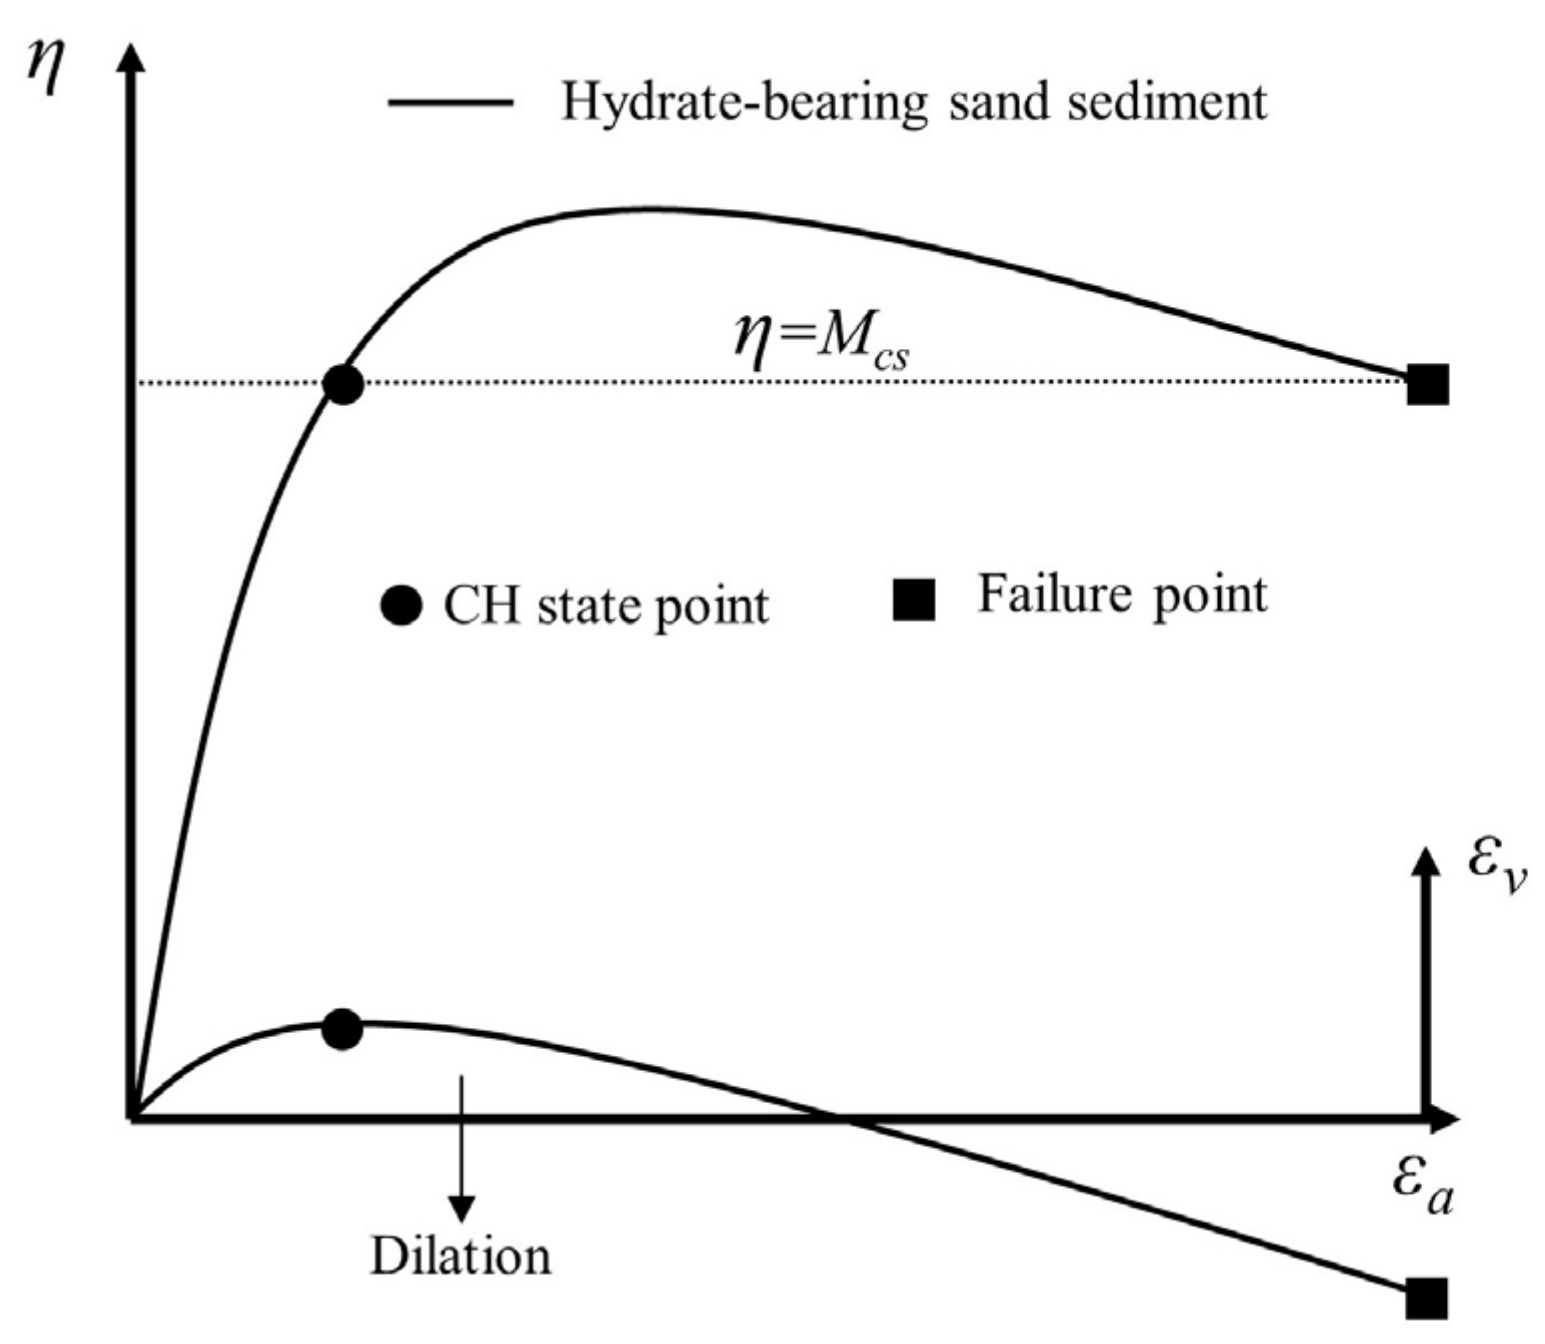
5.3. Characteristics of Pore Pressure Coefficient a Response of Different Sediments

Typical characteristics of pore pressure coefficient A response of different sediments are plotted in Figure 9. As shown in Figure 9a, the A value response of sand sediments first develops towards the direction of more than 1/3 until reaches the maximum pore pressure coefficient A m a x and then decreases to the failure in which A f is less than 1/3. The presence of hydrate could lead to a A f value less than zero. As shown in Figure 9b, the A value response of clayey-silt sediments always moves towards the direction of more than 1/3 until failure, except cases under low effective confining pressure which is similar to sand sediments but still greater than 0. Comparing Figure 8 and Figure 9, the change in pore pressure coefficient A represents the pore pressure response of specimens so that it can be used to characterize the deformation behavior of hydrate-bearing sediments as a dimensionless parameter which is independent of effective confining pressure which the magnitude of pore pressure response varying in. It is then necessary to specifically examine the relationship between the volume change and pore pressure coefficient of hydrate-bearing sediments.

5.4. Comparison of Different Drainage Conditions

Curves of volumetric strain ε v versus strain and pore pressure versus axial strain ε a for both dilative and contractive soils are schematically shown in Figure 10 [45]. Under drained conditions, the point with d ε v   =   0 was defined as characteristic state (CH) point by Luong [46], while the point with d u   =   0 was defined as phase transformation (PT) point by Ishihara [47]. Chu [45] proved that the PT state was the same as the characteristic state. For contractive soils, all the points were the same at failure reached the critical state, while for dilative soils, the PT point was the same as the CH point which both were different from the critical state.
As shown in Figure 11, Wu et al. [13] have proposed that the typical mechanical characteristics curves for hydrate-bearing sand sediments in triaxial compression tests under drainage conditions are as follows: the η increases as the axial strain increases towards CH point at which the η is regarded as the M c s ( η   =   M c s ). In addition, then specimen behaves strain-softening with the ε v decreasing after the peak stress ratio until approaching the critical state as the ultimate state.
Wu et al. [13] well modelled the aforementioned deformation behavior of hydrate-bearing sand sediments using dilatancy rate D, which is defined as Equation (11):
D = d ε v p d ε q p
where d ε v p and d ε q p denote the infinitesimal increments in plastic volumetric and deviatoric strain, respectively.
The volume change behavior of hydrate-bearing sediments described by pore pressure coefficient needs to be accordance in that of D in terms of the research results of Chu [45], however, the A value calculated through Equation (5) must be used to compared with the D value due to its definition. The stress ratio η versus pore pressure coefficient A relationship curves of different hydrate-bearing sediments with various hydrate saturations are plotted in Figure 12. As shown in Figure 12a,b, for the sand sediments, the development modes of coefficient A in the curves reverse once reached the peak stress ratio and then it returns to the M c s forming a hysteretic geometry. The η value at the first time with A = 0 is close to M c s (PT point) and at the second time with A   =   0 is equal to M c s (Failure point). As shown in Figure 12c,d, when the η reaches the failure value, A values rapidly decrease to A = 0 . The deformation behavior of the hydrate-bearing sediments characterized by the pore pressure coefficient A makes a great agreement with that by dilatancy rate D [13]. It is concluded that the dilatancy rate and pore pressure coefficient are consistent in the description of the dilatancy and contraction behavior of hydrate-bearing sediments based on the fact that the pore pressure change in undrained tests is interrelated to the volume change in drained tests [45].
Typical stress ratio versus strain and pore pressure versus strain curves of hydrate-bearing sand and clayey-silt sediments in triaxial compression undrained tests can be plotted in Figure 13. The solid lines are the hydrate-bearing sand samples showing a post-peak behavior. The dash lines are denoted as the hydrate-bearing clayey-silt specimen. Although it exhibits strain-hardening behavior, the η f with pore pressure increment is 0 is not M c s which is different from the specimen without hydrate. However, the ultimate state of hydrate-bearing clayey-silt sediments needs more triaxial compression tests to be confirmed.

5.5. Comparison of Different Types of Pore Pressure Coefficient

A secant type coefficient A refers to a state from an initial value to a final value reflecting whether the volume deformation is compression or expansion compared with the initial state, while a tangent type coefficient A is defined as an instantaneous change tendency at a point in which A < 0 signifies dilation tendency, whereas A > 0 indicates contraction tendency. Although the initial value and final value of A and A are different as shown in Figure 7 and Figure 13, they both could describe the process of deformation behavior in term of the aforementioned relationship between the pore pressure response and the change in p . Therefore, it is necessary to select secant type or tangent type in combination with the problems in specific practical projects.
Although the two types of pore pressure coefficients discussed above have advantages not only in characterizing the process of deformation behavior of hydrate-bearing sediments in laboratory tests and field measurements by determining the A or A value (i.e., a value of A > 1 / 3 indicates that sediments occur compression deformation, while a value of A < 1 / 3 corresponds to a dilatancy deformation) but also in reflecting the combined effects of the hydrate and the effective confining pressure on hydrate-bearing sediments, this still needs a further improvement combined with natural hydrate-bearing sediments.

6. Conclusions

To investigate the interrelationship between the characteristics of pore pressure coefficient A response and the process of volume change of hydrate-bearing sediments. The effects of hydrate saturation and effective confining pressure on the characteristics of pore pressure coefficient A of different hydrate-bearing sediments are explored systematically based on the published triaxial undrained test data. Furthermore, differences in the A value response between hydrate-bearing sand and clayey-silt sediments are discussed and analyzed. Main conclusions are as follows:
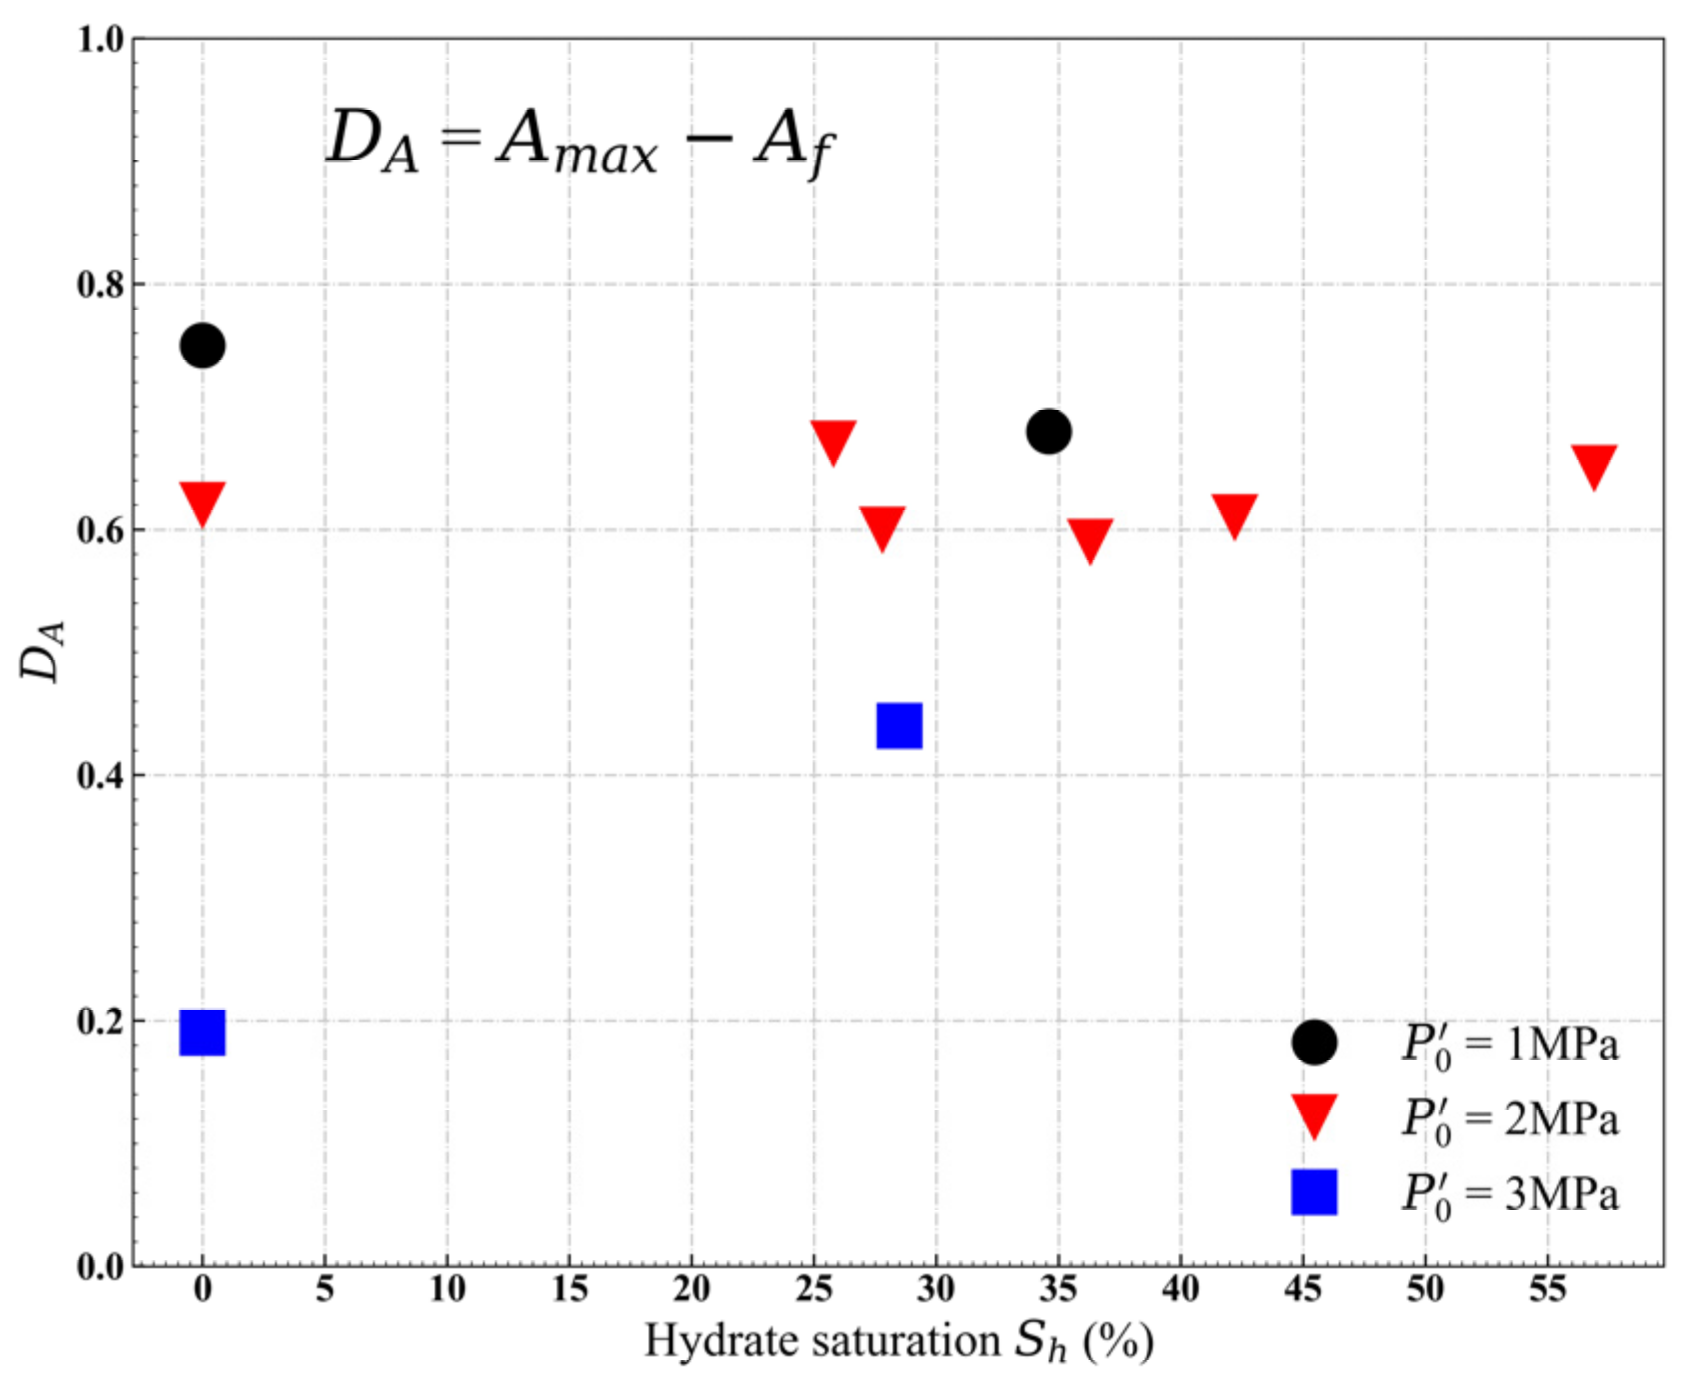
  • For hydrate-bearing sediments, increasing hydrate saturation hinders the consolidation process, leading to a higher value of the pore pressure coefficient A at small strain stage. This effect becomes much more obvious when the effective confining pressure increases for hydrate-bearing sand sediments but barely changes for hydrate-bearing clayey-silt sediments. Increasing hydrate saturation leads to decreasing A values at failure both within hydrate-bearing sand and clayey-silt sediments. The change in A values at failure with increasing effective confining pressure is not monotonic for hydrate-bearing clayey-silt sediments, however, A values at failure hydrate-bearing sand sediments increase with increasing effective confining pressure.
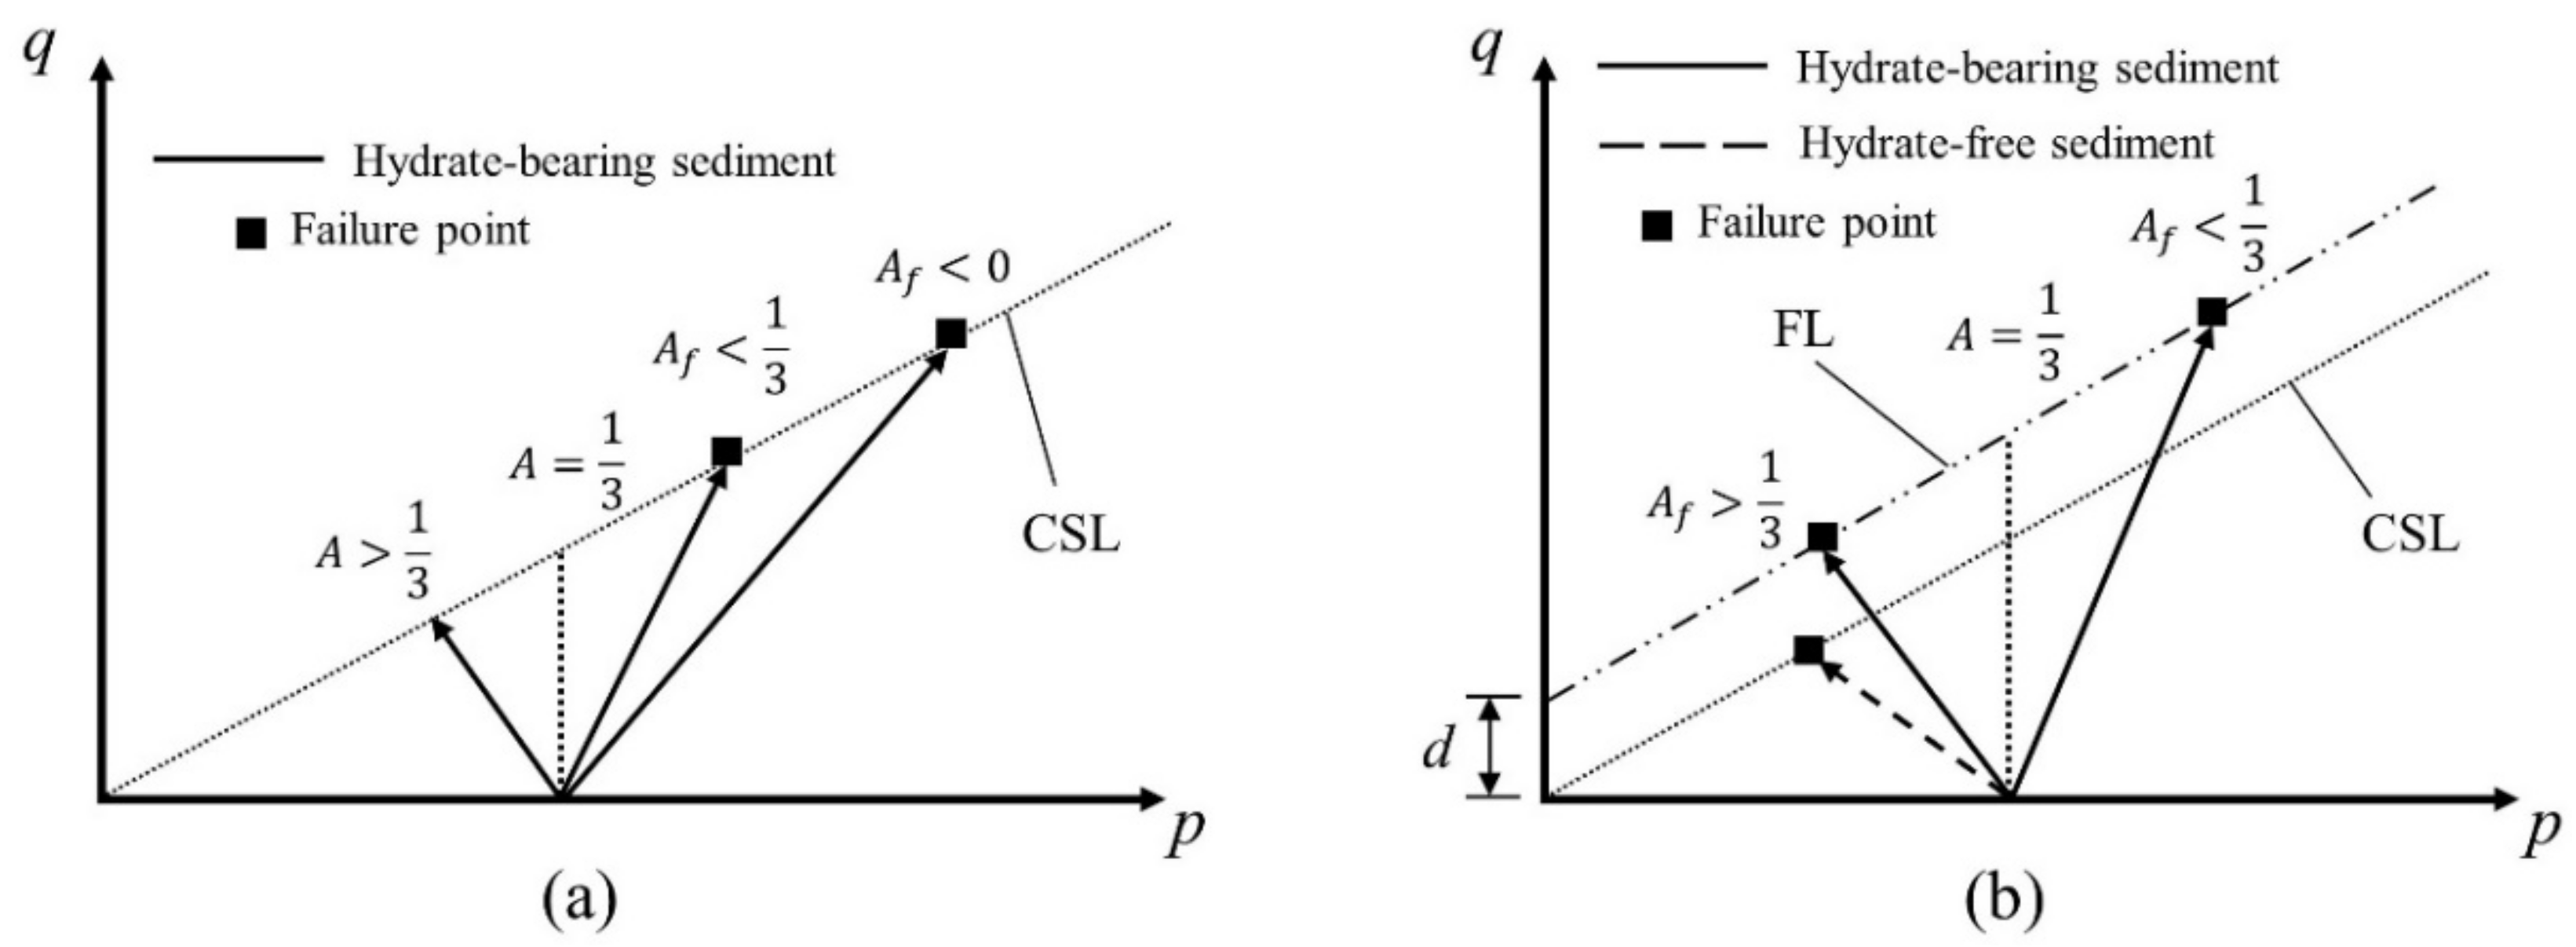
  • Pore pressure coefficient A of hydrate-bearing sand sediments firstly goes beyond 1/3 and then becomes lower than 1/3 at failure, even lower than 0. While that of hydrate-bearing clayey-silt sediments is always larger than 1/3 when the effective confining pressure is high (e.g., >1 MPa). However, when the effective confining pressure is small (e.g., 100 kPa), pore pressure coefficient A of hydrate-bearing clayey-silt sediments behaves similar to hydrate-bearing sand sediments but always bigger than 0.
  • How the pore pressure coefficient A changes with hydrate saturation and effective confining pressure is inherently controlled by the alternation of effective mean stress p .
This study builds a bridge between pore pressure and effective mean stress, which has a great potential to predict the volume change of hydrate-bearing sediments only by the pore pressure coefficient A under undrained condition.

Author Contributions

Conceptualization, R.W. and C.J.; formal analysis, L.L. and N.W.; visualization, R.W.; writing—original draft, R.W.; writing—review and editing, C.J. and L.L.; funding acquisition L.L. and N.W. All authors have read and agreed to the published version of the manuscript.

Funding

This study was jointly supported by the National Key Research and Development Project (grant 2018YFE0126400) and the National Natural Science Foundation of China (grant 41872136).

Institutional Review Board Statement

Not applicable.

Informed Consent Statement

Not applicable.

Data Availability Statement

All Data has been provided in the paper.

Conflicts of Interest

The authors declare no conflict of interest.

Abbreviations

A pore pressure coefficient A
A f coefficient A at failure
A m a x maximum value of coefficient A
B pore pressure coefficient B
D dilatancy rate, equal to d ε v p / d ε q p
e 0 initial void ratio
M c s critical state stress ratio
P 0 initial effective confining pressure
p mean stress, equal to σ 1   +   2 σ 3 / 3
p mean effective stress, equal to σ 1   +   2 σ 3 / 3
q deviatoric stress, equal to σ 1 σ 3
S h hydrate saturation
Ttemperature
Δ u excess pore pressure
ε v p plastic volumetric strain
ε q p plastic deviatoric strain
η stress ratio, equal to q / p
σ 1 major total principal stresses
σ 1 major effective principal stresses
σ 3 minor total principal stresses
σ 3 minor effective principal stresses

References

  1. Sloan, E.D. Fundamental principles and applications of natural gas hydrates. Nature 2003, 426, 353–359. [Google Scholar] [CrossRef] [PubMed]
  2. Li, Y.; Hu, G.; Wu, N.; Liu, C.; Chen, Q.; Li, C. Undrained shear strength evaluation for hydrate-bearing sediment overlying strata in the Shenhu area, northern South China Sea. Acta Oceanol. Sin. 2019, 38, 114–123. [Google Scholar] [CrossRef]
  3. Li, Y.; Liu, L.; Jin, Y.; Wu, N. Characterization and development of natural gas hydrate in marine clayey-silt reservoirs: A review and discussion. Adv. Geo-Energy Res. 2021, 5, 75–86. [Google Scholar] [CrossRef]
  4. Sun, X.; Luo, H.; Luo, T.; Song, Y.; Li, Y. Numerical study of gas production from marine hydrate formations considering soil compression and hydrate dissociation due to depressurization. Mar. Pet. Geol. 2019, 102, 759–774. [Google Scholar] [CrossRef]
  5. Zhao, Y.; Kong, L.; Liu, L.; Liu, J. Influence of hydrate exploitation on stability of submarine slopes. Nat. Hazards 2022, 1–25. [Google Scholar] [CrossRef]
  6. Li, Y.; Liu, C.; Liu, L.; Sun, J.; Liu, H.; Meng, Q. Experimental study on evolution behaviors of triaxial-shearing parameters for hydrate-bearing intermediate fine sediment. Adv. Geo-Energy Res. 2018, 2, 43–52. [Google Scholar] [CrossRef] [Green Version]
  7. Priest, J.A.; Hayley, J.L. Strength of Laboratory Synthesized Hydrate-Bearing Sands and Their Relationship to Natural Hydrate-Bearing Sediments. J. Geophys. Res. Solid Earth 2019, 124, 12556–12575. [Google Scholar] [CrossRef]
  8. Choi, J.-H.; Lin, J.-S.; Dai, S.; Lei, L.; Seol, Y. Triaxial compression of hydrate-bearing sediments undergoing hydrate dissociation by depressurization. Geomech. Energy Environ. 2020, 23, 100187. [Google Scholar] [CrossRef]
  9. Wang, L.; Zhao, J.; Sun, X.; Wu, P.; Shen, S.; Liu, T.; Li, Y. Comprehensive review of geomechanical constitutive models of gas hydrate-bearing sediments. J. Nat. Gas Sci. Eng. 2021, 88, 103755. [Google Scholar] [CrossRef]
  10. Iwai, H.; Kawasaki, T.; Zhang, F. Constitutive model for gas hydrate-bearing soils considering different types of hydrate morphology and prediction of strength-band. Soils Found. 2022, 62, 101103. [Google Scholar] [CrossRef]
  11. Shmulik, P. Rowe’s Stress-Dilatancy Theory for Hydrate-Bearing Sand. Int. J. Geomech. 2017, 17, 6016008. [Google Scholar] [CrossRef]
  12. Lee, J.Y.; Kim, G.-Y.; Kang, N.K.; Yi, B.-Y.; Jung, J.W.; Im, J.-H.; Son, B.-K.; Bahk, J.-J.; Chun, J.-H.; Ryu, B.-J.; et al. Physical properties of sediments from the Ulleung Basin, East Sea: Results from Second Ulleung Basin Gas Hydrate Drilling Expedition, East Sea (Korea). Mar. Pet. Geol. 2013, 47, 43–55. [Google Scholar] [CrossRef]
  13. Wu, Y.; Liao, J.; Zhang, W.; Cui, J. Characterization of stress–dilatancy behavior for methane hydrate-bearing sediments. J. Nat. Gas Sci. Eng. 2021, 92, 104000. [Google Scholar] [CrossRef]
  14. Sasaki, T.; Shao, B.; Elshafie, M.; Papadopoulou, M.; Yamamoto, K.; Soga, K. Simulation of axial tensile well deformation during reservoir compaction in offshore unconsolidated methane hydrate-bearing formation. Comput. Geotech. 2021, 129, 103894. [Google Scholar] [CrossRef]
  15. Kim, J.; Seol, Y.; Dai, S. The coefficient of earth pressure at rest in hydrate-bearing sediments. Acta Geotech. 2021, 16, 2729–2739. [Google Scholar] [CrossRef]
  16. Skempton, A.W. The Pore-Pressure Coefficients A and B. Géotechnique 1954, 4, 143–147. [Google Scholar] [CrossRef]
  17. Eigenbrod, K.D.; Wurmnest, W.H. Pore-water pressure response during undrained isotropic load changes in layered soils. Can. Geotech. J. 1999, 36, 544–555. [Google Scholar] [CrossRef]
  18. Wang, H.F. Effects of deviatoric stress on undrained pore pressure response to fault slip. J. Geophys. Res. Solid Earth 1997, 102, 17943–17950. [Google Scholar] [CrossRef]
  19. Bishop, A.W. The Use of Pore-Pressure Coefficients in Practice. Géotechnique 1954, 4, 148–152. [Google Scholar] [CrossRef]
  20. White, M.D.; Kneafsey, T.J.; Seol, Y.; Waite, W.F.; Uchida, S.; Lin, J.S.; Myshakin, E.M.; Gai, X.; Gupta, S.; Reagan, M.T.; et al. An international code comparison study on coupled thermal, hydrologic and geomechanical processes of natural gas hydrate-bearing sediments. Mar. Pet. Geol. 2020, 120, 104566. [Google Scholar] [CrossRef]
  21. Skempton, A.W.; Bjerrum, L. A Contribution to the settlement analysis of foundations on clay. Géotechnique 1957, 7, 168–178. [Google Scholar] [CrossRef]
  22. Doran, I.G.; Sivakumar, V.; Graham, J.; Johnson, A. Estimation of in situ stresses using anisotropic elasticity and suction measurements. Géotechnique 2000, 50, 189–196. [Google Scholar] [CrossRef]
  23. Wild, K.M.; Amann, F. Experimental study of the hydro-mechanical response of Opalinus Clay—Part 1: Pore pressure response and effective geomechanical properties under consideration of confinement and anisotropy. Eng. Geol. 2018, 237, 32–41. [Google Scholar] [CrossRef]
  24. Wild, K.M.; Amann, F. Experimental study of the hydro-mechanical response of Opalinus Clay—Part 2: Influence of the stress path on the pore pressure response. Eng. Geol. 2018, 237, 92–101. [Google Scholar] [CrossRef]
  25. Yun, T.S.; Santamarina, J.C.; Ruppel, C. Mechanical properties of sand, silt, and clay containing tetrahydrofuran hydrate. J. Geophys. Res. Solid Earth 2007, 112, B04106. [Google Scholar] [CrossRef]
  26. Iwai, H.; Konishi, Y.; Kimoto, S. Undrained Triaxial Compression Tests on Artificial CO2-hydrate-bearing Sand Specimens. Energy Procedia 2017, 114, 3175–3184. [Google Scholar] [CrossRef]
  27. Wang, L.; Sun, X.; Shen, S.; Wu, P.; Liu, T.; Liu, W.; Zhao, J.; Li, Y. Undrained triaxial tests on water-saturated methane hydrate-bearing clayey-silty sediments of the south China sea. Can. Geotech. J. 2021, 58, 351–366. [Google Scholar] [CrossRef]
  28. Li, Y.; Wang, L.; Shen, S.; Liu, T.; Zhao, J.; Sun, X. Triaxial Tests on Water-Saturated Gas Hydrate-Bearing Fine-Grained Samples of the South China Sea under Different Drainage Conditions. Energy Fuels 2021, 35, 4118–4126. [Google Scholar] [CrossRef]
  29. Winters, W.J.; Waite, W.F.; Mason, D.H.; Gilbert, L.Y.; Pecher, I.A. Methane gas hydrate effect on sediment acoustic and strength properties. J. Pet. Sci. Eng. 2007, 56, 127–135. [Google Scholar] [CrossRef] [Green Version]
  30. Ghiassian, H.; Grozic, J.L.H. Strength behavior of methane hydrate bearing sand in undrained triaxial testing. Mar. Pet. Geol. 2013, 43, 310–319. [Google Scholar] [CrossRef]
  31. Iwai, H.; Konishi, Y.; Saimyou, K.; Kimoto, S.; Oka, F. Rate effect on the stress-strain relations of synthetic carbon dioxide hydrate-bearing sand and dissociation tests by thermal stimulation. Soils Found. 2018, 58, 1113–1132. [Google Scholar] [CrossRef]
  32. Skempton, A.W. The Pore-Pressure Coefficient in Saturated Soils. Géotechnique 1960, 10, 186–187. [Google Scholar] [CrossRef]
  33. Luo, T.; Li, Y.; Madhusudhan, B.N.; Zhao, J.; Song, Y. Comparative analysis of the consolidation and shear behaviors of CH4 and CO2 hydrate-bearing silty sediments. J. Nat. Gas Sci. Eng. 2020, 75, 103157. [Google Scholar] [CrossRef]
  34. Madhusudhan, B.N.; Clayton, C.R.I.; Priest, J.A. The Effects of Hydrate on the Strength and Stiffness of Some Sands. J. Geophys. Res. Solid Earth 2019, 124, 65–75. [Google Scholar] [CrossRef]
  35. Shen, S.; Li, Y.; Sun, X.; Wang, L.; Song, Y. Analysis of the mechanical properties of methane hydrate-bearing sands with various pore pressures and confining pressures. J. Nat. Gas Sci. Eng. 2021, 87, 103786. [Google Scholar] [CrossRef]
  36. Jialin, X.; Chengshun, X.; Norimasa, Y.; Masayuki, H.; Shintaro, K.; Linghui, H. Experimental Investigation of the Mechanical Properties of Methane Hydrate–Bearing Sediments under High Effective Confining Pressure. J. Geotech. Geoenvironmental Eng. 2022, 148, 4021190. [Google Scholar] [CrossRef]
  37. Zhou, J.; Yang, Z.; Wei, C.; Chen, P.; Yan, R. Mechanical behavior of hydrate-bearing sands with fine particles under isotropic and triaxial compression. J. Nat. Gas Sci. Eng. 2021, 92, 103991. [Google Scholar] [CrossRef]
  38. Luo, T.; Song, Y.; Zhu, Y.; Liu, W.; Liu, Y.; Li, Y. Triaxial experiments on the mechanical properties of hydrate-bearing marine sediments of South China Sea. Mar. Pet. Geol. 2016, 77, 507–514. [Google Scholar] [CrossRef]
  39. Smith, W.E.; Priest, J.A.; Hayley, J.L.H. Influence of vertical cylindrical tetrahydrofuran hydrate veins on fine-grained soil behaviour. Can. Geotech. J. 2018, 55, 1691–1701. [Google Scholar] [CrossRef]
  40. Roscoe, K.H.; Schofield, A.N.; Wroth, C.P. on The Yielding of Soils. Géotechnique 1958, 8, 22–53. [Google Scholar] [CrossRef]
  41. Roscoe, K.H.; Schofield, A.N.; Thurairajah, A. Yielding of Clays in States Wetter than Critical. Géotechnique 1963, 13, 211–240. [Google Scholar] [CrossRef]
  42. Li, X.S.; Dafalias, Y.F. Dilatancy for cohesionless soils. Géotechnique 2000, 50, 449–460. [Google Scholar] [CrossRef]
  43. Been, K.; Jefferies, M.G.; Hachey, J. The critical state of sands. Géotechnique 1991, 41, 365–381. [Google Scholar] [CrossRef]
  44. Hyodo, M.; Li, Y.; Yoneda, J.; Nakata, Y.; Yoshimoto, N.; Nishimura, A. Effects of dissociation on the shear strength and deformation behavior of methane hydrate-bearing sediments. Mar. Pet. Geol. 2014, 51, 52–62. [Google Scholar] [CrossRef]
  45. Chu, J. An experimental examination of the critical state and other similar concepts for granular soils. Can. Geotech. J. 1995, 32, 1065–1075. [Google Scholar] [CrossRef]
  46. Luong, M.P. Stress-strain aspects of cohesionless soils under cyclic and transient loading. In Proceedings International Symposium on Soils under Cyclic and Transient Loading; A. A. Balkema: Rotterdam, The Netherlands, 1980; Volume 1, pp. 315–324. [Google Scholar]
  47. Ishihara, K.; Tatsuoka, F.; Yasuda, S. Undrained Deformation and Liquefaction of Sand Under Cyclic Stresses. Soils Found. 1975, 15, 29–44. [Google Scholar] [CrossRef] [Green Version]
Figure 1. The direction of different A values: (1) A = 1 / 3 relative to elastic deformation; (2) A > 1 / 3 relative to compression; (3) A < 1 / 3 relative to dilatancy.
Jmse 10 00509 g001
Figure 2. Effect of hydrate saturation on A value of sand sediments at (a) P 0   =   1 MPa , (b) P 0   =   2 MPa , (c) P 0   =   3 MPa , and effect of hydrate saturation on stress ratio η of sand sediments at (d) P 0   =   1 MPa , (e) P 0   =   2 MPa , (f) P 0   =   3 MPa .
Jmse 10 00509 g002
Figure 3. Effect of hydrate saturation on A value of clayey-silt sediments at (a) P 0   =   1 MPa , (b) P 0   =   2 MPa , (c) P 0   =   3 MPa , and effect of hydrate saturation on stress ratio η of clayey-silt sediments at (d) P 0   =   1 MPa , (e) P 0   =   2 MPa , (f) P 0   =   3 MPa .
Jmse 10 00509 g003
Figure 4. Effect of effective confining pressure on A value of sand sediments with (a) S h   =   0 % , (b) S h     30 % , and effect of effective confining pressure on stress ratio η of sand sediments with (c) S h   =   0 % , (d) S h     30 % .
Jmse 10 00509 g004
Figure 5. Effect of effective confining pressure on A value of clayey-silty sediments with (a) S h   =   0 % , (b) S h     20 % , (c) S h     30 % , and effect of effective confining pressure on stress ratio η of clayey-silty sediments with (d) S h   =   0 % , (e) S h     20 % , (f) S h     30 % .
Jmse 10 00509 g005
Figure 6. D A value versus S h of sand sediments.
Jmse 10 00509 g006
Figure 7. Stress ratio η versus A value relationship of sand sediments with (a) S h   =   0 % , (b) S h     30 % , and stress ratio η versus A value relationship of clayey-silty sediments with (c) S h   =   0 % , (d) S h     30 % .
Jmse 10 00509 g007
Figure 8. Typical stress paths of different sediments in q     p plane. (a) sand sediments, (b) clayey-silt sediments.
Jmse 10 00509 g008
Figure 9. Typical characteristics of pore pressure coefficient A response of different sediments in q     p plane. (a) sand sediments, (b) clayey-silt sediments.
Jmse 10 00509 g009
Figure 10. Schematic presentation of characteristic state point and phase transformation point [45].
Jmse 10 00509 g010
Figure 11. Typical mechanical characteristics curves for hydrate-bearing sand sediments in triaxial compression tests under drained conditions [13].
Jmse 10 00509 g011
Figure 12. Stress ratio η versus A value relationship of sand sediments with (a) S h   =   0 % , (b) S h     30 % , and stress ratio η versus A value relationship of clayey-silty sediments with (c) S h   =   0 % , (d) S h     30 % .
Jmse 10 00509 g012
Figure 13. Typical mechanical characteristics curves for different hydrate-bearing sediments in triaxial compression tests under undrained conditions.
Jmse 10 00509 g013
Table 1. Test conditions and results of undrained triaxial compression tests on different hydrate-bearing sediments. (Note. T: temperature, P. P.: pore pressure, e 0 : initial void ratio, S h : hydrate saturation, P 0 : initial effective confining pressure, A f : pore pressure coefficient A at failure, A m a x : maximum value of coefficient A ).
Sample TypeT (°C)P. P. (MPa) e 0 S h (%) P 0 (MPa) A max A f
Sand [31]1100.740.0010.52−0.23
1100.7634.610.4−0.28
1100.720.0020.650.03
1100.7425.820.63−0.04
1100.7327.820.57−0.03
1100.7436.320.52−0.07
1100.7442.220.52−0.09
1100.7456.920.55−0.1
1100.720.0030.420.23
1100.7328.530.520.08
Clayey-silt [27]8120.800.0010.80.77
8120.8020.010.740.69
8120.8128.710.70.65
8120.840.0020.80.8
8120.8119.420.680.67
8120.8130.420.640.61
8120.830.0030.830.82
8120.8218.830.690.69
8120.8229.830.630.63
Publisher’s Note: MDPI stays neutral with regard to jurisdictional claims in published maps and institutional affiliations.

