
Revisiting the Carbonate Chemistry of the Sea of Japan (East Sea): From Water Column to Sediment

 , ,
, ,
Abstract
1. Introduction
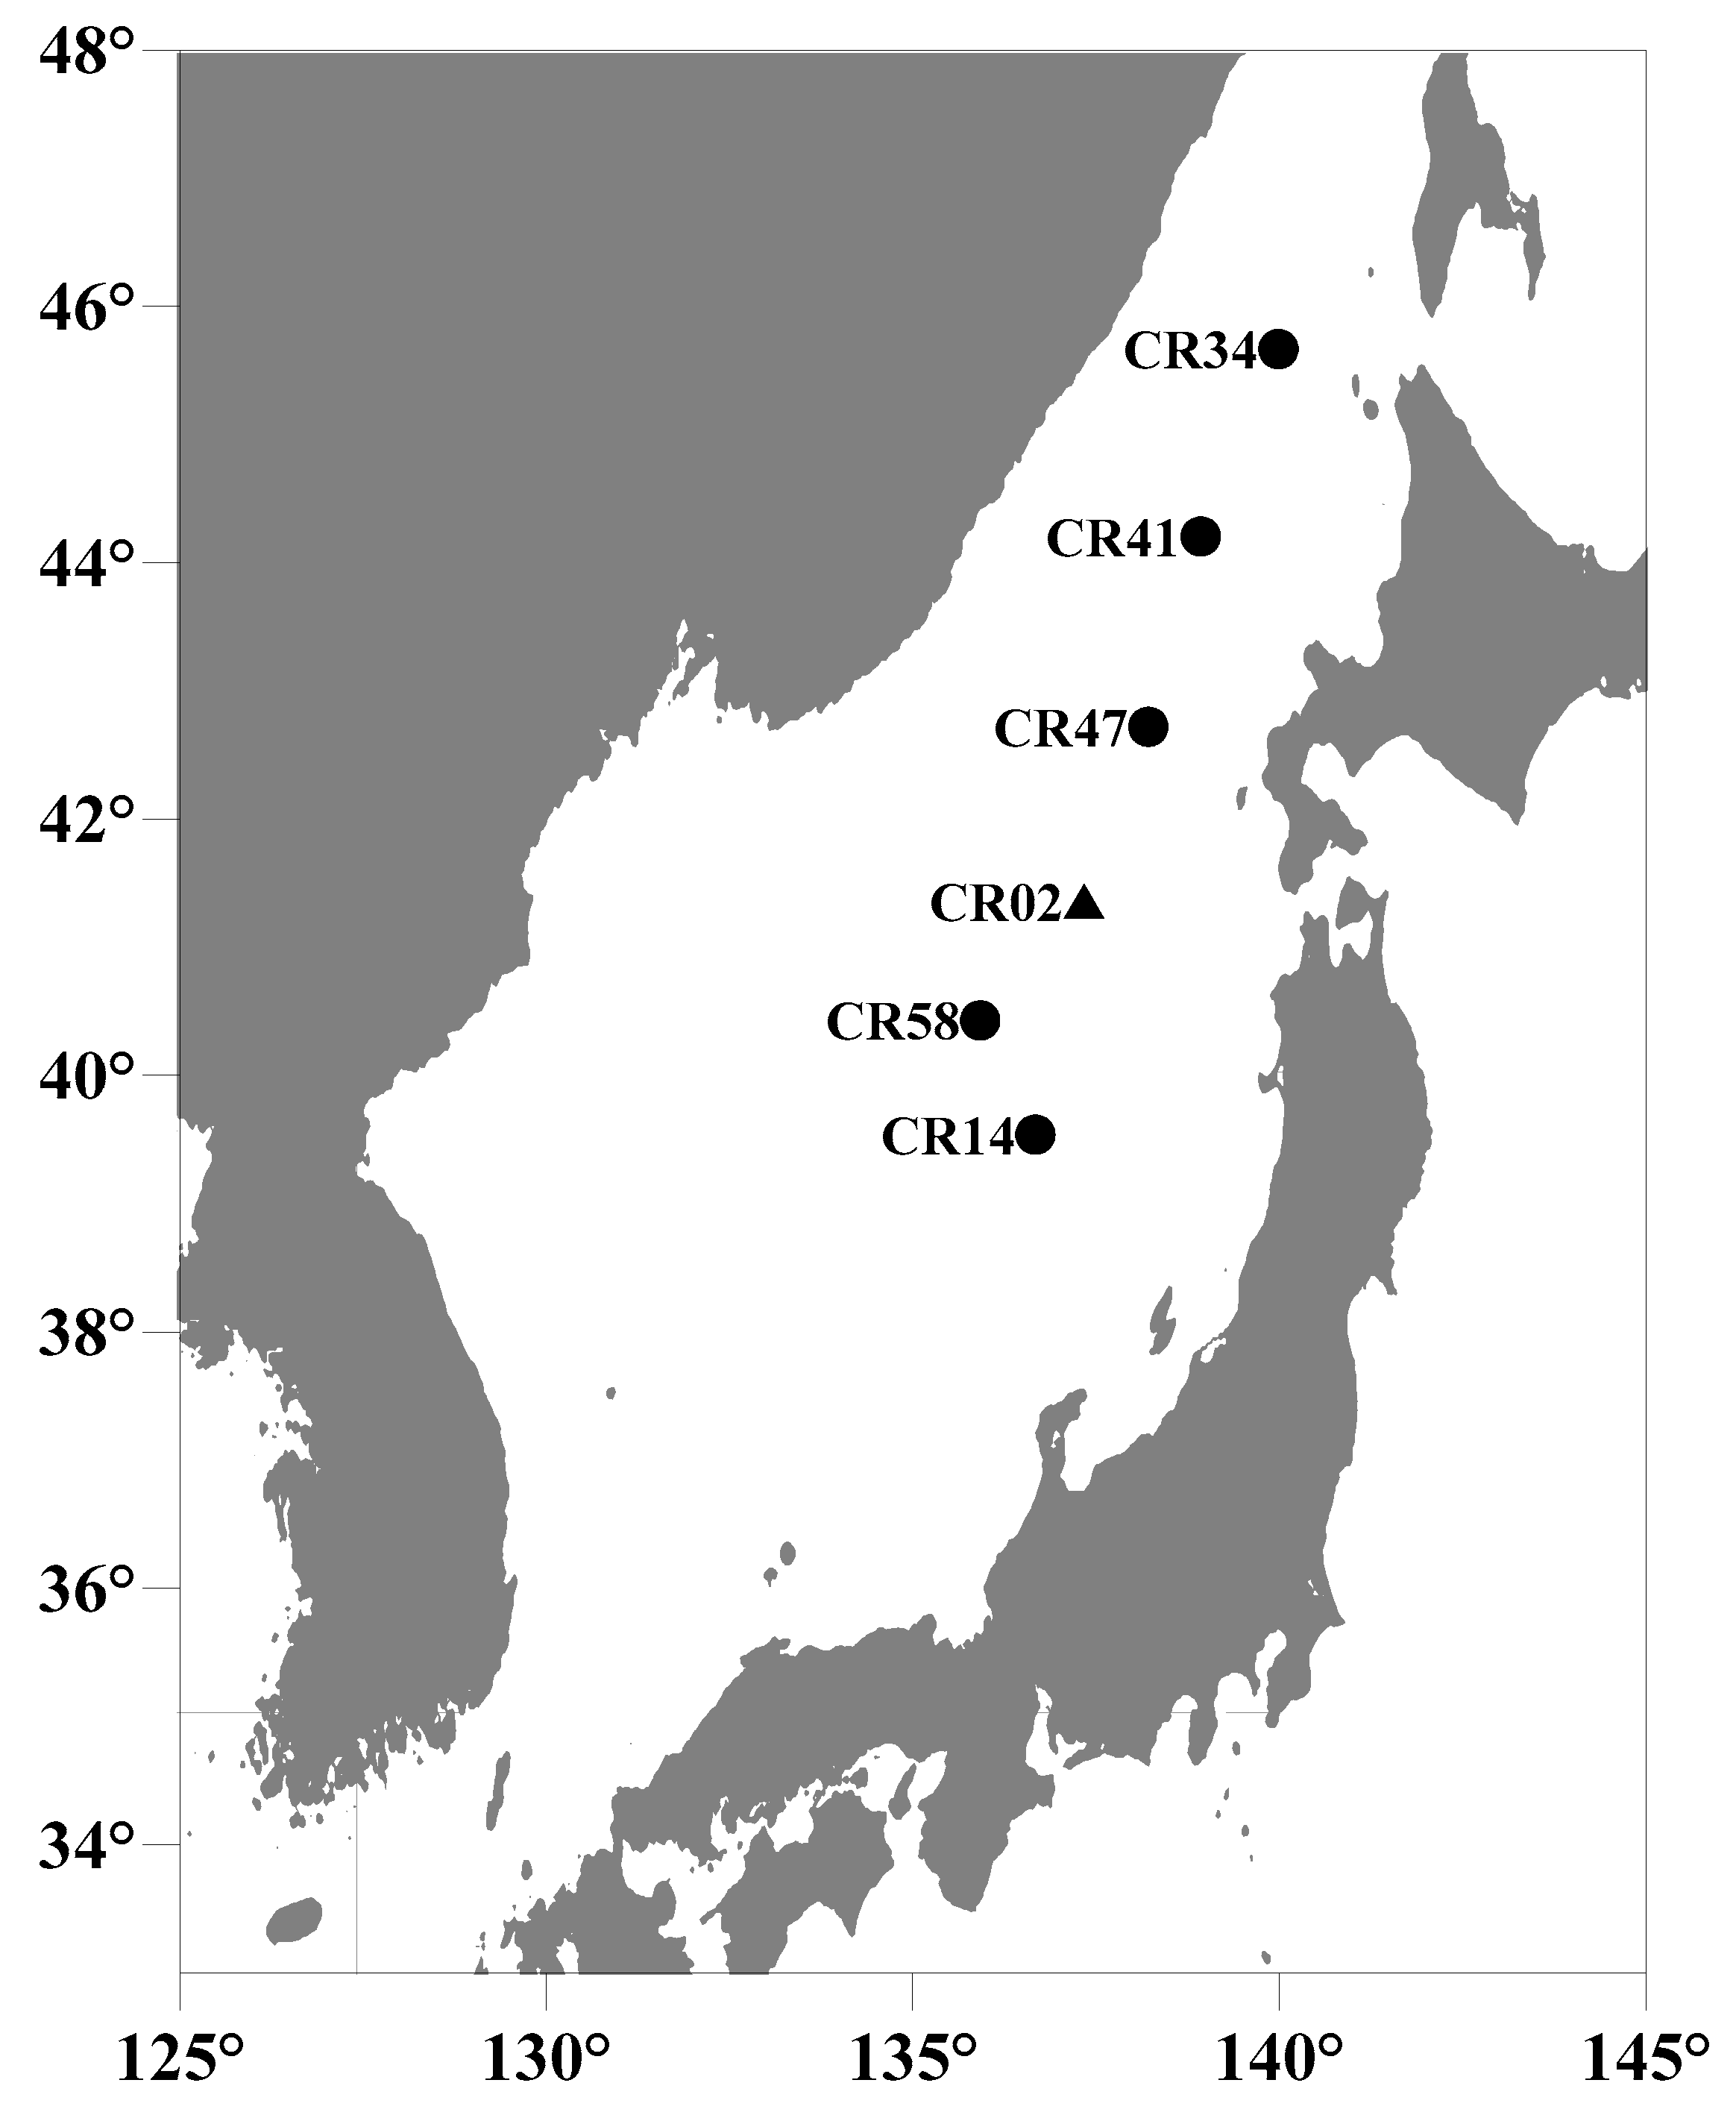
2. Study Area
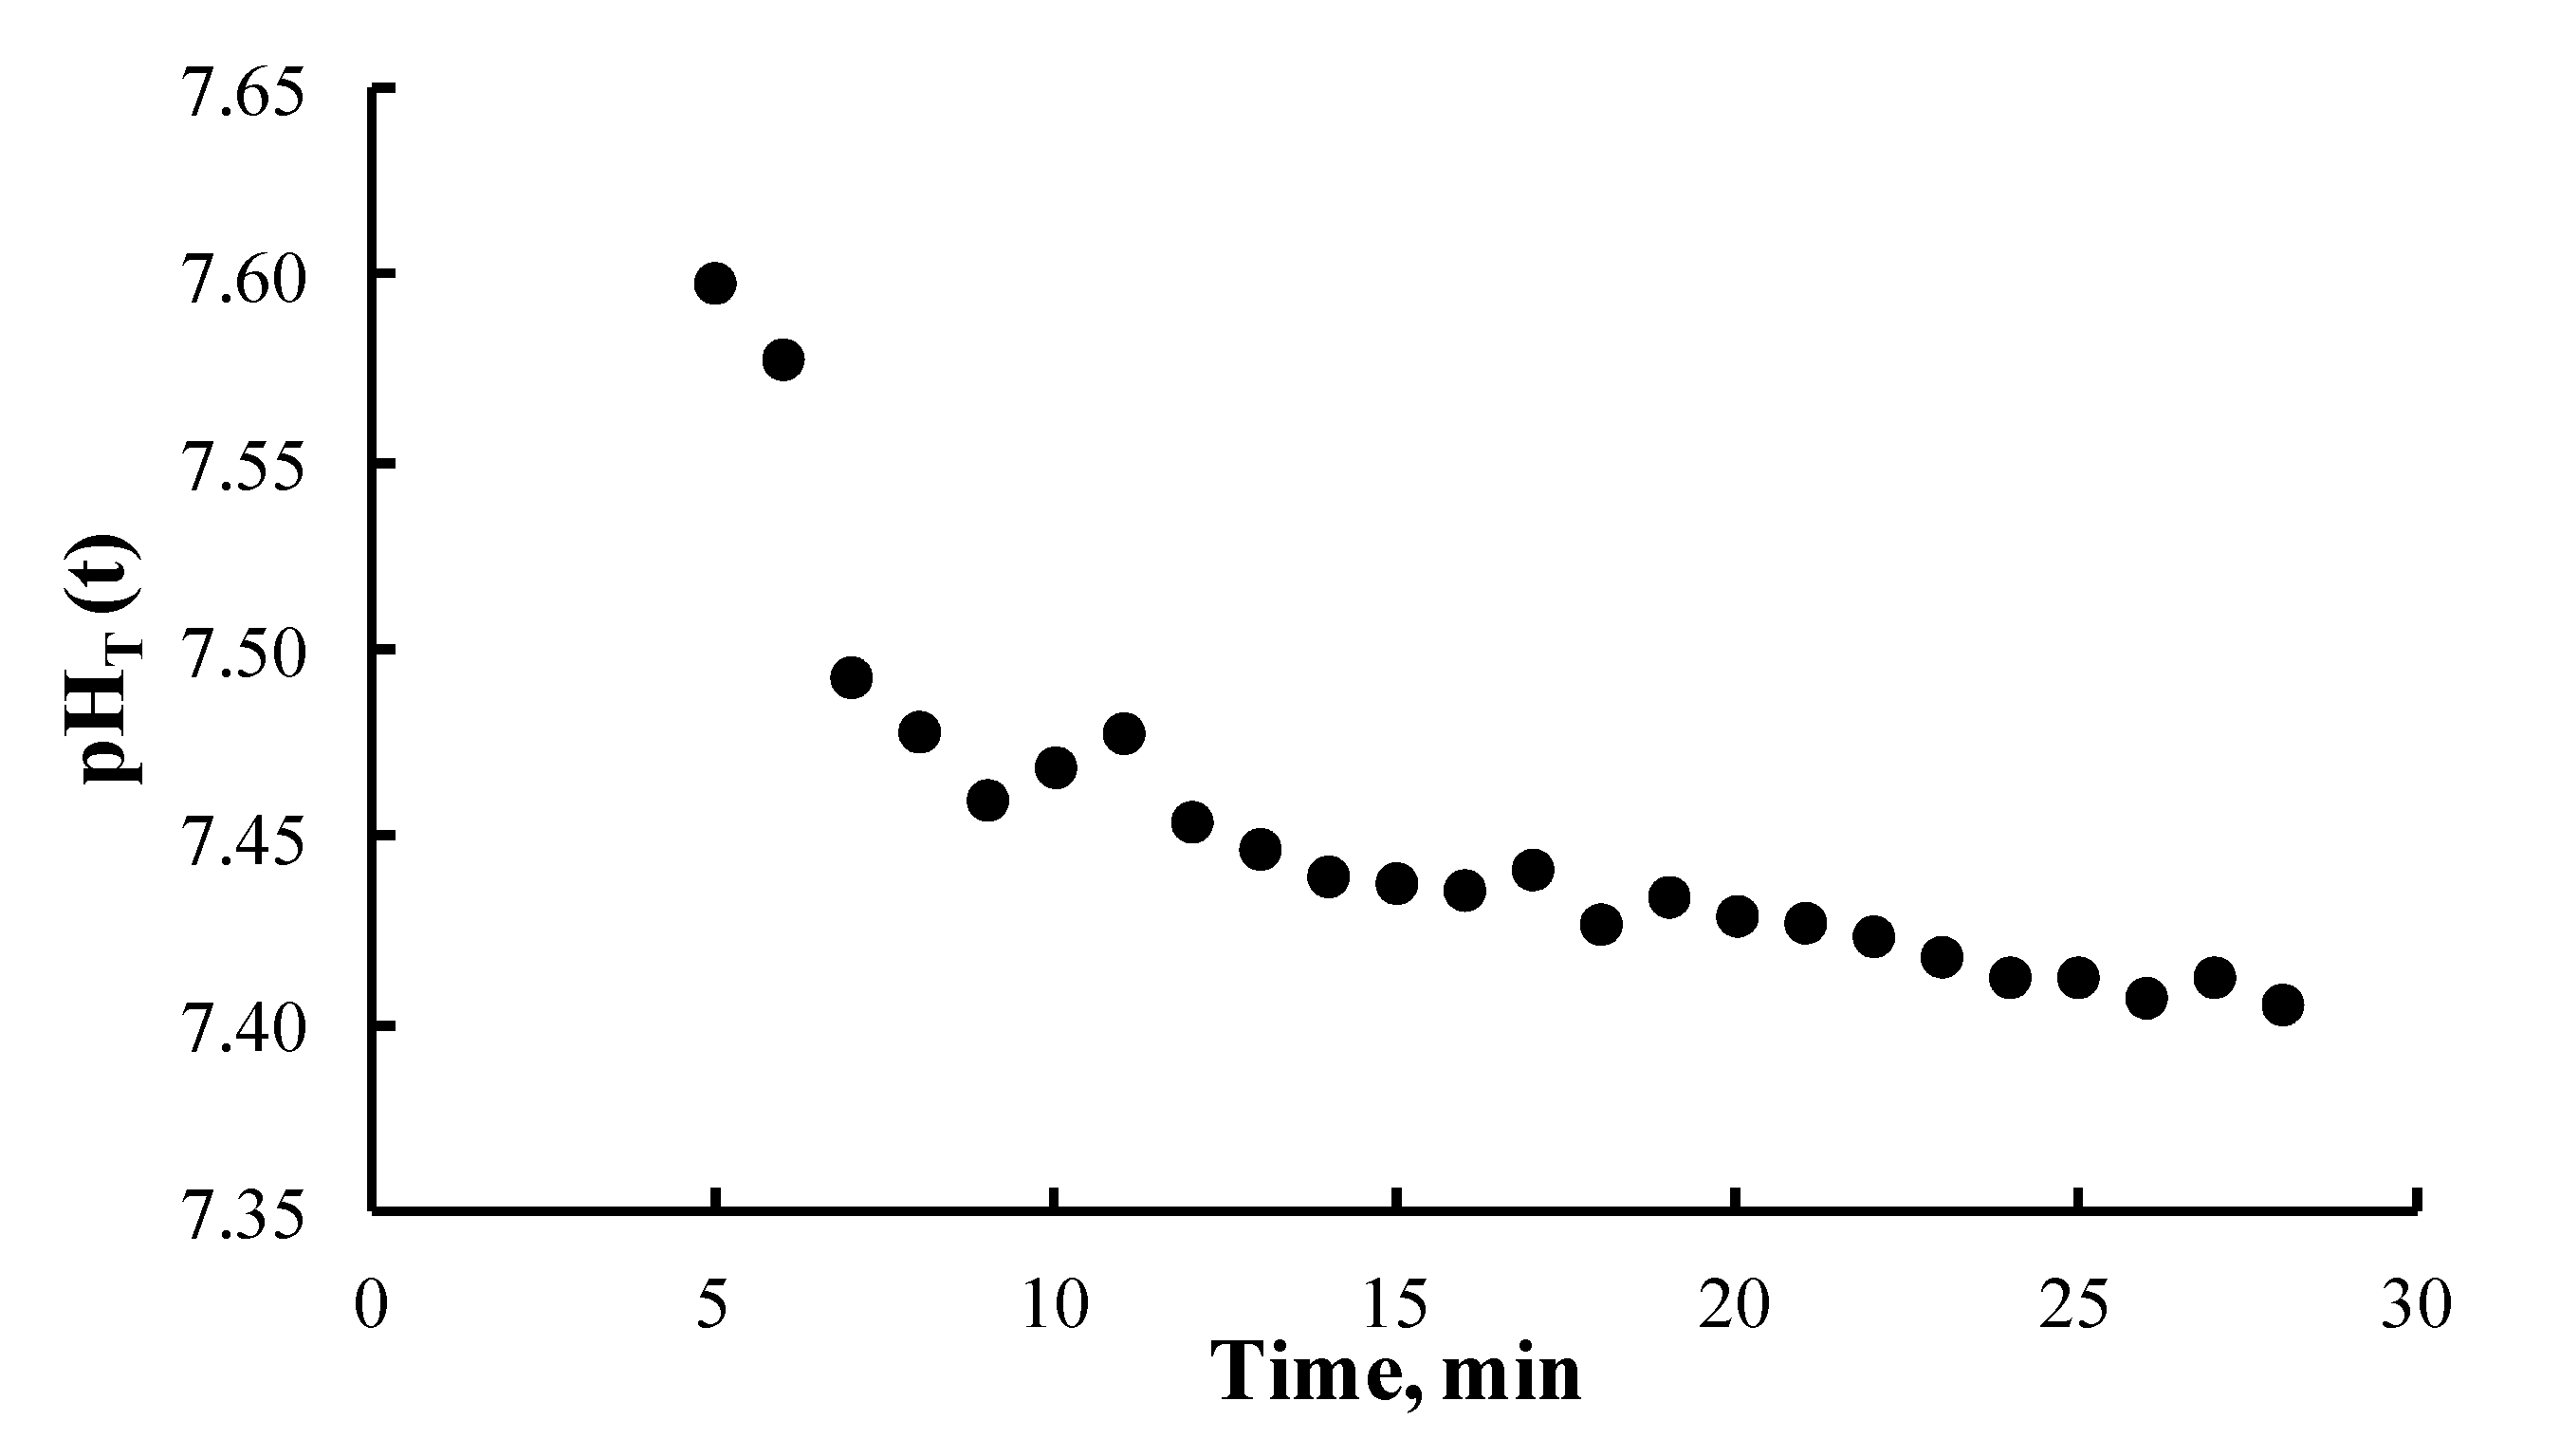
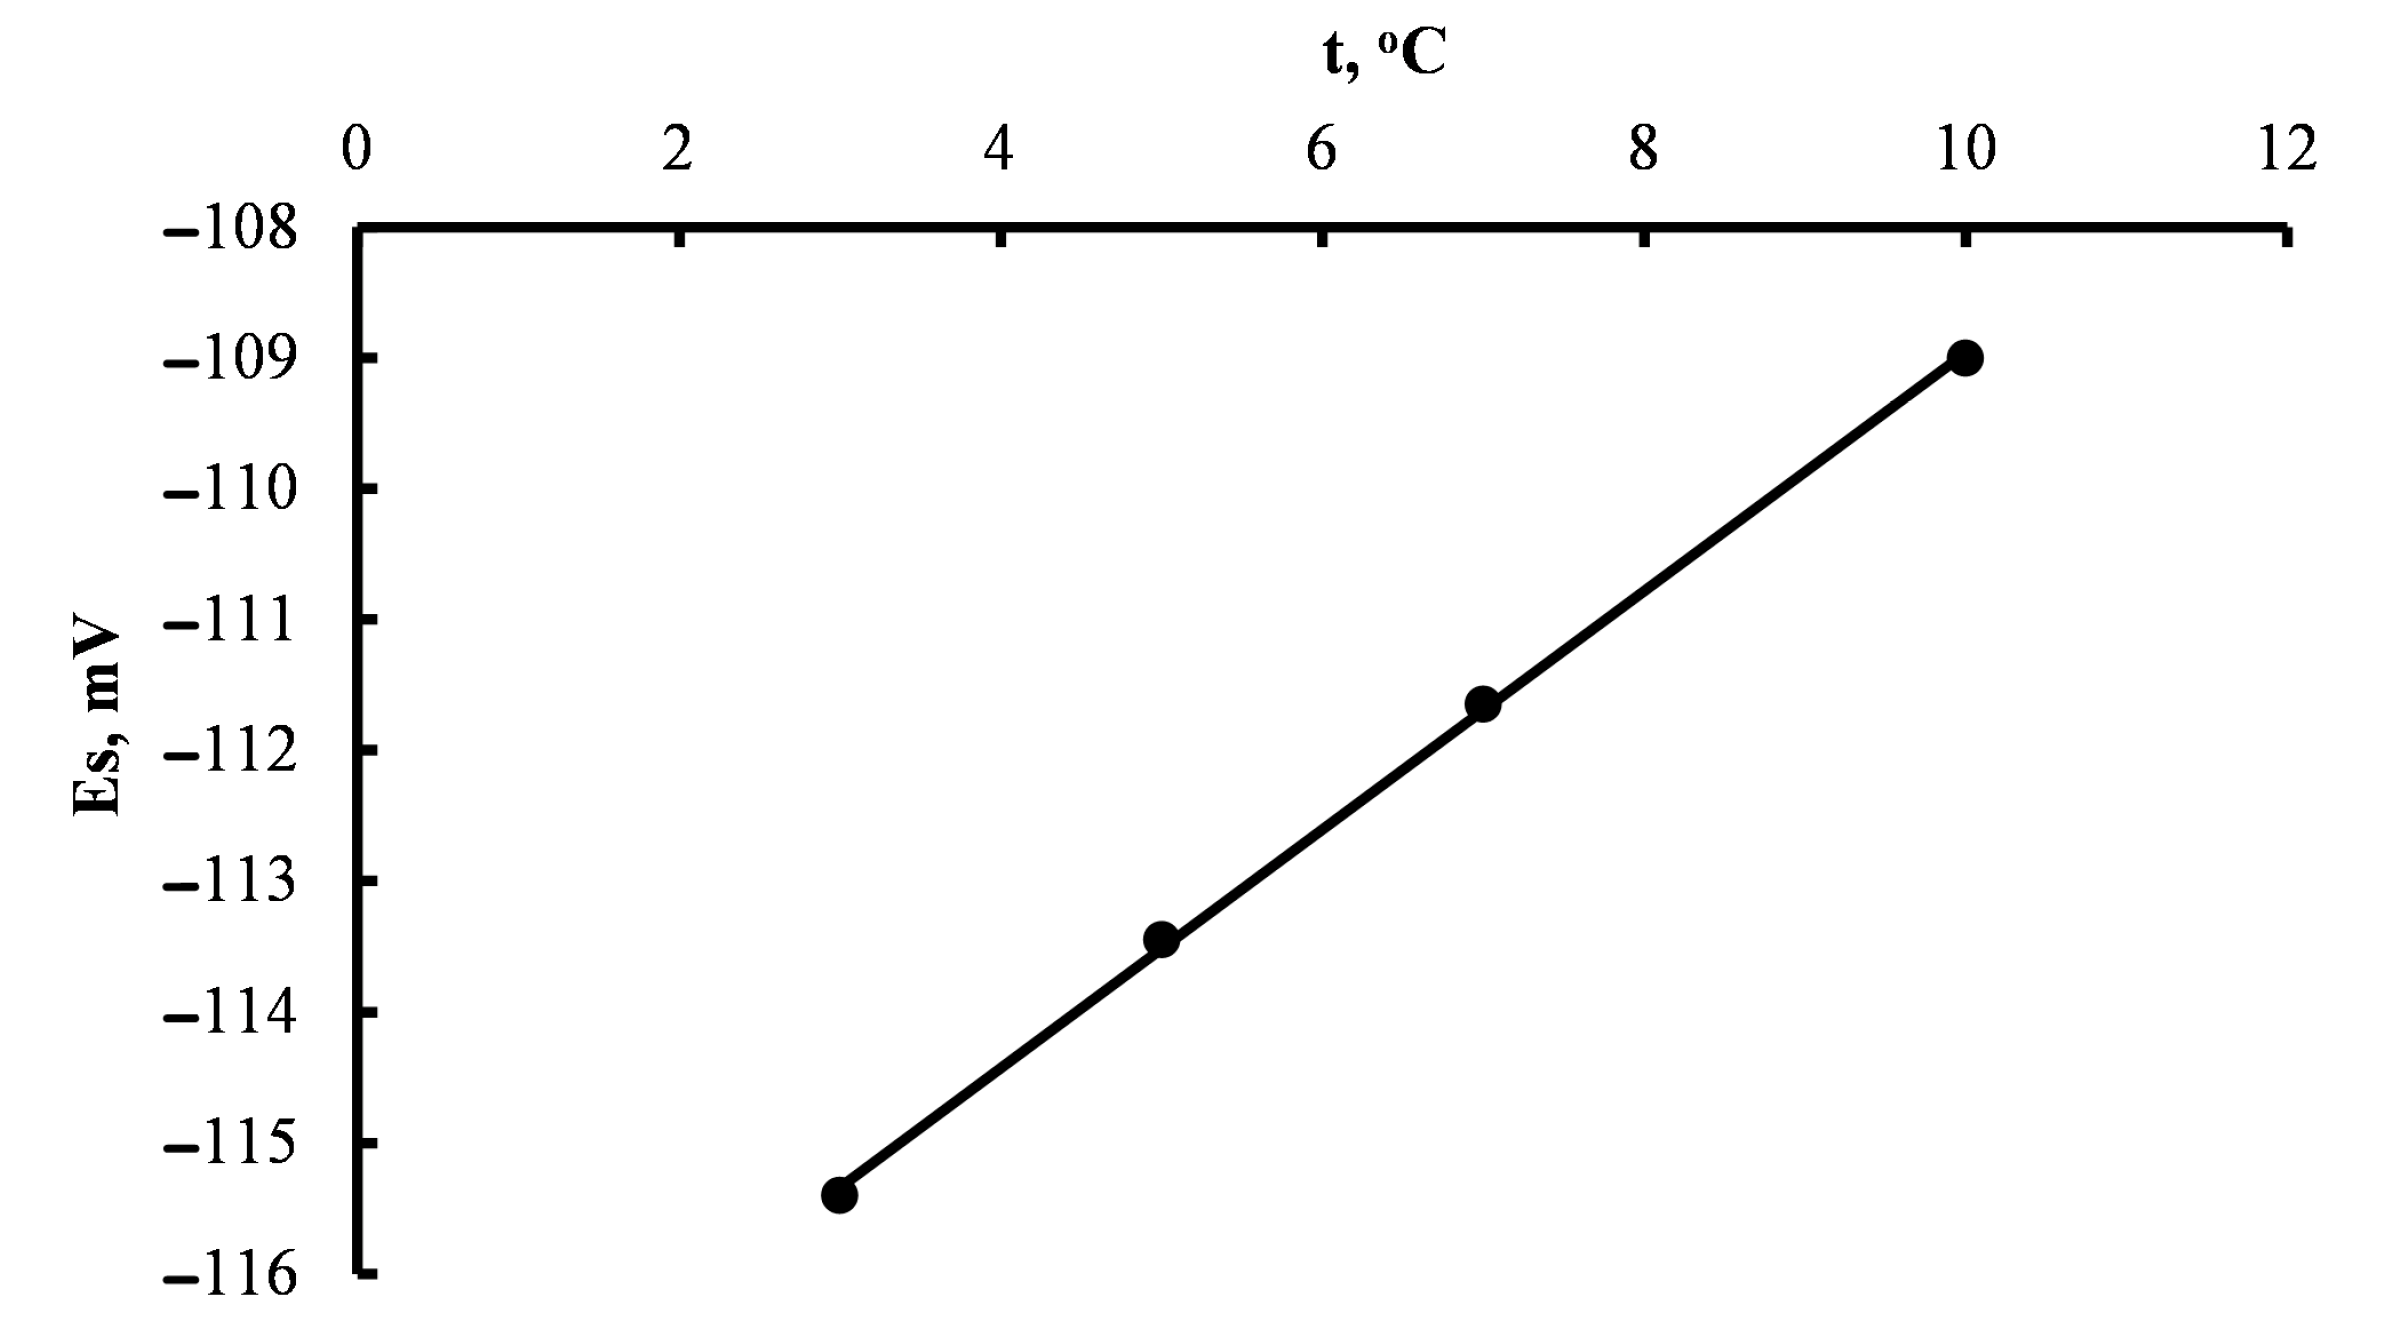
3. Methods
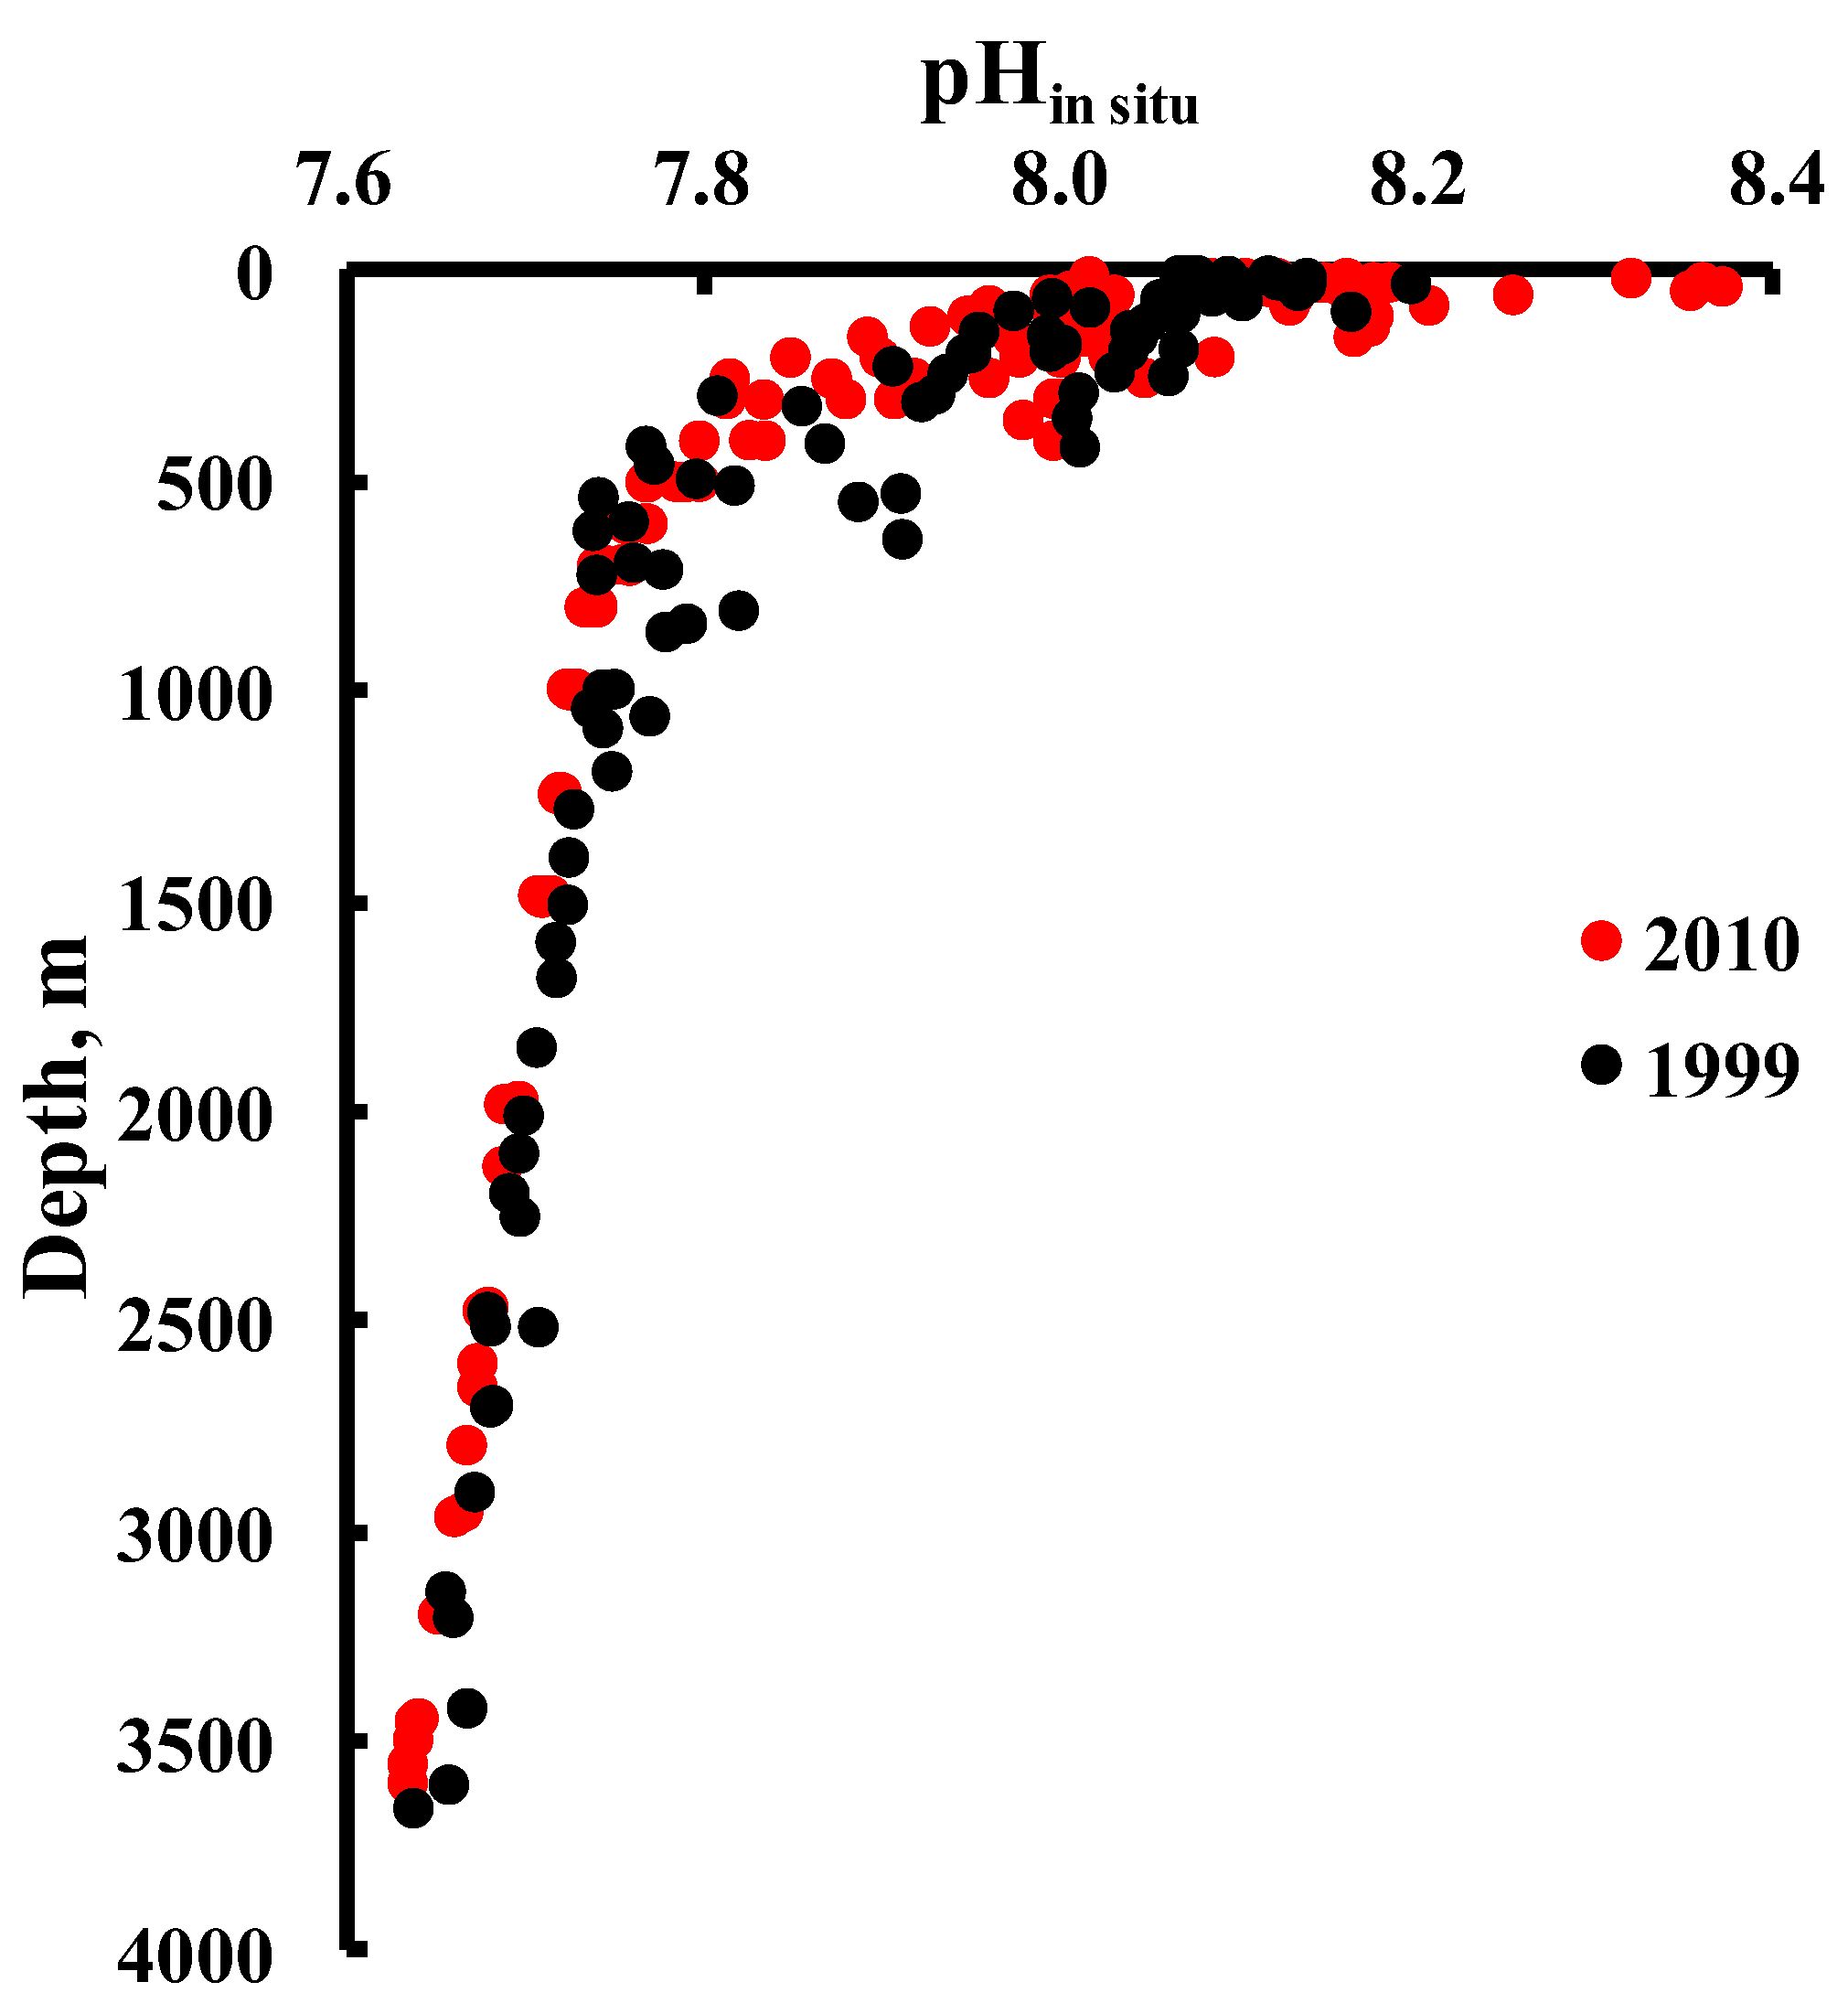
4. Results and Discussion
5. Summary and Concluding Remarks
Supplementary Materials
Author Contributions
Funding
Institutional Review Board Statement
Informed Consent Statement
Data Availability Statement
Acknowledgments
Conflicts of Interest
References
- Feely, R.A.; Sabine, C.L.; Lee, K.; Berelson, W.; Kleypas, J.; Fabry, V.J.; Millero, F.J. Impact of Anthropogenic CO2 on the CaCO3 System in the Oceans. Science 2004, 305, 362–366. [Google Scholar] [CrossRef]
- Sabine, C.L.; Feely, R.A.; Gruber, N.; Key, R.M.; Lee, K.; Bullister, J.L.; Wanninkhof, R.; Wong, C.S.; Wallace, D.W.R.; Tilbrook, B.; et al. The Oceanic Sink for Anthropogenic CO2. Science 2004, 305, 367–371. [Google Scholar] [CrossRef] [PubMed]
- Doney, S.C.; Fabry, V.J.; Feely, R.A.; Kleypas, J.A. Ocean Acidification: The Other CO2 Problem. Annu. Rev. Mar. Sci. 2009, 1, 169–192. [Google Scholar] [CrossRef] [PubMed]
- Orr, J.C.; Caldeira, K.; Fabry, V.; Gattuso, J.-P.; Haugen, P.; Lehodey, P.; Pantoja, S.; Pörtner, H.-O.; Riebesell, U.; Trull, T.; et al. Research Priorities for Understanding Ocean Acidification: Summary from the Second Symposium on the Ocean in a High-CO2 World. Oceanography 2009, 22, 182–189. [Google Scholar] [CrossRef]
- Doney, S.C. The Growing Human Footprint on Coastal and Open-Ocean Biogeochemistry. Science 2010, 328, 1512–1516. [Google Scholar] [CrossRef]
- Cai, W.-J.; Hu, X.; Huang, W.-J.; Murrell, M.C.; Lehrter, J.C.; Lohrenz, S.E.; Chou, W.-C.; Zhai, W.-D.; Hollibaugh, J.T.; Wang, Y.; et al. Acidification of subsurface coastal waters enhanced by eutrophication. Nat. Geosci. 2011, 4, 766–770. [Google Scholar] [CrossRef]
- Kim, T.-W.; Lee, K.; Feely, R.A.; Sabine, C.L.; Chen, C.-T.A.; Jeong, H.J.; Kim, K.Y. Prediction of Sea of Japan (East Sea) acidification over the past 40 years using a multiparameter regression model. Glob. Biogeochem. Cycles 2010, 24, GB3005. [Google Scholar] [CrossRef]
- Kim, J.-Y.; Kang, D.-J.; Lee, T.; Kim, K.-R. Long-term trend of CO2 and ocean acidification in the surface water of the Ulleung Basin, the East/Japan Sea inferred from the underway observational data. Biogeosciences 2014, 11, 2443–2454. [Google Scholar] [CrossRef]
- Chen, C.-T.A.; Lui, H.-K.; Hsieh, C.-H.; Yanagi, T.; Kosugi, N.; Ishii, M.; Gong, G.-C. Deep oceans may acidify faster than anticipated due to global warming. Nat. Clim. Chang. 2017, 7, 890–894. [Google Scholar] [CrossRef]
- Tishchenko, P.Y.; Lobanov, V.B.; Zvalinsky, V.I.; Sergeev, A.F.; Koltunov, A.; Mikhailik, T.A.; Tishchenko, P.P.; Shvetsova, M.G.; Sagalaev, S.; Volkova, T. Seasonal Hypoxia of Amursky Bay in the Japan Sea: Formation and Destruction. Terr. Atmosp. Ocean. Sci. 2013, 24, 1033–1050. [Google Scholar] [CrossRef]
- Tishchenko, P.Y.; Tishchenko, P.P.; Lobanov, V.B.; Mikhaylik, T.A.; Sergeev, A.F.; Semkin, P.Y.; Shvetsova, M.G. Impact of the transboundary Razdolnaya and Tumannaya Rivers on deoxygenation of the Peter the Great Bay (Sea of Japan). Estuar. Coast. Shelf Sci. 2020, 239, 106731. [Google Scholar] [CrossRef]
- Kim, I.-N.; Lee, K.; Gruber, N.; Karl, D.M.; Bullister, J.L.; Yang, S.; Kim, T.-W. Increasing anthropogenic nitrogen in the North Pacific Ocean. Science 2014, 346, 1102–1106. [Google Scholar] [CrossRef]
- Tishchenko, P.; Lobanov, V.; Kaplunenko, D.; Sagalaev, S.; Tishchenko, P. Acidification and Deoxygenation of the Northwestern Japan/East Sea. J. Mar. Sci. Eng. 2021, 9, 953. [Google Scholar] [CrossRef]
- Li, L.; Chen, B.; Luo, Y.; Xia, J.; Qi, D. Factors controlling acidification in intermediate and deep/bottom layers of the Japan/East Sea. J. Geophys. Res. Oceans 2022, 127, e2021JC017712. [Google Scholar] [CrossRef]
- Chen, C.-T.A.; Wang, S.-L.; Bychkov, A.S. Carbonate chemistry of the Sea of Japan. J. Geophys. Res. Oceans. 1995, 100, 13737–13745. [Google Scholar] [CrossRef]
- Oh, D.-C.; Park, M.-K.; Choi, S.-H.; Kang, D.-J.; Park, S.Y.; Hwang, J.S.; Andreev, A.; Hong, G.H.; Kim, K.-R. The Air-Sea Exchange of CO2 in the East Sea (Japan Sea). J. Oceanogr. 1999, 55, 157–169. [Google Scholar] [CrossRef]
- Talley, L.D.; Tishchenko, P.; Luchin, V.; Nedashkovskiy, A.; Sagalaev, S.; Kang, D.-J.; Warner, M.J.; Min, D.-H. Atlas of Japan (East) Sea hydrographic properties in summer, 1999. Prog. Oceanogr. 2004, 61, 277–348. [Google Scholar] [CrossRef]
- Park, G.-H.; Lee, K.; Tishchenko, P.; Min, D.-H.; Warner, M.J.; Talley, L.D.; Kang, D.-J.; Kim, K.-R. Large accumulation of antropogenic CO2 in the East (Japan) Sea and its significant impact on carbonate chemistry. Glob. Geochem. Cycles 2006, 20, GB4013. [Google Scholar] [CrossRef]
- Park, G.-H.; Lee, K.; Tishchenko, P. Sudden, considerable reduction in recent uptake of anthropogenic CO2 by the East/Japan Sea. Geophys. Res. Lett. 2008, 35, L23611. [Google Scholar] [CrossRef]
- Tishchenko, P.Y.; Pavlova, G.Y.; Shkirnikova, E.M. A new look at the alkalinity of the Sea of Japan. Oceanology 2012, 52, 21–33. [Google Scholar] [CrossRef]
- Chang, K.-I.; Zhang, C.-I.; Park, C.; Kang, D.-J.; Ju, S.-J.; Lee, S.-H.; Wimbush, M. (Eds.) Oceanography of the East Sea (Japan Sea); Springer: Cham, Switzerland; Berlin/Heidelberg, Germany; New York, NY, USA; Dordrecht, Germany; London, UK, 2016; 460p. [Google Scholar]
- Christian, J.R.; Ono, T. (Eds.) Ocean Acidification and Deoxygenation in the North Pacific Ocean; PICES Special Publication: Sidney, BC, Canada, 2019; Volume 5, 116p. [Google Scholar]
- Chen, T.-A.; Chen, X.G. Changing Asia-Pacific Marginal Seas; Springer Nature: Singapore, 2020; 320p. [Google Scholar]
- Tishchenko, P.Y.; Talley, L.D.; Lobanov, V.B.; Nedashkovskii, A.P.; Pavlova, G.Y.; Sagalaev, S.G. The influence of geochemical processes in the near-bottom layer on the hydrochemical characteristics of the waters of the Sea of Japan. Oceanology 2007, 47, 350–359. [Google Scholar] [CrossRef]
- Tamaki, K.; Pisciotto, K.; Allan, J. (Eds.) Background, Objectives, and Principal Results, ODP Leg 127, Japan Sea; Proc. ODP, Init. Repts.; Ocean Drilling Program: College Station, TX, USA, 1990; Volume 127, pp. 5–33. [Google Scholar] [CrossRef]
- Ingle, J.C., Jr.; Suyehiro, K.; von Breymann, M.T. (Eds.) Shipboard Scientific Party. Introduction, Background, and Principal Results of Leg 128 of the Ocean Drilling Program, Japan Sea; Proc. ODP, Init. Repts.; Ocean Drilling Program: College Station, TX, USA, 1990; Volume 128, pp. 5–38. [Google Scholar] [CrossRef]
- Hong, W.-L.; Torres, M.E.; Kim, J.-H.; Choi, J.; Bahk, J.-J. Carbon cycling within the sulfate-methane-transition-zone in marine sediments from the Ulleung Basin. Biogeochemistry 2013, 115, 129–148. [Google Scholar] [CrossRef]
- Emerson, S.R.; Archer, D. Calcium carbonate preservation in the ocean. Philos. Trans. R. Soc. Lond. 1990, 331, 29–40. [Google Scholar] [CrossRef]
- Broecker, W.S. The Oceanic CaCO3 Cycle. Treatise Geochem. 2003, 6, 529–549. [Google Scholar]
- Murray, J.W.; Emerson, S.; Jahnke, R. Carbonate saturation and the effect of pressure on the alkalinity of interstitial waters from the Guatemala Basin. Geochim. Cosmochim. Acta 1980, 44, 963–972. [Google Scholar] [CrossRef]
- Archer, D.; Emerson, S.; Reimers, C. Dissolution of calcite in deep-sea sediments: pH and O2 microelectrode results. Geochim. Cosmochim. Acta 1989, 53, 2831–2845. [Google Scholar] [CrossRef]
- Cai, W.-J.; Reimers, C.E. The development of pH and pCO2 microelectrodes for studying the carbonate chemistry of pore waters near the sediment-water interface. Limnol. Oceanogr. 1993, 38, 1762–1773. [Google Scholar] [CrossRef]
- Berner, R.A.; Scott, M.R.; Thomlinson, C. Carbonate alkalinity in the pore waters of anoxic marine sediments. Limnol. Oceanogr. 1970, 15, 544–549. [Google Scholar] [CrossRef]
- Gieskis, J.M.; Rogers, W.C. Alkalinity determination in interstitial waters. J. Sed. Res. 1973, 43, 272–277. [Google Scholar]
- Morse, J.W. The carbonate chemistry of North Atlantic Ocean deep-sea sediment pore water. In The Fate of Fossil Fuel CO2 in the Oceans; Andersen, N.R., Malakhoff, A., Eds.; Plenum Press: New York, NY, USA; London, UK, 1977; pp. 323–343. [Google Scholar]
- Shao, C.; Sui, Y.; Tang, D.; Legendre, L. Spatial variability of surface-sediment porewater pH and related water-column characteristics in deep waters of the northern South China Sea. Prog. Oceanogr. 2016, 149, 134–144. [Google Scholar] [CrossRef]
- Talley, L.; Min, D.H.; Lobanov, V.; Luchin, V.B.; Ponomarev, V.I.; Salyuk, A.N.; Shcherbina, A.; Tishchenko, P.; Zhabin, I. Japan/East Sea Water Masses and their Relation to the Sea’s Circulation. Oceanography 2006, 19, 33–49. [Google Scholar] [CrossRef]
- Konovalova, G.V.; Orlova, T.Y.; Pautova, L.A. Atlas of Phytoplankton of the Sea of Japan; Nauka: Leningrad, Russia, 1989; p. 160. (In Russian) [Google Scholar]
- Ashjian, C.J.; Davis, C.S.; Gallager, S.M.; Alatalo, P. Characterization of the Zooplankton Community, Size Composition, and Distribution in Relation to Hydrography in the Japan/East Sea. Deep Sea Res. Part II Top. Stud. Oceanogr. 2005, 52, 1363–1392. [Google Scholar] [CrossRef]
- Repechka, M.A. The recent Japan Sea bottom deposits. In Problems in Geology of the Seafloor of the Japan Sea; Academy USSR, Far Eastern Scientific Centre: Vladivostok, Russia, 1973; pp. 66–90. (In Russian) [Google Scholar]
- Niino, H.; Emery, K.O.; Kim, C.M. Organic carbon in sediments of Japan Sea. J. Sed. Res. 1969, 39, 1390–1398. [Google Scholar]
- Tsunogai, S.; Nishimura, M.; Nakaya, S. Complexometric titration of calcium in the presence of larger amounts of magnesium. Talanta 1968, 15, 385–390. [Google Scholar] [CrossRef]
- Grasshoff, K.; Ehrhardt, M.; Kremling, K. (Eds.) Methods of Seawater Analysis, 2nd ed.; Chemie: Weinheim, Germany; Deerfield Beach, FL, USA; Basel, Switzerland, 1983; pp. 150–157. [Google Scholar]
- Pavlova, G.Y.; Tishchenko, P.Y.; Volkova, T.I.; Dickson, A.; Wallmann, K. The intercalibration of measurement techniques for total alkalinity in seawater. Oceanology 2008, 48, 460–465. [Google Scholar] [CrossRef]
- Wallmann, K.; Aloisi, G.; Haeckel, M.; Obzhirov, A.; Pavlova, G.; Tishchenko, P. Kinetics of organic matter degradation, microbial methane generation, and gas hydrate formation in anoxic marine sediments. Geochim. Cosmochim. Acta 2006, 70, 3905–3927. [Google Scholar] [CrossRef]
- Dickson, A.G.; Afghan, J.D.; Anderson, G.C. Reference materials for oceanic CO2 analysis: A method for the certification of total alkalinity. Mar. Chem. 2003, 80, 185–197. [Google Scholar] [CrossRef]
- Tishchenko, P.Y.; Wong, C.S.; Pavlova, G.Y.; Johnson, W.K.; Kang, D.-J.; Kim, K.-R. pH measurements of seawater by means of cell without liquid Junction. Oceanology 2001, 41, 849–859. [Google Scholar]
- Tishchenko, P.Y.; Kang, D.-J.; Chichkin, R.V.; Lazaryuk, A.Y.; Wong, C.S.; Johnson, W.K. Application of potentiometric method using a cell without liquid junction to underway pH measurements in surface seawater. Deep Sea Res. Part I Oceanogr. Res. Pap. 2011, 58, 778–786. [Google Scholar] [CrossRef]
- Pitzer, K.S. Theory: Ion interaction approach. In Activity Coefficients in Electrolyte Solutions; Pytkowicz, R.M., Ed.; CRC Press: Boca Raton, FL, USA, 1979; Volume 1, pp. 157–208. [Google Scholar]
- Pitzer, K.S. Ionic interaction approach: Theory and data correlation. In Activity Coefficients in Electrolyte Solutions, 2nd ed.; Pitzer, K.S., Ed.; CRC Press: Roca Raton, FL, USA; Ann Arbor, MI, USA; Boston, MA, USA; London, UK, 1991; pp. 75–153. [Google Scholar]
- Dickson, A.G. pH buffers for sea water media based on the total hydrogen ion concentration scale. Deep Sea Res. Part I Oceanogr. Res. Pap. 1993, 40, 107–118. [Google Scholar] [CrossRef]
- Clegg, S.L.; Whitfield, M. Activity coefficients in natural waters. In Activity Coefficients in Electrolyte Solutions; CRC Press: Roca Raton, FL, USA; Ann Arbor, MI, USA; Boston, MA, USA; London, UK, 1991; pp. 279–434. [Google Scholar]
- Dickson, A. An exact definition of total alkalinity and a procedure for the estimation of alkalinity and total inorganic carbon from titration data. Deep Sea Res. Part A. Oceanogr. Res. Pap. 1981, 28, 609–623. [Google Scholar] [CrossRef]
- Ben-Yaakov, S. A method for calculating the in situ pH of seawater. Limnol. Oceanogr. 1970, 15, 326–328. [Google Scholar] [CrossRef]
- Millero, F.J. Thermodynamics of the carbon dioxide system in the oceans. Geochim. Cosmochim. Acta 1995, 59, 661–677. [Google Scholar] [CrossRef]
- Dickson, A.G.; Sabine, C.L.; Christian, J.R. (Eds.) Guide to Best Practices for Ocean CO2 Measurements; PICES Special Publication: Sidney, BC, Canada, 2007; Volume 3, p. 191. [Google Scholar]
- Sarmiento, J.L.; Gruber, N. Ocean Biogeochemical Dynamics; Princeton University Press: Princeton, NJ, USA, 2013. [Google Scholar]
- Brewer, P.; Wong, G.; Bacon, M.; Spencer, D.W. An oceanic calcium problem? Earth Planet. Sci. Lett. 1975, 26, 81–87. [Google Scholar] [CrossRef]
- Redfield, A.C.; Ketchum, B.H.; Richards, F.A. The influence of organisms on the composition of sea-water. In The Composition of Seawater: Comparative and Descriptive Oceanography; Hill, M.N., Ed.; The Sea Interscience: New York, NY, USA, 1963; Volume 2, pp. 26–77. [Google Scholar]
- Lobanov, V.B.; Ponomarev, V.I.; Salyuk, A.N.; Tishchenko, P.Y.; Talley, L.D. Structure and dynamics of synoptic scale eddies in the northern Japan Sea. In Far Eastern Seas of Russia; Oceanographic Research; Nauka: Moscow, Russia, 2007; Volume 1, pp. 450–473. (In Russian) [Google Scholar]
- Gamo, T.; Nozaki, Y.; Sakai, H.; Nakai, T.; Tsubota, H. Spatial and temporal variations of water characteristics in the Japan Sea bottom layers. J. Mar. Res. 1986, 44, 781–793. [Google Scholar] [CrossRef]
- Chen, C.T.A.; Feely, R.A.; Gendron, J.F. Lysocline, Calcium Carbonate Compensation Depth and Calcareou Sediments in the North Pacific Ocean. Pac. Sci. 1988, 42, 237–252. [Google Scholar]
- Ichikura, M.; Ujiie, H. Lithology and planktonic foraminifera of the Sea of Japan piston cores. Bull. Nat. Sci. Mus. Ser. C 1976, 2, 151–182. [Google Scholar]
- Cha, H.J. Distribution of chemical elements in sediments. In Oceanography of the East Sea (Japan Sea); Springer: Berlin/Heidelberg, Germany, 2016; Chapter 9; pp. 201–215. [Google Scholar]
- Brzezinski, M.A. The Si:C:N ratio of marine diatoms: Interspecific variability and the effect of some environmental variables. J. Phycol. 1985, 21, 347–357. [Google Scholar] [CrossRef]
- Froelich, P.N.; Klinkhammer, G.P.; Bender, M.L.; Luedtke, N.A.; Heath, G.R.; Cullen, D.; Dauphin, P.; Hammond, D.; Hartman, B.; Maynard, V. Early oxidation of organic matter in pelagic sediments of the eastern equatorial Atlantic: Suhoxic dia-genesis. Geochim. Cosmochim. Acta 1979, 43, 1075–1090. [Google Scholar] [CrossRef]
- Emerson, S.; Jahnke, R.; Bender, M.; Froelich, P.; Klinkhammer, G.; Bowser, C.; Setlock, G. Earley diagenesis in sediments from the Eastern Equatorial Pacific. I. Pore water nutrient and carbonate results. Earth Planet. Sci. Lett. 1980, 49, 57–80. [Google Scholar] [CrossRef]
- Middelburg, J.J.; Levin, L.A. Coastal hypoxia and sediment biogeochemistry. Biogeosciences 2009, 6, 1273–1293. [Google Scholar] [CrossRef]
- Boudreau, B.P.; E Canfield, D. A comparison of closed- and open-system models for porewater pH and calcite-saturation state. Geochim. Cosmochim. Acta 1993, 57, 317–334. [Google Scholar] [CrossRef]
- Gazeau, F.; van Rijswijk, P.; Pozzato, L.; Middelburg, J.J. Impacts of Ocean Acidification on Sediment Processes in Shallow Waters of the Arctic Ocean. PLoS ONE 2014, 9, e94068. [Google Scholar] [CrossRef] [PubMed][Green Version]
- Rassmann, J.; Lansard, B.; Gazeau, F.; Guidi-Guilvard, L.; Pozzato, L.; Alliouane, S.; Grenz, C.; Rabouille, C. Impact of ocean acidification on the biogeochemistry and meiofaunal assemblage of carbonate-rich sediments: Results from core incubations (Bay of Villefranche, NW Mediterranean Sea). Mar. Chem. 2018, 203, 102–119. [Google Scholar] [CrossRef]
- Berner, R.A. Early Diagenesis. A Theoretical Approach; Princeton University Press: Princeton, NJ, USA, 1980; p. 241. [Google Scholar]
- Schults, H.D. Quantification of Early Diagenesis: Dissolved Constituents in Marine Pore Water. In Marine Geochemistry, 2nd ed.; Horst, D., Schulz, M.Z., Eds.; Springer: Berlin/Heidelberg, Germany; New York, NY, USA, 2006; pp. 75–124. [Google Scholar]
- Ben-Yaakov, S.; Goldhaber, M.B. The influence of sea water composition on the apparant constants of the carbonate system. Deep. Sea Res. Oceanogr. Abstr. 1973, 20, 87–99. [Google Scholar] [CrossRef]
- Pytkowicz, R.M. Activity coefficients of bicarbonates and carbonates in seawater. Lymnol. Oceanogr. 1975, 20, 971–975. [Google Scholar] [CrossRef]
- Dickson, A.G.; Millero, F.J. A comparison of the equilibrium constants for the dissociation of carbonic acid in seawater media. Deep-Sea Res. 1987, 34, 1733–1743. [Google Scholar] [CrossRef]
- Harvie, C.E.; Moller, N.; Weare, J.H. The prediction of mineral solubilities in natural waters: The Na-K-Mg-Ca-H-Cl-SO4-OH-HCO3-CO3-CO2-H2O system to high ionic strengths at 25 °C. Geochim. Cosmochim. Acta 1984, 48, 723–751. [Google Scholar] [CrossRef]
- Pabalan, R.T.; Pitzer, K.S. Thermodynamics of concentrated electrolyte mixtures and the prediction of mineral solubilities to high temperatures in the Na-K-Mg-Cl-SO4-OH-H2O. Geochim. Cosmochim. Acta 1987, 51, 2429–2443. [Google Scholar] [CrossRef]
- Millero, F.J.; Pierrot, D. A chemical model for natural waters. Aquatic Geochem. 1998, 4, 153–199. [Google Scholar] [CrossRef]
- Pitzer, K.S. Thermodynamics of electrolytes. I Theoretical basis and general equation. J. Phys. Chem. 1973, 77, 268–277. [Google Scholar] [CrossRef]
- Whitfield, M. The extension of chemical models for sea water to include trace components at 25 C and 1 atm pressure. Geochim. Cosmochim. Acta 1975, 39, 1545–1557. [Google Scholar] [CrossRef]
- Pitzer, K.S.; Silvester, L.F. Thermodynamics of electrolytes. VI. Weak electrolytes including H3PO4. J. Soln. Chem. 1976, 5, 269–278. [Google Scholar] [CrossRef]
- Plummer, L.N.; Busenberg, E. The solubility of calcite, aragonite and vaterite in CO2-H2O solutions between 0 and 90 C, and an evaluation of the aqueous model for the system CaCO3-CO2-H2O. Geochim. Cosmochim. Acta 1982, 46, 1011–1040. [Google Scholar] [CrossRef]
- Drever, J.I. The magnesium problem. In The Sea; Goldberg, E.D., Ed.; John Wiley & Sons: New York, NY, USA; London, UK; Sydney, Austalia; Toronto, ON, Canada, 1974; Volume 5, pp. 337–357. [Google Scholar]
- Gieskes, J.M. The chemistry of interstitial waters of deep sea sediments: Interpretation of deep sea drilling data. In Chemical Oceanography; Riley, J.P., Chester, R., Eds.; Academic Press: London, UK; New York, NY, USA, 1983; Volume 8, pp. 222–269. [Google Scholar]
- Aloisi, G.; Wallmann, K.; Bollwerk, S.M.; Derkachev, A.; Bohrmann, G.; Suess, E. The effect of dissolved barium on biogeochemical processes at cold seeps. Geochim. Cosmochim. Acta 2004, 68, 1735–1748. [Google Scholar] [CrossRef]
- Pitzer, K.S.; Peiper, J.C.; Busey, R.H. Thermodynamic properties of aqueous sodium chloride solutions. J. Phys. Chem. Ref. Data 1984, 13, 1–102. [Google Scholar] [CrossRef]
- Peiper, J.C.; Pitzer, K.S. Thermodynamics aqueous carbonate solutions including mixtures of sodium carbonate, bicarbonate and chloride. J. Chem. Thermodyn. 1982, 14, 613–638. [Google Scholar] [CrossRef]
- Marion, G.M. Carbonate mineral solubility at low temperatures in the Na-K-Mg-Ca-Cl-H-SO4-OH-HCO3-CO3-CO2-H2O system. Geochim. Cosmochim. Acta 2001, 65, 1883–1896. [Google Scholar] [CrossRef]
- De Lima, M.C.P.; Pitzer, K.S. Thermodynamics of saturated electrolyte mixtures of NaCl with Na2SO4 and MgCl2. J. Soln. Chem. 1983, 12, 187–201. [Google Scholar] [CrossRef][Green Version]
- Phutela, R.C.; Pitzer, K.S. Heat capacity and other thermodynamic properties of aqueous magnesium sulfates. J. Phys. Chem. 1986, 90, 895–901. [Google Scholar] [CrossRef]
- Pitzer, K.S.; Olsen, J.; Simonson, J.M.; Roy, R.N.; Gibbons, J.J.; Rowe, L. Thermodynamics of magnesium and calcium bicarbonates and mixtures with chloride. J. Chem. Eng. Data 1985, 30, 14–17. [Google Scholar] [CrossRef]
- Holmes, H.F.; Mesmer, R.E. Thermodynamic properties of aqueous solutions of the alkali metal chlorides to 250 °C. J. Phys. Chem. 1983, 87, 1242–1254. [Google Scholar] [CrossRef]
- Holmes, H.F.; Mesmer, R.E. Thermodynamics of aqueous solutions of the alkali metal sulfates. J. Soln. Chem. 1986, 15, 495–518. [Google Scholar] [CrossRef]
- Roy, R.N.; Gibbons, J.J.; Wood, M.D.; Williams, R.W. The first ionization of carbonic acid in aqueous solutions of potassium chloride including the activity coefficients of potassium bicarbonate. J. Chem. Thermodyn. 1983, 15, 37–47. [Google Scholar] [CrossRef]
- Greenberg, J.P.; Moller, N. The prediction of miniral solubilities in natural waters. A chemical equilibrium model for the Na-K-Ca-SO4-H2O system to high concentration from 0 to 250 °C. Geochim. Cosmochim. Acta 1989, 53, 2503–2518. [Google Scholar] [CrossRef]
- Harned, H.; Davis, R. The ionization constant of carbonic acid in water and the solubility of carbon dioxide in water and aqueous salt solutions from 0 to 50°. J. Am. Chem. Soc. 1943, 65, 2030–2037. [Google Scholar] [CrossRef]
- He, S.; Morse, J.W. The carbonic acid system and calcite solubility in aqueous Na-K-Ca-Mg-Cl-SO4 solutions from 0 to 90 °C. Geochim. Cosmochim. Acta 1993, 57, 3533–3554. [Google Scholar] [CrossRef]
- Wong, C.S.; Tishchenko, P.Y.; Johnson, W.K. Solubility of Carbon Dioxide in Aqueous HCl and NaHCO3 Solutions from 278 to 298 K. J. Chem. Eng. Data 2005, 50, 817–821. [Google Scholar] [CrossRef]


| Depth | Rate (1) | SD (1) | Rate (2) | SD (2) |
|---|---|---|---|---|
| 750 | −0.0030 | 0.00035 | −0.0038 | 0.0010 |
| 1250 | −0.0018 | 0.00019 | −0.0017 | 0.0005 |
| 1750 | −0.0009 | 0.00012 | −0.0010 | 0.0004 |
| 2250 | −0.0006 | 0.00015 | −0.0006 | 0.0002 |
| 3000 | −0.0007 | 0.00016 | −0.0011 | 0.0003 |
| St | a | b | n | R2 | ao |
|---|---|---|---|---|---|
| CR02 | −860.3 | 1.373 | 4 | 0.89 | −44 |
| CR14 | −47.4 | 1.044 | 15 | 0.99 | −40 |
| CR34 | 68.8 | 0.980 | 9 | 0.94 | −32 |
| CR41 | −110.2 | 1.079 | 17 | 0.99 | −45 |
| CR47 | 84.0 | 0.978 | 9 | 0.997 | −40 |
| CR58 | −536.1 | 1.230 | 6 | 0.85 | −40 |
Publisher’s Note: MDPI stays neutral with regard to jurisdictional claims in published maps and institutional affiliations. |
© 2022 by the authors. Licensee MDPI, Basel, Switzerland. This article is an open access article distributed under the terms and conditions of the Creative Commons Attribution (CC BY) license (https://creativecommons.org/licenses/by/4.0/).
Share and Cite
Tishchenko, P.; Zhang, J.; Pavlova, G.; Tishchenko, P.; Sagalaev, S.; Shvetsova, M. Revisiting the Carbonate Chemistry of the Sea of Japan (East Sea): From Water Column to Sediment. J. Mar. Sci. Eng. 2022, 10, 438. https://doi.org/10.3390/jmse10030438
Tishchenko P, Zhang J, Pavlova G, Tishchenko P, Sagalaev S, Shvetsova M. Revisiting the Carbonate Chemistry of the Sea of Japan (East Sea): From Water Column to Sediment. Journal of Marine Science and Engineering. 2022; 10(3):438. https://doi.org/10.3390/jmse10030438
Chicago/Turabian StyleTishchenko, Pavel, Jing Zhang, Galina Pavlova, Petr Tishchenko, Sergey Sagalaev, and Mariya Shvetsova. 2022. "Revisiting the Carbonate Chemistry of the Sea of Japan (East Sea): From Water Column to Sediment" Journal of Marine Science and Engineering 10, no. 3: 438. https://doi.org/10.3390/jmse10030438
APA StyleTishchenko, P., Zhang, J., Pavlova, G., Tishchenko, P., Sagalaev, S., & Shvetsova, M. (2022). Revisiting the Carbonate Chemistry of the Sea of Japan (East Sea): From Water Column to Sediment. Journal of Marine Science and Engineering, 10(3), 438. https://doi.org/10.3390/jmse10030438