Article

Hydrogen Sulfide Production with a Microbial Consortium Isolated from Marine Sediments Offshore

by
Roberto Briones-Gallardo
1,
Muriel González-Muñoz
2,
Itza García-Bautista
2,
David Valdés-Lozano
3,
Tanit Toledano-Thompson
2,
Erik Polanco-Lugo
4,
Renata Rivera-Madrid
5 and
Ruby Valdez-Ojeda
2,*
1
Instituto de Metalurgia-Facultad de Ingeniería, Universidad Autónoma de San Luis Potosí, Sierra Leona 550, San Luis Potosí C.P. 78280, San Luis Potosí, Mexico
2
Unidad Energía Renovable, Centro de Investigación Científica de Yucatán, Carretera Sierra Papacal-Chuburná Puerto, Sierra Papacal C.P. 97302, Yucatán, Mexico
3
Unidad Mérida, Centro de Investigación y de Estudios Avanzados, Mérida C.P. 97205, Yucatán, Mexico
4
Facultad de Veterinaria y Zootecnia, Universidad Autónoma de Yucatán, Carretera Mérida-Xmatkuil, Mérida C.P. 97100, Yucatán, Mexico
5
Unidad de Bioquímica y Biología Molecular de Plantas, Centro de Investigación Científica de Yucatán, Mérida C.P. 97205, Yucatán, Mexico
*
Author to whom correspondence should be addressed.
J. Mar. Sci. Eng. 2022, 10(3), 436; https://doi.org/10.3390/jmse10030436
Submission received: 15 February 2022 / Revised: 12 March 2022 / Accepted: 14 March 2022 / Published: 17 March 2022
(This article belongs to the Special Issue Regulation and Action Mechanism of Marine Microorganisms in Ecosystem)

Abstract

:
Hydrogen, electric energy production, and metal toxic bioremediation are some of the biotechnological applications of sulfate-reducing organisms, which potentially depend on the sulfide produced. In this study, offshore of Yucatan, the capacity to produce hydrogen sulfide using microbial consortia from marine sediment (SC469, PD102, SD636) in batch reactors was evaluated. Kinetic tests were characterized by lactate oxidation to acetate, propionate, CO2 and methane. The inoculum SC469, located in open-ocean, differed strongly in microbial diversity and showed better performance in substrate utilization with the highest hydrogen sulfide production (246 mmolg−1 VSS) at a specific hydrogen sulfide rate of 113 mmol g−1 VSS d−1 with a 0.79 molar ratio of sulfate/lactate. Sulfate-reducing microbial consortia enriched in the laboratory from marine sediments collected offshore in Yucatan and with a moderate eutrophication index, differed strongly in microbial diversity with loss of microorganisms with greater capacity for degradation of organic macromolecules. The sulfate-reducing microorganisms were characterized using Illumina MiSeq technology and were mainly Desulfomicrobium, Clostridium and Desulfobacter.

1. Introduction

Renewable and clean forms of energy have emerged in response to the fossil fuel crisis and all its consequences [1]. In this context, solar-based hydrogen production from hydrogen sulfide is a promising new, eco-friendly and economically viable technique for obtaining hydrogen [2].
Sulfate-reducing organisms (SRB), anaerobic bacteria and archaea microorganisms offer a natural source of sulfide, which occurs when these microorganisms perform sulfate reduction by transferring electrons resulting from the oxidation of organic matter in the marine environment, thus producing free hydrogen sulfide [3,4]. Biotechnological use of microbial SRB consortia is diverse with successful results, such as energy generation in microbial fuel cells [5,6] or in bioremediation processes for the treatment of acidic effluents containing heavy metals, toluene, and organic wastes [7,8,9]. In the applications mentioned, success depends on the production of biogenic hydrogen sulfide because it can be used as an electron donor for nitrogen removal (autotrophic denitrification), as in the autotrophic denitrification and nitrification-integrated (SANI) process [8,10] or as an agent for metal precipitation [11]. Furthermore, when the sulfide is oxidized to elemental sulfur, this can be used as a raw material for sulfuric acid production, or it could be used as an electron donor during the biostabilization of toxic metals present in soils and the sediments impacted by them [12].
The microbial community structures of hydrogen sulfide-producers were analyzed by 16S rDNA sequencing [13,14,15,16], Proteobacteria being the dominant phyla in acidogenic sulfate-reducing bioreactors fed with lactate [17]. However, some of these studies only provided restricted microbial community information and the rare microorganisms identified, although they may play important roles, are generally not detected by conventional molecular biology methods [18,19]. Considering the shortcomings of conventional technologies, more sensitive technologies are needed to capture less abundant bacteria that may play important roles that contribute to hydrogen sulfide production [20]. As such, the microbial community was conveniently researched by high-throughput sequencing [21], revealing notable differences between the communities [22].
In this study, we enriched indigenous hydrogen sulfide-producer microbiota from the sediment of unexplored sites located in the open-ocean and offshore, in Yucatan, Mexico, with different grades of eutrophication and defined kinetic sulfide production tests in batch systems. Samples in batch reactors enriched with sediment of different site, were taken to investigate the changes on microbial community structure with high-throughput sequencing techniques. These techniques allowed us to identify bacterial communities of marine sediments with the potential to produce hydrogen sulfide from bioreactors using lactate as electron donors.

2. Materials and Methods

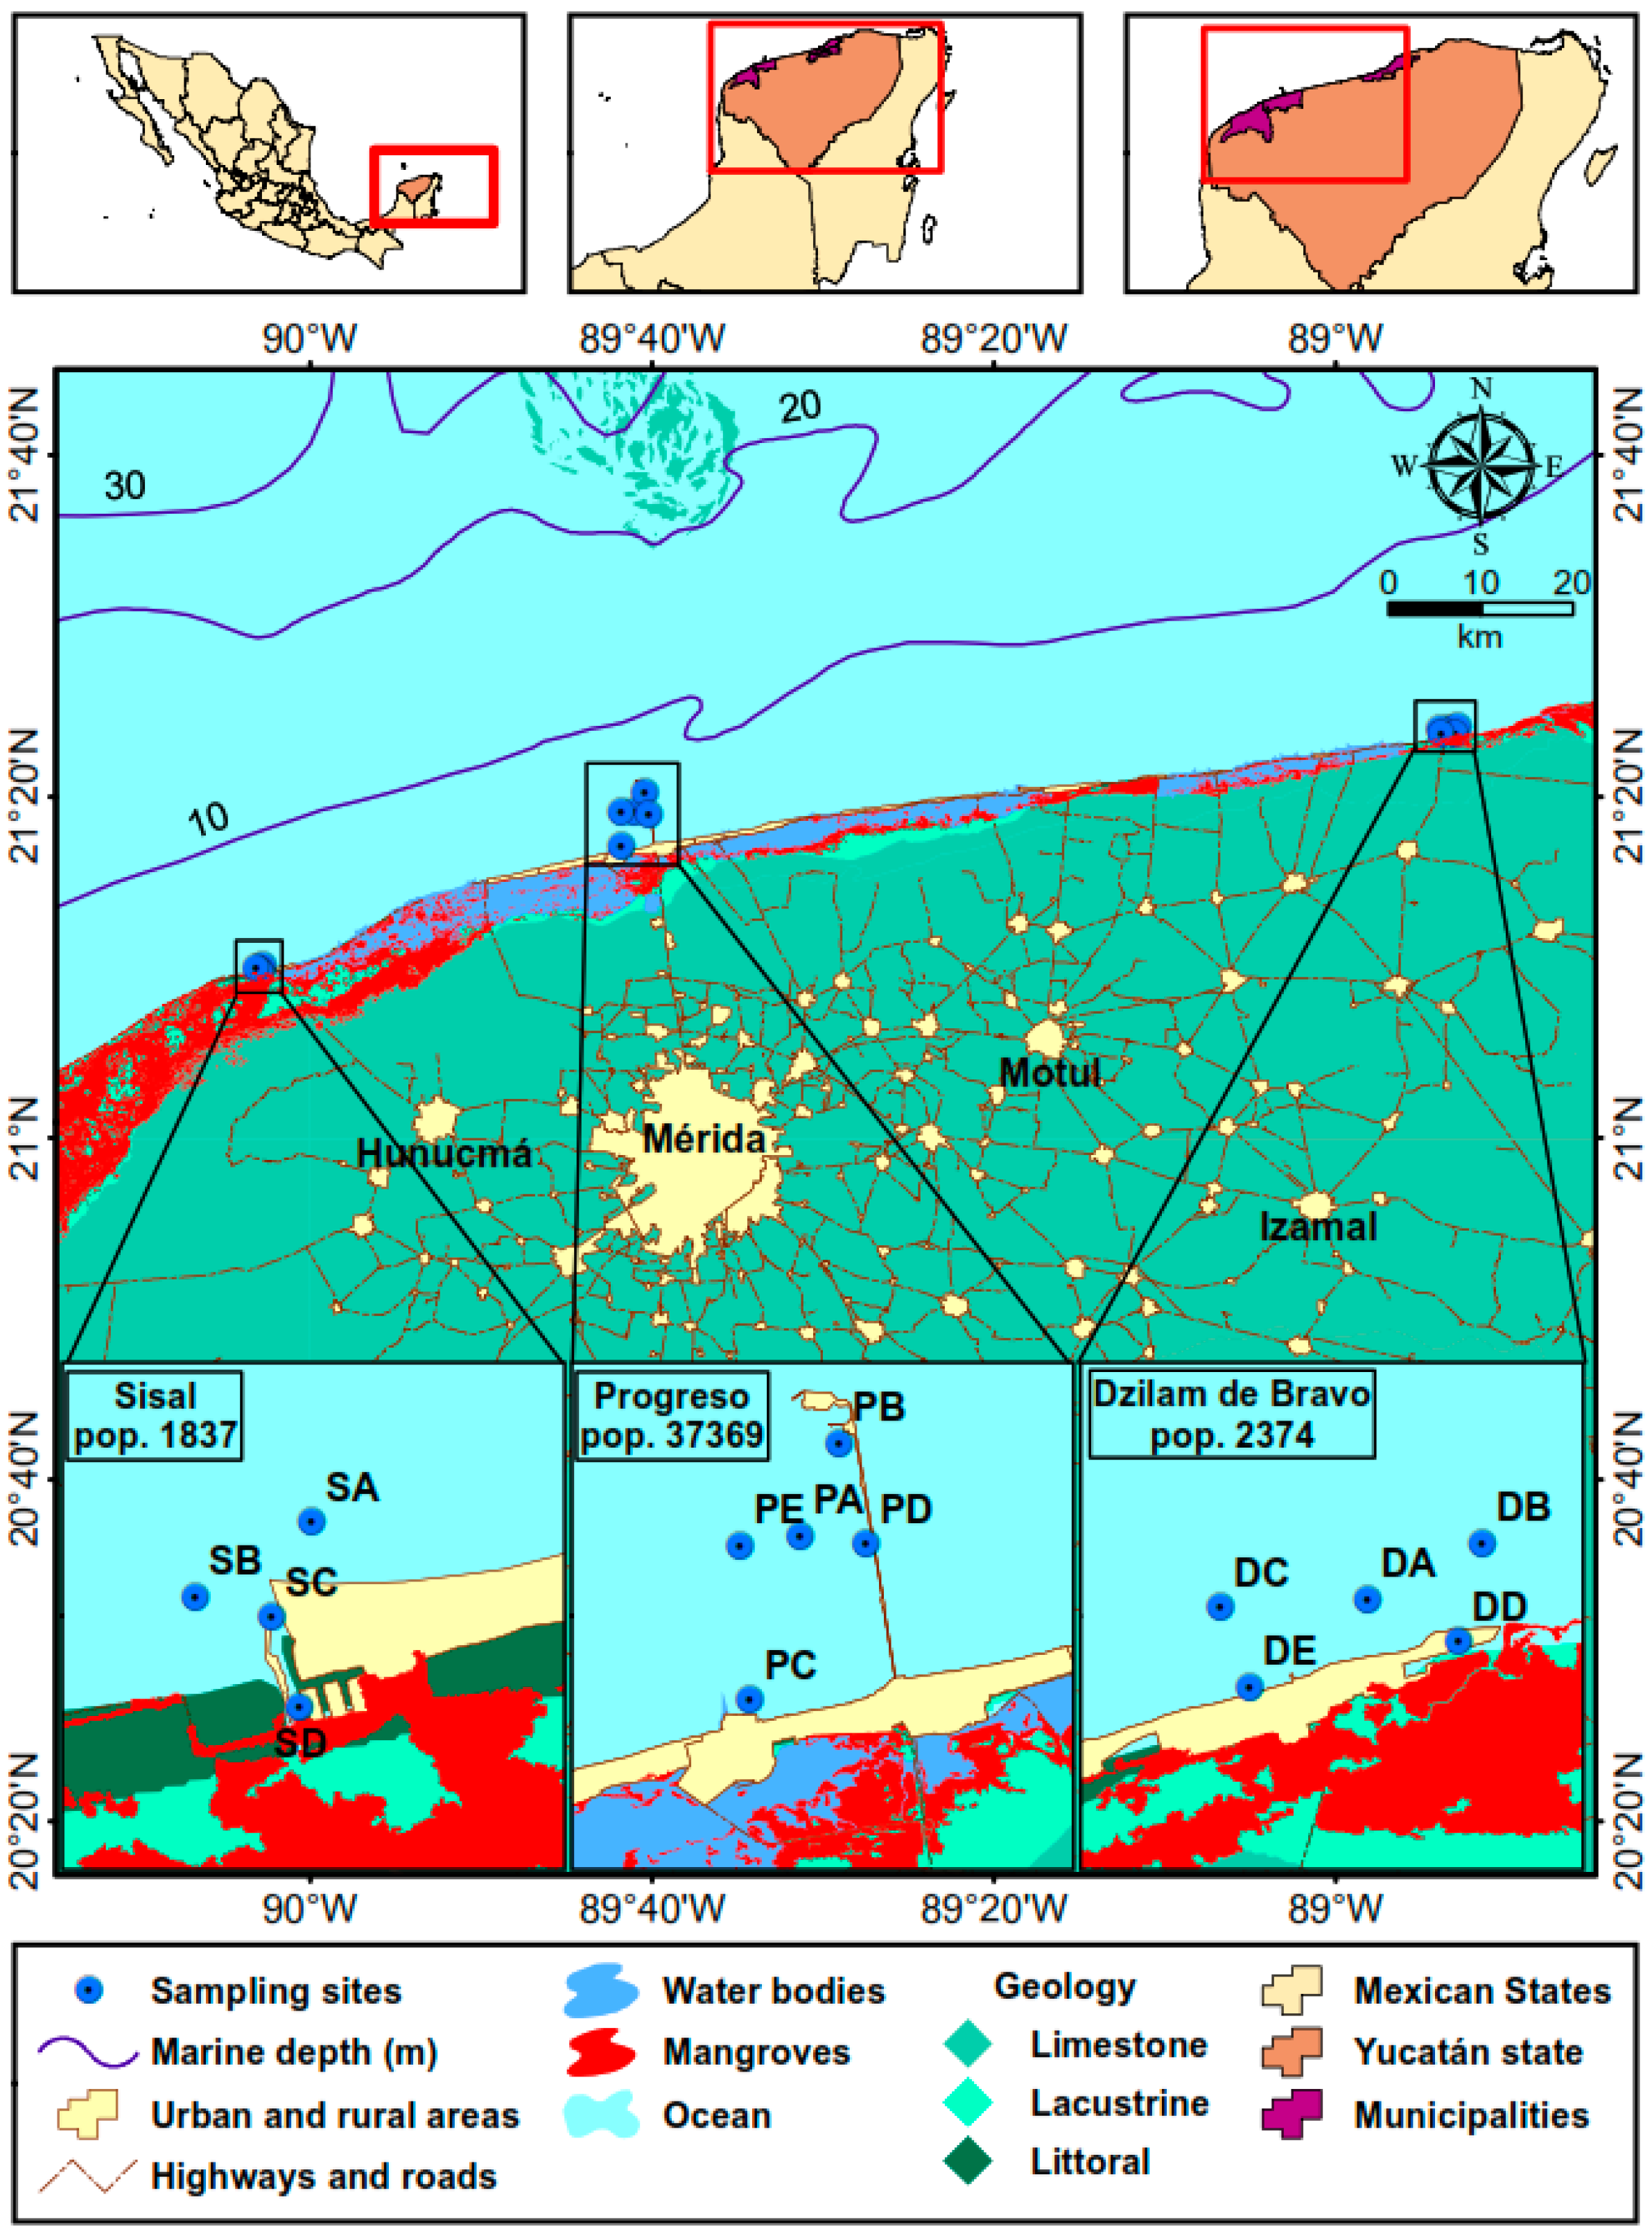
2.1. Inoculum Selection Isolated of Marine Sediments for Hydrogen Sulfide Kinetic Tests

In the coastal zones of the Yucatan peninsula, Mexico, three maritime ports (Figure 1): Dzilam de Bravo, Sisal and Progreso, possess marine sediments with different eutrophication indexes [23]. Dzilam de Bravo, classified as oligotrophic status according to trophic index (TI < 3), possesses the best water quality conditions with groundwater discharge through coastal springs. Sisal and Progreso were classified as ports with the worst water quality with a mesotrophic status [23]. The case of Sisal port, with open-ocean and organic matter accumulation zones, presented the worst water quality associated with the shrimp farm effluents partially treated with constructed wetlands. On the other hand, the worst water quality in the Progreso port was associated with wastewater discharged into the sea without treatment or water circulation infrastructure [23].
In all sites, marine sediments and water columns were obtained by using a mechanical dredger and a Van Dorn bottle. Then, the pH was measured using an ExStikII EC500, and, to ensure the anoxic condition of each sample, oxidation/reduction potential (ORP) was determined with an ExStik RE300 probe. Additionally, the depth of the water column over each of the sediments collected in the sea was measured with an echo sounder SpeedTech SM5 (portable). Samples were registered by the first letter of the port’s name followed by a consecutive letter (i.e., SA, SB, SC, SD, SE; PA, PB, PC, PD, PE; and DA, DB, DC, DD, DE). Then, surface sediments of 0–10 cm were processed, as described by Zhao et al. (2016), and immediately maintained at 4 °C for transportation and further storage at 4 °C and 20 °C. One part of the frozen sediments was processed for measuring the dissolved sulfide by anion-selective AG/S and total organic carbon (TOC) by the oxidation technique using potassium dichromate and acid medium [24]. Another part of the sediments was maintained under refrigeration for use as an inoculum. The sediment used to be incubated in this study at 4 °C was picked out from sites SC, SD and PC of Yucatan for the kinetic tests showed high sulfide concentration. To enrich sulfide-producing microorganisms, a selective liquid medium with lactate was adopted. Volatile solids in sediments and batch cultures (VSS) were determined according to standard method 2540 E [25].

2.2. Kinetic Tests in Batch Systems in Hydrogen Sulfide Production

The kinetic tests were performed with inoculums enriched with samples SD469, SD636 and PD102, corresponding to microbial inoculum seeds from the marine sediments that presented the highest concentration of hydrogen sulfide in the field (Table 1). Three batch reactors were fed with 50 mg VSS/L of inoculum enriched from sulfidogenic marine sediment previously acclimated to a high efficiency of sulfate reduction using lactate as an electron donor. Batch reactors for kinetic tests were prepared in triplicate. The biomass was inoculated in serological bottles (125 mL) with a working volume of 100 mL of Postage B modified liquid mineral medium, which contained (in g/L) K2HPO4 (0.5), NH4Cl (1), Na2SO4 (1), CaCl2·2H2O (0.1), MgSO4·7H2O (2), NaCl (10), sodium resazurin (1 mL/L) and sodium dithionite (1 mg/mL). These last two components were added as an oxidation-reduction indicator and reducing agent, respectively. Lactate is a better electron donor in comparison to H2, ethanol, propionate or acetate [26]. Therefore, sodium lactate was used as an electron donor (2 g/L). The pH was adjusted to 7, and the medium was flushed with N2 gas to ensure anoxic conditions. Incubation conditions were maintained under dark at 30 °C for 360 h.
Sulfate and hydrogen sulfide concentrations were divided among the initial biomass quantities to estimate sulfate-specific consumption and hydrogen sulfide-specific production levels in mmol H2S g−1 VSS for each microbial consortium selected. The results for each microbial consortium were adjusted to the Gompertz growth sigmoidal model [27] to estimate the rate for hydrogen sulfide-specific production (rsulfide in mmol H2S g−1 VSS VSS h−1). The rate was estimated by the expression: rsulfide = 0.386 kH2S(qH2S-max), where kH2S represents the first-order kinetics constant and qH2S-max represents the maximum specific rate for hydrogen sulfide production. An analogous treatment was carried out with the results of sulfate consumption to estimate the rate for sulfate-specific reduction: rsulfate = 0.386 kSO4(qSO4-max) where kSO4 and qSO4-max represent the first-order kinetics constant and the maximum specific rate of sulfate consumption, respectively. All kinetic tests were conducted in triplicate and the adjustment parameters were analyzed by one-way analysis of variance (ANOVA) followed by Tukey’s test at p < 0.05 using Sigma Plot version 13 software.

2.3. Analytical Methods

During microbial batch culture, an aliquot of the solution was removed from the bottle for sulfate ion (SO42−), hydrogen sulfide (H2S), pH and ORP analysis. Sulfate ions (SO42−) were measured with a Hach DR/890 colorimeter using the SulfaVer method (8051). The total hydrogen sulfide concentration was measured immediately after sampling by the Cord-Ruwisch colorimetric method [28]. The pH and ORP were measured using electrochemical probes as described above. The sodium lactate concentration was determined using an R-Biopharm kit at the start and the end of hydrogen sulfide production. Volatile fatty acid (VFA) analyses were carried out in a Perkin-Elmer Clarus gas chromatograph equipped with an FID detector. VFAs were separated in a Grace ECTM-1000 capillary column with a 30 m × 0.32 mm ID × 0.25 µm film. The carrier gas was N2 at 1 mL/min. The temperature conditions were 70 °C for 3 min, 10 °C/min ramp to 130 °C, 5 °C/min ramp to 180 °C and holding for 1 min. The sample injection volume was 1 µL. The temperature conditions for the injector and detector chamber were 250 and 200 °C, respectively. Methane, CO2 and H2 contents in the headspace of each serum bottle at the end of the experiment were analyzed using a Perkin-Elmer Elite—GC Molesieve column (30 m × 0.53 mm ID) coupled to a TCD detector. This lastly was conditioned at 30 °C for 5 min. The carrier gas was N2 at 10 mL/min. The temperature conditions were 75 and 200 °C for the injector and detector, respectively. Bottles without inoculum were used as controls. All experiments were conducted in triplicate, and the results are expressed as the mean value ± standard deviation. The sulfate reduction efficiency (SRE) was calculated according to the equation: SRE = (Si − Sf)/Si × 100%, where Si and Sf are the initial and final sulfate concentrations, respectively.

2.4. Mass and Electron Balances

The mass balances and electron balance were calculated for each consortium studied using the half chemical reaction (Rittmann and McCarthy [29]) (Table 2). The lactate was considered as the initial electron donor and, the sulfate was considered as the final electron acceptor. However, the electron balance was estimated with the residual products quantified in each of the microcosms at the final time of kinetics. The final products accumulated in the microcosm systems were hydrogen sulfide, acetate, propionate and the biomass synthesized. The observable ratio of consumption sulfate/lactate (R[OCS/OCL]) was calculated according to the equation: R[OCS/OCL] = (OCS)/(OCL), where OCS and OCL represent the quantities of sulfate consumption and lactate consumption analyzed at the final time of the kinetic tests, respectively. Moreover, the biomass net yield (Yn, mmol VSS/mmol lactate) was calculated using the empirical chemical formula to biomass (C5H7O2N) (reaction number 6 in Table 2) and dividing by OCL [25].
In the case of electron balances, the electron equivalents (meq e) quantified were estimated using the electrons transferred (Table 2) multiplied by the quantity (in mmol) of each compound determined at the end of the kinetic tests. The percentage of electrons recovered in the final products by the sulfate-reducing pathway was estimated considering the sum of electron acceptor products, ∑products (in meq e), as well as of pathways proposed for each consortium studied.

2.5. Sample Preparation for DNA Extraction

The samples for total DNA extraction were collected at the end of the experiment from each one of the replicates. First, the biomass was centrifuged at 4000× g for 15 min at 10 °C. Subsequently, the biomass was washed with TE buffer and suspended in extraction buffer pre-warmed to 65 °C (100 mM phosphate buffer, pH 7; 100 mM Tris-HCl, pH 7; 100 mM EDTA, pH 8; 0.7M NaCl; 1% v/v CTAB and 2% v/v SDS). Second, samples were incubated at 65 °C for 30 min by manual agitation every 10 min. The aqueous phase was recovered and purified with 0.8 volume of chloroform–isoamyl alcohol (24:1) and then equal volume of phenol–chloroform–isoamyl alcohol (24:24:1). Third, DNA in the aqueous phase was precipitated with 0.6 volume of isopropanol and incubated for 30 min at room temperature. The pellet was washed using ethanol at 70% and suspended in a TE buffer. Fourth, the RNA degraded under incubation at 37 °C for 1 h. Then, 0.4 volume of cold potassium acetate was added and incubated for 1 h at −20°C. After centrifugation at 1600× g for 20 min at 4 °C, it was recovered and precipitated with 0.6 volume of isopropanol for 1 h at 20 °C. Finally, the pellet was washed with ethanol at 70% and re-suspended in bi-distilled water. Total DNA yield and quality were determined using a spectrophotometric method followed by electrophoresis on 1% agarose gels.

2.6. Amplicon Sequencing Analysis of Total DNA

A total of 20 ng/µL of each sample was used for amplicon sequencing at the Research and Testing Laboratory. Briefly, the V1–V3 bacterial region of the 16S rRNA gene was amplified using the 28F forward (GAGTTTGATCNTGGCTCAG) and 533R reverse fusion primer (TTACCGCGGCTGCTGGCAC) according to the method described to identify bacterial species, without considering archaea division Schloss et al. [30]. Primer pads were designed to ensure that the primer pad/primer combination had a melting temperature of 63 to 66 °C. Amplification reactions were performed in 25 µL reactions with Qiagen HotStarTaq Master Mix, 1 µL of each primer (5 µM), and 1 µL of the template. The reactions were performed in ABI Veriti thermocyclers using the following thermal profile: 95 °C for 5 min, then 35 cycles of 94 °C for 30 s, 54 °C for 40 s, and 72 °C for 1 min, followed by one step of 72 °C for 10 min. The products were sequenced using Illumina MiSeq technology to generate 2 × 300 paired-end reads.

2.7. Amplicon Analysis and Microbial Diversity

A total of 663,418 reads were obtained from each replicate and analyzed with FastQC (v0.11.2) to filter out the low-quality regions and to join them they were assembled with a custom python script with PEAR (Paired-End read merger v 0.9.8) [31] using the following parameters: −q 20 −t 250 −m 600. A total of 380,047 filtered sequences were submitted to different scripts implemented in QIIME [32]. First, chimeric sequences were detected using usearch with the RDP classifier training database (v9). The resulting chimeric sequences were removed in QIIME for a total of 372,212 sequences, which were analyzed using three different methods for microbial identification: QIIME [32], uparse [33] and MG-RAST [34].
The merged paired-end reads were analyzed using the QIIME pipeline [32]. To perform detection and clustering of 16S rRNAs, reads were first clustered against a Greengenes 13_8 reference sequence collection. Then, the open-reference operational taxonomic units (OTUs) picking approach used was pick_open_reference_otus.py, which includes taxonomy assignment, sequence alignment, and tree-building steps [35]. The raw abundance counts of the taxonomic profiles by replicates used to compute: Chao 1 and Shannon (to estimate richness and population diversity) using Vegan Library implemented in R [36]. The amplicon sequencing is available through the MG-RAST server (http://metagenomics.anl.gov) under project accession “Sedimentos Yucatan”, with the IDs 4690181.3, 4690186.3, 4690182.3 for PD102; 4690185.3, 4690187.3, 4690180.3 for SC469; and 4690184.3, 4690183.3, 4690188.3 for SD636. For taxonomic assignment average of data was obtained from the 3 cultures used with triplicates.

3. Results and Discussion

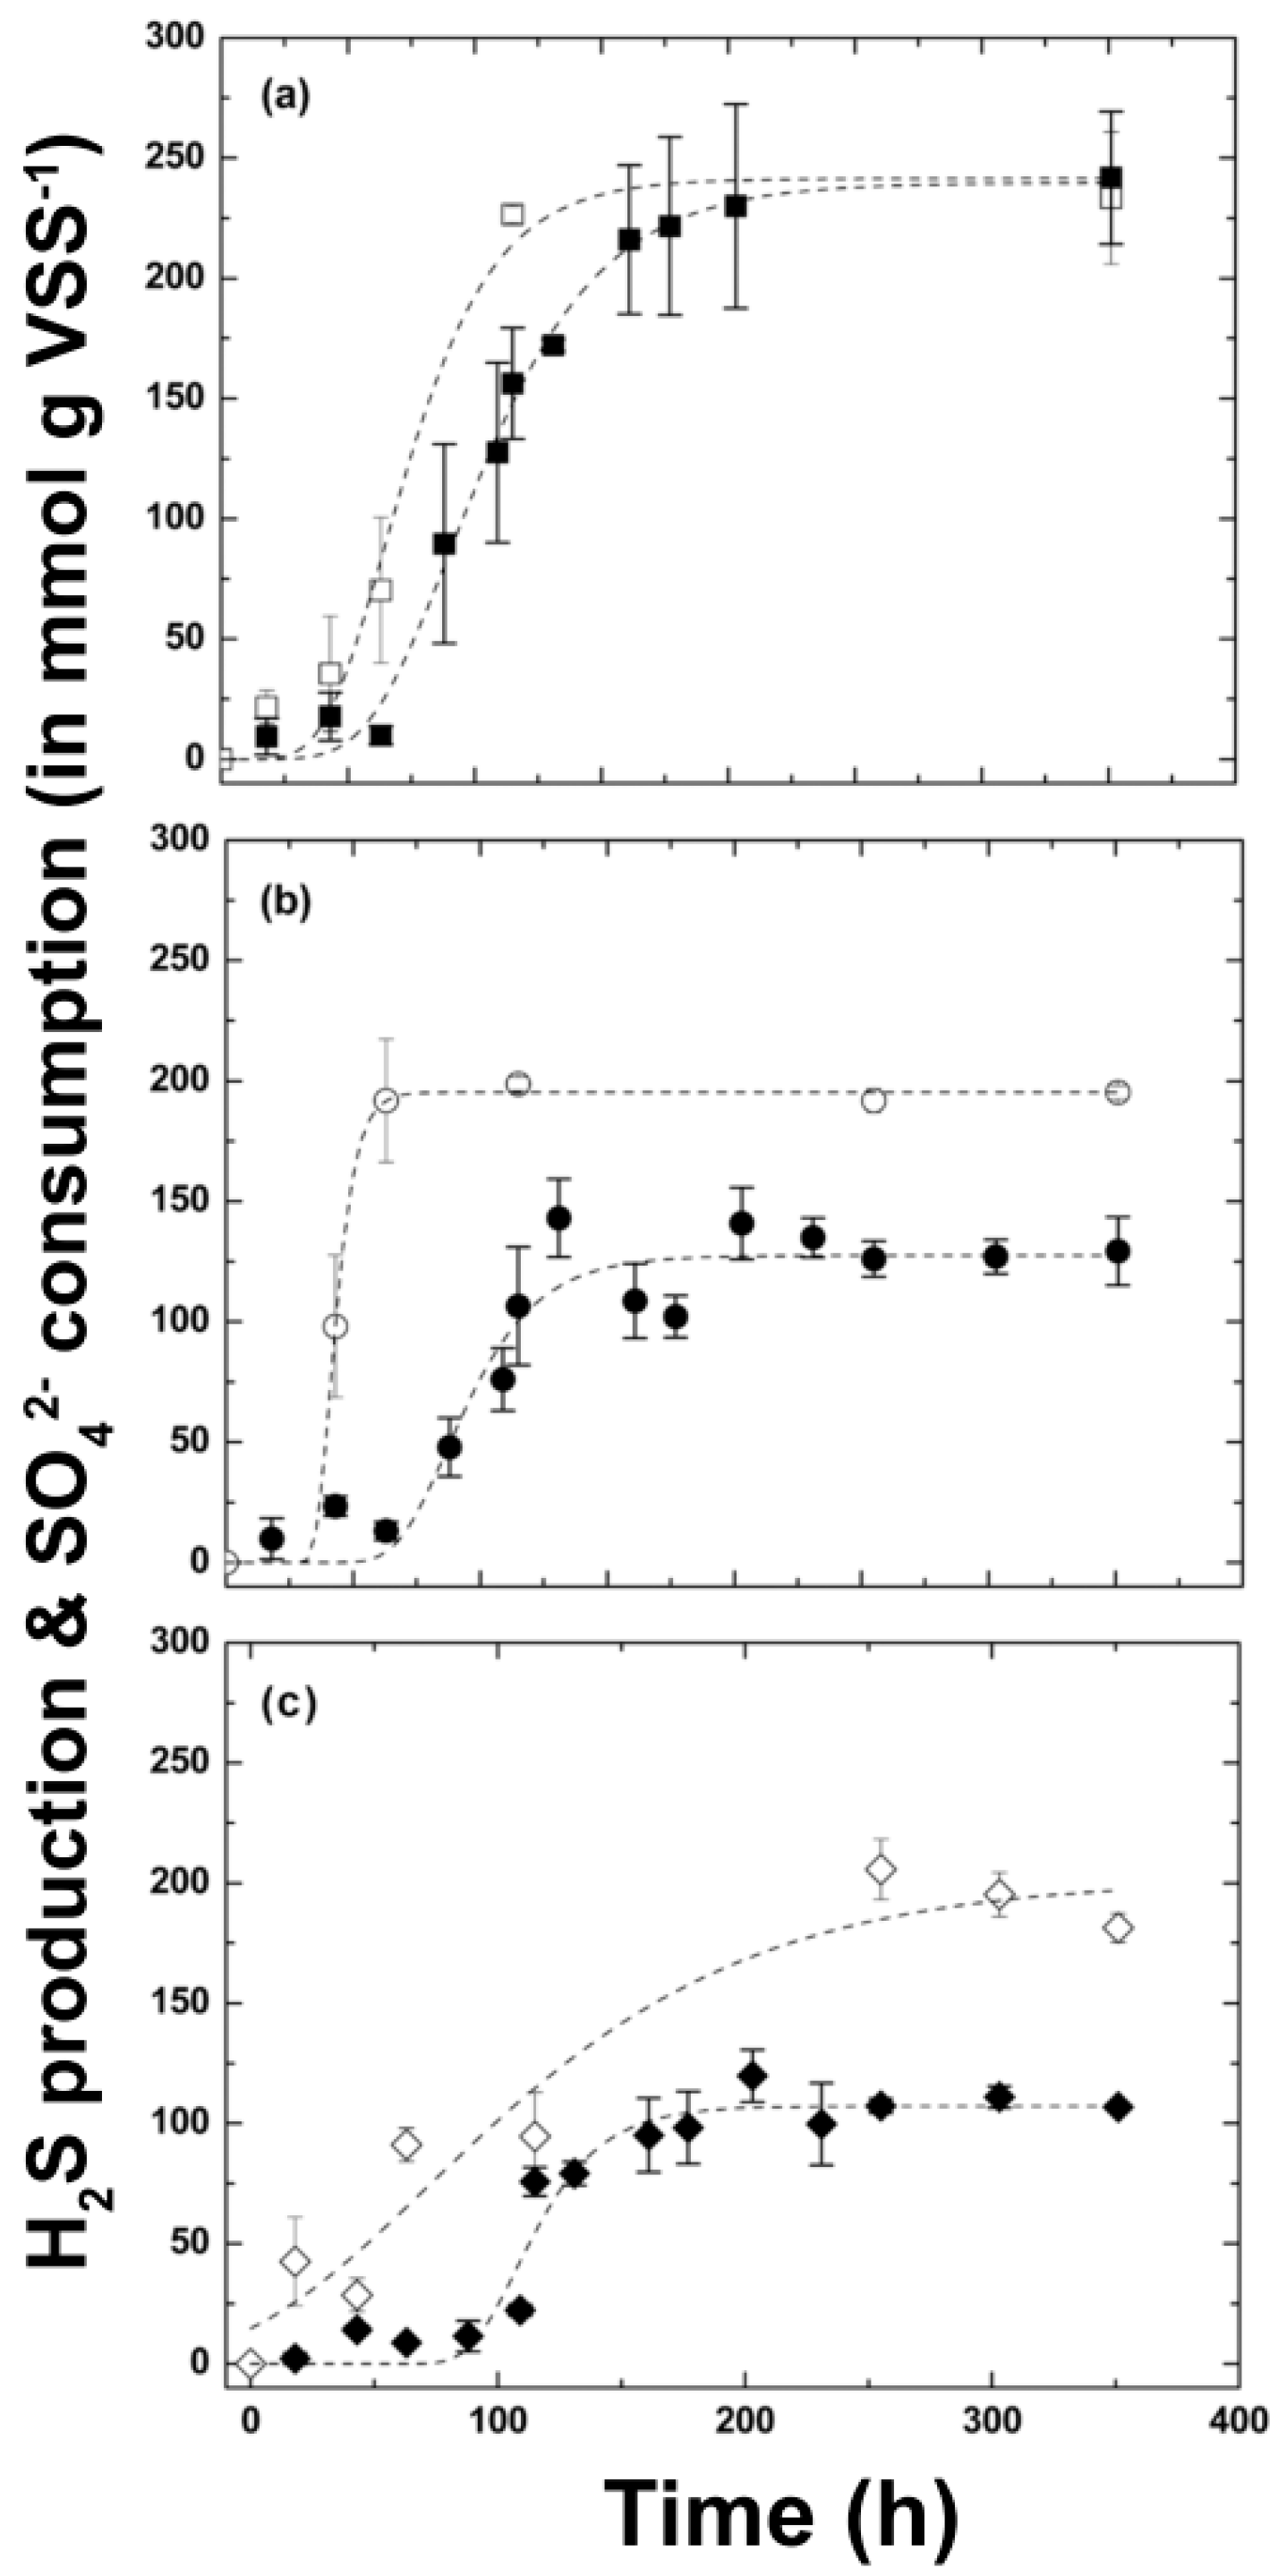
3.1. Inoculum Selection to Kinetic Tests during Hydrogen Sulfide Production

Physicochemical characteristics of marine sediments and their corresponding water columns collected in the Yucatan Peninsula, from Sisal, Progreso and Dzilam de Bravo ports, are presented in Table 1. Additionally, in the same table, the GPS location and depth required to reach the sediments in each site are shown.
All sediments collected had a temperature and pH between 26 to 31 °C and 6.6 to 8, respectively. The lowest ORP values were in Progreso sediments (with a mean value of −262 ± 106 mV), followed by those from Sisal (−206 ± 117 mV) and Dzilam de Bravo (−129 ± 66 mV). ORP negative values indicated reducing the capacity of sediments and anoxic conditions in all cases. Sediments collected in Progreso, Sisal and Dzilam de Bravo ports showed high TOC percentages (between 1% and 5.6%), except for the SA, PA and DA sites. Higher H2S concentrations were detected at SC and SD from Sisal and PD from Progreso. Thus, according to the hydrogen sulfide quantification and ORP values, sediments sampled in sites SC, SD and PD were inoculated in batch cultures to produce biomass, and these were labeled SC469, SD636 and PD102, where the numbers were a reference to the hydrogen sulfide concentration quantified (in mg/L, Table 2).

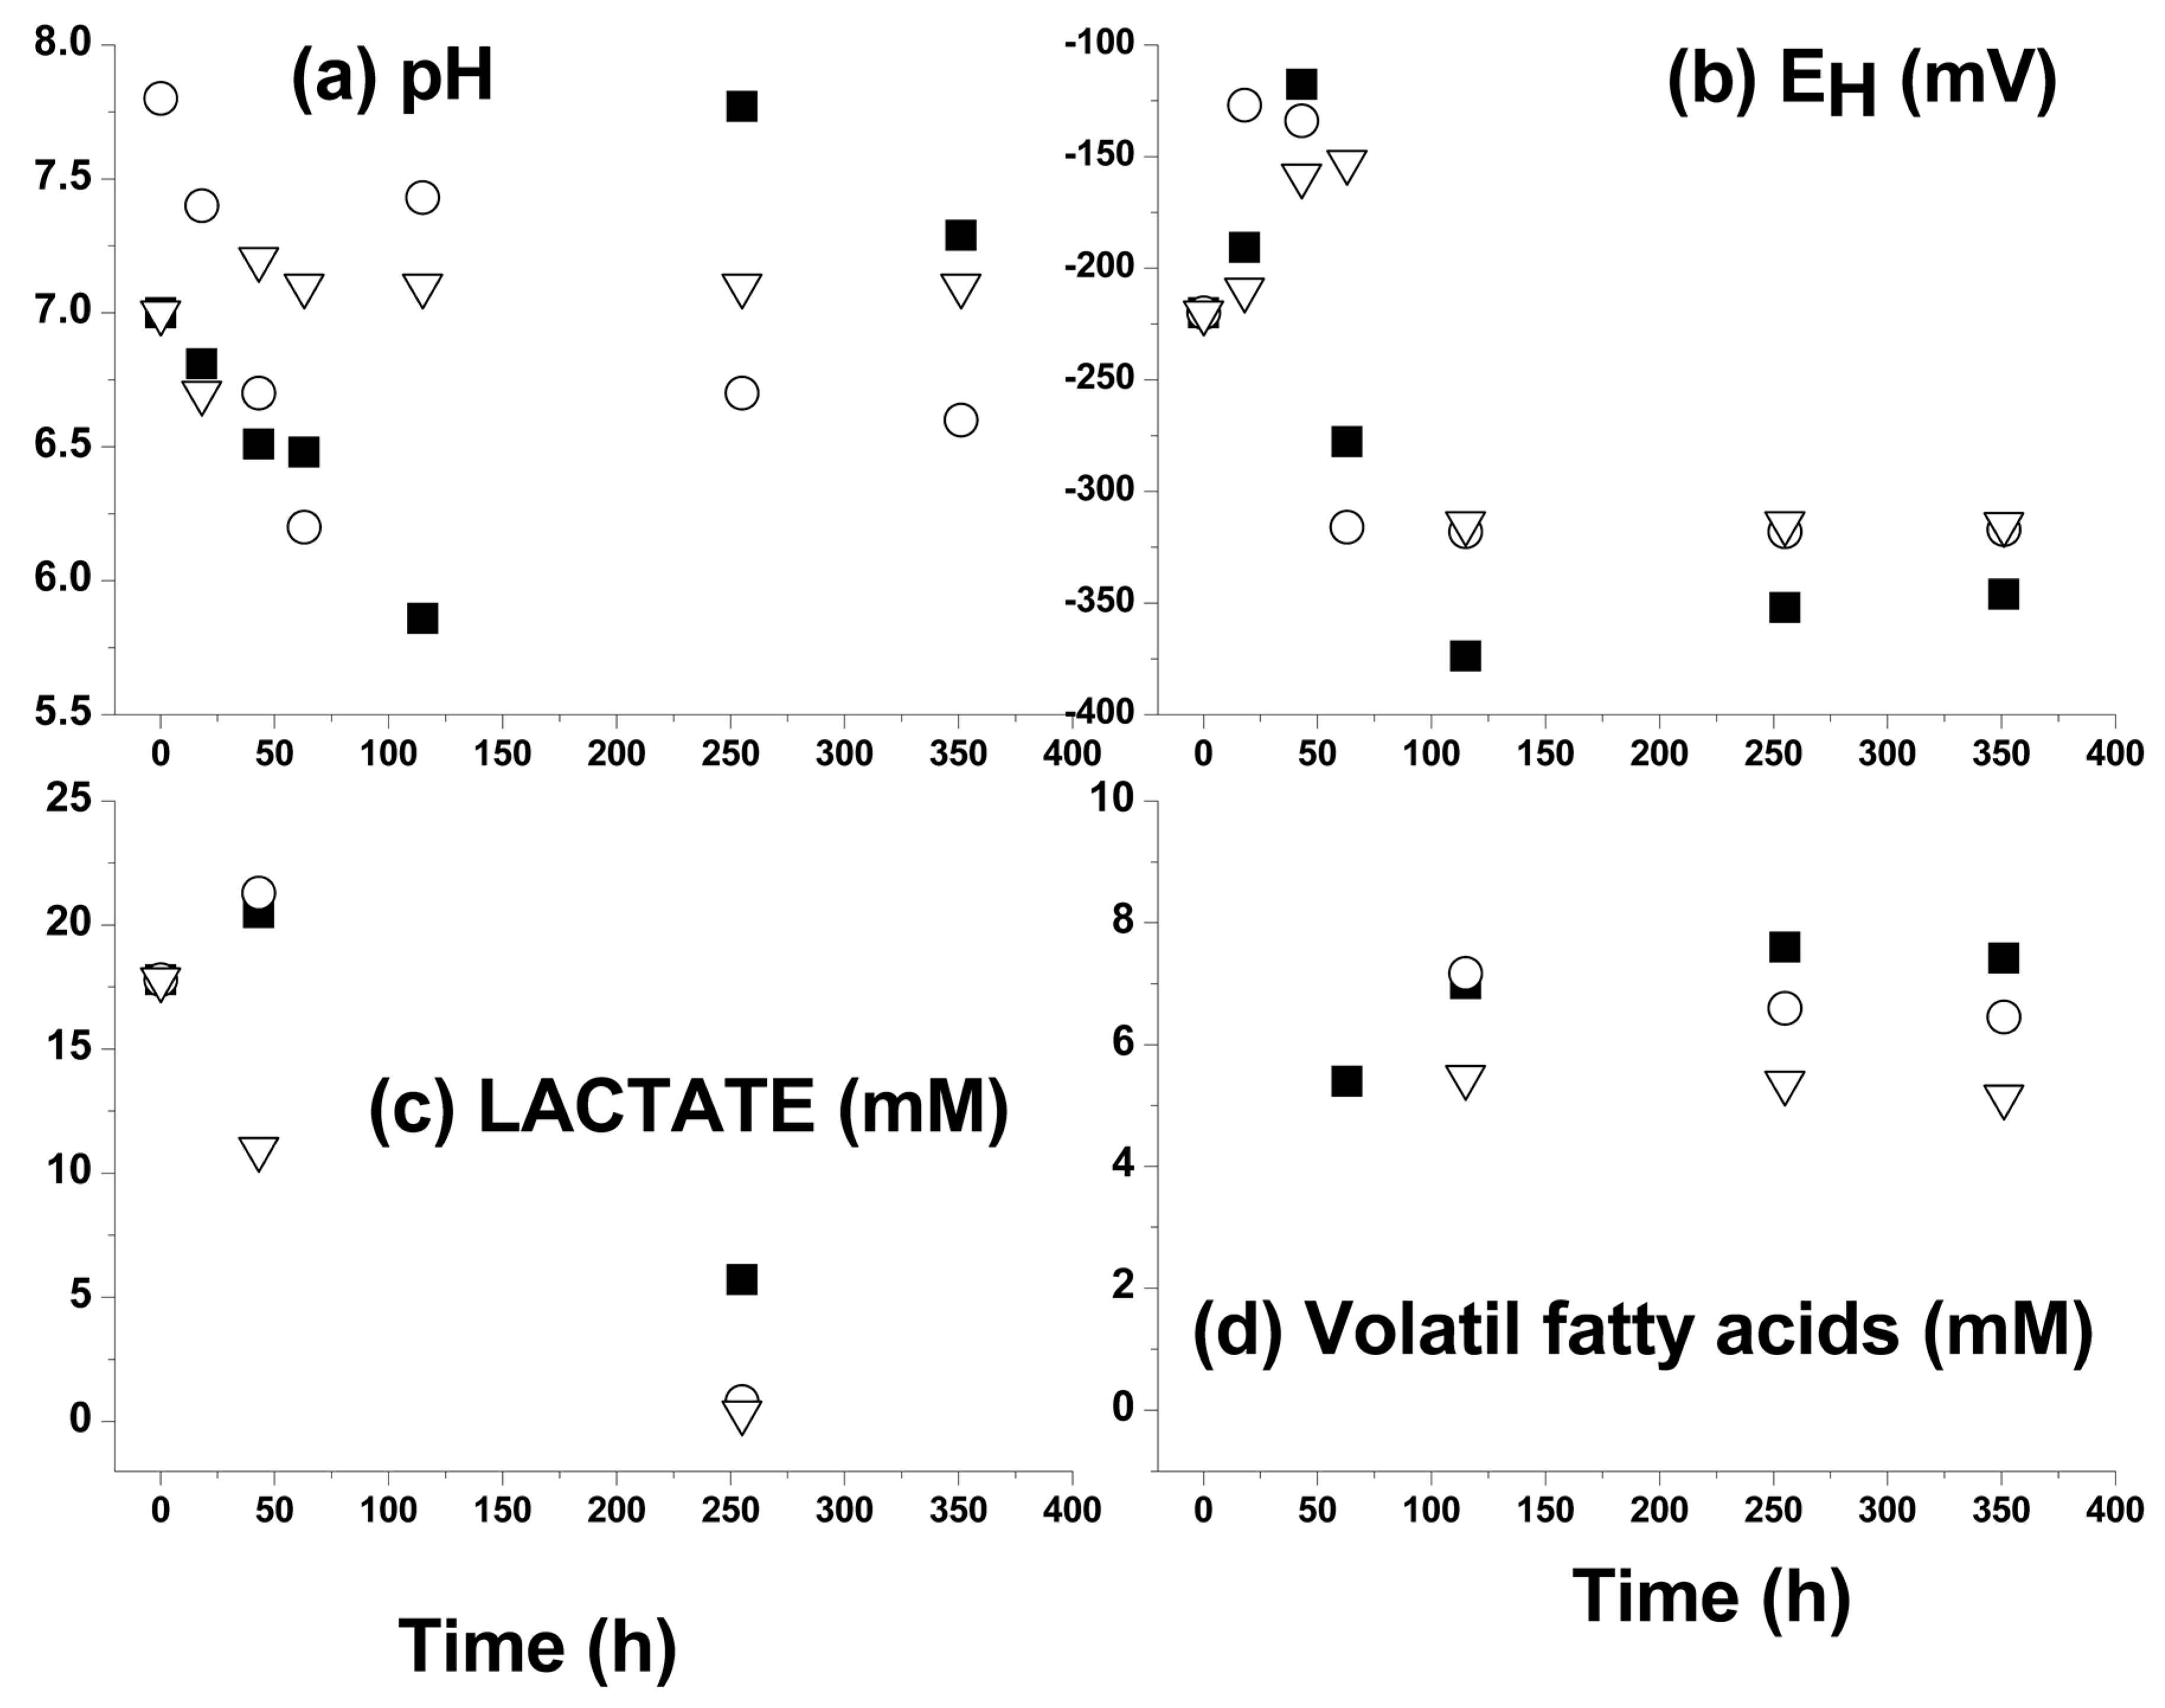
3.2. Kinetic Sulfide Production Tests in Batch Systems

Sediments which microbiota produced sulfide, were selected, and evaluated it capacity to produce sulfide in vitro, in batch reactors with enriched medium. Figure 2 shows kinetic sulfide production performances of the three sulfidogenic bioreactors inoculated with marine sediments with lactate as an electron donor.
In all cases, the production of hydrogen sulfide lagged behind the sulfate reduction probably attributed to the presence in the solution of other sulfur species not quantified (e.g., thiosulfate, polythionates or elemental sulfur).
In the case of the PD102 batch culture, the specific hydrogen sulfide production had a lag phase of 88 h. During this lag phase, an SRE of ~59% (from 1670.5 to 683.3 mg/L) was achieved, and the lactate consumed was 42.3%, without any hydrogen sulfide detected. At the end of the kinetic tests, total lactate removal was 98% and the maximum specific hydrogen sulfide production was 106 mmol g−1 VSS, which was reached at 196 h with a final acetic acid concentration of 5.3 mM (Figure 3d). During all kinetic sulfide production tests, the pH was almost constant and equal to 7, while the ORP changed from −220 to −310 mV (Figure 3a and Figure 3b, respectively). Moreover, hydrogen sulfide production showed a lag phase of 63 h using the SD636 consortium in the batch culture. The initial pH was 8, and it decreased during the first 115 h until reaching 6 units, which corresponded to the observed accumulation of organic acid in the culture (Figure 3a). ORP was initially −220 mV and was −318 mV at the end. After 115 h, the pH increased to 7.5 and decreased at the end of the experiment to 7. All pH changes occurred without external amendment. The organic acid accumulation started at 63 h and the maximum production of acetic and propionic acids (only in the SD636 case) was reached after ~115 h, with concentrations of 6.73 and 0.8 mM, respectively (Figure 3d).
The lactate removal was 95.4% with an SRE at the end of 56.1%. The maximum specific hydrogen sulfide production was 246 mmol g−1 VSS, reached at 130 h corresponding to 197 mmol g−1 VSS maximum sulfate consumption at 63 h. More details in conclusions. Hydrogen sulfide-specific production decreased to 100 mmol g−1 VSS between 130 and 177 h, finally reaching the equilibrium value of 128 mmol g−1 VSS at the end of the kinetic test. The specific sulfate consumption rate and specific hydrogen sulfide production rate were 144 ± 38 and 95 ± 30 mmol g−1 VSS h−1, respectively (Table 3).
Like SD636, in the case of the SC469 batch culture, there was a lag phase in hydrogen sulfide production at 63 h. However, in SC469, the specific rate of hydrogen sulfide production is 1.13 times faster than the specific rate of sulfate consumption, contrary to what was observed with the SC636 consortium, where the specific rate of sulfate consumption was 1.5 times faster than the specific rate of hydrogen sulfide. This result indicated a shorter time needed for start-up and better performance. Acetate was the main product after the first 63 h and was maintained for 351 h at 6.4 mM (Figure 3d) with an SRE of 79%. The pH fell during the first 115 h until it reached 5 (associated with an acetic accumulation) and, later the pH was 8 before finally reaching equilibrium at 7, this being probably associated with the pKa1 of H2S in the solution (Figure 3a). The ORP was initially −190.67 mV and −355.67 mV at the end (Figure 3c). The maximum specific sulfide production was 246 ± 28 mmol g−1 VSS, very similar to that observed for maximum sulfate consumption (242 ± 2 mmol g−1 VSS), with a lactate removal of 68.2%. In fact, according to a one-way analysis of variance and Tukey’s test (p < 0.05), no significant difference was observed between the values of maximum specific rates of hydrogen sulfide production versus sulfate consumption (Table 3).
From the results obtained, it can be suggested that the batch cultures were preferably conditioned to carry out the sulfate reduction process. This was because a high efficiency of sulfate reduction and stable production of aqueous organic end products were found [17]. Particularly, SC469 presented a higher SRE, which resulted in higher sulfide generation than other batch cultures. A higher sulfate removal efficiency indicated a higher rate of sulfide production and a higher activity of SRB was found, while a decrease in sulfate removal efficiency implied a decrease in SRB activities [37]. In this study, SC469 showed better performance because, for technological purposes, it is better when the start-up duration is shorter, considering substrate utilization and power consumption [17].
Additionally, lactate as a substrate for SRB may speed the start-up of the process [26], which is consistent with the results obtained in this study, which found a shorter lag phase in SC469 (63h, SRE 79%) using marine sediments in comparison to those sediments utilized by Zhao [17] (360h, SRE 99%). The reason for this is because lactate can be adapted to the diversity of SRB compared to other substrates [17]. It is worth mentioning that in SC469, only 68.3% of lactate was removed, which means sulfate reduction was more efficient than in other cultures.
Incomplete oxidation of organic matter by microbial activity was detected by VFA accumulation containing acetate in PD102 and SC469, and propionate with acetate in SD636 according to lactate biodegradation pathways (Table 4). However, VFA concentrations were not so great, as to drastically reduce the pH and the sulfate-reducing activity allows, in all cases, a buffering effect of the H2S concentration to sustain the circumneutral pH in the batch culture.
The mass and electron balances for each consortium used suggest several products associated with different lactate biodegradation pathways according to Table 1 and Table 5. These results can be explained by the microbial abundance described below.

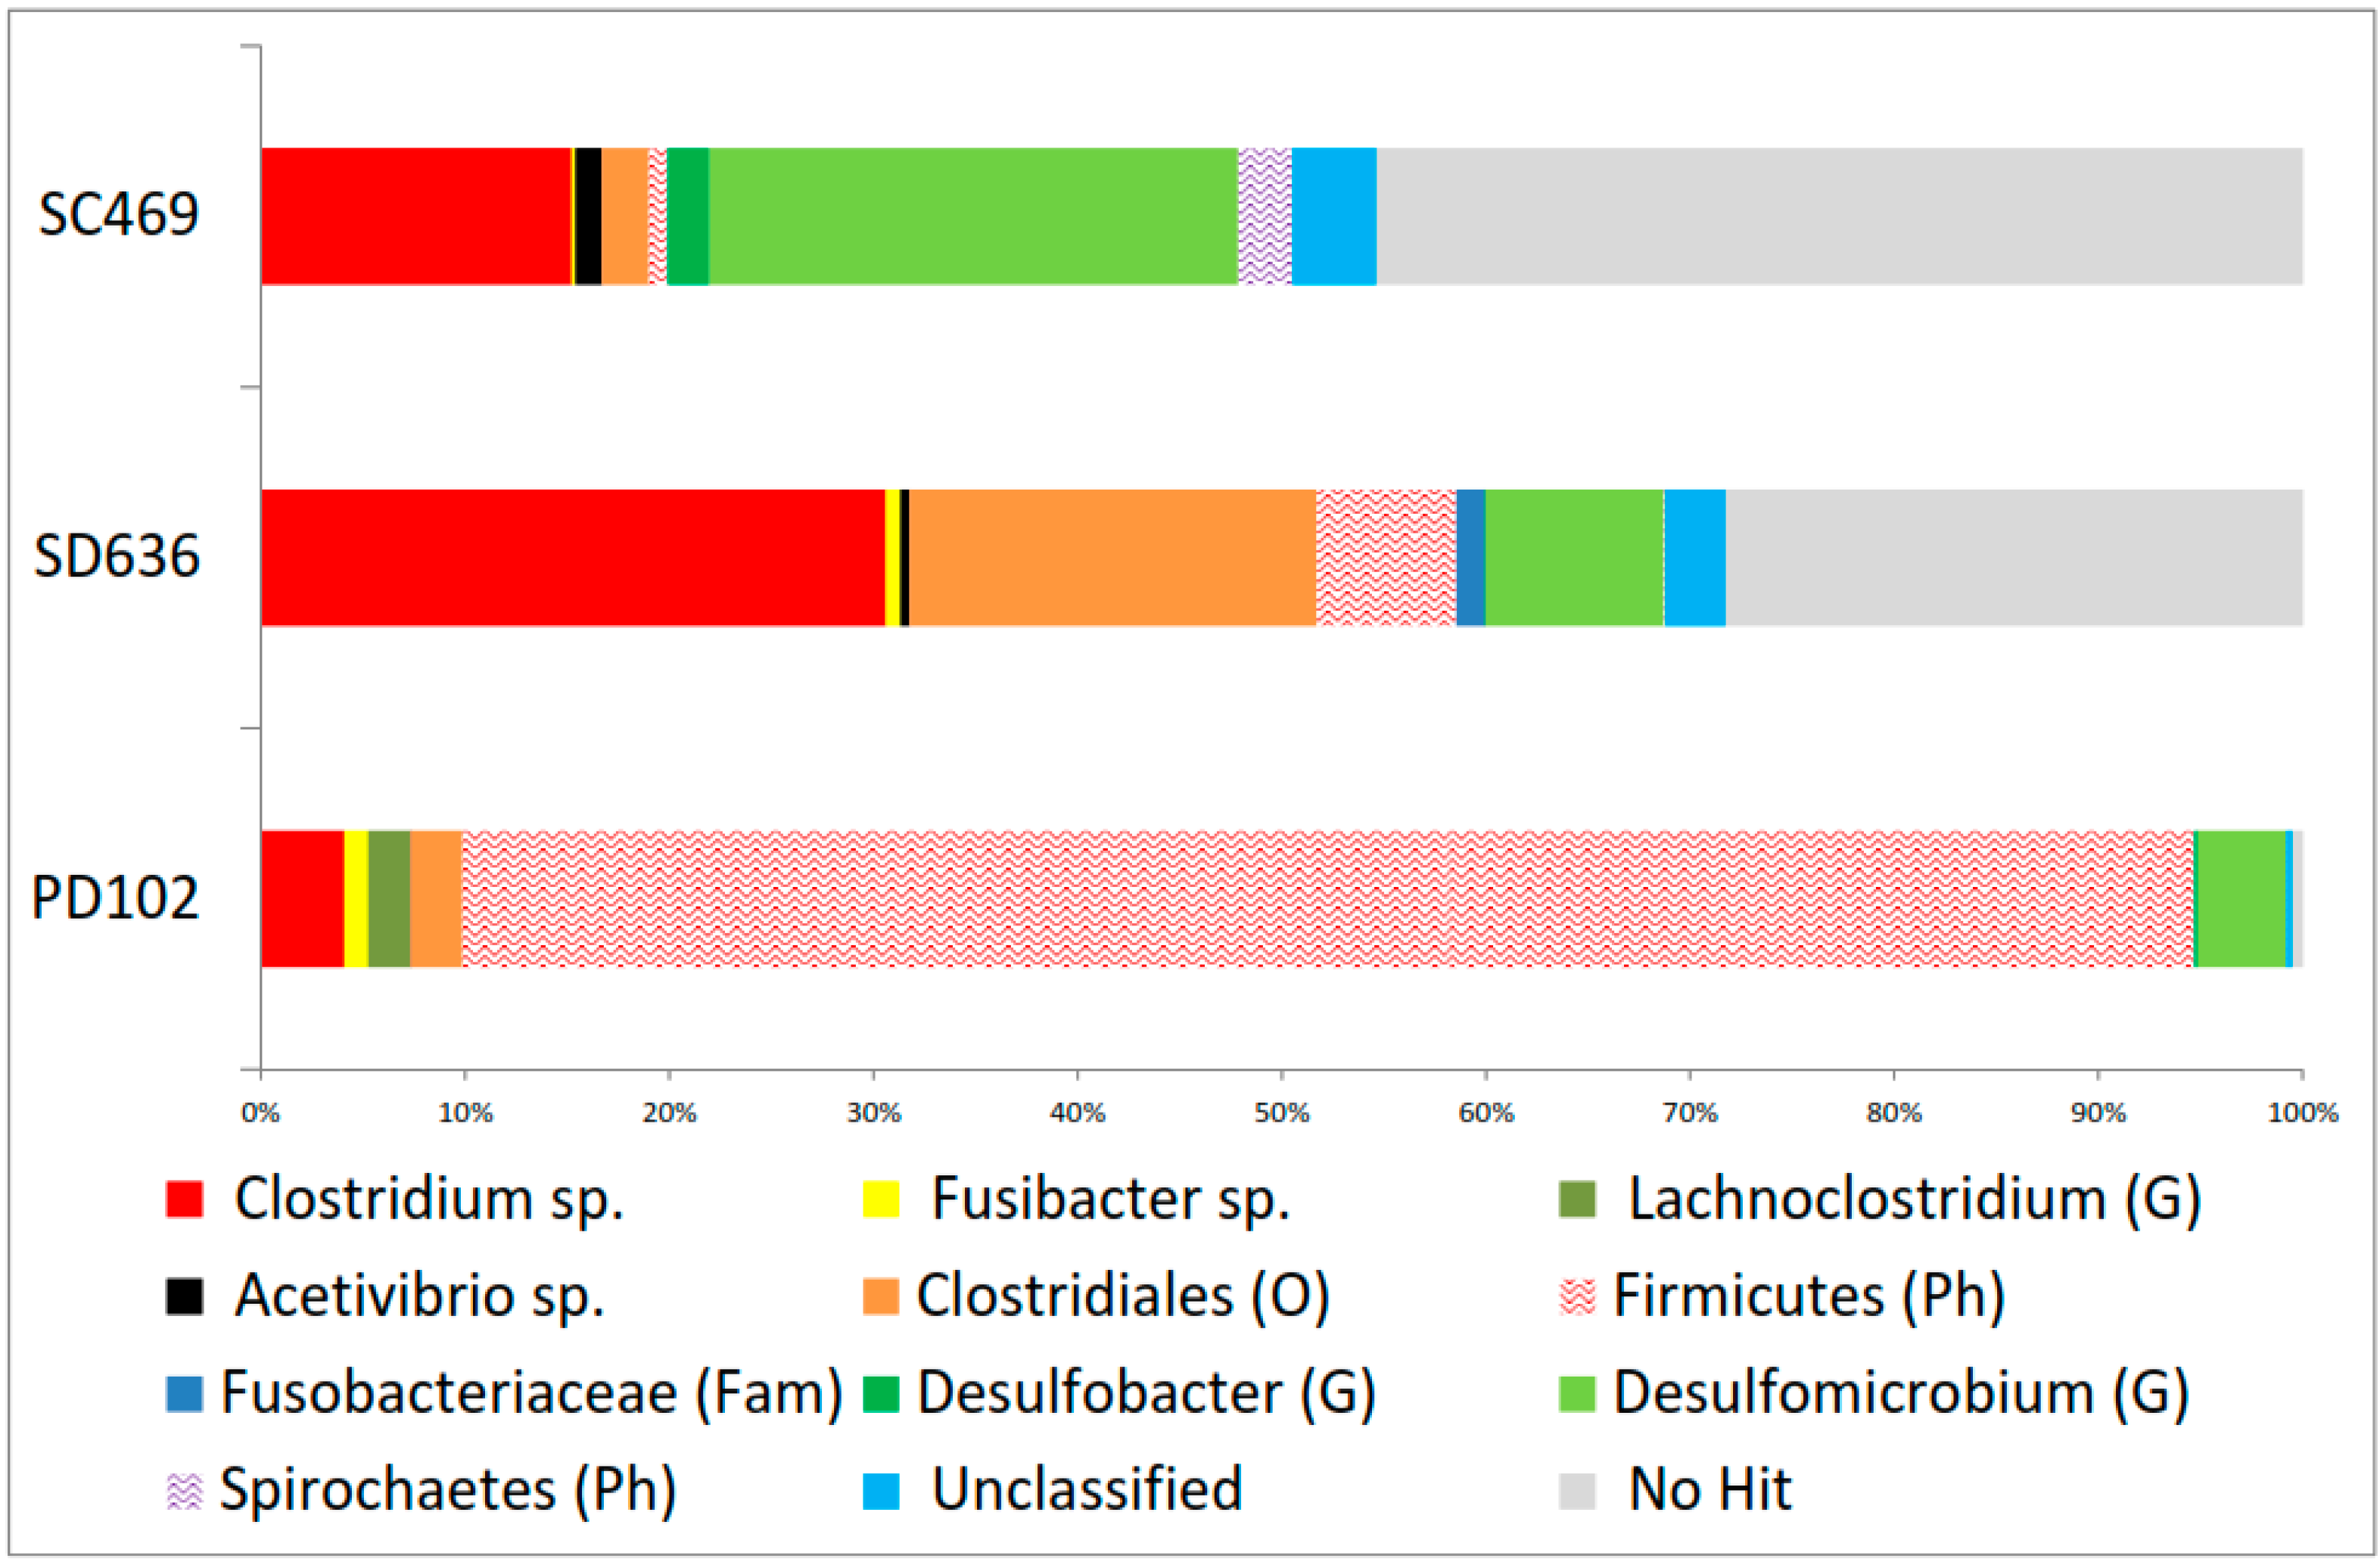
3.3. Diversity of Bacterial 16S rRNA Gene Sequences

The V1–V3 bacterial region of the 16S rRNA gene from sulfide production microbiota was sequenced. A total of 142,784 sequences were obtained after processing the amplicon data. The number of OTUs generated was higher in SD636-3 and SC469-2 replicates than in the rest of the cultures. The Shannon diversity index values (H′) predicted that the bacterial diversity was higher in SD636-3 and SC469-2 than in the rest of the cultures. With respect to the abundance of species, Chao 1 richness estimates predicted that the bacterially-rich species of the SD636-2 and SD636-3 replicates is greater than the rest of the cultures (Table 6). The lesser abundant in relation to bacterial species is SC469-3.
The results presented in Figure 4 are averaged data obtained from 3 cultures × 3 replicates. Taxonomic assignment indicated phyla are consistent with those detected in enrichment cultures for sulfide removal from coastal sediments of the Shandong Peninsula, China [21].
In this way, the microbial sequences of marine sediments were distributed in five phyla: Firmicutes, Proteobacteria, Spirochaetes, Fusobacteria and Bacteroidetes (Figure 4). In all cases, the most prevalent bacterial phylum was Firmicutes, followed by Proteobacteria and other phyla with minor distributions. However, of the total microbial diversity, in the cases of SD636 and SC469 batch culture, between 30% and 40% could not be identified to the phylum taxonomic level of bacteria. This percentage, possibly including arquea members, was not detected by the bacteria-specific primer but was presumable present from the production of methane in the anoxic reactors. Contrary, in the case of PD102, almost all microbial diversity (99.2%) was assigned to some type of phylum.
The PD102 consortium sample was composed mainly of Firmicutes (relative abundance 93.5%) and to a lesser extent Proteobacteria phyla (4.7%). The SD636 sample was composed primarily of Firmicutes (57%), followed by Proteobacteria (8.9%), Fusobacteria (2%) and Bacteroides (1.2%). In contrast, SC469 contained Proteobacteria (27.4%), followed by Firmicutes (20%) and Spirochaetes (3.2%).
In PD102 (Figure 4), most of the unidentified genera (83%) belonged to Firmicutes, followed by those derived from Clostridium (4%), Desulfomicrobium (4.2%), Clostridiales order (2.5%), Fusibacter sp. and Lachnoclostridium genera (1.9%). Among the main genera belonging to the Firmicutes phylum, the second largest group of sulfate-reducing bacteria included Desulfotomaculum, Desulfosporomusa and Desulfosporosinus. All batch cultures tested used preferential sulfates (as electron acceptors) in a non-assimilative way due to extracellular hydrogen sulfide accumulation observable in the systems. However, Clostridium can obtain the energy of dissimilatory and assimilatory metabolism to ferment lactate and produce acetate and/or propionate via the propionate pathway [38]. This could be the reason for the conversion of the lactate to acetate by Clostridium and then oxidized completely to CO2 (detected in 91.3%, with a retention time of 2.03 min) by members of Firmicutes.
The sample SD636 contained Clostridium sp. (29.6%) and genera derived from the Clostridiales order (19.3%) at a high percentage, followed by Desulfomicrobium (8.4%) genera and unidentified microbial from Firmicutes (6.6%) (Figure 4). The Clostridia class, includes hydrolytic strains that degrade proteins, lipids and complex carbohydrates into fermentation products [39], which can be used as terminal electron acceptors, particularly sulfate-reducing bacteria in marine sediments producing sulfide [40]. Desulfotomaculum and Pelotomaculum belong to sulfate reducers within Clostridia [3]. Desulfomicrobium is an incomplete oxidizer genus. Thus, it is possible that Clostridium degraded lactate to acetate and propionate, together with Desulfomicrobium oxidizing lactate and propionate incompletely to acetate, while members of Firmicutes completely oxidized lactate to the CO2 detected in this batch culture by 29.7%. Additionally, the 47.46% of methane detected in SD636 culture indicates the presence of methanogenic bacteria.
The batch culture of SC469 contained 25.4% Desulfomicrobium, 14.9% Clostridium sp., 2.6% Spirochaetes, 2.2% Clostridiales order and 2% Desulfobacter, among the main genera found (Figure 4). Desulfomicrobium is an incomplete oxidizer of organic substrates and grows well on lactate, fumarate, and malate but cannot grow on fatty acids [41,42]. Desulfomicrobium is a mesophilic Gram-negative non-spore-forming genus of sulfate-reducing bacteria [43] and its metabolism is acetogenic and hydrogenotrophic [44] in reactors inoculated with laundry wastewater and wastewater from an anaerobic treatment plant at a slaughterhouse [45].
Moreover, Desulfobacter grows effectively on acetate by complete oxidation but does not utilize formate or other fatty acids with longer chains [42,46]. Its members can reduce sulfate by disproportionation to sulfur, thiosulfate and sulfite [30]. Therefore, its presence could suggest that the acetate generated by Desulfomicrobium could be taken by Desulfobacter toward complete oxidization. The CO2 (~72%) detected at the headspace was indicative of the complete oxidizing by Desulfobacter. Methane (52.1%) indicated the presence of methanogens and hydrogen (32%) fermentative activity. Clostridium, Desulfomicrobium and other species were used to develop a sulfidogenic sludge that may be used for the simultaneous removal of sulfate and trichloroethylene. The presence of acetate indicated fermentative metabolism mediated by homoacetogenic microorganisms, whose metabolic activity depends on sulfidogenesis and methanogenesis. Additionally, the hydrogen detected was an intermediate for SRB, hydrogenotrophic, methanogenic and acetogenic bacteria.

4. Conclusions

In conclusion, the three batch cultures of sulfidogenic sediment were acclimated to the high efficiency of sulfate reduction and a favorable microenvironment where SRB could oxidize lactate to acetate, propionate, methane and CO2. However, according to one-way analysis of variance and Tukey’s test (p < 0.05), the SC469 consortium presented a higher SRE, which resulted in higher hydrogen sulfide production (246 mmol g−1 VSS) than the other batch cultures. This capability was indicative of the higher percentage of SRB. In fact, the microbial identities indicated the predominance of Desulfomicrobium, Clostridium and Desulfobacter in SC469.
Therefore, for the purposes of its utilization for biotechnological applications, such as hydrogen, electric energy production, and metal toxic bioremediation, where hydrogen sulfide influences their performance, the SC469 consortium is the most appropriate. Additionally, it showed better performance in substrate utilization since only 68.2% of the lactate was removed, which means the sulfate reduction was more efficient than in the other cultures. These results indicate that the syntrophic relations of these three microorganisms apparently are promising for the maximal production of H2S and maximal efficiency in the removal of contaminants, such as sulfates. Meanwhile, in PD102 and SD636 homo-acetogenic activity dominated, and heteroacetogenic microorganisms contributed poorly to sulfate removal and hydrogen sulfide production. Additionally, this study provides evidence that marine sediments from partially eutrophic systems could provide a good inoculum to produce hydrogen sulfide in accordance with physicochemical characteristics detected in situ during sampling. In the case of PD102, the ORP value (−368 mV) corresponds to the equilibrium imposed by methanogenic microorganisms, such as arqueas, non-identified by the primers used. In this study, we provide evidence that a sampling site located offshore (SC469) characterized by the loss of Clostridiales microorganisms contrasts strongly in the relative abundance of bacterial species with others located nearshore where there is organic matter accumulation (SD636). This could explain the ability to identify, offshore, a relative abundance of microorganisms with sulfate-reducing activity (Desulfomicrobium, Desulfobacter and Spirochaetes) and the loss of microorganisms with greater capacity for degradation of organic macromolecules (Clostridiales microorganisms and Clostridium sp.), which require hydrolysis processes prior to fermentation.
Marine sediments of the benthic coastal zones in the world exhibit similar conditions to the ones detailed in this study. Sites such as the Yucatan Peninsula, which exhibits many different conditions that range from coarse sands with oxidant conditions and low organic matter, to silt and clay with a high level of organic matter (natural and from human activity), are promising for obtaining hydrogen sulfide, which, with suitable technologies, can be converted to valuable products (e.g., hydrogen, electric energy), with enormous benefits to the oil and gas industry. In this context, a great field of research is the start-up of live biochemical systems that can create H2 from H2S.

Author Contributions

Conceptualization, R.B.-G. and R.V.-O.; Data curation, R.B.-G., M.G.-M., I.G.-B., T.T.-T. and E.P.-L.; Formal analysis, R.B.-G., I.G.-B. and R.V.-O.; Funding acquisition, R.V.-O.; Investigation, R.B.-G. and R.V.-O.; Methodology, M.G.-M., D.V.-L., T.T.-T., E.P.-L. and R.V.-O.; Project administration, R.V.-O.; Resources, R.R.-M. and E.P.-L.; Software,; Supervision, R.B.-G. and R.V.-O.; Validation, R.B.-G., M.G.-M., I.G.-B., D.V.-L. and R.V.-O.; Visualization, R.B.-G., E.P.-L., R.R.-M. and R.V.-O.; Writing—original draft, R.B.-G. and R.V.-O.; Writing—review and editing, R.B.-G., M.G.-M., I.G.-B., D.V.-L., T.T.-T., R.R.-M., E.P.-L. and R.V.-O. All authors have read and agreed to the published version of the manuscript.

Funding

This study was funded by National Council of Science and Technology of Mexico (CONACYT), grant number 166371. M. González-Muñoz and I. García-Baustista were supported by post-graduate grants from the CONACYT numbers 345750, 21892 and 394801 for the second and third authors.

Data Availability Statement

The amplicon sequencing is available through the MG-RAST server (http://metagenomics.anl.gov) under project accession “Sedimentos Yucatan”, with the IDs 4690181.3, 4690186.3, 4690182.3 for PD102; 4690185.3, 4690187.3, 4690180.3 for SC469; and 4690184.3, 4690183.3, 4690188.3 for SD636.

Conflicts of Interest

The authors declare no conflict of interest. The funders had no role in the design of the study; in the collection, analyses, or interpretation of data; in the writing of the manuscript, or in the decision to publish the results.

References

  1. Li, A.; Chu, Y.; Wang, X.; Ren, L.; Yu, J.; Liu, X.; Yan, J.; Zhang, L.; Wu, S.; Li, S. A pyrosequencing-based metagenomic study of methane-producing microbial community in solid-state biogas reactor. Biotechnol. Biofuels 2013, 6, 3. [Google Scholar] [CrossRef] [PubMed] [Green Version]
  2. Preethi, V.; Kanmani, S. Performance of four various shapes of photocatalytic reactors with respect to hydrogen and sulphur recovery from sulphide containing wastestreams. J. Clean. Prod. 2016, 133, 1218–1226. [Google Scholar] [CrossRef]
  3. Muyzer, G.; Stams, A.J. The ecology and biotechnology of sulphate-reducing bacteria. Nat. Rev. Microbiol. 2008, 6, 441–454. [Google Scholar] [CrossRef] [PubMed]
  4. Leloup, J.; Fossing, H.; Kohls, K.; Holmkvist, L.; Borowski, C.; Jørgensen, B.B. Sulfate-reducing bacteria in marine sediment (Aarhus Bay, Denmark): Abundance and diversity related to geochemical zonation. Environ. Microbiol. 2009, 11, 1278–1291. [Google Scholar] [CrossRef] [PubMed]
  5. Sevda, S.; Dominguez-Benetton, X.; Vanbroekhoven, K.; De Wever, H.; Sreekrishnan, T.R.; Pant, D. High strength wastewater treatment accompanied by power generation using air cathode microbial fuel cell. Appl. Energy 2013, 105, 194–206. [Google Scholar] [CrossRef]
  6. Pandey, P.; Shinde, V.N.; Deopurkar, R.L.; Kale, S.P.; Patil, S.A.; Pant, D. Recent advances in the use of different substrates in microbial fuel cells toward wastewater treatment and simultaneous energy recovery. Appl. Energy 2016, 168, 706–723. [Google Scholar] [CrossRef]
  7. Barbosa, L.P.; Costa, P.F.; Bertolino, S.M.; Silva, J.C.; Guerra-Sa, R.; Leao, V.A.; Teixeira, M.C. Nickel, manganese and copper removal by a mixed consortium of sulfate reducing bacteria at a high COD/sulfate ratio. World J. Microbiol. Biotechnol. 2014, 30, 2171–2180. [Google Scholar] [CrossRef] [PubMed]
  8. van den Brand, T.P.; Roest, K.; Chen, G.H.; Brdjanovic, D.; van Loosdrecht, M.C. Potential for beneficial application of sulfate reducing bacteria in sulfate containing domestic wastewater treatment. World J. Microbiol. Biotechnol. 2015, 31, 1675–1681. [Google Scholar] [CrossRef] [PubMed]
  9. Nguyen, Y.T.; Kieu, H.T.; West, S.; Dang, Y.T.; Horn, H. Community structure of a sulfate-reducing consortium in lead-contaminated wastewater treatment process. World J. Microbiol. Biotechnol. 2017, 33, 10. [Google Scholar] [CrossRef] [PubMed]
  10. Van den Brand, T.; Snip, L.; Palmen, L.; Weij, P.; Sipma, J.; van Loosdrecht, M. Sulfate reducing bacteria applied to domestic wastewater. Water Pract. Technol. 2018, 13, 542–554. [Google Scholar] [CrossRef]
  11. Kieu, H.T.Q.; Müller, E.; Horn, H. Heavy metal removal in anaerobic semi-continuous stirred tank reactors by a consortium of sulfate-reducing bacteria. Water Res. 2011, 45, 3863–3870. [Google Scholar] [CrossRef]
  12. Gadd, G.M. Microbial influence on metal mobility and application for bioremediation. Geoderma 2004, 122, 109–119. [Google Scholar] [CrossRef]
  13. Serio, A.; Fusella, G.C.; Chaves López, C.; Sacchetti, G.; Paparella, A. A survey on bacteria isolated as hydrogen sulfide-producers from marine fish. Food Control 2014, 39, 111–118. [Google Scholar] [CrossRef]
  14. Roman, P.; Lipińska, J.; Bijmans, M.F.M.; Sorokin, D.Y.; Keesman, K.J.; Janssen, A.J.H. Inhibition of a biological sulfide oxidation under haloalkaline conditions by thiols and diorgano polysulfanes. Water Res. 2016, 101, 448–456. [Google Scholar] [CrossRef]
  15. Delforno, T.P.; Moura, A.G.; Okada, D.Y.; Sakamoto, I.K.; Varesche, M.B. Microbial diversity and the implications of sulfide levels in an anaerobic reactor used to remove an anionic surfactant from laundry wastewater. Bioresour. Technol. 2015, 192, 37–45. [Google Scholar] [CrossRef] [PubMed]
  16. Jabari, L.; Gannoun, H.; Khelifi, E.; Cayol, J.-L.; Godon, J.-J.; Hamdi, M.; Fardeau, M.-L. Bacterial ecology of abattoir wastewater treated by an anaerobic digestor. Braz. J. Microbiol. 2016, 47, 73–84. [Google Scholar] [CrossRef] [PubMed]
  17. Zhao, Y.-G.; Wang, A.-J.; Ren, N.-Q. Effect of carbon sources on sulfidogenic bacterial communities during the starting-up of acidogenic sulfate-reducing bioreactors. Bioresour. Technol. 2010, 101, 2952–2959. [Google Scholar] [CrossRef] [PubMed]
  18. Kiely, P.D.; Call, D.F.; Yates, M.D.; Regan, J.M.; Logan, B.E. Anodic biofilms in microbial fuel cells harbor low numbers of higher-power-producing bacteria than abundant genera. Appl. Microbiol. Biotechnol. 2010, 88, 371–380. [Google Scholar] [CrossRef] [PubMed]
  19. Huang, C.; Chen, F.; Liu, Q.; Zhao, Y.; Zhou, J.-Z.; Wang, A.-J. Microbial community structure and function in response to the shift of sulfide/nitrate loading ratio during the denitrifying sulfide removal process. Bioresour. Technol. 2015, 197, 227–234. [Google Scholar] [CrossRef] [PubMed]
  20. Zhou, J.; Zhou, X.; Li, Y.; Xing, J. Bacterial communities in haloalkaliphilic sulfate-reducing bioreactors under different electron donors revealed by 16S rRNA MiSeq sequencing. J. Hazard. Mater. 2015, 295, 176–184. [Google Scholar] [CrossRef] [PubMed]
  21. Zhao, Y.-G.; Zheng, Y.; Tian, W.; Bai, J.; Feng, G.; Guo, L.; Gao, M. Enrichment and immobilization of sulfide removal microbiota applied for environmental biological remediation of aquaculture area. Environ. Pollut. 2016, 214, 307–313. [Google Scholar] [CrossRef] [PubMed]
  22. Marti, E.; Balcázar, J.L. Use of pyrosequencing to explore the benthic bacterial community structure in a river impacted by wastewater treatment plant discharges. Res. Microbiol. 2014, 165, 468–471. [Google Scholar] [CrossRef] [PubMed]
  23. Herrera-Silveira, J.A.; Comin, F.A.; Aranda-Cirerol, N.; Troccoli, L.; Capurro, L. Coastal water quality assessment in the Yucatan Peninsula: Management implications. Ocean Coast. Manag. 2004, 47, 625–639. [Google Scholar] [CrossRef]
  24. Walkley, A.; Black, I.A. An examination of the degtjareff method for determining soil organic matter, and a proposed modification of the chromic acid titration method. Soil Sci. 1934, 37, 29–38. [Google Scholar] [CrossRef]
  25. APHA. Standard Methods for the Examination of Water and Wastewater: 19th Edition Supplement; American Public Health Association: Washington, DC, USA, 1996. [Google Scholar]
  26. Nagpal, S.; Chuichulcherm, S.; Peeva, L.; Livingston, A. Microbial sulfate reduction in a liquid–solid fluidized bed reactor. Biotechnol. Bioeng. 2000, 70, 370–380. [Google Scholar] [CrossRef]
  27. Labastida-Nunez, I.; Lazaro, I.; Celis, L.B.; Razo-Flores, E.; Cruz, R.; Briones-Gallardo, R. Kinetic of biogenic sulfide production for microbial consortia isolated from soils with different bioaccessible concentrations of lead. Int. J. Environ. Sci. Tech. 2013, 10, 827–836. [Google Scholar] [CrossRef] [Green Version]
  28. Cord-Ruwisch, R. A quick method for the determination of dissolved and precipitated sulfides in cultures of sulfate-reducing bacteria. J. Microbiol. Methods 1985, 4, 33–36. [Google Scholar] [CrossRef]
  29. Rittmann, B.; McCarthy, P. Environmental Biotechnology: Principles and Applications; McGraw Hill: New York, NY, USA, 2001. [Google Scholar]
  30. Schloss, P.D.; Gevers, D.; Westcott, S.L. Reducing the effects of PCR amplification and sequencing artifacts on 16S rRNA-based studies. PLoS ONE 2011, 6, e27310. [Google Scholar] [CrossRef] [Green Version]
  31. Zhang, J.; Kobert, K.; Flouri, T.; Stamatakis, A. PEAR: A fast and accurate Illumina Paired-End reAd mergeR. Bioinformatics 2014, 30, 614–620. [Google Scholar] [CrossRef] [Green Version]
  32. Caporaso, J.G.; Kuczynski, J.; Stombaugh, J.; Bittinger, K.; Bushman, F.D.; Costello, E.K.; Fierer, N.; Peña, A.G.; Goodrich, J.K.; Gordon, J.I.; et al. QIIME allows analysis of high-throughput community sequencing data. Nat. Methods 2010, 7, 335–336. [Google Scholar] [CrossRef] [Green Version]
  33. Edgar, R.C. UPARSE: Highly accurate OTU sequences from microbial amplicon reads. Nat. Methods 2013, 10, 996–998. [Google Scholar] [CrossRef] [PubMed]
  34. Meyer, F.; Paarmann, D.; D’Souza, M.; Olson, R.; Glass, E.M.; Kubal, M.; Paczian, T.; Rodriguez, A.; Stevens, R.; Wilke, A.; et al. The metagenomics RAST server—A public resource for the automatic phylogenetic and functional analysis of metagenomes. BMC Bioinform. 2008, 9, 386. [Google Scholar] [CrossRef] [PubMed] [Green Version]
  35. McDonald, D.; Price, M.N.; Goodrich, J.; Nawrocki, E.P.; DeSantis, T.Z.; Probst, A.; Andersen, G.L.; Knight, R.; Hugenholtz, P. An improved Greengenes taxonomy with explicit ranks for ecological and evolutionary analyses of bacteria and archaea. ISME J. 2012, 6, 610–618. [Google Scholar] [CrossRef] [PubMed]
  36. Team, R.D.C. R: A Language and Environment for Statistical Computing; Foundation for Statistical Computing: Vienna, Austria, 2006. [Google Scholar]
  37. Cao, J.; Zhang, G.; Mao, Z.; Fang, Z.; Yang, C. Precipitation of valuable metals from bioleaching solution by biogenic sulfides. Miner. Eng. 2009, 22, 289–295. [Google Scholar] [CrossRef]
  38. Bertolino, S.M.; Rodrigues, I.C.; Guerra-Sá, R.; Aquino, S.F.; Leão, V.A. Implications of volatile fatty acid profile on the metabolic pathway during continuous sulfate reduction. J. Environ. Manag. 2012, 103, 15–23. [Google Scholar] [CrossRef] [PubMed] [Green Version]
  39. Lynd, L.R.; Weimer, P.J.; Zyl, W.H.v.; Pretorius, I.S. Microbial cellulose utilization: Fundamentals and biotechnology. Microbiol. Molec. Biol. Rev. 2002, 66, 739. [Google Scholar] [CrossRef] [Green Version]
  40. Purdy, K.J.; Embley, T.M.; Nedwell, D.B. The distribution and activity of sulphate reducing bacteria in estuarine and coastal marine sediments. Antonie Leeuwenhoek 2002, 81, 181–187. [Google Scholar] [CrossRef] [PubMed]
  41. Fang, C.-H.; Chang, Y.-J.; Chung, W.-C.; Hsieh, P.-H.; Lin, C.-Y.; Ho, J.-M. Subset selection of high-depth next generation sequencing reads for de novo genome assembly using MapReduce framework. BMC Genom. 2015, 16, S9. [Google Scholar] [CrossRef] [Green Version]
  42. So, C.M.; Young, L.Y. Isolation and characterization of a sulfate-reducing bacterium that anaerobically degrades alkanes. Appl. Environ. Microbiol. 1999, 65, 2969–2976. [Google Scholar] [CrossRef] [Green Version]
  43. Fauque, G.D. Ecology of sulfate-reducing bacteria. In Sulfate-Reducing Bacteria; Barton, L.L., Ed.; Plenum Press: New York, NY, USA, 1995; pp. 217–241. [Google Scholar]
  44. Garcia, G.P.P.; Diniz, R.C.O.; Bicalho, S.K.; Franco, V.; Pereira, A.D.; Brandt, E.F.; Etchebehere, C.; Chernicharo, C.A.L.; de Araujo, J.C. Microbial community and sulphur behaviour in phototrophic reactors treating UASB effluent under different operational conditions. Int. Biodeteriorat. Biodegradat. 2016, 119, 486–498. [Google Scholar] [CrossRef]
  45. Rabbani, M.; Dincer, I.; Naterer, G.F. Experimental investigation of hydrogen production in a photo-electrochemical chloralkali processes reactor. Int. J. Hydrogen Energy 2016, 41, 7766–7781. [Google Scholar] [CrossRef]
  46. Ipsakis, D.; Kraia, T.; Marnellos, G.E.; Ouzounidou, M.; Voutetakis, S.; Dittmeyer, R.; Dubbe, A.; Haas-Santo, K.; Konsolakis, M.; Figen, H.E.; et al. An electrocatalytic membrane-assisted process for hydrogen production from H2S in Black Sea: Preliminary results. Int. J. Hydrogen Energy 2015, 40, 7530–7538. [Google Scholar] [CrossRef]
Figure 1. Locations of marine sediment sampling sites in the ports of Sisal, Progreso and Dzilam in the Yucatan Peninsula, Mexico.
Jmse 10 00436 g001
Figure 2. Kinetic test of hydrogen sulfide production (close symbols) and sulfate reduction (open symbols) of sulfidogenic batch reactors inoculated with (a) SC469, (b) SD636 and (c) PD102. The dashed lines represent Gompertz model fitting.
Jmse 10 00436 g002
Figure 3. pH, ORP, lactate and acetate evolution during kinetic test of hydrogen sulfide production of sulfidogenic batch reactors inoculated with: (■) SC469, (○) SD636 and (▽) PD102.
Jmse 10 00436 g003
Figure 4. Microbial diversity structure of SC469, SD636 and PD102 biomass re-collected at the end of kinetic tests.
Jmse 10 00436 g004
Table 1. Physicochemical characteristics of surficial marine sediments and water column collected in the Sisal, Progreso and Dzilam de Bravo ports in the Yucatan Peninsula, Mexico (GPS Location and depth to reach the sediments).
Surficial Sediment (−40 cm)
PortSite 1T (°C)pHEh (mV)H2S (mg/L)TOC (%)TN (µM)TP (µM)GPS LocationDepth (m)
SisalSA28.87.9280.80.419.95.321°10.100′ N90°02.817′ O4.1
SB30.36.7−279OR3.3339.56.321°09.917′ N90°03.17′ O2.3
SC30.56.8−2514691.9158.65.921°09.850′ N90°02.950′ O1.7
SD31.36.8−2566364.0354.67.821°09.600′ N90°02.883′ O2.5
SE31.26.8−273OR2.8190.97.221°09.617′ N90°02.733′ O2.8
ProgresoPA29.48.0−107290.991.81.321°19.135′ N89°41.044′ O7.0
PB30.27.7−166129.82.9263.71.821°20.254′ N89°40.455′ O8.0
PC27.66.9−361OR4.6530.36.821°17.117′ N89°41.833′ O2.8
PD26.06.6−368102.22.4359.36.821°18.983′ N89°40.167′ O6.4
PE27.67.6−30631.31.1110.85.421°19.050′ N89°41.850′ O3.3
Dzilam de BravoDA28.27.6−90DL0.974.75.021.3980° N88.8889° O1.8
DB28.37.6−1620.11.6120.85.521.4008° N88.8809° O1.4
DC27.07.5−1100.11.062.14.921.3978° N88.8987° O1.5
DD29.37.3−2380.15.6380.27.521.3951° N88.8830° O1.0
DE29.47.4−440.11.983.56.321.2931° N88.8971° O0.8
Water Column Close to Surficial Sediment
PortSiteT (°C)pHEh (mV)DO (mg L−1)NH4 (µM)NO2 (µM)NO3 (µM)TN (mg m−3)TP (mg m−3)
SisalSA29.08.5−27.76.33.20.10.348.03.7
SB29.08.4−456.24.10.44.2121.00.6
SC29.28.4−57.18.412.00.717.3419.32.8
SD29.18.2−71.96.72.70.11.154.71.5
SE29.57.9−44.66.429.92.015.0656.07.1
ProgresoPA29.18.6−446.71.50.10.123.02.8
PB29.78.7−46.16.60.90.10.216.53.7
PC25.68.9−49.37.23.10.20.857.55.6
PD26.59.0−1006.91.80.10.329.82.8
PE26.58.9−51.56.41.80.21.042.34.6
Dzilam de BravoDA26.48.2−6.46.21.40.32.559.15.3
DB26.58.1−8.56.14.40.64.6133.68.1
DC27.18.0−21.25.81.50.32.660.11.9
DD27.37.9−9.76.12.40.52.475.52.8
DE27.28.3−26.861.10.54.281.35.6
OR refers to above the detection limit and DL refers to below detection limit. 1 The first letter of the site column refers to port where the sample was collected and the seconds letter to progressive sample of sampling.
Table 2. Organic half-reactions and their Gibbs free energy for calculating electron balances between donor and acceptors used in this study [29].
Reaction NumberReduced-Oxidized CompoundsHalf Chemical Reaction∆G° (kJ/mol)
1Lactate C H 3 C H O H C O O + 4 H 2 O H C O 3 + 2 C O 2 + H + + 12 e −387.48
2Acetate C H 3 C O O + 3 H 2 O H C O 3 + C O 2 + 8 H + + 8 e −219.2
3Propionate C H 3 C H 2 C O O + 5 H 2 O H C O 3 + 2 C O 2 + 14 H + + 14 e −386.82
4Sulfate S O 4 2 + 19 2 H + + 8 e 1 2 H 2 S + 1 2 H S + 4 H 2 O 166.8
5Sulfate S O 4 2 + 8 H + + 6 e S + 4 H 2 O 117
6Cell synthesis C 5 H 7 O 2 N + 9 H 2 O H C O 3 + 4 C O 2 + N H 4 + + 20 H + + 20 e -
Table 3. Kinetic parameters using SC469, SD636 and PD102 consortia determined in microcosm experiments: [SO42−]max maximum specific sulfate consumption, [H2S]max maximum specific hydrogen sulfide production, rmax, sulfate maximum specific sulfate consumption rate and rmax, sulfide maximum specific hydrogen sulfide production rate.
Kinetic ParametersConsortia
SC469SD636PD102
[SO42−]max consumption
(mmol g−1 VSS)
242 ± 2 a197.3 ± 2 a200 ± 10 a
[H2S]max production
(mmol g−1 VSS)
246 ± 28 a132 ± 8 b110 ± 3 b
−rmax, sulfate
(mmol g−1 VSS d−1)
100 ± 23 a144 ± 38 b22 ± 2 c
rmax, sulfid
(mmol g−1 VSS d−1)
113 ± 50 a95 ± 30 a144 ± 89 a
R2, sulfate0.970.990.94
R2, sulfide0.990.910.92
All kinetic parameters were calculated using Gompertz model fit. R2 is regression coefficient for Gompertz model for the adjustment of kinetic curve of each experiment. All data are presented as mean ± standard error (n = 3). The values of kinetic parameters marked with different letters are statistically different (p < 0.05).
Table 4. Lactate biodegradation pathways used in the mass and electron balances with the SC469, SD636 and PD102 consortia using sulfate-reducing and fermentative microorganisms.
Reaction NumberLactate Biodegradation PathwayReaction∆G° (kJ/mol)Involved Consortium
7Total sulfate-reducing metabolism C H 3 C H O H C O O + 3 2 S O 4 2 + 9 4 H + 3 4 H 2 S + 3 4 H S + 2 H 2 O + H C O 3 + 2 C O 2 −137.28CS459
8Lactate fermentation C H 3 C H O H C O O + 1 2 H C O 3 + 11 H + 3 2 C H 3 C O O + 1 2 H 2 O + 1 2 C O 2 −58.68CS459
9Total sulfate reducing metabolism 2 C H 3 C H O H C O O + S O 4 2 H S + H + + H C O 3 + 2 C H 3 C O O −160.1SD636
PD102
10Lactate fermentation C H 3 C H O H C O O 6 7 C H 3 C H 2 C O O + 1 84 H C O 3 + 1 42 H 2 O + 1 42 C O 2   −55.92SD636
PD102
11Partial sulfate-reducing metabolism C H 3 C O O + 4 3 S O 4 2 + 8 3 H + 4 3 S + H C O 3 + C O 2 −66SD636
PD102
12Cell synthesis C H 3 C H O H C O O + 2 5 C O 2 + 3 5 N H 4 + 3 5 C 5 H 7 O 2 N + 7 5 H 2 O + 2 5 H C O 3 -CS459
SD636
PD102
Table 5. Mass and electron balances between lactate and products associated with different lactate biodegradation pathways.
InoculumLactateSulfateMass Products (mmol)Ratio [OCS/OCL]fsBiomass Net Yield (Yn)
OCL (mmol)TMD (mmol)OCS (mmol)
AcetatePropionateBiomassSulfide
SC4691.841.81.460.800.00.301.190.790.110.16
SD6362.642.151.210.570.100.270.790.460.070.10
PD1022.161.931.090.600.00.360.660.50.110.17
InoculumNEDS (meq e)TED (meq e)IEA (meq e)Electron-acceptor products (meq e)∑(EAP) (meq e)% EA-SRMP% loss electrons
SC46922.121.612.27.440.02.49.5219.3587.612.4
SD63631.725.89.76.730.822.126.3516.0350.649.4
PD10225.923.27.95.360.02.855.3413.5652.347.7
Where: TMD: Theoretical mass donor; OCL: Observable consumption of lactate; OCS: Observable consumption of lactate; fs: electrons fraction to cell synthesis; EAP: electron-acceptor products (meq e); EA-SRMP% electrons acceptor by sulfate-reducing microbial pathway; NEDS: Net electron-donor substrate (meq e); TED: Theoretical electrons-donor (meq e); IEA: Initial electron-acceptors (meq e); % loss electrons: Includes electrons recovered in other non-quantified sulfur products (e.g., sulfur, sulfite between others).
Table 6. Diversity statistics from each batch culture.
SamplesOTU ObservedChao1Shannon (H′)
PD102-1698897.93033.563574
PD102-29031150.7793.808334
PD102-37611099.9423.828718
SC469-15901008.3613.40248
SC469-210091137.6485.626442
SC469-3427591.52.403016
SD636-1745938.74.673162
SD636-27831306.8374.643861
SD636-310701384.2045.619174
Publisher’s Note: MDPI stays neutral with regard to jurisdictional claims in published maps and institutional affiliations.

