Abstract
Electric anomaly detection (EAD) has been widely used for target detection in underwater areas. However, due to the high path loss in the water, an electric anomaly is usually submerged in environmental noise and interference, which affects the detection performance of traditional anomaly detection methods. To address this problem and improve the detection accuracy in a low signal-to-noise ratio (SNR) environment, this paper proposes an active electric anomaly detection (AEAD) method based on the orthonormal basis function (OBF). First, a four-electrode active detection system was designed. Then, a set of OBFs based on the electric field disturbance model were derived to describe the detection system characteristic, linearly and effectively. Finally, an AEAD system was designed, and the proposed method was verified experimentally using a electromagnetic simulation tool to detect a spherical anomaly target. The experimental results show that, compared with the traditional AEAD methods, the proposed method has a better performance.
1. Introduction
The electric anomaly detection (EAD) technology exploits the bio-inspired sensor technology named artificial electric-sense, which can distinguish the objects whose electric properties are different from those of surrounding environment [1,2,3]. It has been used in many areas, including subsea cable detection [4], archaeology prospection [5], and underwater obstacle avoidance [6]. However, the electric field decays rapidly with the propagation distance in lossy media, such as underwater medium and underground medium. Therefore, effective methods are urgently needed to improve the detection probability of electric anomalies.
In recent years, several methods for EAD have been proposed, such as the electric-sense method [7,8], the electrical impedance method [4,9,10,11,12], and the amplitude information–frequency characteristics method [13,14]. Bazeille et al. [7] proposed a purely model-based heuristic strategy, which estimates the pose and size of an ellipsoidal object based on a single straight trajectory. The proposed strategy detects a perturbing object at the first algorithm stage using a fixed current threshold. Shang et al. [8] introduced an improved underwater electric field-based target localization algorithm, which combines subspace scanning algorithm and meta-EP PSO. In this algorithm, the uniform circular electrodes were used to detect a dipole source. Schuldei et al. [4] developed an analytical model, which calculates the potential based on a static electrical field for detecting cables buried in the seabed. Cho et al. [11] proposed a real-time underwater object detection method, which adopts geophysical direct–current resistivity techniques to track small submarines in the water at depths of less than 100 m under acoustically noisy conditions. Ren et al. [13] developed an amplitude information–frequency characteristic recognition algorithm to improve the measurement accuracy and used three multi-frequency excitation types, the signals-square wave, single pulse, and biphasic pulse, to detect objects underwater. In order to detect naval submarines, Schaefer et al. [15] derived analytic expressions for above-water electric potential fields and presented numerical simulations which coupled the calculation of the stationary current density distribution with electrostatic fields.
In many fields, it is difficult and also unnecessary to solve the localization problem using the electric field information on arbitrary objects and environment [16]. Instead, using a simplified model, such as spheroids, can provide solutions with high robustness, good accuracy, and high efficiency. This study aims to design an active electric anomaly detection (AEAD) algorithm for detecting a spherical target under the existence of an unknown background electric field. Inspired by magnetic anomaly detection (MAD) technology, this paper proposes an AEAD method based on the orthonormal basis functions (OBFs) to locate a target underwater, which essentially represents anomaly signal detection technology.
The main contributions of this paper are: (1) an underwater active target detection method is proposed based on electric field with two pair of electrodes; (2) three OBFs are derived and verified by simulations, which significantly improve the underwater target detection performance. The rest of this paper is organized as follows. In Section 2, the mathematical expression of the potential field distribution underwater is derived based on the excitation electrodes. The voltage variation between the receiving electrodes in the AEAD system is used to characterize the electric anomaly caused by the presence of a target. To achieve this, a set of three OBFs are derived. The acquired signal can be performed by correlating it with the three OBFs, which greatly improves the detection performance. The simulations are presented in Section 3. In Section 4, experimental results are given to demonstrate that the proposed method can effectively improve the detection performance and that it is not affected by the unknown background electric field. In Section 5, the AEAD adaptability in the active and passive scenes are discussed. The conclusions and future work directions are given in Section 6.
2. AEAD Method
2.1. Potential Field Perturbation
This paper aims to determine the position of a spherical metallic or insulator target under water based on the electric field information. A target placed in an electric field develops a surface charge distribution in response to the surrounding field when its electrical characteristics (conductivity or dielectric coefficient ) differ from those of the background media [17]. It is assumed that a target is a sphere with a radius a surrounded by a uniform electric field E. Under this assumption, the analytic solution of the potential field perturbation is given [17]:
where is a distance from the target center to the observer, and r is the norm of ; is the coefficient corresponding to the target and background media electrical characteristics; for a perfectly conducting spherical target, , and for an insulating spherical target, .
2.2. AEAD System
In the AEAD model, as shown in Figure 1, the detection system is assumed to move along trajectory l, with the unit vector , and the target is located at a fixed position. The closest point of approach (CPA) distance can be obtained, where CPA is the closest point from the target to the movement trajectory of the detection system [18]. The vector from the target to the CPA is denoted by , where is the unit vector. Then, a coordinate can be obtained by using the CPA and trajectory l. In the AEAD model, it is assumed that the detection system is placed at point D along a straight-line l. A pair of excitation electrodes and are displaced at () and (), respectively. The electric sensors denoted by and are respectively set at () and () for measuring the perturbation voltage U.
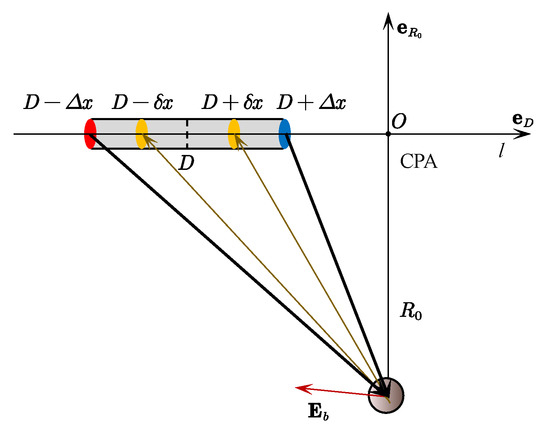
Figure 1.
AEAD system model.
To analyze the features of the AEAD model, for simplicity, dimensionless variables are expressed as , , , , and , and they all represent a ratio of a certain detection system electrode position to the CPA distance . The distance from electrode to the target can be calculated by
and its unit vector is given by
Similarly, the distance from electrode to the target can be expressed as
and its unit vector is given by
The distance from the target to electrode can be calculated by
and its unit vector is given by
The distance from the target to electrode is calculated by
and its unit vector is given by
2.3. Active Electric Field at Target
The active electric field at a target is given by (1) and consists of two parts: active electric field , which is produced by electrodes and of the detection system, and ambient electric field , which is constant but unknown. Thus, can be obtained. The active electric field is expressed as follows:
where I is the current from electrodes and .
Based on the potential field perturbation model in (1), electric sensor can sense the potential perturbation , which can be calculated by
where and are respectively given by:
Similarly, the potential perturbation of electric sensor is obtained as
where and are, respectively, given by:
Moreover, the following relationship can be obtained
2.4. AEAD OBF Definition
According to (19)–(21), variables constitute a set of linearly independent functions due to the fact that the they are not equal to zero in the domain of v [19]. Therefore, these three functions can be transformed to orthonormal bases by the Gram–Schmidt procedure as follows:
Then, the AEAD model’s OBFs (, , and ) can be obtained by the normalization method as follows:
The OBFs , , and satisfy the following condition
The curves OBFs , , and are given in Figure 2. As shown in Figure 2, the effective area of the entire function is almost covered when v is between and .
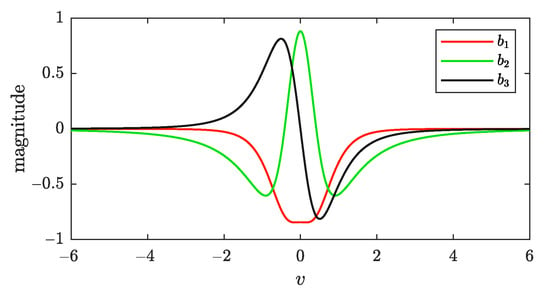
Figure 2.
The , , and curves.
2.5. AEAD Method
Equation (18) can be expressed using the AEAD model’s OBFs as follows
The coefficients of the OBFs can be calculated by
where is the amplitude component, which indicates that the electric anomaly signal is matched-filter processed by each orthogonal function [20].
In an actual measurement, the voltage acquired from and are sequentially discrete. As mentioned before, this study assumes that the AEAD system moves along trajectory l and measuring points are set at every m, so . Therefore, M voltage values are obtained . The mth point is regarded as the current point of signal processing. Accordingly, (28) can be rewritten as
where and
Equation (29) denotes the accumulation in a finite window from to .
Commonly, a feature of the electric anomaly has been considered in the normalized energy model based on the three amplitude components, which can be expressed in (31), and the calculation process is depicted in Figure 3.
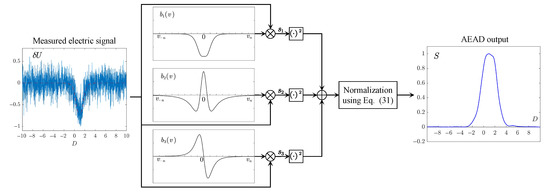
Figure 3.
Diagram of AEAD OBF energy calculation.
In the signal processing procedure (18) and (31), the value of the CPA distance is commonly unknown. In Qin’s work, can be estimated by means of a multi-channel manner for several presumed values [19]. In this study, It is considered that a target is lying on the surface or subsurface of the river bed. Based on this assumption, can be obtained via sonar or other sensors. The target radius is an unknown constant coefficient, it does not affect the feature of S. Thus, the estimation of can be neglected.
3. AEAD Method Simulation
This section presents the performance evaluation of the proposed AEAD method. In the simulation, it was assumed that a target was located in the origin of the Cartesian coordinate system. The parameters used in the simulation are given in Table 1. The CPA distance from the target to the trajectory l was m, and the measurement interval was .

Table 1.
Simulation parameters.
The synthetic signal of the electric anomaly is represented by the black line () in Figure 4. As shown in Figure 4, the perturbation voltage (red line, ) of the active electric field differed from the background electric field (green line, ).
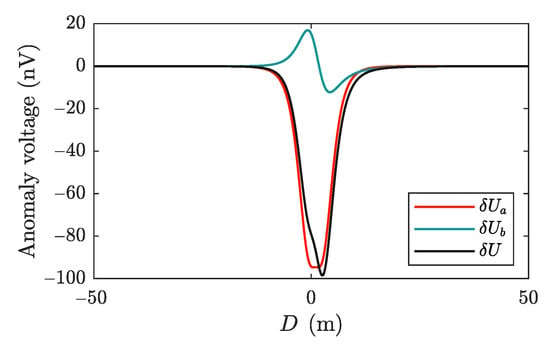
Figure 4.
The synthetic signal of the electric anomaly along the trajectory l.
To analyze the proposed AEAD method’s performance, the Gaussian white noise was added to the synthetic signal, as shown in Figure 5. The ratio of the anomaly signal’s instantaneous maximum power to the variance of noise was used to calculate the SNR [21]. In the simulation, the SNR of the noise-containing anomaly signal was dB. Thus, the electric anomaly signal was completely submerged in the noise.
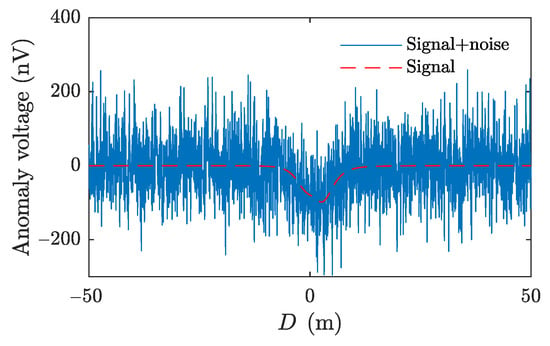
Figure 5.
Electric anomaly signal with Gaussian white noise.
The canonical anomaly detection techniques, including the minimum information entropy (MED) [22,23] and empirical mode decomposition (EMD) [24], were used for comparison. The result obtained by the proposed AEAD processing method is shown by the red line in Figure 6, where the target signal can be clearly revealed. The peak of the red curve indicates the estimated position of the target, which was located at m, and the locating error was m. The anomaly signal was decomposed into multiple intrinsic modal functions (IMFs) with different scales by the EMD. In the simulation, eight IMFs revealed different time scales of the anomaly signal. An approximated anomaly signal was reconstructed using IMF5–Residual, as shown in Figure 6 (green line) with the estimated position of m and the locating error of m. Entropy is a basic concept of information theory, and it has been widely used in different information measurement applications [20]. The information entropy of the measured noise pattern will change when a target occurs [22]. As shown by the purple line in Figure 6, the traditional MED methods could reveal the anomaly signal with the estimated position of m and the locating error of m. However, the positions of marked-1 and marked-2 had false features of an anomaly in the outputs of the MED method and EMD. Based on the results, the AEAD method achieved better performance than the EMD and MED method under the low SNR input.
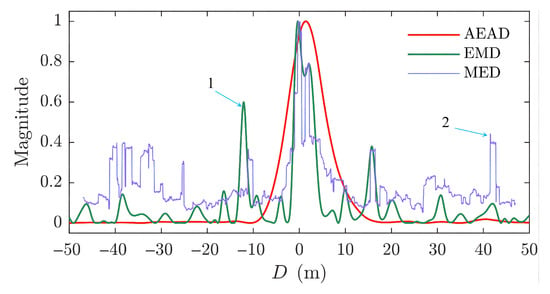
Figure 6.
The target detection results of AEAD, EMD and MED methods.
4. Simulation Experiment
4.1. Experimental Simulation Setup
To verify the proposed AEAD method experimentally, a simulation experiment was conducted using the commercial electromagnetic software of CST EM Studio. The experimental simulation setup is shown in Figure 7a. The experiments were performed on a 100 m × 100 m × 6 m water model. A metal sphere was used as an anomaly target, and it was placed at the bottom of the water model and positioned in the origin of the Cartesian coordinate system with a radius of m. The survey line l was parallel to the x-axis at m and m, and the range on the x-axis was m, yielding m. The background field mV/m was generated by two electrode pads along the x direction. The experimental parameters are given in Table 2. The raw data acquired from CST is given in Figure 7b, where certain deviations caused by the solver resolution and the CST mesh grid settings can be observed. As a result, the acquired data were not smooth.

Figure 7.
The CST simulation experiment. (a) The experimental simulation setup. (b) The electric anomaly signal.

Table 2.
Experimental parameters.
4.2. Experimental Results
The simulation experiment results of different methods are presented in Figure 8. As shown in Figure 8, the traditional MED method (red dashed line) achieved the worst detection performance among all methods and could hardly point out the location of the anomaly target. That was because there were only 101 sample points within m, which could not reflect the true voltage probabilistic distribution. However, the proposed AEAD method and EMD method could accurately reveal the position of the anomaly target. Still, the EMD method had more obvious false features, as shown at marked-1 in Figure 8. This could lead to false alarms during the detection process, affecting the detection accuracy. Thus, compared with the EMD method, the proposed AEAD method achieved better performance in suppressing false features in target detection.
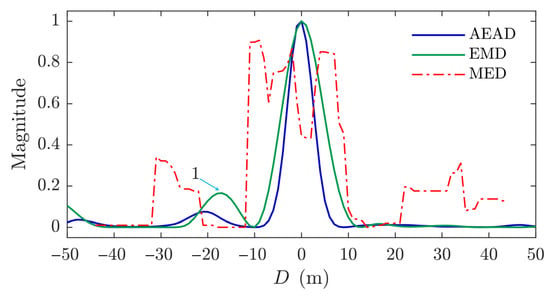
Figure 8.
Experiment results of different methods.
5. Discussion
By analyzing the electric field anomaly detection, the AEAD method is proposed, and the detection performances of different detection methods are compared. According to the simulation and experimental results in Figure 6 and Figure 8, the AEAD method is superior to the other methods under a weak signal. As given in Equations (22)–(24), the proposed method has three OBFs, among which is the base function corresponding to the active electric field , while and are the base functions corresponding to the background electric field detection. If it is prior known that no background electric field () but only exists, then can be applied as the base function in the AEAD algorithm, and and can be neglected. Contrarily, if there is only the background electric field and the active electric field disappears (), then the OBFs and can be used to detect an anomaly by setting . According to Rasnow’s theory, a sphere with a radius placed in a uniform electric field generates a purely dipolar potential proportional to the field strength [17]. That means the proposed AEAD method can also detect a dipole source passively. In addition, the core components of the proposed AEAD method are two pairs of electrodes fixed on a cylindrical bracket, which makes the AEAD method a low-cost and easy-to-implement solution. In this paper, the CPA distance is known value. However, in practice situation, is an inaccurate value because of the measurement error. Thus, in our later work, the estimation of CPA distance will be further studied.
6. Conclusions
In this paper, an advanced AEAD method is proposed. In the proposed method, a pair of electrodes are used to generate the electric field at the detection area, and another two electrodes are employed to measure the perturbation voltage. Then, the electric field signal propagation underwater is analyzed, and a set of OBFs are obtained. Based on the OBFs, an effective method for target detection using the anomaly signal is developed. The proposed method can be adapted to both active and passive scenarios. The proposed method is verified by the CST simulation experiment. The experimental results show that the proposed method has better detection performance compared to the traditional anomaly detection methods.
Author Contributions
Y.X. conducted the mathematical modeling and the simulations. Y.X. and W.S. wrote the draft. S.Z. and P.J. contributed to the revisions and the discussions of the results. J.G., V.K. and V.G. put forward the idea and checked the simulation. All authors have read and agreed to the published version of the manuscript.
Funding
This work was supported by the National Natural Science Foundation of China (no. 52101383), the Sino–Russian Cooperation Fund of Harbin Engineering University (no. 2021HEUCRF006), the Ministry of Science and Higher Education of the Russian Federation (no. 075-15-2020-934), and the International Science & Technology Cooperation Program of China (no. 2014DFR10240).
Institutional Review Board Statement
Not applicable.
Informed Consent Statement
Not applicable.
Data Availability Statement
Not applicable.
Conflicts of Interest
The authors declare no conflict of interest.
References
- Boyer, F.; Lebastard, V.; Ferrer, S.B.; Geffard, F. Underwater pre-touch based on artificial electric sense. Int. J. Robot. Res. 2020, 39, 729–752. [Google Scholar] [CrossRef]
- Fujita, K.; Kashimori, Y. Representation of object’s shape by multiple electric images in electrolocation. Biol. Cybern. 2019, 113, 239–255. [Google Scholar] [CrossRef] [PubMed]
- Solberg, J.R.; Lynch, K.M.; MacIver, M.A. Active electrolocation for underwater target localization. Int. J. Robot. Res. 2008, 27, 529–548. [Google Scholar] [CrossRef]
- Schuldei, A.; Suthau, T.; John, F.; Ardelt, G.; Hellbrück, H. Development of an Electro Impedance Tomography-based Platform for Measurement of burial Depth of Cables in Subsea Sediments. In Proceedings of the OCEANS 2019-Marseille, Marseille, France, 17–20 June 2019; pp. 1–8. [Google Scholar]
- Simyrdanis, K.; Moffat, I.; Papadopoulos, N.; Kowlessar, J.; Bailey, M. 3D mapping of the submerged Crowie barge using electrical resistivity tomography. Int. J. Geophys. 2018, 2018, 6480565. [Google Scholar] [CrossRef]
- Dimble, K.D.; Faddy, J.M.; Humbert, J.S. Electrolocation-based underwater obstacle avoidance using wide-field integration methods. Bioinspir. Biomim. 2014, 9, 016012. [Google Scholar] [CrossRef]
- Bazeille, S.; Lebastard, V.; Boyer, F. A purely model-based approach to object pose and size estimation with electric sense. IEEE Trans. Robot. 2020, 36, 1611–1618. [Google Scholar] [CrossRef]
- Shang, W.; Xue, W.; Li, Y.; Wu, X.; Xu, Y. An Improved Underwater Electric Field-Based Target Localization Combining Subspace Scanning Algorithm And Meta-EP PSO Algorithm. J. Mar. Sci. Eng. 2020, 8, 232. [Google Scholar] [CrossRef]
- Kolehmainen, V.; Ehrhardt, M.J.; Arridge, S.R. Incorporating structural prior information and sparsity into EIT using parallel level sets. Inverse Probl. Imaging 2019, 13, 285. [Google Scholar] [CrossRef]
- Valdivia, N.P.; Williams, E.G.; Alqadah, H.F. Underwater Electromagnetic Holography Imaging Techniques for Shallow Water Mediums. Prog. Electromagn. Res. 2017, 73, 95–116. [Google Scholar] [CrossRef][Green Version]
- Cho, S.H.; Jung, H.K.; Lee, H.; Rim, H.; Lee, S.K. Real-time underwater object detection based on DC resistivity method. IEEE Trans. Geosci. Remote Sens. 2016, 54, 6833–6842. [Google Scholar] [CrossRef]
- Lee, H.; Jung, H.K.; Cho, S.H.; Kim, Y.; Rim, H.; Lee, S.K. Real-Time Localization for Underwater Moving Object Using Precalculated DC Electric Field Template. IEEE Trans. Geosci. Remote Sens. 2018, 56, 5813–5823. [Google Scholar] [CrossRef]
- Ren, Q.; Peng, J.; Chen, H. Amplitude information-frequency characteristics for multi-frequency excitation of underwater active electrolocation systems. Bioinspir. Biomim. 2019, 15, 016004. [Google Scholar] [CrossRef] [PubMed]
- Han, Y.; Wu, H.; Peng, J.; Ou, B. The Effect of Object Geometric Features on Frequency Inflection Point of Underwater Active Electrolocation System. J. Mar. Sci. Eng. 2021, 9, 756. [Google Scholar] [CrossRef]
- Schaefer, D.; Thiel, C.; Doose, J.; Rennings, A.; Erni, D. Above water electric potential signatures of submerged naval vessels. J. Mar. Sci. Eng. 2019, 7, 53. [Google Scholar] [CrossRef]
- Bai, Y.; Snyder, J.B.; Peshkin, M.; MacIver, M.A. Finding and identifying simple objects underwater with active electrosense. Int. J. Robot. Res. 2015, 34, 1255–1277. [Google Scholar] [CrossRef]
- Rasnow, B. The effects of simple objects on the electric field of Apteronotus. J. Comp. Physiol. 1996, 178, 397–411. [Google Scholar] [CrossRef]
- Ginzburg, B.; Frumkis, L.; Kaplan, B.Z. An efficient method for processing scalar magnetic gradiometer signals. Sens. Actuators Phys. 2004, 114, 73–79. [Google Scholar] [CrossRef]
- Qin, Y.; Li, K.; Yao, C.; Wang, X.; Ouyang, J.; Yang, X. Magnetic Anomaly Detection Using Full Magnetic Gradient Orthonormal Basis Function. IEEE Sens. J. 2020, 20, 12928–12940. [Google Scholar] [CrossRef]
- Fan, L.; Kang, C.; Wang, H.; Hu, H.; Zhang, X.; Liu, X. Adaptive Magnetic Anomaly Detection Method Using Support Vector Machine. IEEE Geosci. Remote Sens. Lett. 2020, 19, 1–5. [Google Scholar] [CrossRef]
- Fan, L.; Kang, C.; Hu, H.; Zhang, X.; Liu, J.; Liu, X.; Wang, H. Gradient signals analysis of scalar magnetic anomaly using orthonormal basis functions. Meas. Sci. Technol. 2020, 31, 115105. [Google Scholar] [CrossRef]
- Tang, Y.; Liu, Z.; Pan, M.; Zhang, Q.; Wan, C.; Guan, F.; Wu, F.; Chen, D. Detection of magnetic anomaly signal based on information entropy of differential signal. IEEE Geosci. Remote Sens. Lett. 2018, 15, 512–516. [Google Scholar] [CrossRef]
- Sheinker, A.; Salomonski, N.; Ginzburg, B.; Frumkis, L.; Kaplan, B.Z. Magnetic anomaly detection using entropy filter. Meas. Sci. Technol. 2008, 19, 045205. [Google Scholar] [CrossRef]
- Fan, L.; Kang, C.; Wang, H.; Hu, H.; Zou, M. Adaptive Magnetic Anomaly Detection Method with Ensemble Empirical Mode Decomposition and Minimum Entropy Feature. J. Sens. 2020, 2020, 8856577. [Google Scholar] [CrossRef]
Publisher’s Note: MDPI stays neutral with regard to jurisdictional claims in published maps and institutional affiliations. |
© 2022 by the authors. Licensee MDPI, Basel, Switzerland. This article is an open access article distributed under the terms and conditions of the Creative Commons Attribution (CC BY) license (https://creativecommons.org/licenses/by/4.0/).