
Probabilistic Damage Stability for Passenger Ships—The p-Factor Illusion and Reality


 ,
,  and
and
Abstract
:1. Introduction
- —represents the loading condition under consideration.
- —represents the total number of loading conditions considered in the calculation of , usually three draughts covering the operational draught range of the vessel.
- —represents a weighting factor applied to each initial draught.
- —represents each compartment or group of compartments under consideration for the loading condition, .
- —is the total number of all feasible damage scenarios involving flooding of individual compartments or groups of adjacent compartments.
- —is the probability that, for the loading condition,, only the compartment or group of compartments under consideration are flooded, disregarding any horizontal subdivision.
- —accounts for the conditional probability of survival following flooding of the compartment or group of compartments under consideration for loading condition , weighted by the probability that the space above a horizontal subdivision may not be flooded.
2. p-Factor Definition
- SOLAS approach to defining and using the p-factor
- Whether the distributions are marginal or conditional probabilities
- Derivations of the breach distributions based on statistical or direct approaches
- Zonal or non-zonal approaches and definition of breaches in each approach
- Sampling methods for numerical simulations/calculations of ship survivability
- Crashworthiness considerations
2.1. SOLAS Damage Breach Distributions
2.2. Deriving p-Factors Using Zonal and Non-Zonal Damage Breach Distributions
2.3. Sampling Breach Distributions for Damage Stability Assessment
- σ = sample standard deviation,
- n = number of samples.

- F(x) = the true sample CDF,
- = lower and upper bounds,
- 1 − α = level of confidence, i.e., α = 0.05 for 95% confidence.
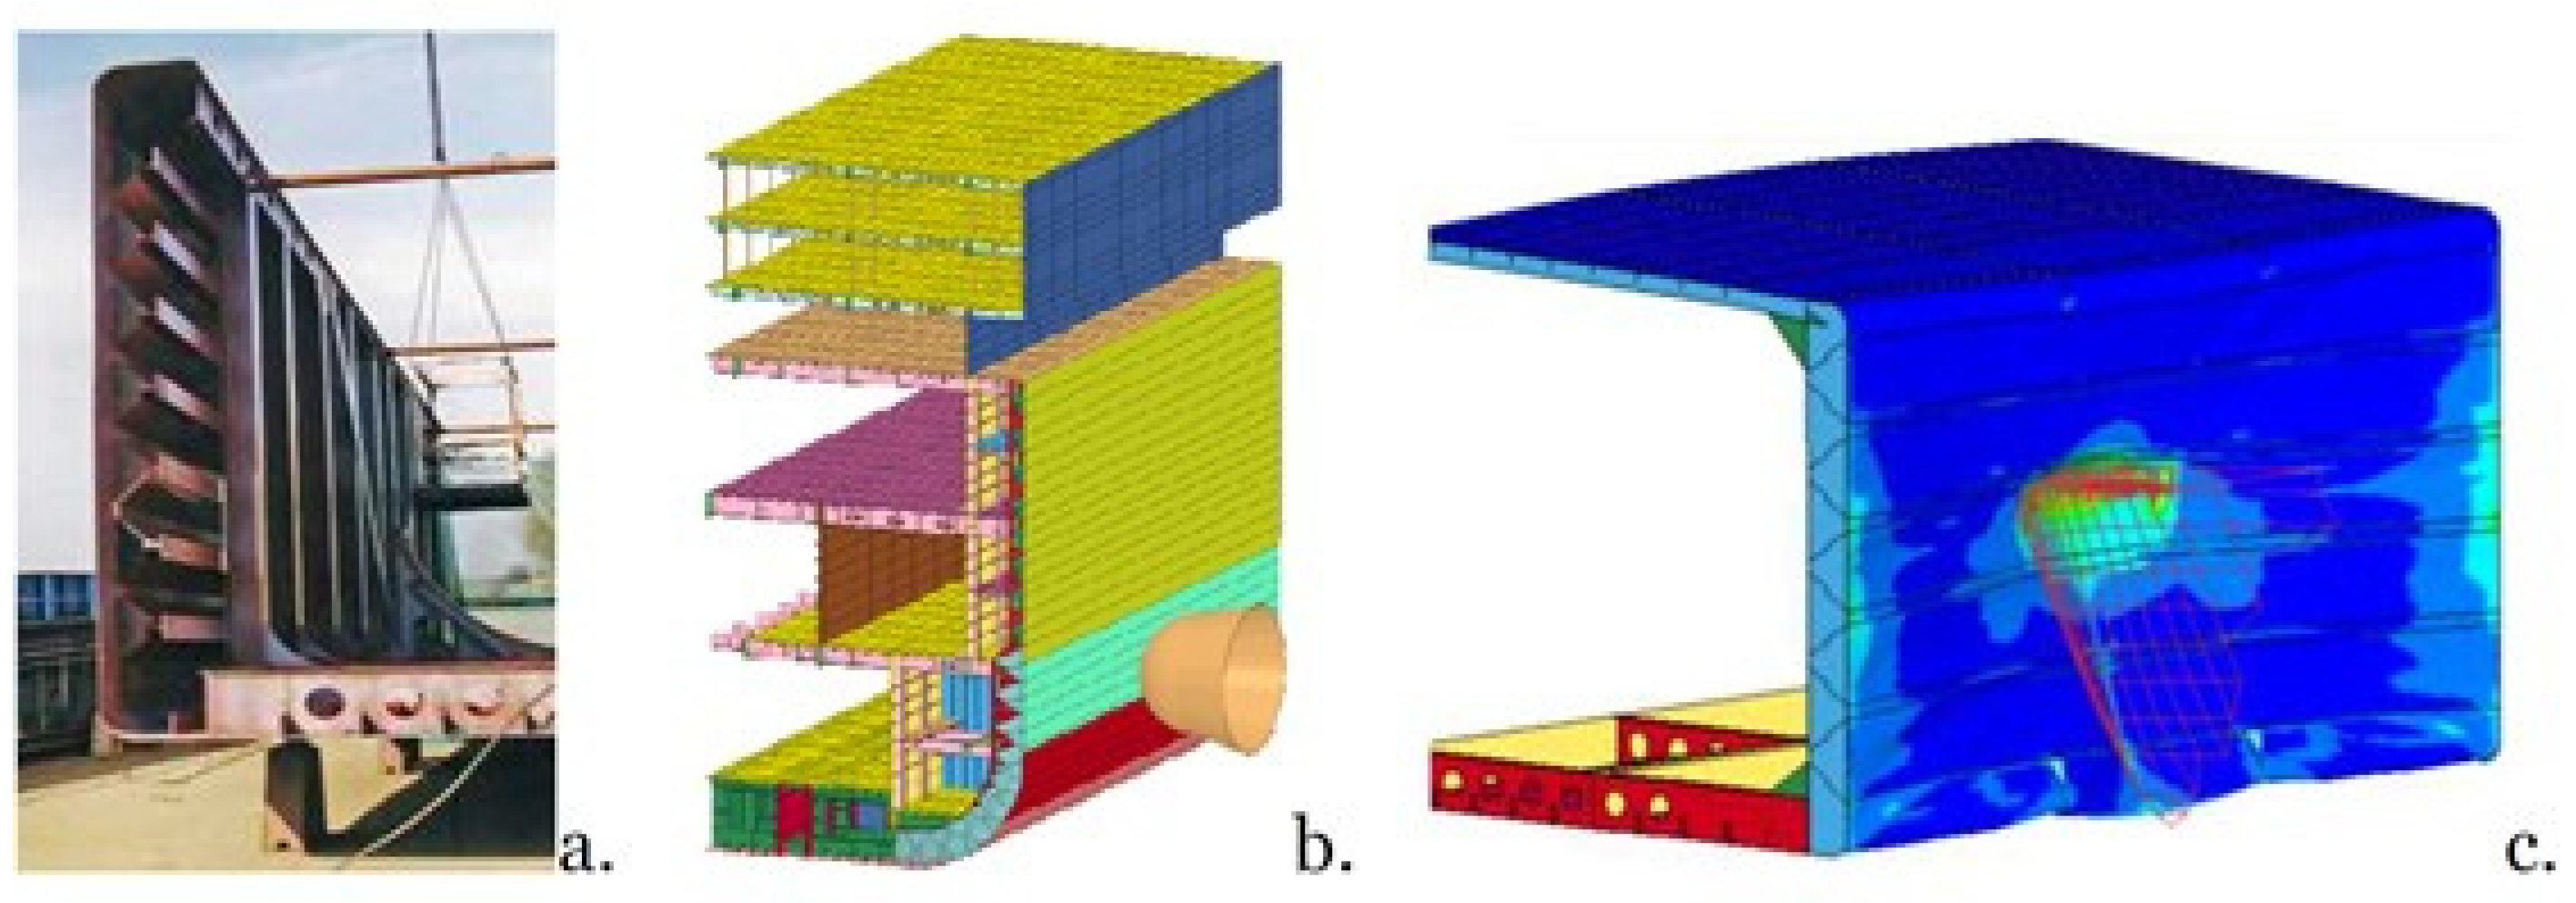
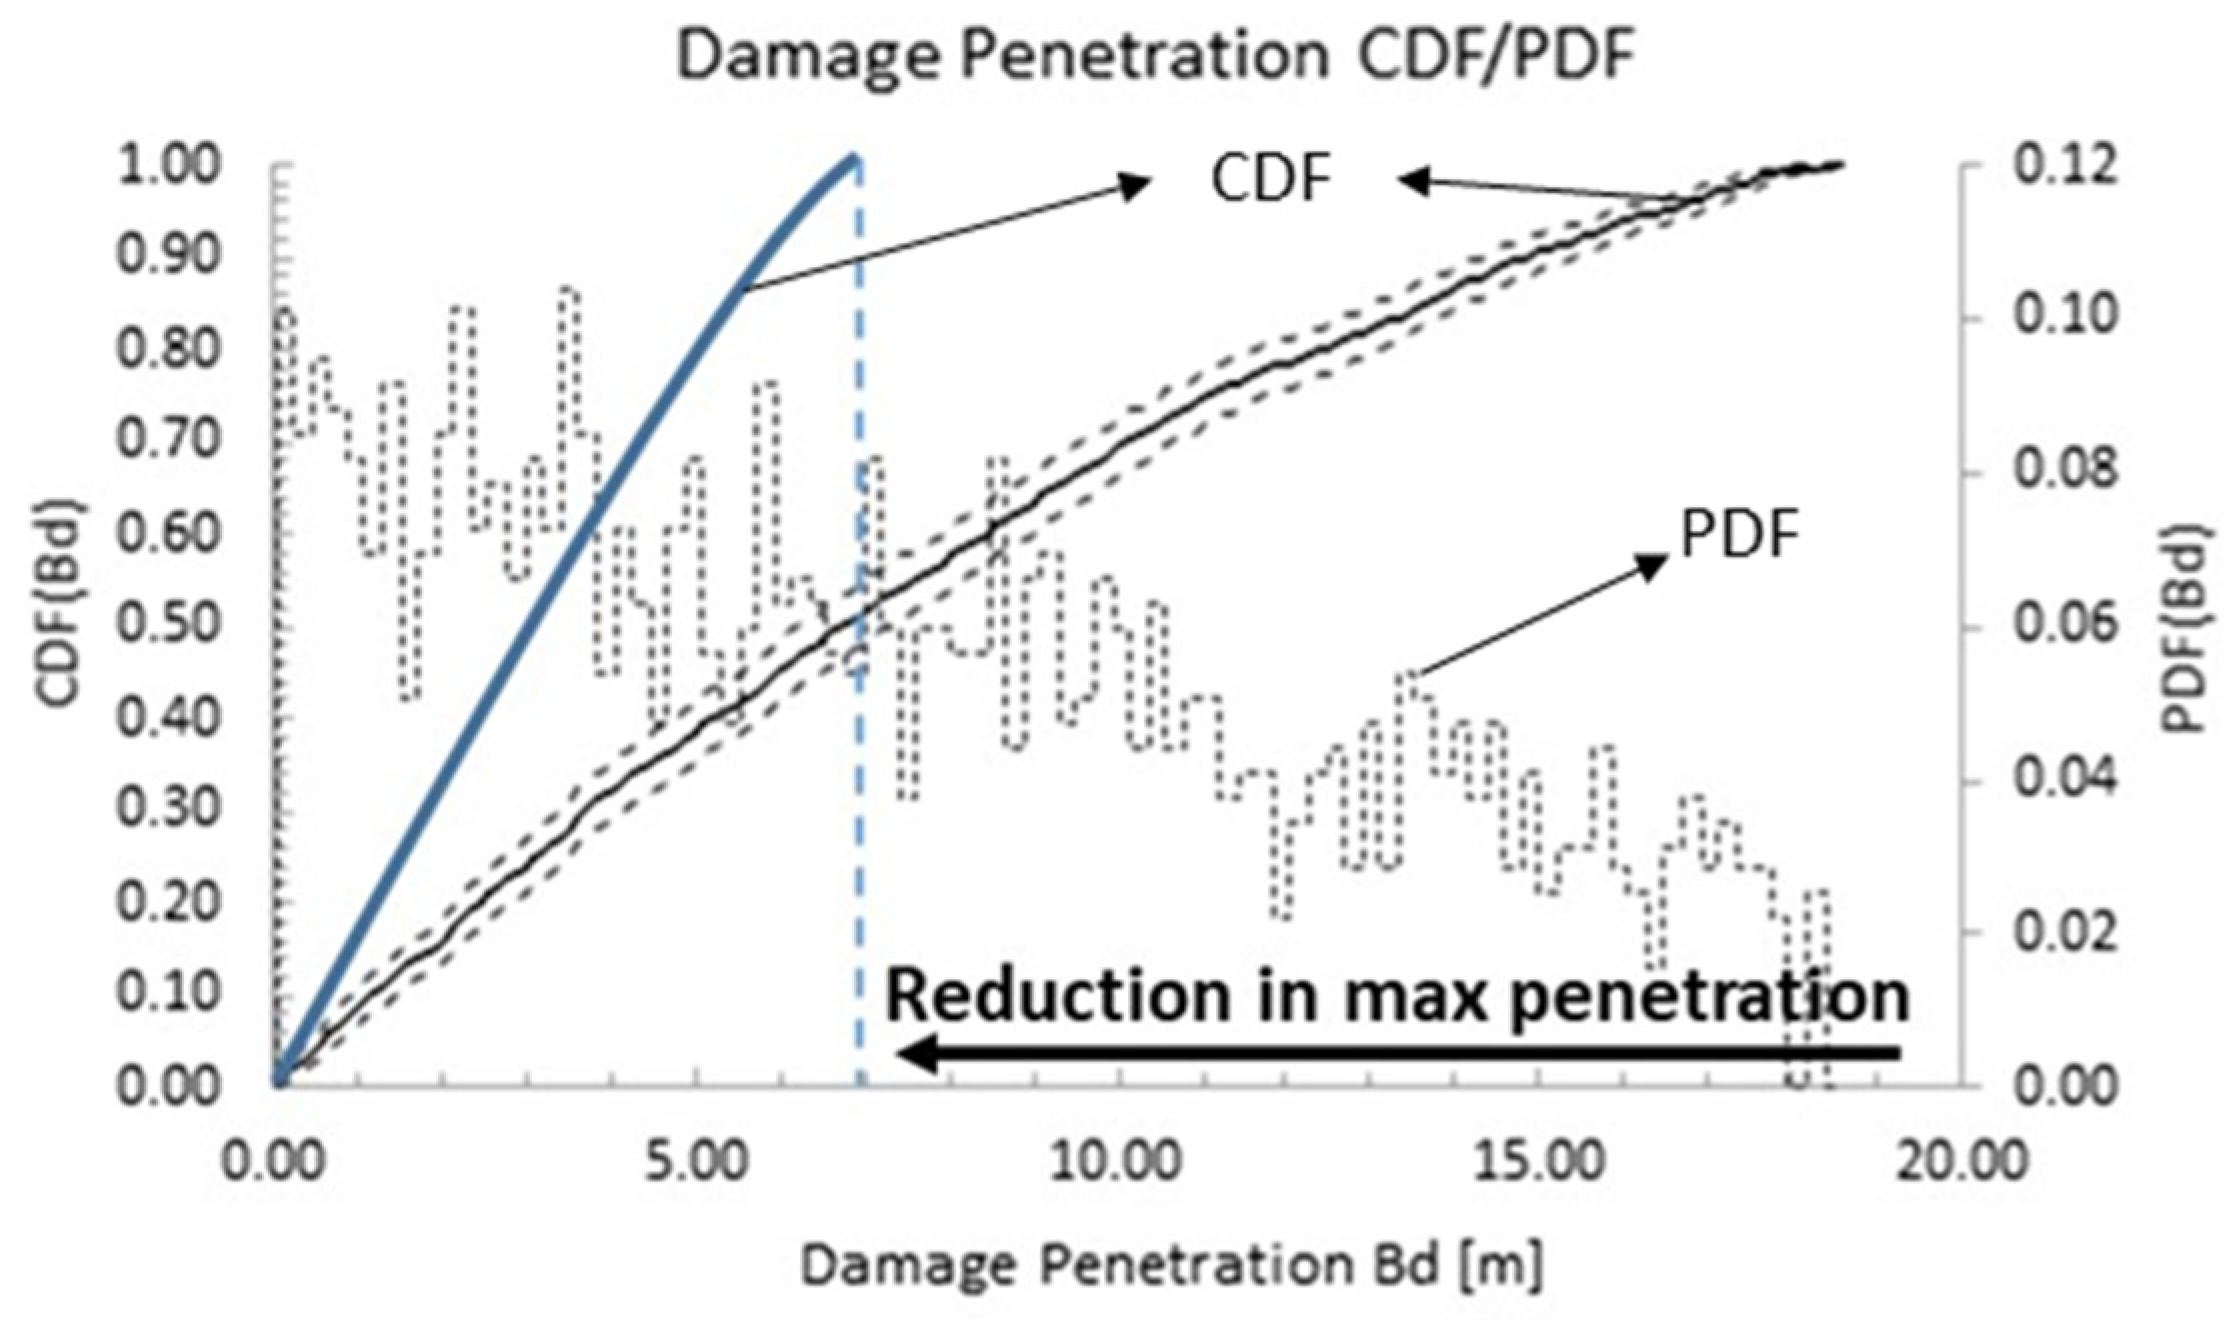
2.4. Structural Crashworthiness
2.4.1. General Considerations
2.4.2. Impact of Crashworthiness on p-Factors
3. Statistical Approach to p-Factors Determination
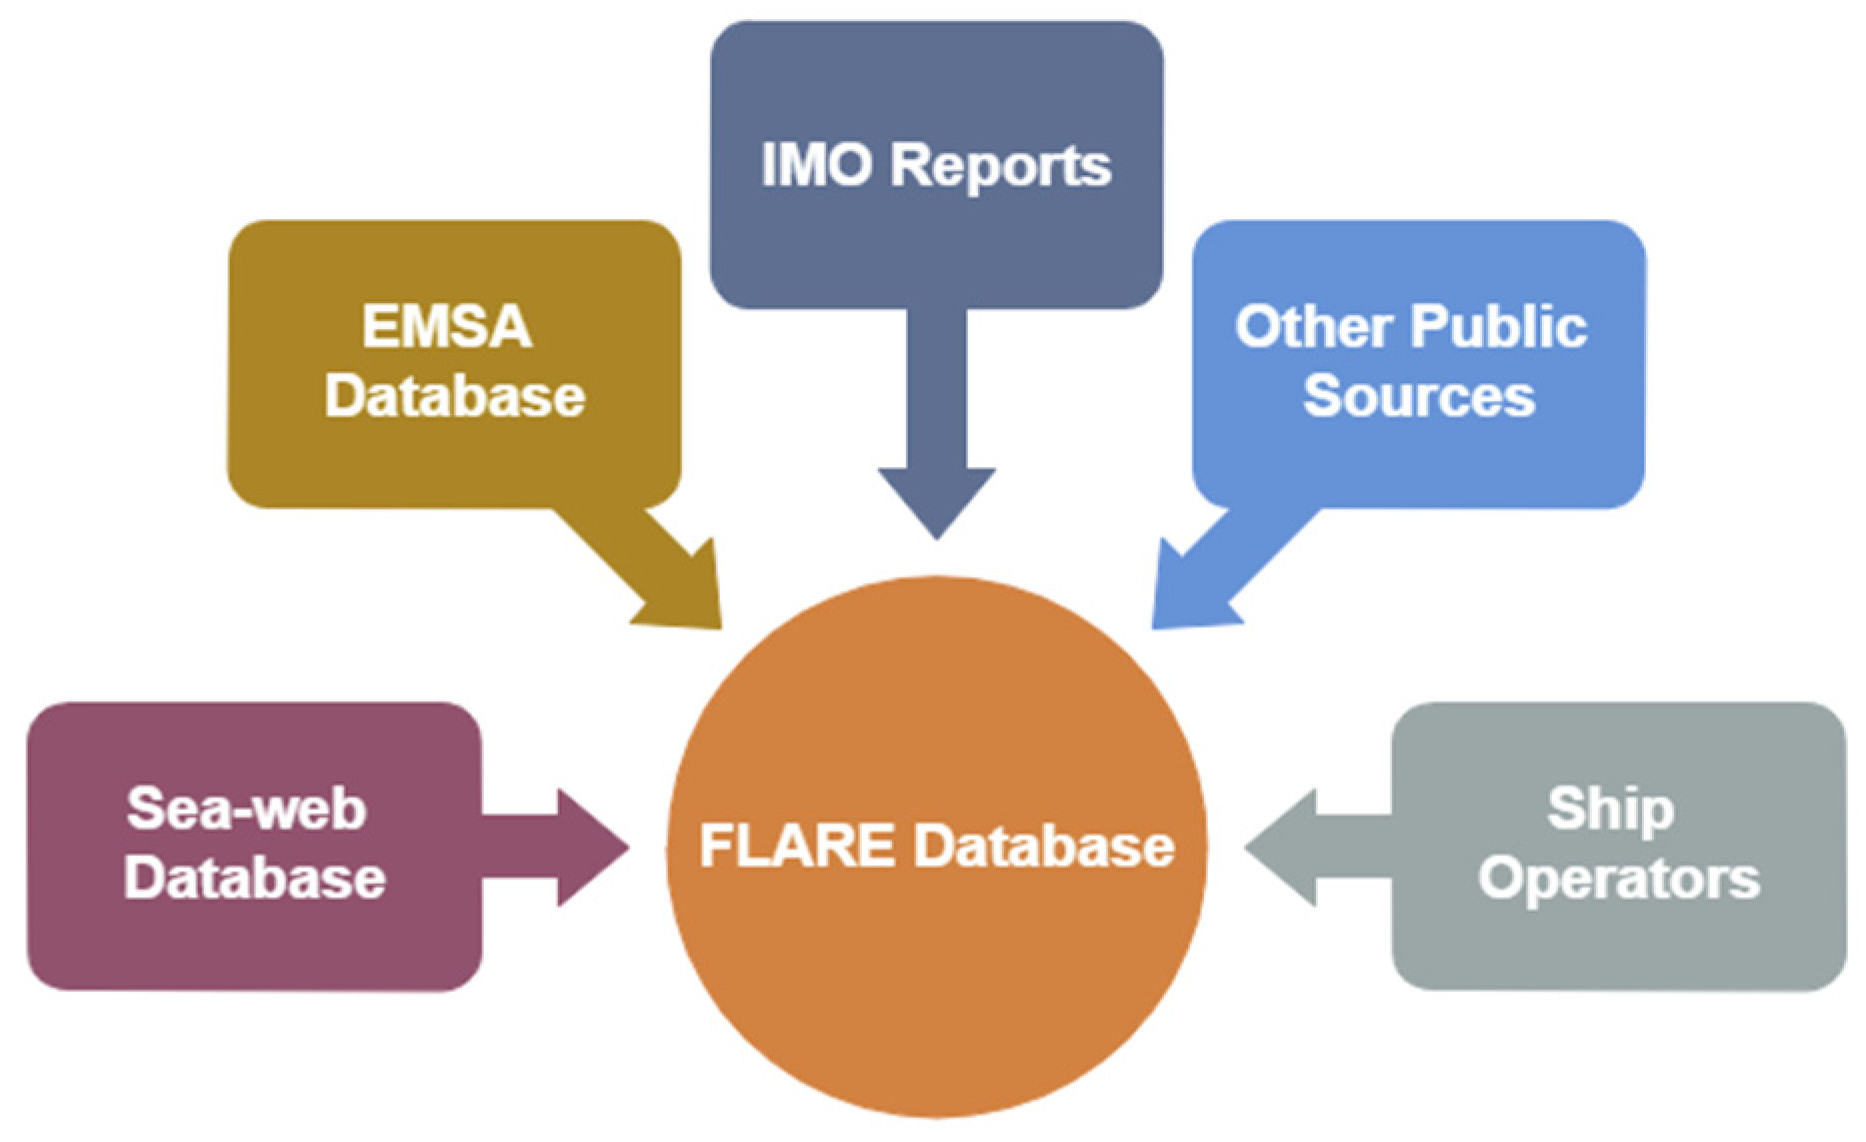
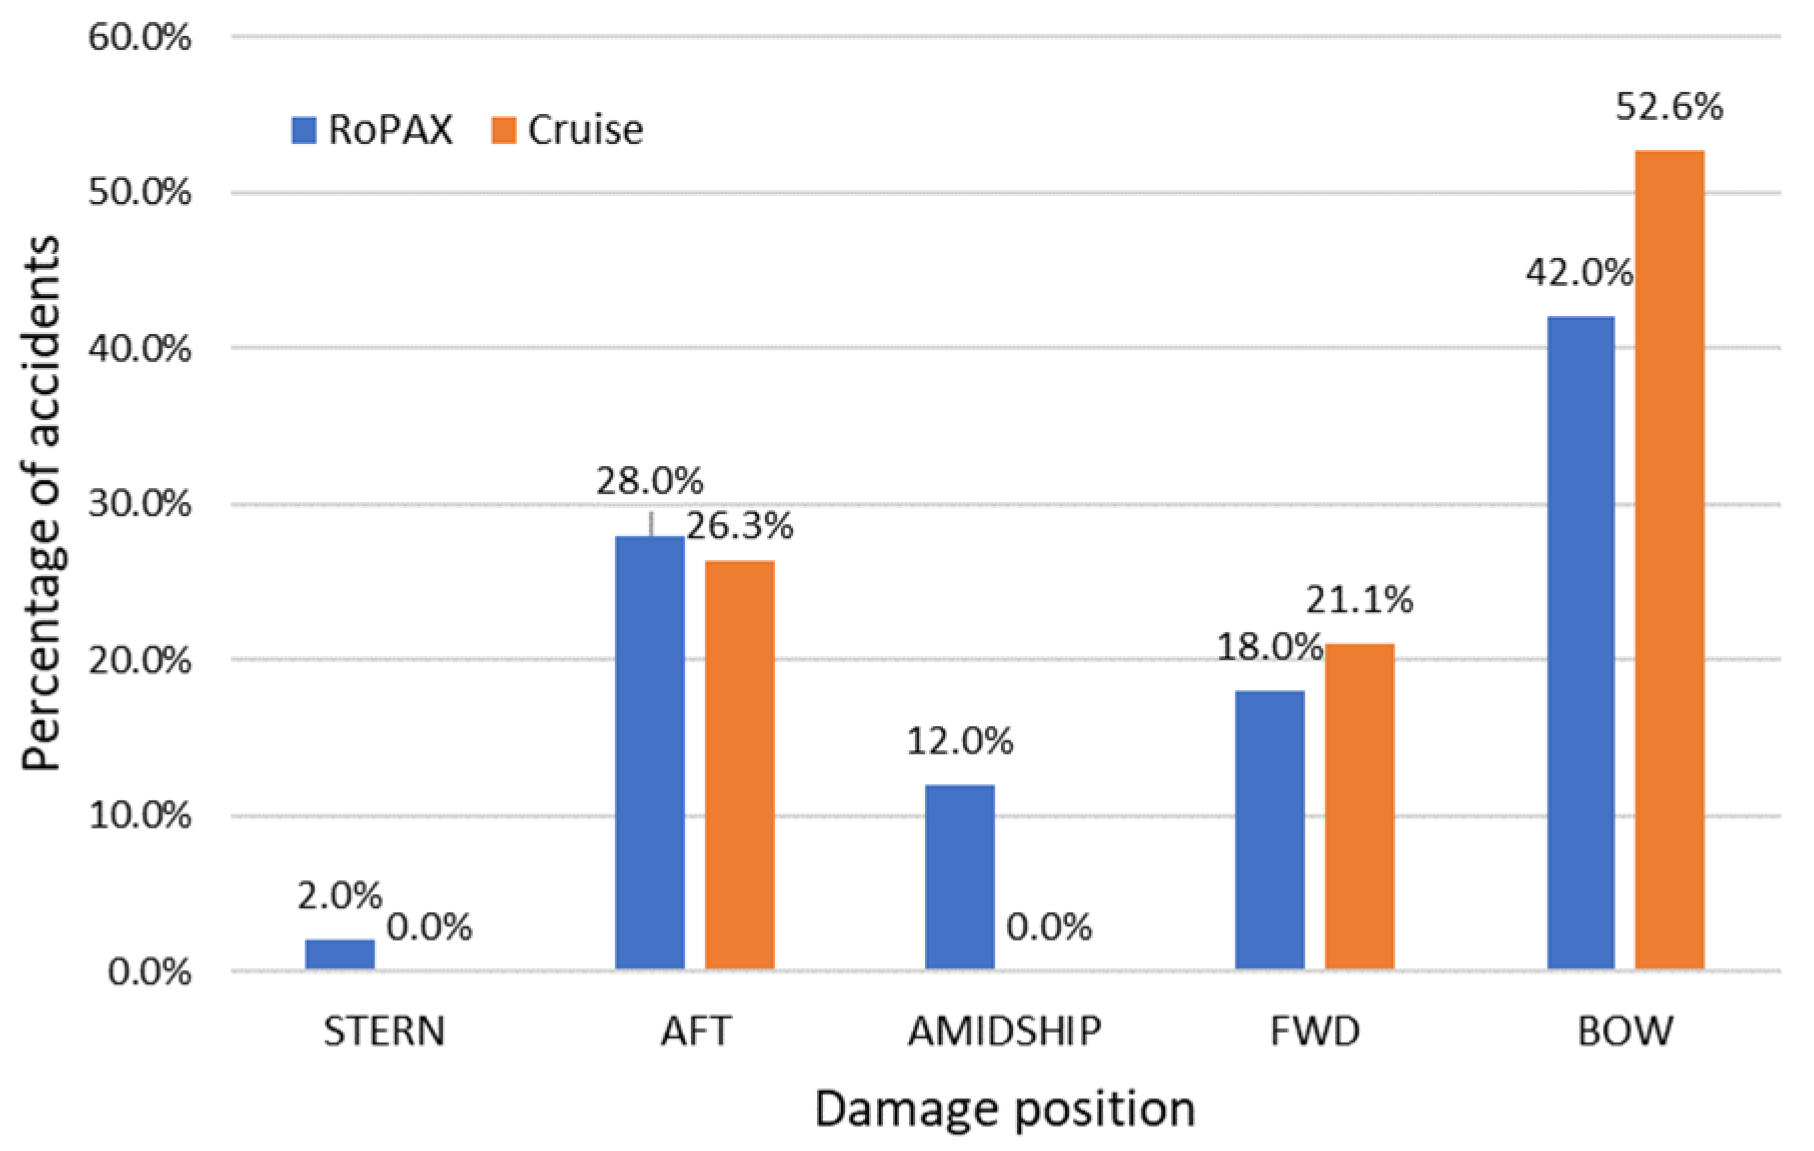
3.1. Overview of the FLARE Accident Database
3.1.1. Data Filters
- Accident period: 1 January 1999 to 31 October 2020
- Accident type: collision and grounding
- Ship size: GT ≥ 3500
- Ship length (overall): ≥80 m
- Ship type: Cruise, RoPax, Pure passenger, and RoPax (Rail)
- Location: worldwide
- Class type: IACS and non-IACS (for the fleet at risk)
3.1.2. Data Sources
3.1.3. Data Taxonomy
3.2. Probabilistic Modelling of Breach Distributions
4. Direct Approach to Modelling Breach Distributions
- Since SHARP considers the structural description of one half of the ship (collisions are modelled at the port side), the structure of the ship has been considered symmetrical, and hence a unique model is used.
- In all simulations, the struck ship is supposed to be at rest (no initial surge velocity). This is in accordance with Lützen [9], who observed from the collision accident statistics that the most likely surge velocity of the struck ship would be zero. Furthermore, the struck ship considered for the case study, having very limited draft variability, was assumed to be at design draft.
- According to the probabilistic damage analysis model, the longitudinal position is independent of all other damage variables. On this basis, only impacts at the midship section are modelled. However, the actual longitudinal position varied so that transverse bulkheads can also be directly hit.
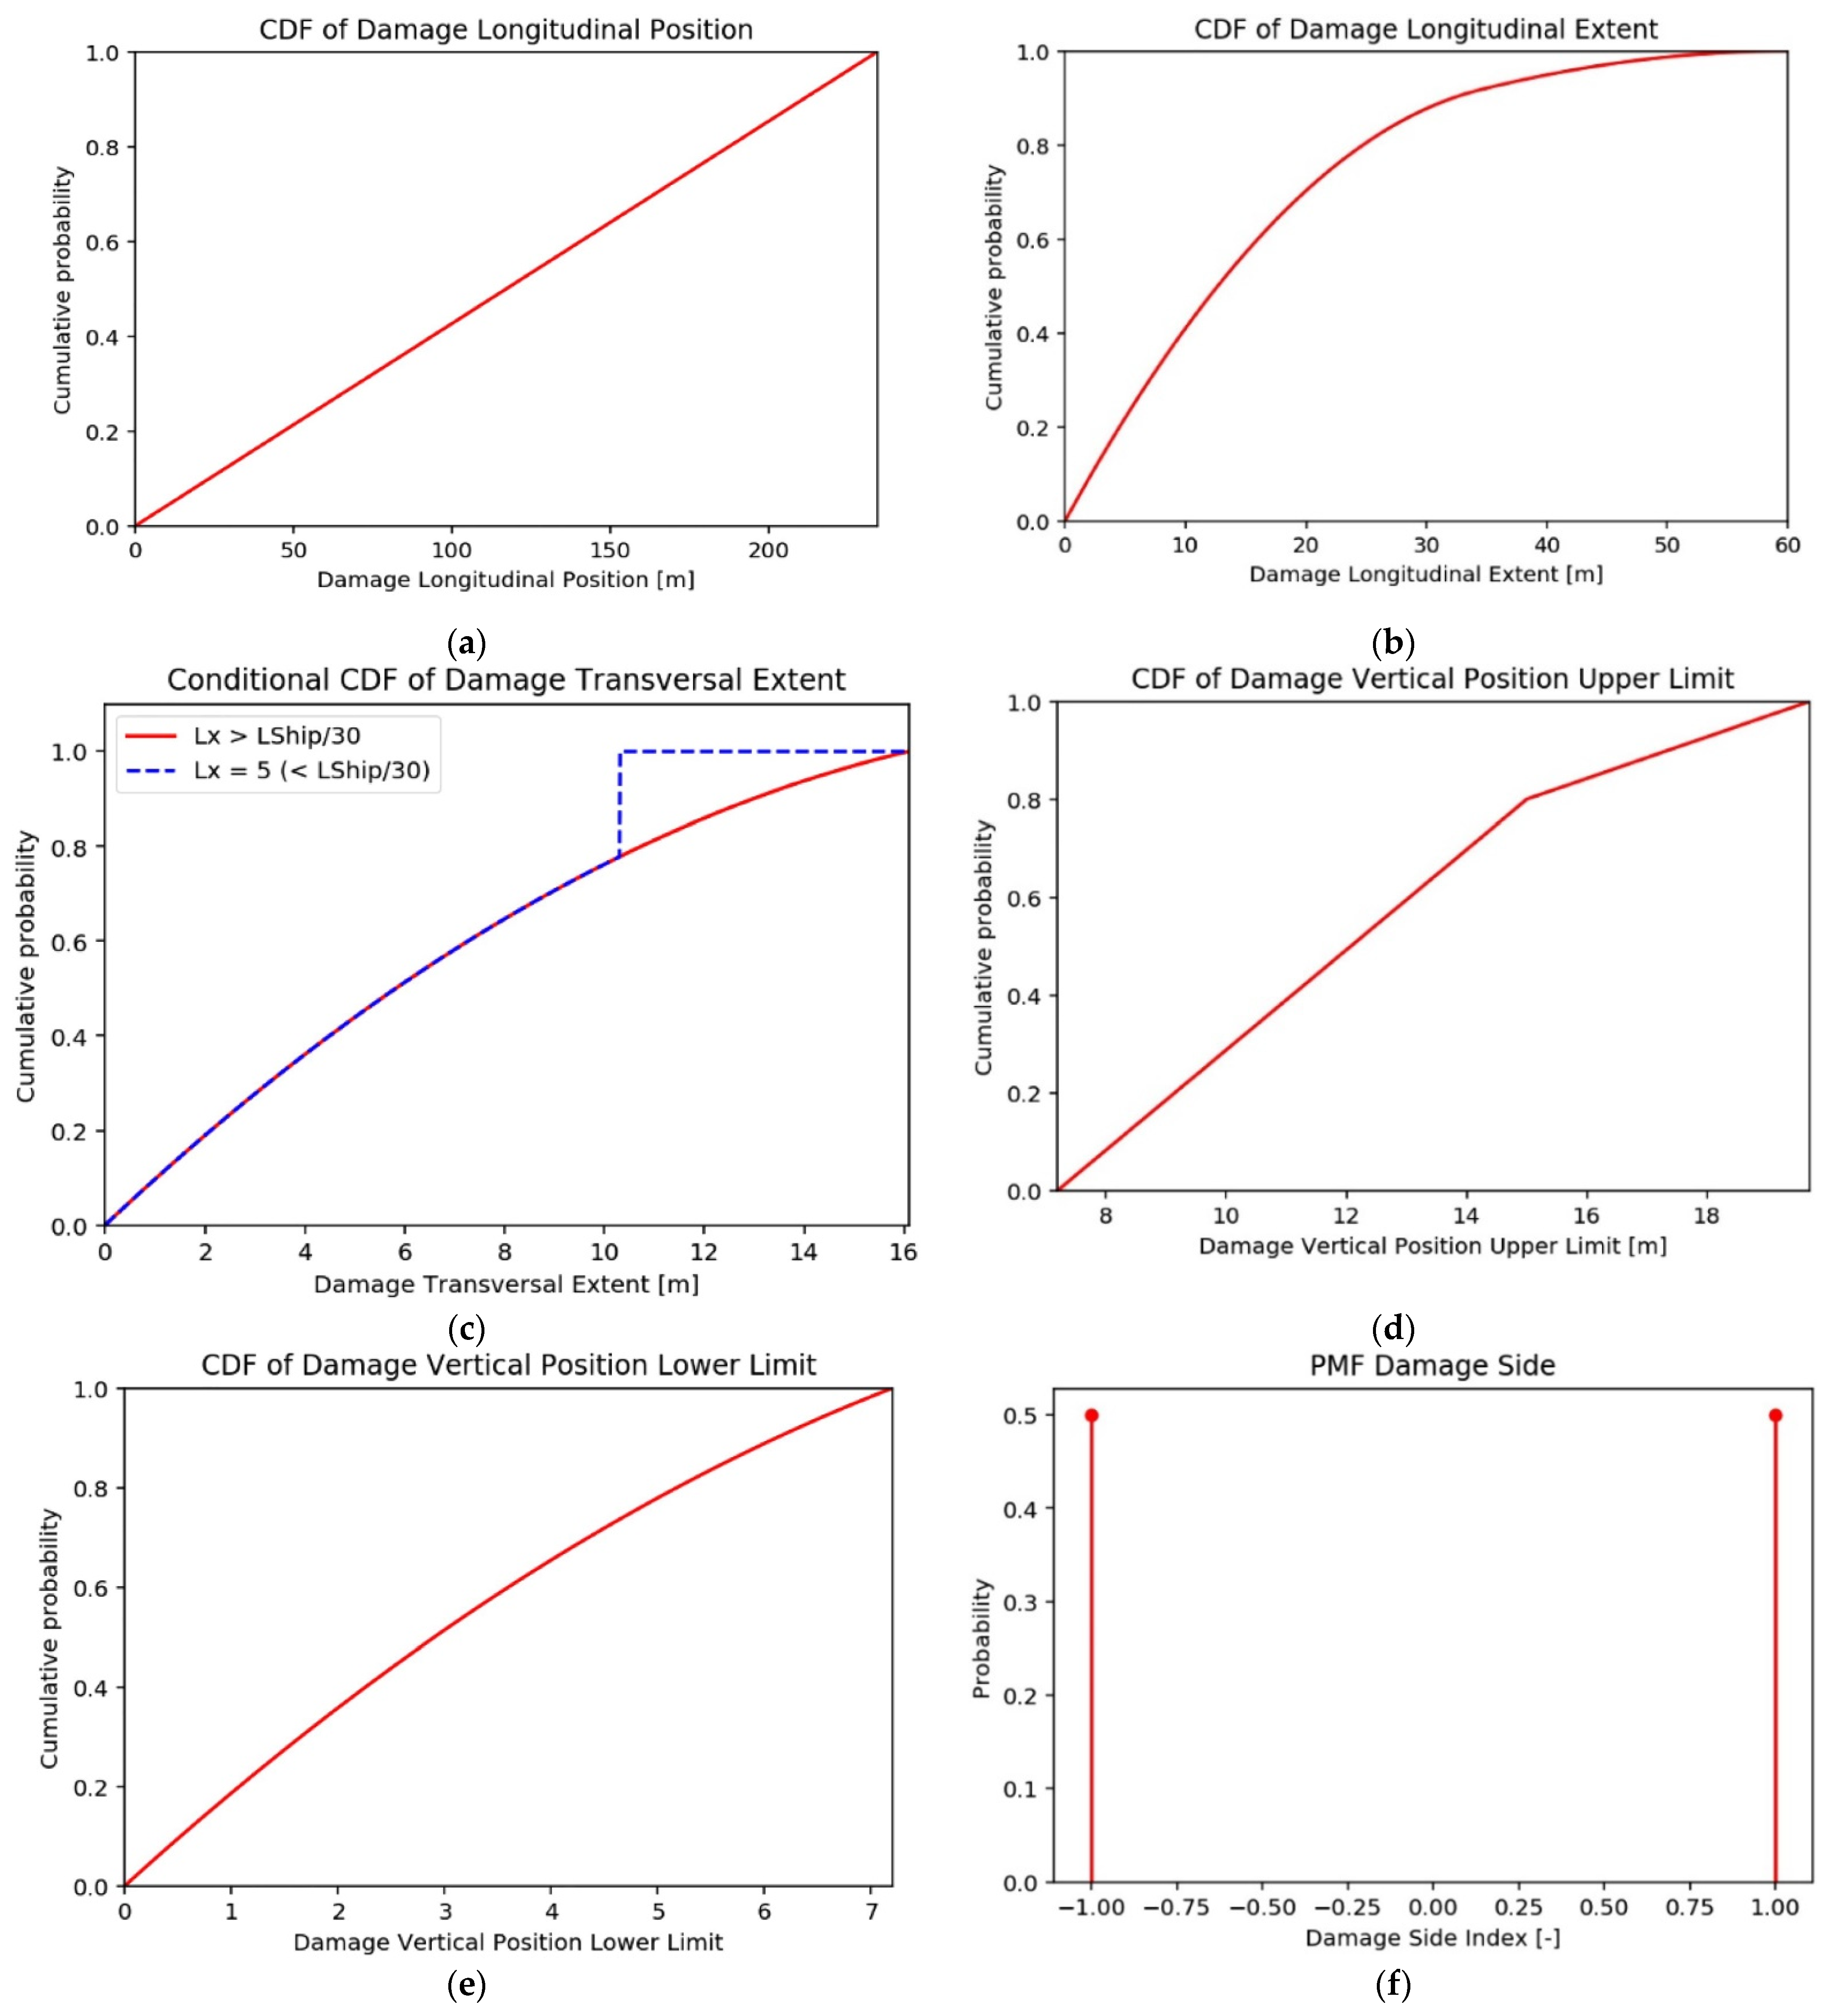
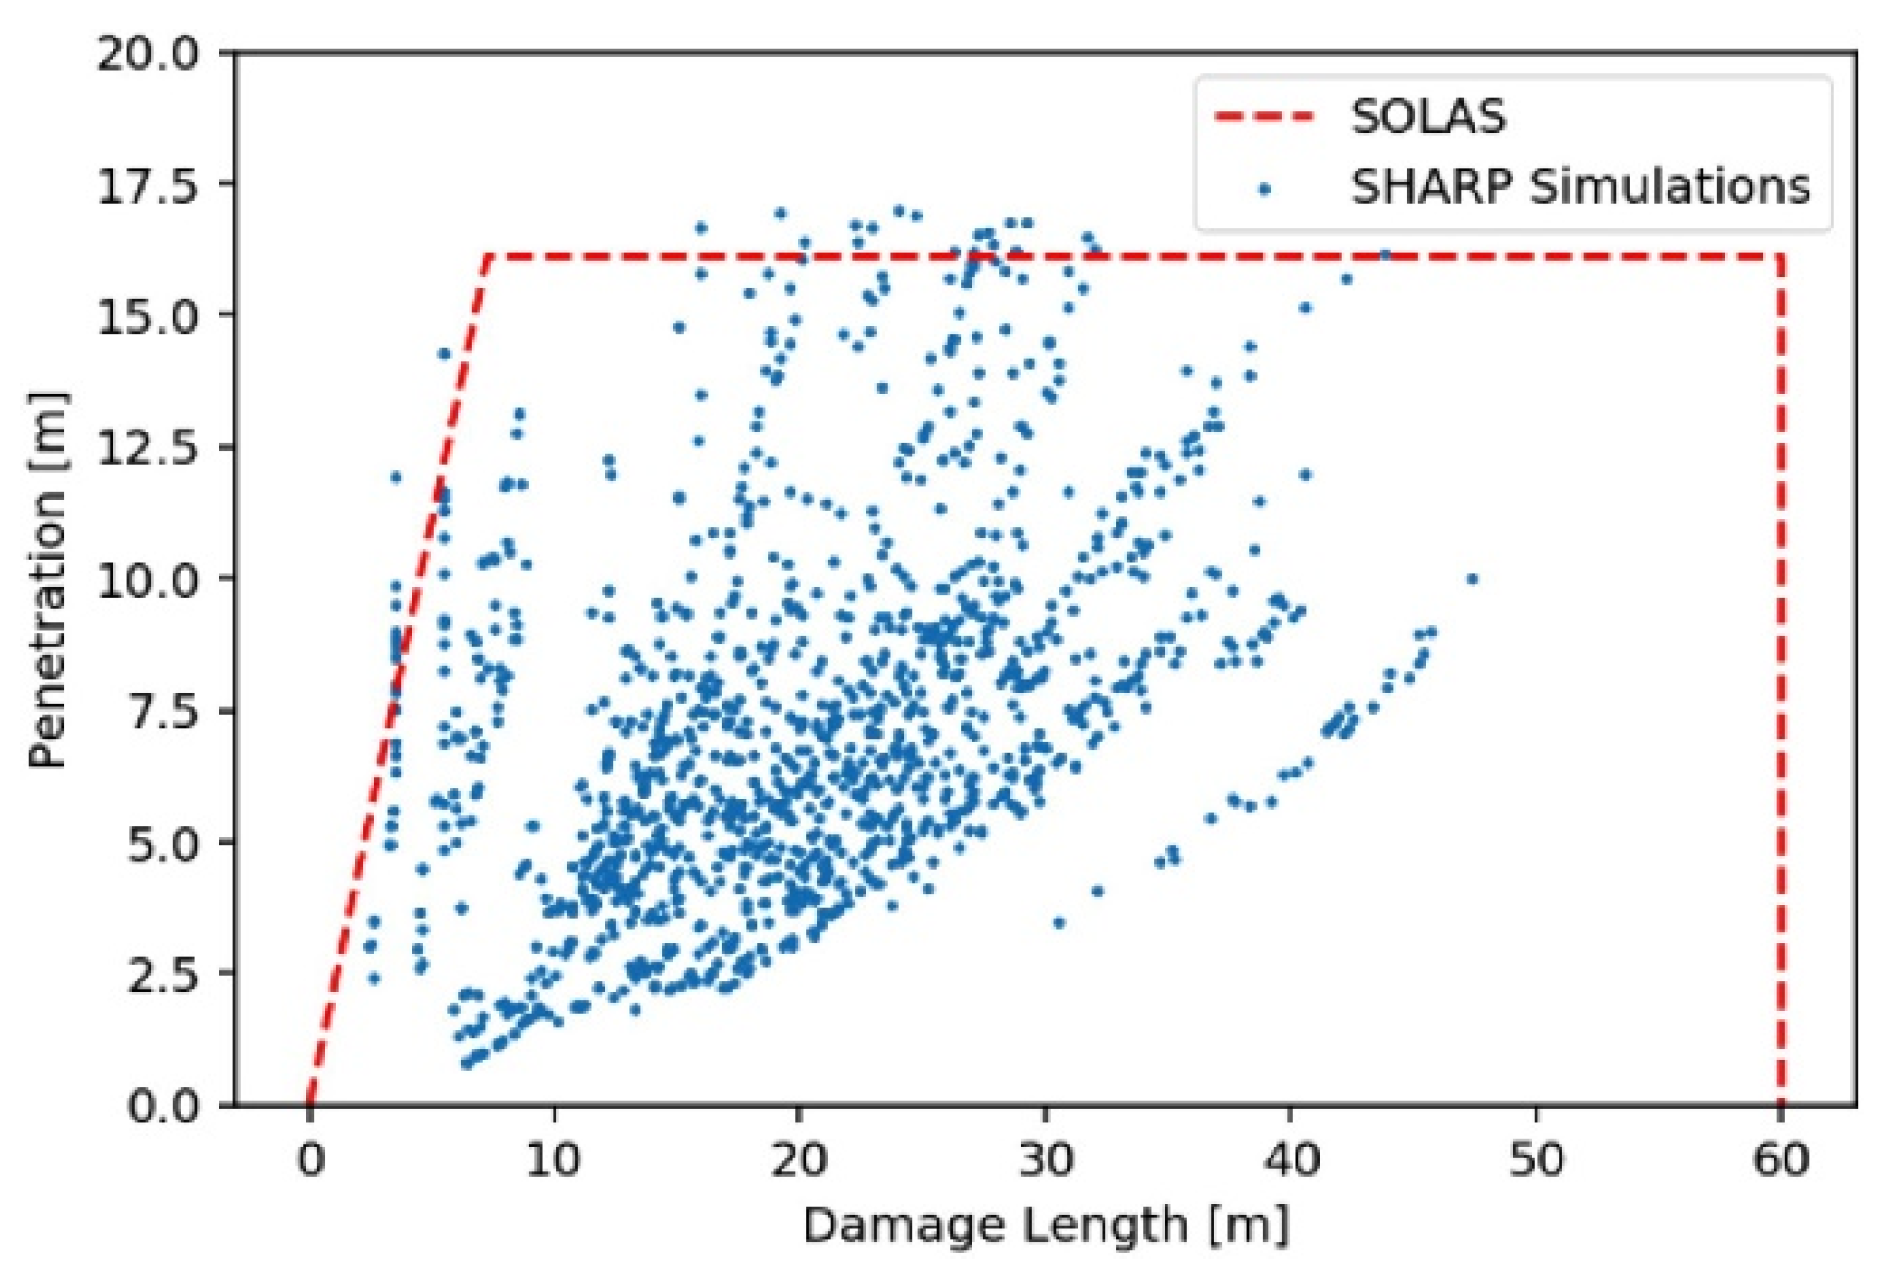
- Figure 20 shows that no damages of a length higher than 50 m are obtained. A potential explanation is that the calculation matrix lacks very severe scenarios. Another explanation would be that for the reference ship considered, the SOLAS damage limit of 60 m cannot be physically reached when considering realistic scenarios.
- Figure 20 also shows that longitudinal damages higher than 20 m () with low penetrations () cannot be simulated. This may be due to the fact that no initial surge velocity was considered for the struck ship. It could also come from the underlying SOLAS model, which considers that for such types of damages, the longitudinal and transverse extents are independent.
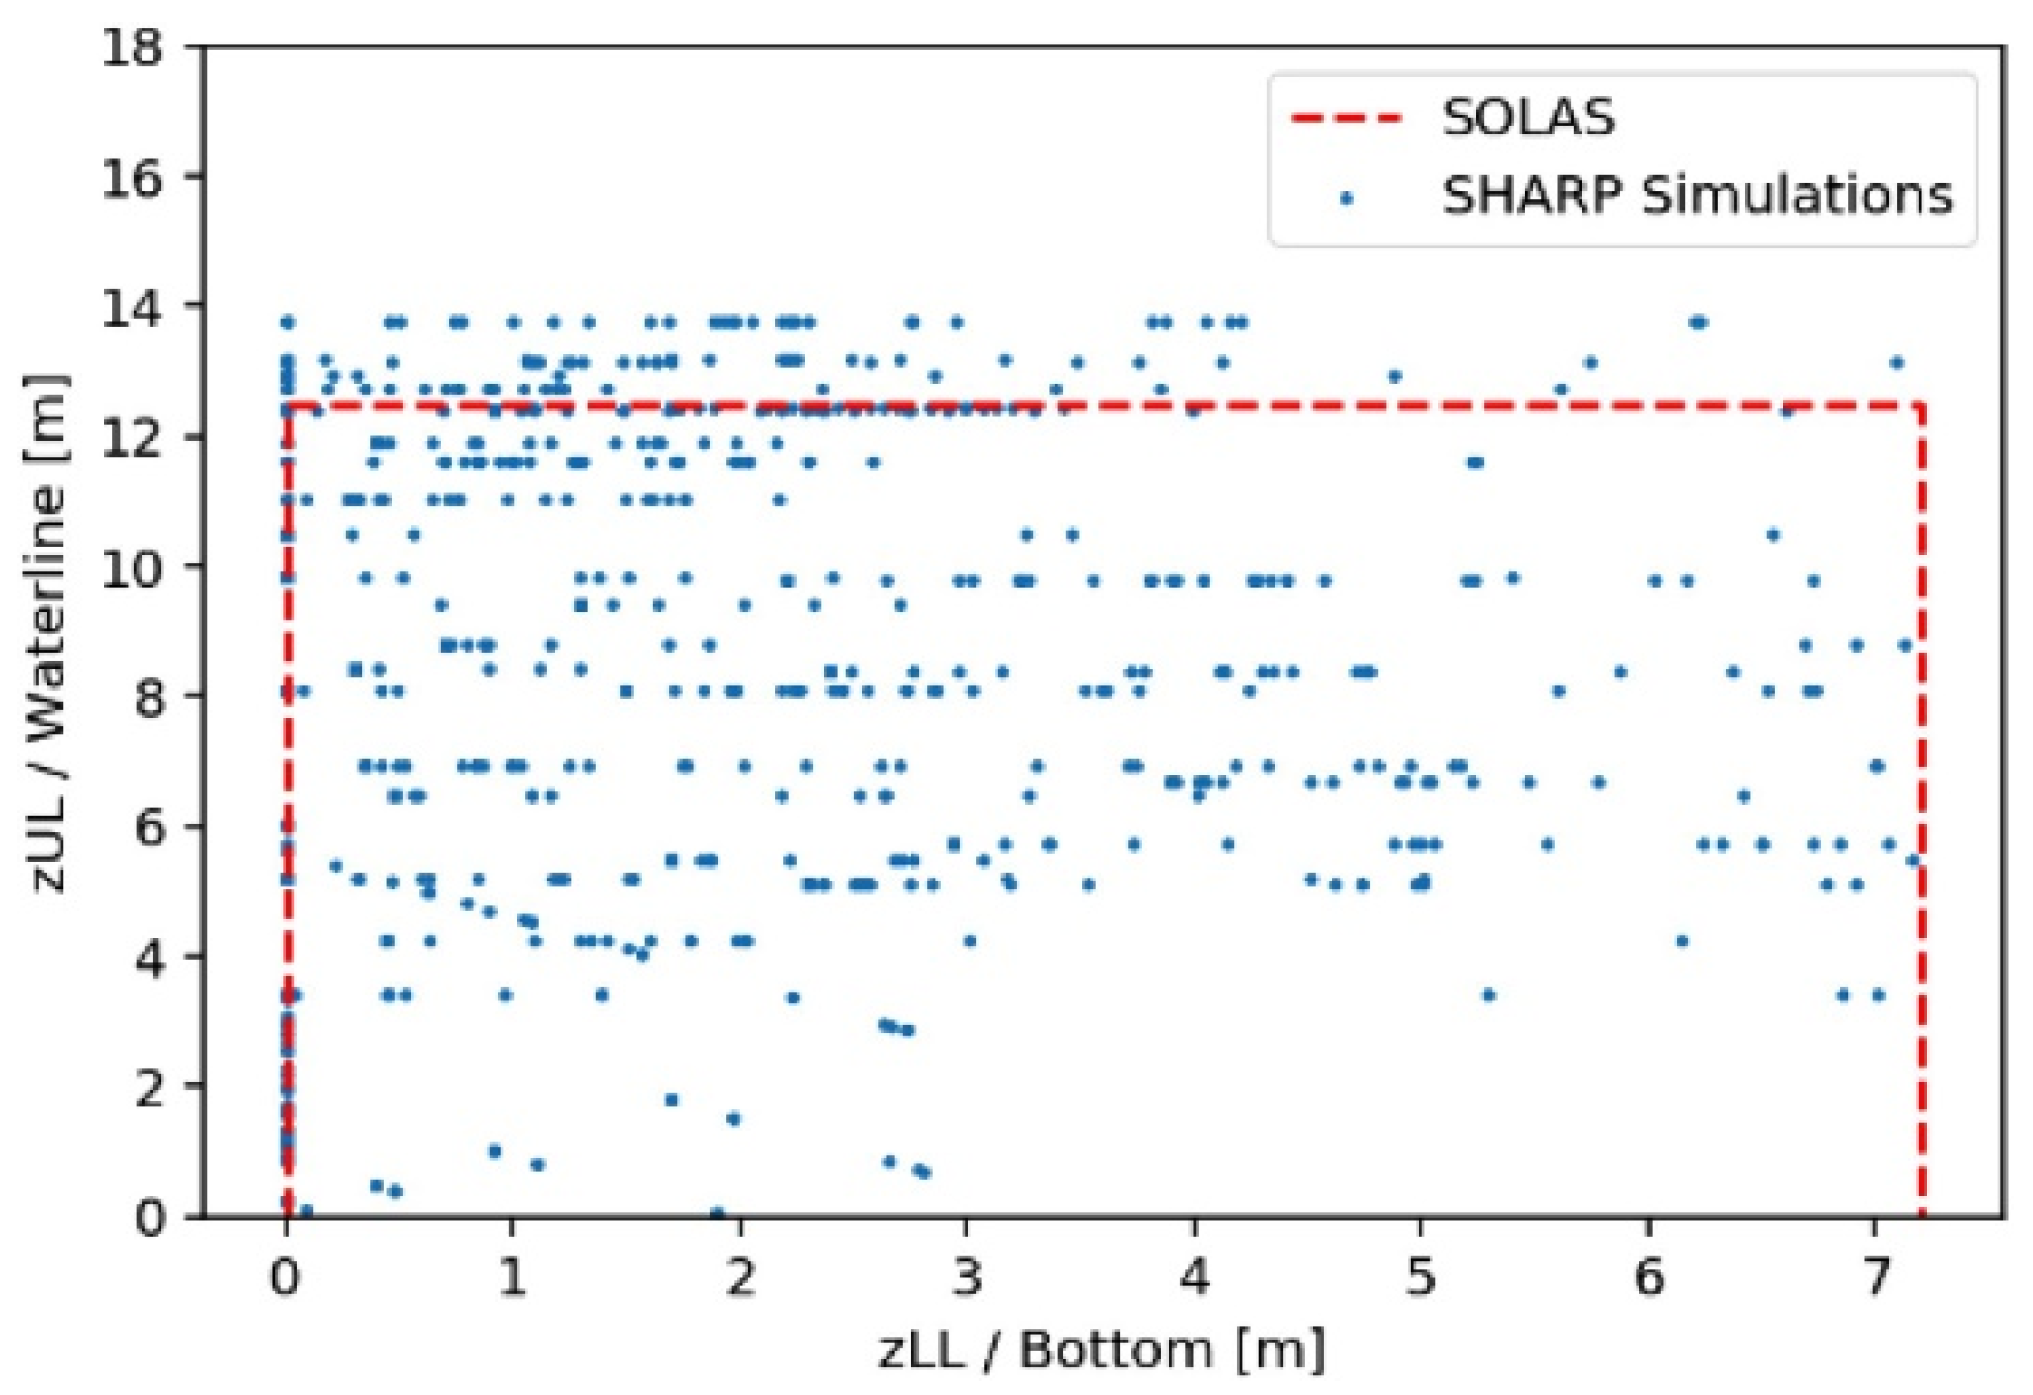
- Figure 21 shows that the domain is well-populated due to the large striking ships database. No damages have been simulated, with the damage upper limit slightly above the waterline and the damage lower limit slightly below. The simulation of such damages would typically require that the damage is due to the bulb of the striking ship only and that the combination of striking ship draft and bulb height is adequate.
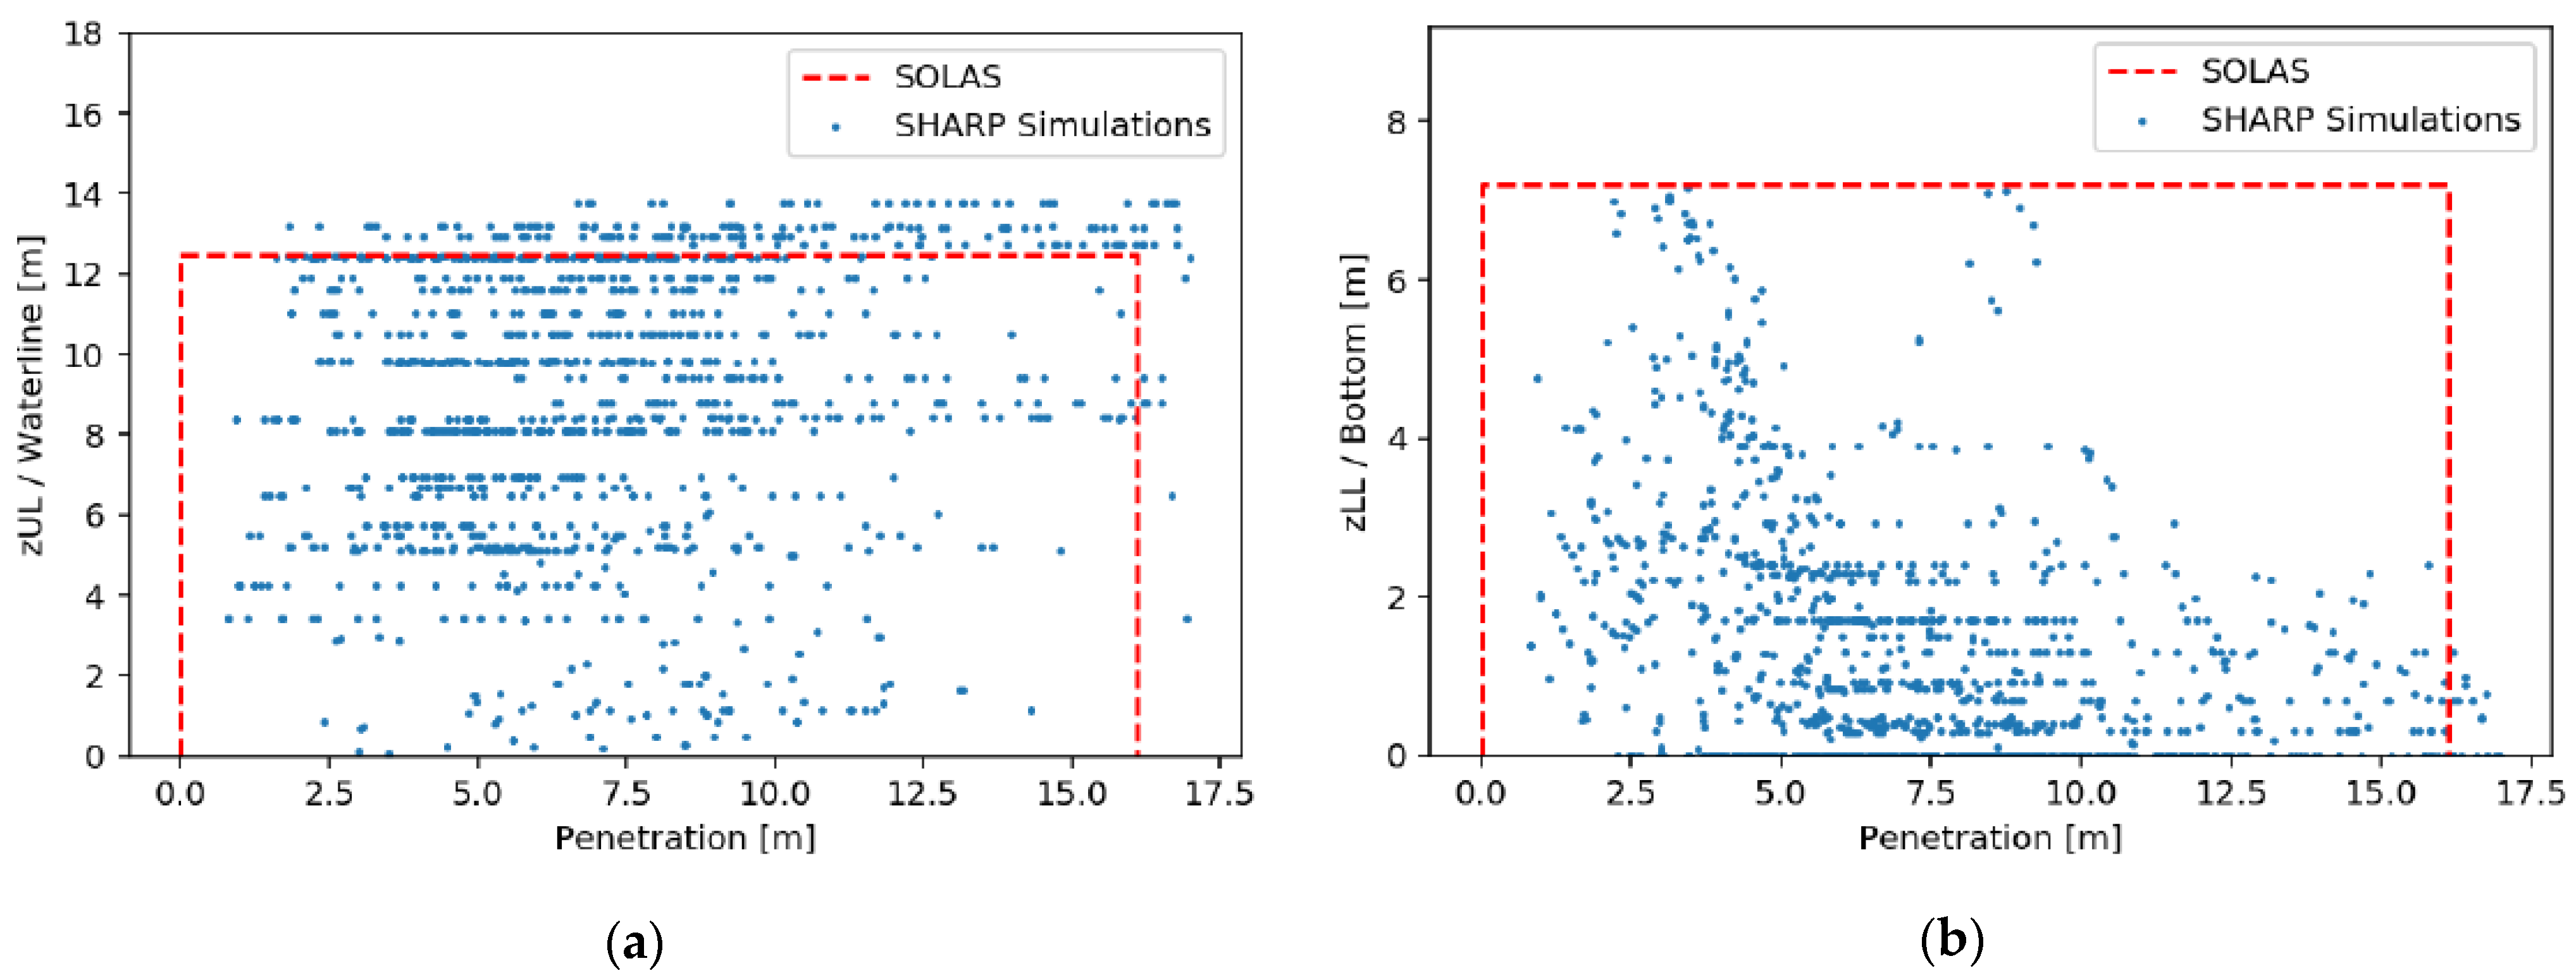
- From Figure 22, it can be noted that no longitudinal damage can be simulated with a vertical position just above the waterline. However, this was expected since long damages mainly correspond to the more massive striking ships with a high freeboard.
- Figure 23 shows that simulated damages with large penetration have a lower vertical limit close to the ship bottom. This was expected given the bow shapes of the striking ships.
5. Concluding Remarks
- Clarification on what exactly p-factors are and how they are defined in terms of marginal distributions of six parameters: length, breadth, height, location, side of the ship, upper and lower location.
- How to sample such distributions in order to ensure sufficient accuracy in the damage sample.
- Explanation of what constitutes zonal or non-zonal methods in damage breach generation.
- Derivation of the marginal breach distributions based on statistical methods, describing, and using a new accidents database, specific for passenger ships and addressing all pertinent hazards (collision, side grounding, bottom grounding).
- Explanation and demonstration of a direct approach to deriving pertinent p-factors, using a passenger ship operating in the Gulf of Finland.
Author Contributions
Funding
Institutional Review Board Statement
Informed Consent Statement
Data Availability Statement
Conflicts of Interest
References
- IMO. SOLAS-International Convention for the Safety of Life at Sea; IMO: London, UK, 2009. [Google Scholar]
- Wendel, K. Die Wahrscheinlichkeit des Uberstehens von Verletzungen. Schiffstechnik 1960, 7, 47–61. [Google Scholar]
- Wendel, K. Subdivision of ships. In Proceedings of the 1968 Diamond Jubilee International Meeting—75th Anniversary, SNAME, New York, NY, USA, 4–9 November 1968; Paper No 12. p. 27. [Google Scholar]
- Vassalos, D.; Mujeeb-Ahmed, M.P. Conception and Evolution of the Probabilistic Methods for Damage Stability and Flooding Risk Assessment. J. Mar. Sci. Eng. 2021, 9, 667. [Google Scholar] [CrossRef]
- HARDER. Harmonisation of Rules and Design Rationale; EC Contact No. GDRB-CT-1998-00028, Final Technical Report; IMO Publishing: London, UK, 1999–2003.
- GOALDS. Goal-Based Damage Stability; Project funded by the European 13th Commission, FP7-DG Research, Grant Agreement 233876; EC: Brussels, Belgium, 2009–2012.
- Bulian, G.; Francescutto, A. Probability of Flooding Due to Grounding Damage Using a p-factor Formulation; GOALDS Project; EC: Brussels, Belgium, 2010. [Google Scholar]
- Lützen, M. Ship Collision Damage. Ph.D. Thesis, Technical University of Denmark, Lyngby, Denmark, 2001. [Google Scholar]
- Lützen, M. Damage Distributions; HARDER Document 2-22-D-2001-01-4; Version:4; EC Contact No. GDRB-CT-1998-00028. 29 July 2002. [Google Scholar]
- Pawlowski, M. Subdivision and Damaged Stability of Ships; Euro-MTEC Book Series; Fundacja Promocji Przemyslu: Gdansk, Poland, 2004. [Google Scholar]
- IMO. Resolution MSC.216(82)—Amendments to the International Convention for the Safety of Life at Sea 1974; IMO: London, UK, 8 December 2006. [Google Scholar]
- FLARE. EU H2020—MG2.2 Flooding Accident Response, 2019–2022. Available online: https://flare-project.eu/ (accessed on 28 January 2022).
- Papanikolaou, A.; Spanos, D.; Boulougouris, E.; Eliopoulou, E.; Alissafaki, A. Investigation into the sinking of the Ro-Ro passenger ferry Express Samina. Int. Shipbuild. Prog. 2004, 51, 95–120. [Google Scholar]
- Papanikolaou, A.; Eliopoulou, E. On the development of the new harmonized damage stability regulations for dry cargo and passenger ships. Reliab. Eng. Syst. Saf. 2008, 93, 1305–1316. [Google Scholar] [CrossRef]
- SAFEDOR. Design, Operation and Regulation for Safety; Integrated Project, FP6_2 Contract TIP4-CT-2005-516278; SAFEDOR: Hamburg, Germany, 2005–2009; Available online: www.safedor.org (accessed on 28 January 2022).
- EMSA III. Study to Assess Acceptable and Practicable Risk Levels for Damage Stability of Passenger Ships; EMSA III: Lisbon, Portugal, 2013–2015.
- eSAFE. Damage Stability of Cruise Ships; Joint Industry Project; Cruise Ship Safety Forum (CSSF); 2019; Available online: https://www.google.com.hk/url?sa=t&rct=j&q=&esrc=s&source=web&cd=&cad=rja&uact=8&ved=2ahUKEwiXrpbD-9XrAhXHc94KHZ82CC4QFjAAegQIBRAB&url=http%3A%2F%2Fwww.shipstab.org%2Ffiles%2FProceedings%2FISSW%2FISSW_2019_Helsinki_Finland%2FPapers%2F7_0_Luhmann_ISSW2019.pdf&usg=AOvVaw2vaPE7xWjn4JuLJkMPIU9S (accessed on 6 September 2020).
- Mujeeb-Ahmed, M.P.; Vassalos, D.; Boulougouris, E. Development of collision and grounding accident database for large passenger ships. In Proceedings of the First International Conference on the Stability and Safety of Ships and Ocean Vehicles (STAB&S 2021), Glasgow, UK, 7–11 June 2021. [Google Scholar]
- Mujeeb-Ahmed, M.P.; Vassalos, D.; Boulougouris, E. Probabilistic damage distribution and risk modelling of collision and grounding accidents for large passenger ships. In Proceedings of the First International Conference on the Stability and Safety of Ships and Ocean Vehicles (STAB&S 2021), Glasgow, UK, 7–11 June 2021. [Google Scholar]
- Zaraphonitis, G.; Bulian, G.; Lindroth, D.; Hamann, R.; Luhmann, H.; Cardinale, M.; Routi, A.L.; Bertin, R.; Harper, G. Evaluation of Risk from Raking Damages Due to Grounding; Final report; DNVGL Report 2015-0168 Rev. 2, Project EMSA/OP/10/2013; Technical Report; European Maritime Safety Agency: Lisbon, Portugal, 2015. [Google Scholar]
- Bulian, G.; Lindroth, D.; Ruponen, P.; Zaraphonitis, G. Probabilistic assessment of damaged ship survivability in case of grounding: Development and testing of a direct non-zonal approach. Ocean Eng. 2016, 120, 331–338. [Google Scholar] [CrossRef]
- Zaraphonitis, G.; Bulian, G.; Hamann, R.; Eliopoulou, E.; Cardinale, M.; Luhman, H. eSAFE-D2.2.1-Description of Methodology; Joint Industry Project eSAFE. 2017. [Google Scholar]
- Bulian, G.; Cardinale, M.; Dafermos, G.; Lindroth, D.; Ruponen, P.; Zaraphonitis, G. Probabilistic assessment of damaged survivability of passenger ships in case of grounding or contact. Ocean Eng. 2020, 218, 107396. [Google Scholar] [CrossRef]
- Vassalos, D.; Paterson, D. Towards Unsinkable Ships. Ocean Eng. 2021, 232, 109096. [Google Scholar] [CrossRef]
- Dvoretzky, A.; Kiefer, J.; Wolfowitz, J. Asymptotic Minimax Character of the Sample Distribution Function and of the Classical Multinomial Estimator. Ann. Math. Statist. 1956, 27, 642–669. [Google Scholar] [CrossRef]
- Cools, R.; Nuyens, D. Monte Carlo and Quasi-Monte Carlo Methods; Springer: Cham, Switzerland, 2014. [Google Scholar] [CrossRef] [Green Version]
- Mauro, F.; Paterson, D.; Michalec, R.; Boulougouris, E.; Vassalos, D. A damage sampling method to reduce A-index standard deviation in the probabilistic assessment of ship survivability using a non-zonal approach. In Proceedings of the First International Conference on the Stability and Safety of Ships and Ocean Vehicles (STAB&S 2021), Glasgow, UK, 7–11 June 2021. [Google Scholar]
- Woisin, G. Design against collision. In Proceedings of the International Symposium on Advances in Marine Technology, Trondheim, Norway, 2 June 1979; pp. 309–336. [Google Scholar]
- Minorsky, V. An analysis of ship collision with reference to protection of nuclear power ships. J. Ship Res. 1959, 3, 208–214. [Google Scholar]
- McDermott, J.F.; Kline, R.G.; Jones, E.L.; Maniar, N.M.; Chiang, W.P. Tanker structural analysis for minor collisions. SNAME Trans. 1974, 82, 382–414. [Google Scholar]
- Pedersen, P.T.; Zhang, S. Absorbed energy in ship collisions and grounding: Revising Minorsky’s empirical method. J. Ship Res. 2000, 44, 140–154. [Google Scholar] [CrossRef]
- Amdahl, J. Energy Absorption in Ship-Platform Impacts. Ph.D. Thesis, Norweigian Institute of Technology, Trondheim, Norway, 1982. [Google Scholar]
- Wierzbicki, T.; Abramowicz, W. On the crushing mechanics of thin-walled structures. J. Appl. Mech. 1983, 50, 727–734. [Google Scholar] [CrossRef]
- Kitamura, O. Comparative study on collision resistance of side structure. Mar. Technol. SNAME News 1997, 34, 293–308. [Google Scholar] [CrossRef]
- Kitamura, O. FEM approach to simulate of collision and grounding damage. In Proceedings of the Second International Conference on Collision and Grounding of the Ships, Copenhagen, Denmark, 1–3 July 2001. [Google Scholar]
- Lehmann, E.; Peschmann, J. Energy absorption by the steel structure of ships in the event of collision. Mar. Struct. 2002, 15, 429–441. [Google Scholar] [CrossRef]
- Ludolphy, J.; Boon, B. Collision resistant side shell structures for ships. In Proceedings of the International Maritime Design Conference, Kyongju, Korea, 21–24 May 2000. [Google Scholar]
- Graaf, B.V.; Vredeveldt, J.; Broekhuijsen, J. Construction aspects for the Schelde Y-shape crashworthy hull structure. In Proceedings of the Third International Conference on Collision and Grounding of Ships, Izu, Japan, 25–27 October 2004; pp. 229–233. [Google Scholar]
- Naar, H.; Kujala, P.; Simonsen, B.; Ludolphy, H. Comparison of the crashworthiness of various bottom and side structures. Mar. Struct. 2002, 15, 443–460. [Google Scholar] [CrossRef]
- Klanac, A. Design Methods for Safe Ship Structures; Aalto University: Aalto, Finland, 2011. [Google Scholar]
- Klanac, A.; Ehlers, S.; Tabri, K.; Rudan, S.; Broekhuijsen, J. Qualitative design assessment of crashworthy structures. In Proceedings of the International Maritime Association of Mediterranean (IMAM), Lisbon, Portugal, 26–30 September 2005; pp. 461–469. [Google Scholar]
- Ehlers, S.; Broekhuijsen, J.; Alsos, H.; Biehl, F.; Tabri, K. Simulating the collision response of ship side structures: A failure criteria benchmark study. Int. Shipbuild. Prog. 2008, 55, 127–144. [Google Scholar]
- Storheim, M.; Amdahl, J. Design of offshore structures against accidental ship collisions. Mar. Struct. 2014, 37, 135–172. [Google Scholar] [CrossRef]
- Mujeeb-Ahmed, M.P.; Ince, S.T.; Paik, J.K. Computational models for the structural crashworthiness analysis of a fixed-type offshore platform in collisions with an offshore supply vessel. Thin-Walled Struct. 2020, 154, 106868. [Google Scholar] [CrossRef]
- Wang, B.; Yu, H.C.; Basu, R. Ship and ice collision modeling and strength evaluation of LNG ship structure. In Proceedings of the 27th International Conference on Offshore Mechanics and Arctic Engineering, ASME, Estoril, Portugal, 15–20 June 2008. [Google Scholar]
- Paik, J.K. Practical techniques for finite element modeling to simulate structural crashworthiness in ship collisions and grounding Ships and Offshore Structures. Ships Offshore Struct. 2007, 2, 69–80. [Google Scholar] [CrossRef]
- Paik, J.K. Advanced Structural Safety Studies with Extreme Conditions and Accidents; Springer: Singapore, 2020. [Google Scholar] [CrossRef]
- Wilson, P. Basic Naval Architecture; Springer: Berlin/Heidelberg, Germany, 2018. [Google Scholar] [CrossRef]
- Conti, F.; Le Sourne, H.; Vassalos, D.; Kujala, P.; Lindroth, D.; Kim, S.J.; Hirdaris, S. A comparative method for scaling SOLAS collision damage distributions based on ship crashworthiness—Application to probabilistic damage stability analysis of a passenger ship. Ships Offshore Struct. 2021. [Google Scholar] [CrossRef]
- Sea-Web. IHS Markit. Available online: https://ihsmarkit.com/products/sea-web-maritime-reference.html (accessed on 1 January 2021).
- IMO GISIS. Available online: https://webaccounts.imo.org/Common/weblogin.aspx?App=GISISPublic&ReturnUrl=https%3a%2f%2fgisis.imo.org%2fPublic%2fMCI%2fDefault.aspx&error_message=login_required (accessed on 1 January 2021).
- EMSA EMCIP. Available online: https://portal.emsa.europa.eu/emcip-public/#/dashboard (accessed on 1 January 2021).
- Luhmann, H. FLOODSTAND WP1: Concept Ship Design B; MEYER WERFT GmbH: Papenburg, Germany, 2009. [Google Scholar]
- Zhang, S. The Mechanics of Ship Collision. Ph.D. Thesis, Technical University of Denmark, Limby, Denmark, 1999. [Google Scholar]
- Buldgen, L.; Le Sourne, H.; Besnard, N.; Rigo, P. Extension of the super-element method to the analysis of the oblique collision between two ships. Mar. Struct. 2012, 29, 22–57. [Google Scholar] [CrossRef] [Green Version]
- Bureau Veritas. Hydrostar for Experts User Manual; Bureau Veritas: Paris, France, 2019. [Google Scholar]


| Damage Position | Collision | Grounding |
|---|---|---|
| Bow | 56 | 7 |
| Stern | 4 | 8 |
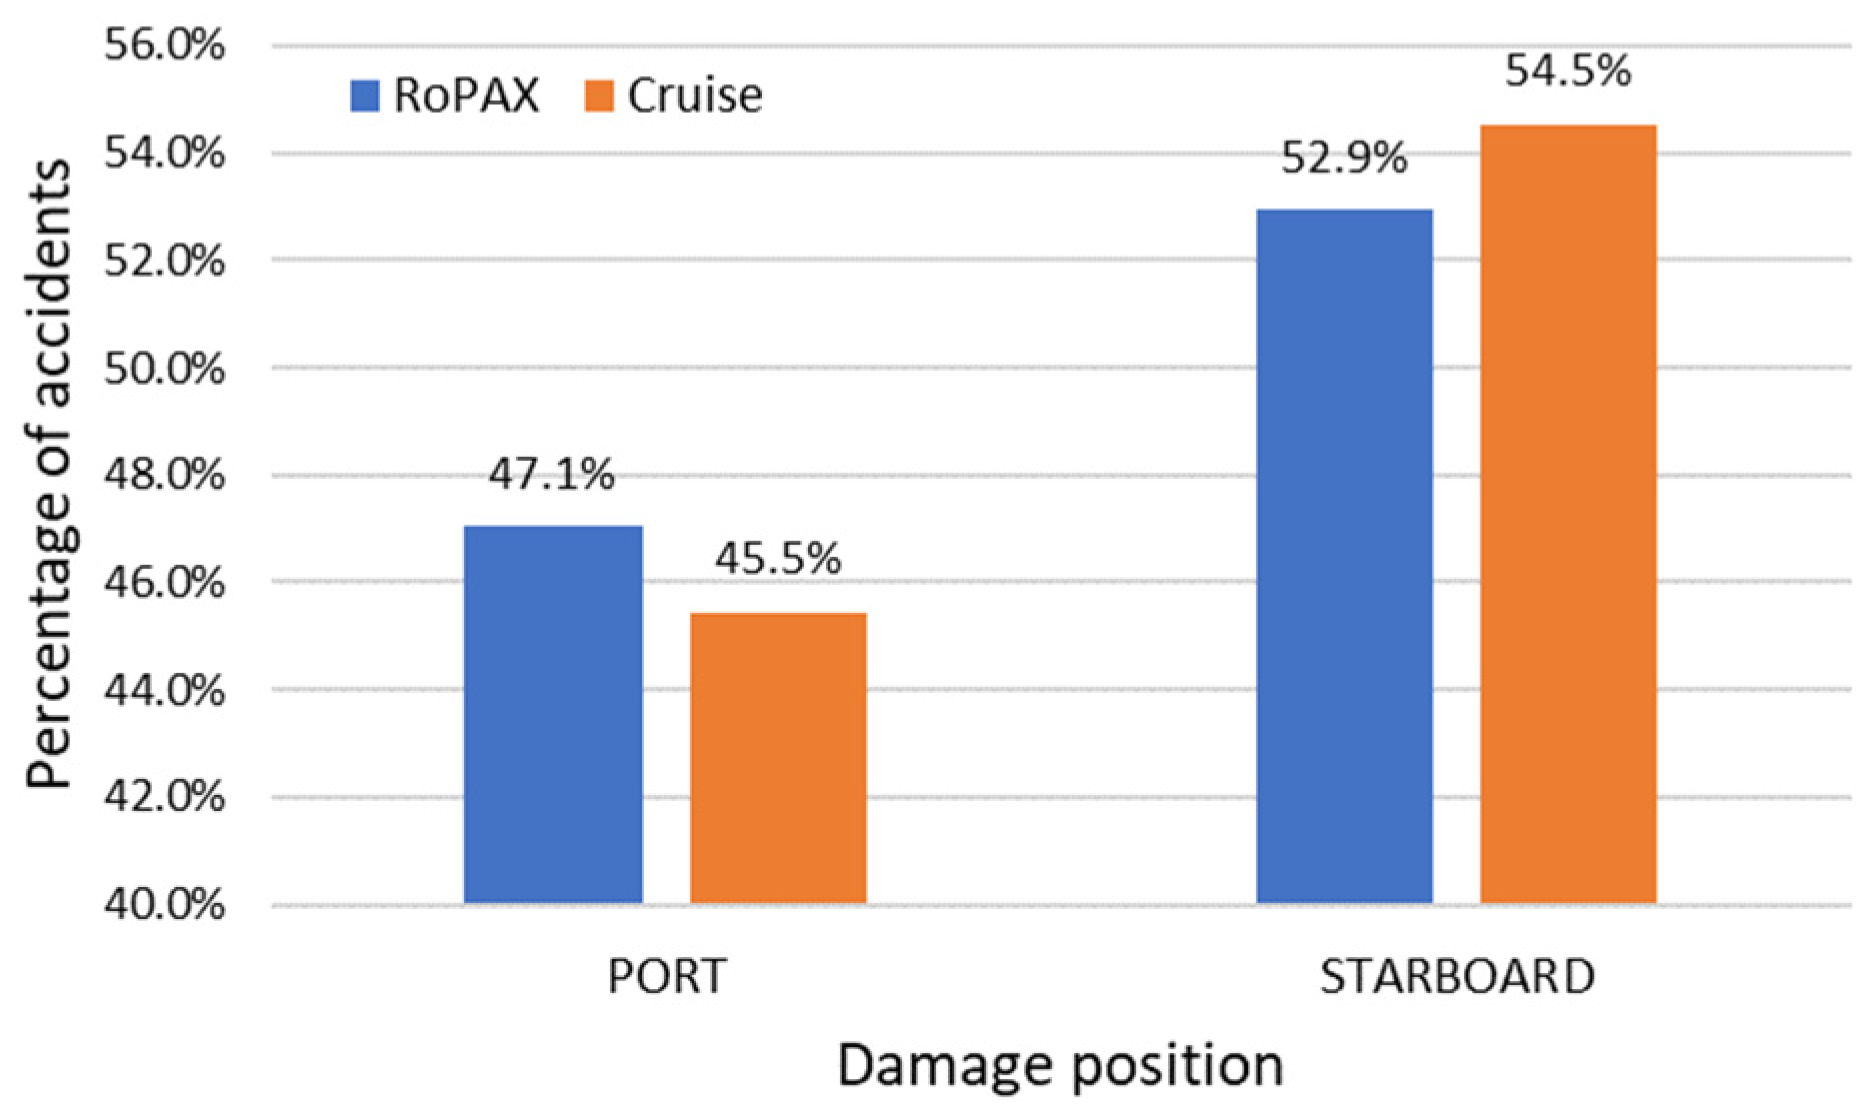
| Port | 48 | 12 |
| Starboard | 84 | 46 |
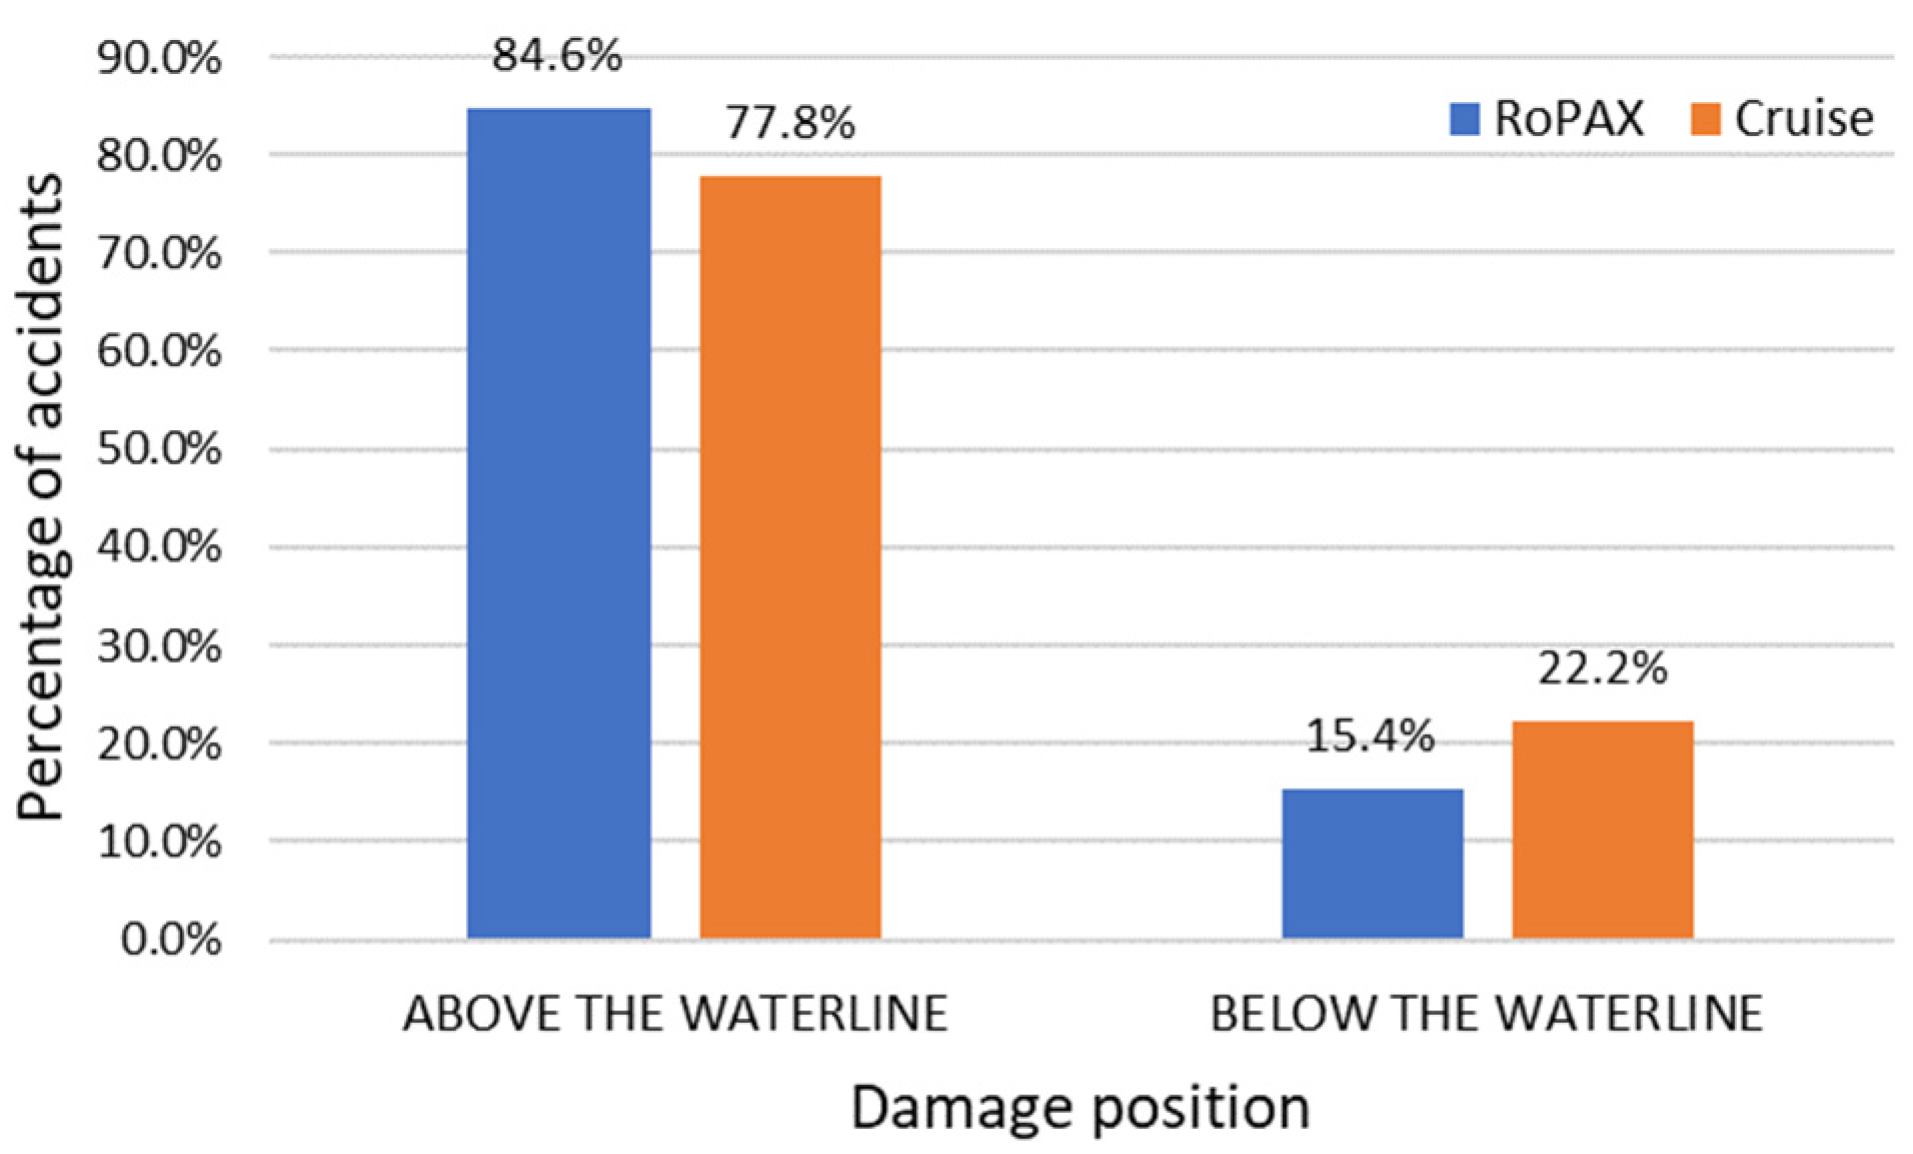
| Above the waterline | 66 | 3 |
| Below the waterline | 19 | 85 |
| Damage Extent | Collision | Side Grounding | Bottom Grounding |
|---|---|---|---|
| Length (L) | 32 | 14 | 12 |
| Width (W) | 10 | 10 | 5 |
| Penetration (D) | 0 | 0 | 1 |
| Accident Type | Damage Characteristics | Parameter | |
|---|---|---|---|
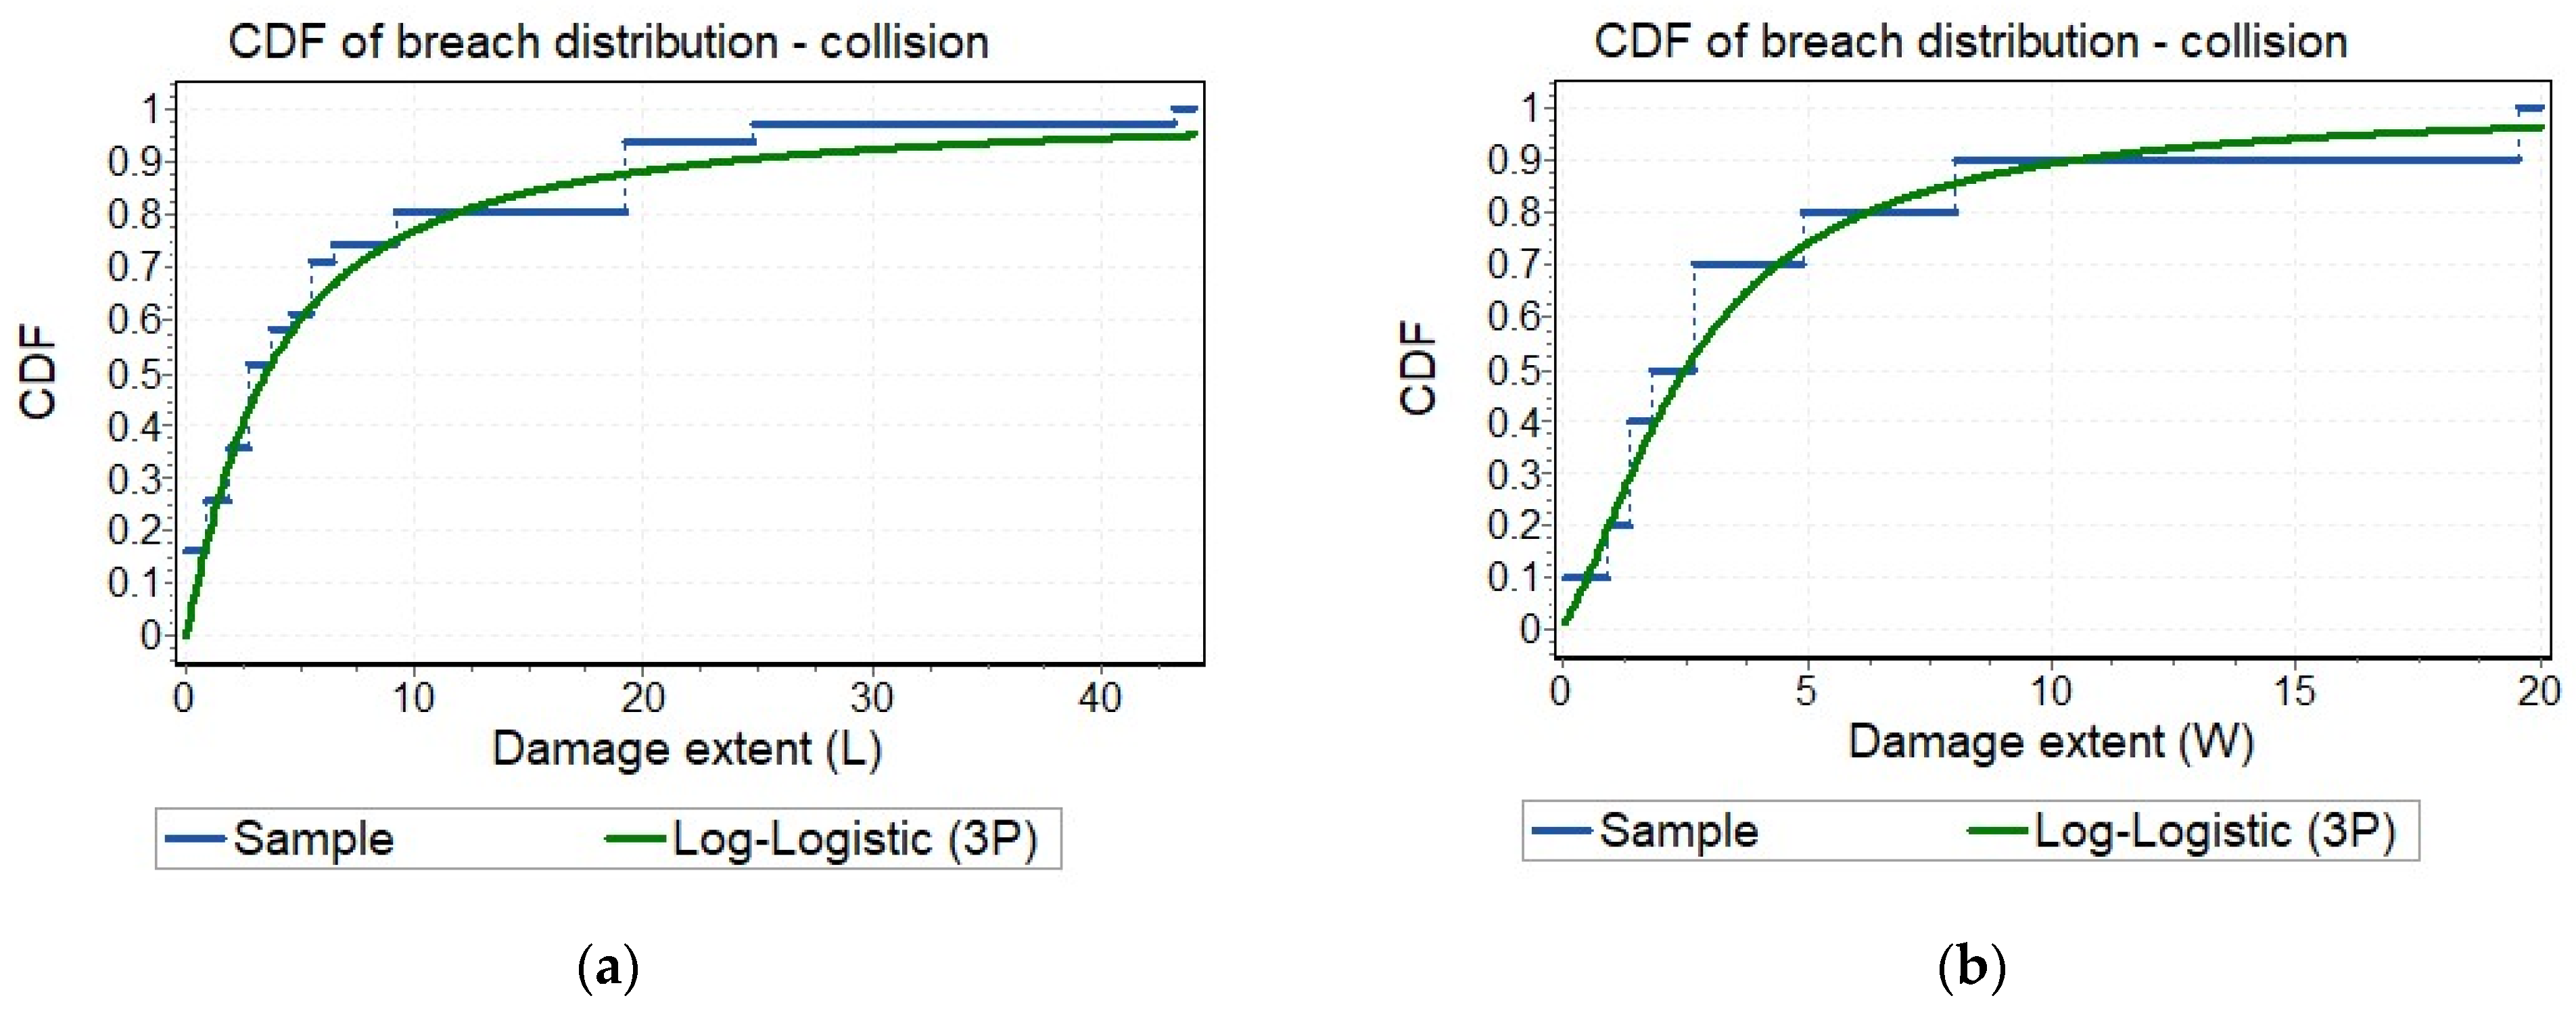
| Collision | Damage length (L) | 3-P Log-logistic | |
| Damage width (W) | 3-P Log-logistic | ||
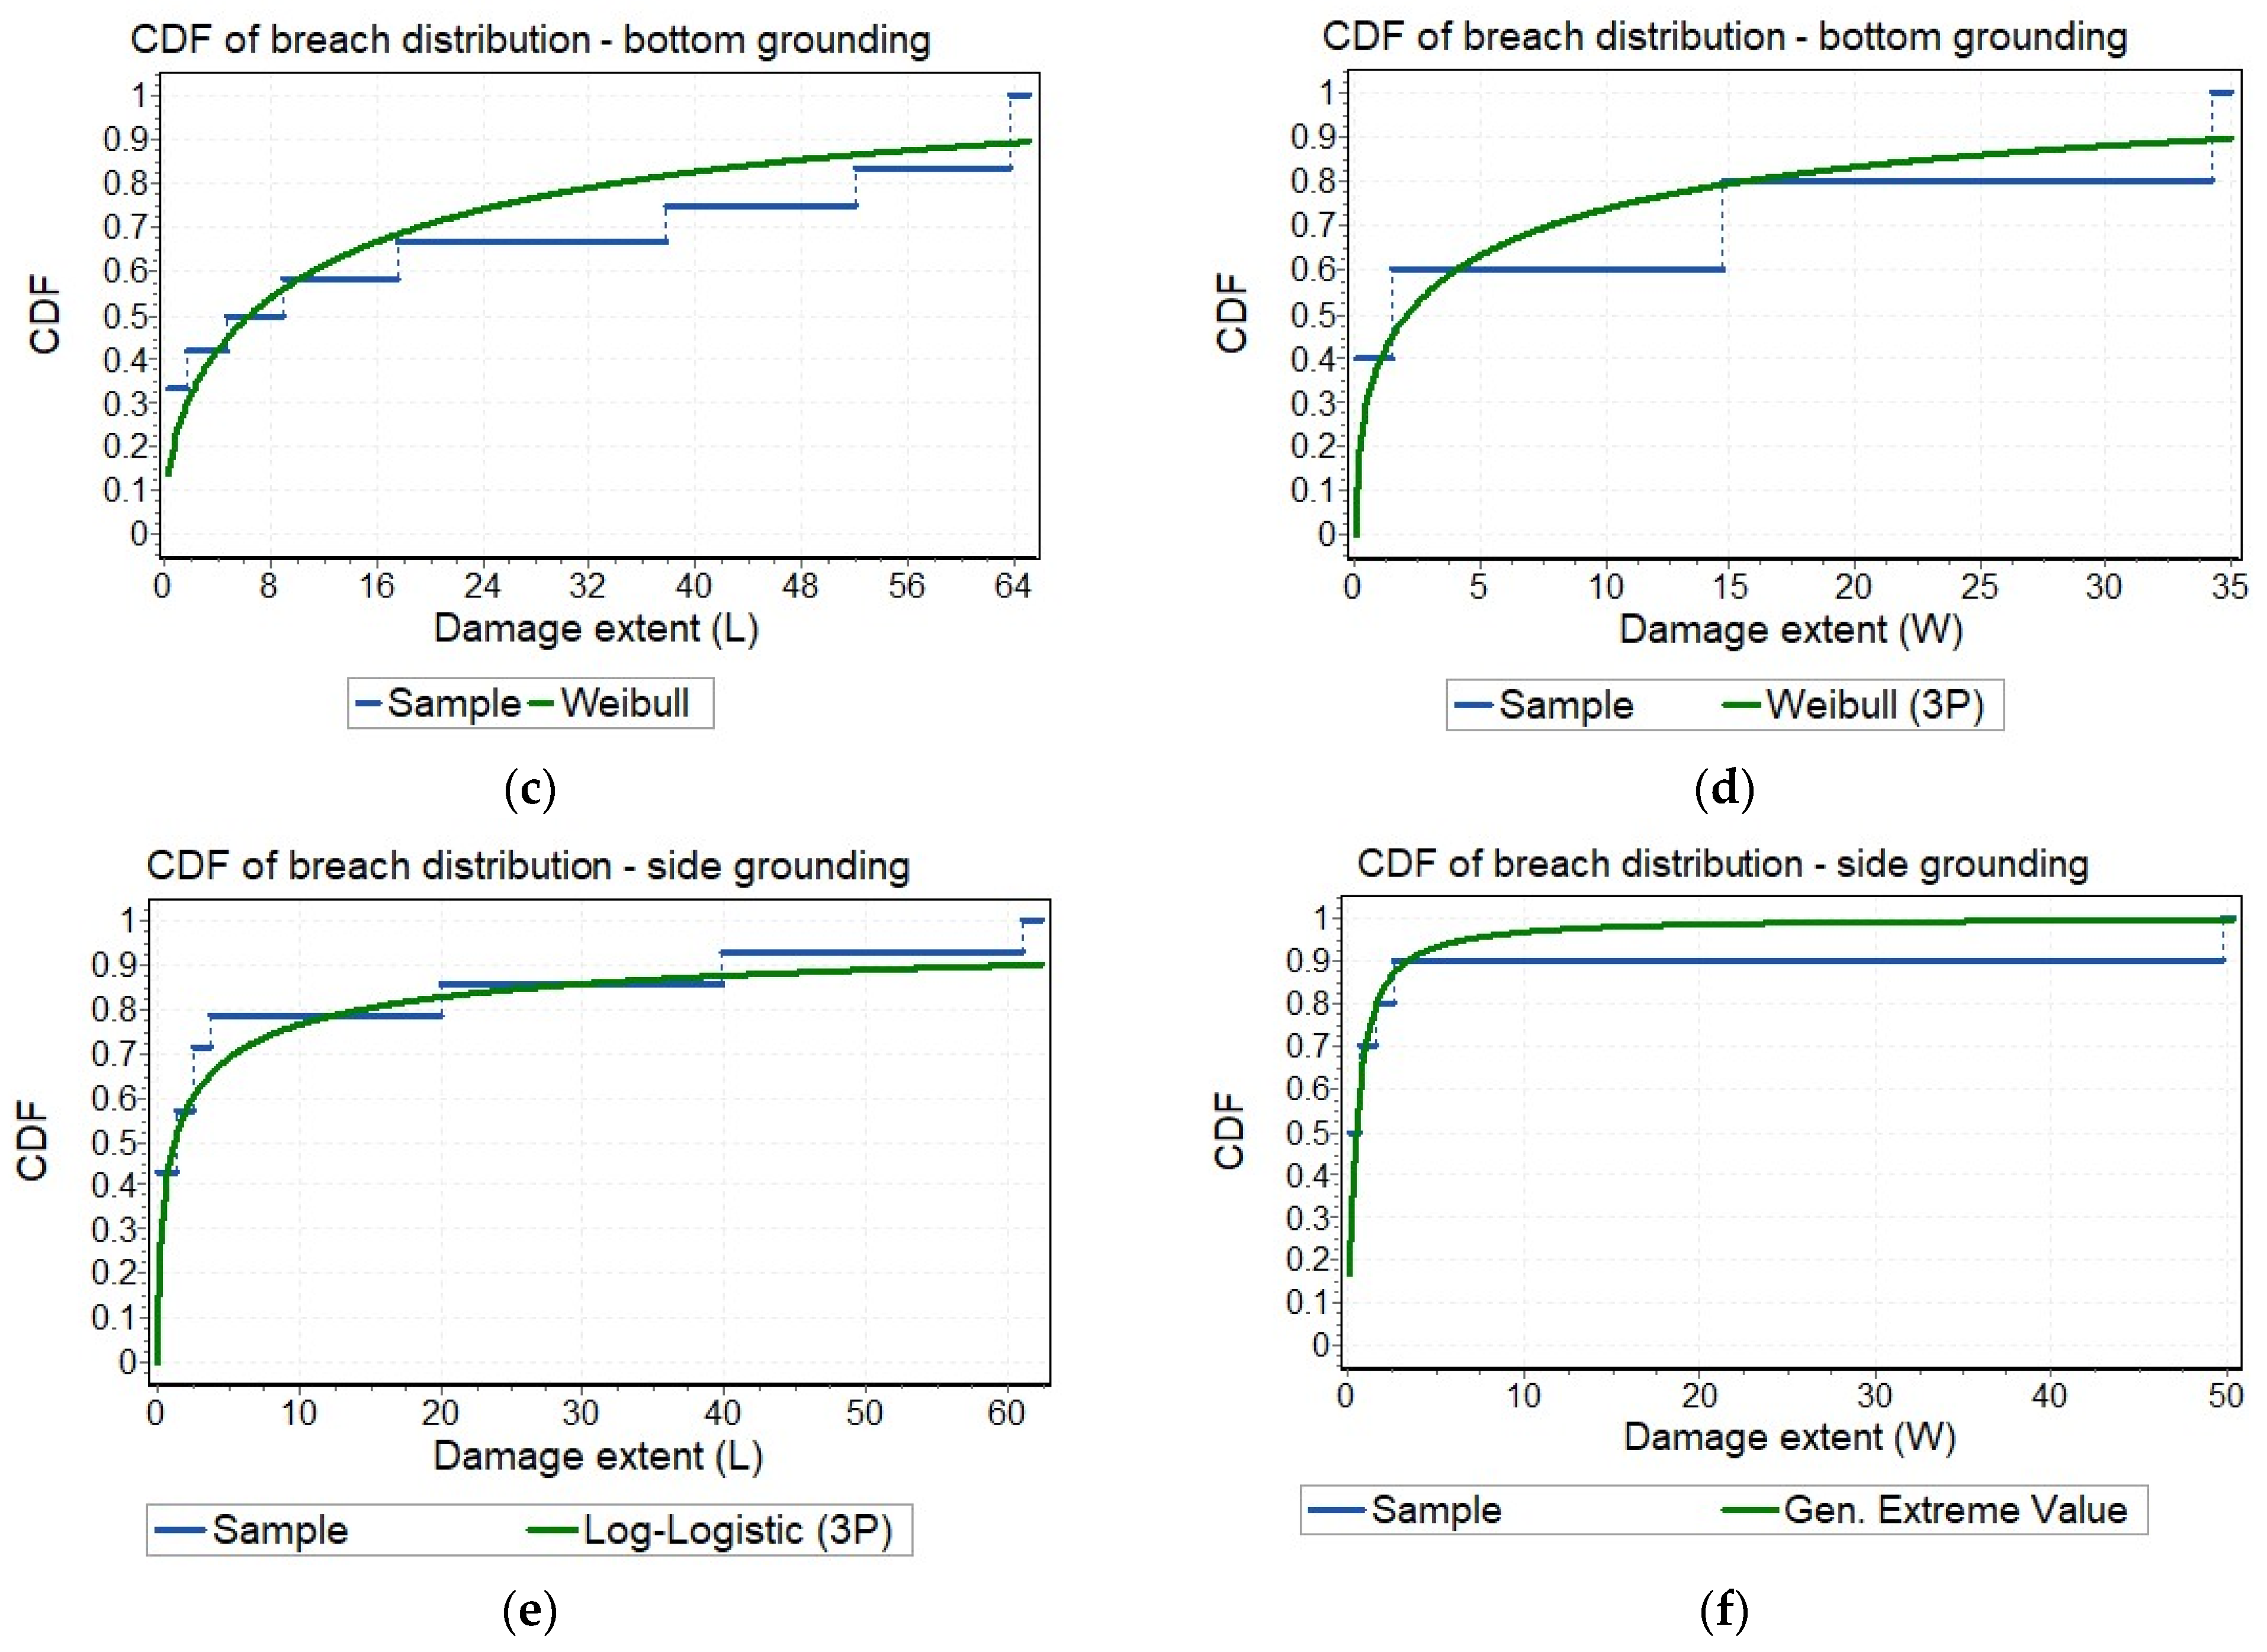
| Bottom grounding | Damage length (L) | 2-P Weibull | |
| Damage width (W) | 3-P Weibull | ||
| Side grounding | Damage length (L) | 3-P Log-logistic | |
| Damage width (W) | General extreme value |
| Parameter | Unit Values |
|---|---|
| Striking ship type | 11 ships (see Table 5) |
| Striking ship initial surge velocity [m/s] | 2, 4, 6, 8, 10 |
| Impact longitudinal position [m] | 95.2, 103.6, 112 |
| Collision angle [degrees] | 30, 45, 60, 90 |
| ID | Vessel Type | Length Overall [m] | Moulded Breadth [m] | Draft [m] | Depth [m] | Displacement [tonnes] |
|---|---|---|---|---|---|---|
| 1 | Cargo | 92.2 | 14.0 | 4.9 | 10.0 | 3500 |
| 2 | CSV | 80.0 | 17.6 | 6.8 | 13.8 | 3500 |
| 3 | Chemical carrier | 110.0 | 19.5 | 7.6 | 10.6 | 11,064 |
| 4 | Gas carrrier | 155.0 | 22.70 | 6.92 | 17.95 | 16,006 |
| 5 | Cargo | 145.0 | 15.87 | 8.00 | 11.15 | 15,415 |
| 6 | RoRo | 180.0 | 30.50 | 6.80 | 15.80 | 22,062 |
| 7 | Passenger | 251.0 | 28.80 | 6.60 | 19.35 | 29,558 |
| 8 | RoPax | 221.0 | 30.00 | 6.90 | 15.32 | 30,114 |
| 9 | Bulk carrier | 180.0 | 30.00 | 10.00 | 15.00 | 50,000 |
| 10 | Container | 300.0 | 48.20 | 12.50 | 24.60 | 119,130 |
| 11 | Tanker | 274.0 | 42.00 | 14.90 | 21.00 | 140,000 |
| Parameter | Value |
|---|---|
| LPP [m] | 216.8 |
| Breath moulded B [m] | 32.2 |
| Depth D [m] | 16 |
| Draft T [m] | 7.2 |
| Displacement [tonnes] | 33,923 |
| Parameter | Value |
|---|---|
| Yield strength [MPa] | 235 |
| Tensile strength [MPa] | 400 |
| Flow stress [MPa] | 317.5 |
| Failure strain [-] | 10% |
Publisher’s Note: MDPI stays neutral with regard to jurisdictional claims in published maps and institutional affiliations. |
© 2022 by the authors. Licensee MDPI, Basel, Switzerland. This article is an open access article distributed under the terms and conditions of the Creative Commons Attribution (CC BY) license (https://creativecommons.org/licenses/by/4.0/).
Share and Cite
Vassalos, D.; Mujeeb-Ahmed, M.P.; Paterson, D.; Mauro, F.; Conti, F. Probabilistic Damage Stability for Passenger Ships—The p-Factor Illusion and Reality. J. Mar. Sci. Eng. 2022, 10, 348. https://doi.org/10.3390/jmse10030348
Vassalos D, Mujeeb-Ahmed MP, Paterson D, Mauro F, Conti F. Probabilistic Damage Stability for Passenger Ships—The p-Factor Illusion and Reality. Journal of Marine Science and Engineering. 2022; 10(3):348. https://doi.org/10.3390/jmse10030348
Chicago/Turabian StyleVassalos, Dracos, M. P. Mujeeb-Ahmed, Donald Paterson, Francesco Mauro, and Fabien Conti. 2022. "Probabilistic Damage Stability for Passenger Ships—The p-Factor Illusion and Reality" Journal of Marine Science and Engineering 10, no. 3: 348. https://doi.org/10.3390/jmse10030348
APA StyleVassalos, D., Mujeeb-Ahmed, M. P., Paterson, D., Mauro, F., & Conti, F. (2022). Probabilistic Damage Stability for Passenger Ships—The p-Factor Illusion and Reality. Journal of Marine Science and Engineering, 10(3), 348. https://doi.org/10.3390/jmse10030348