
A Process Study of Seiches over Coastal Waters of Shenzhen China after the Passage of Typhoons


Abstract
:1. Introduction
2. Observations and Theoretical Calculations of Seiches
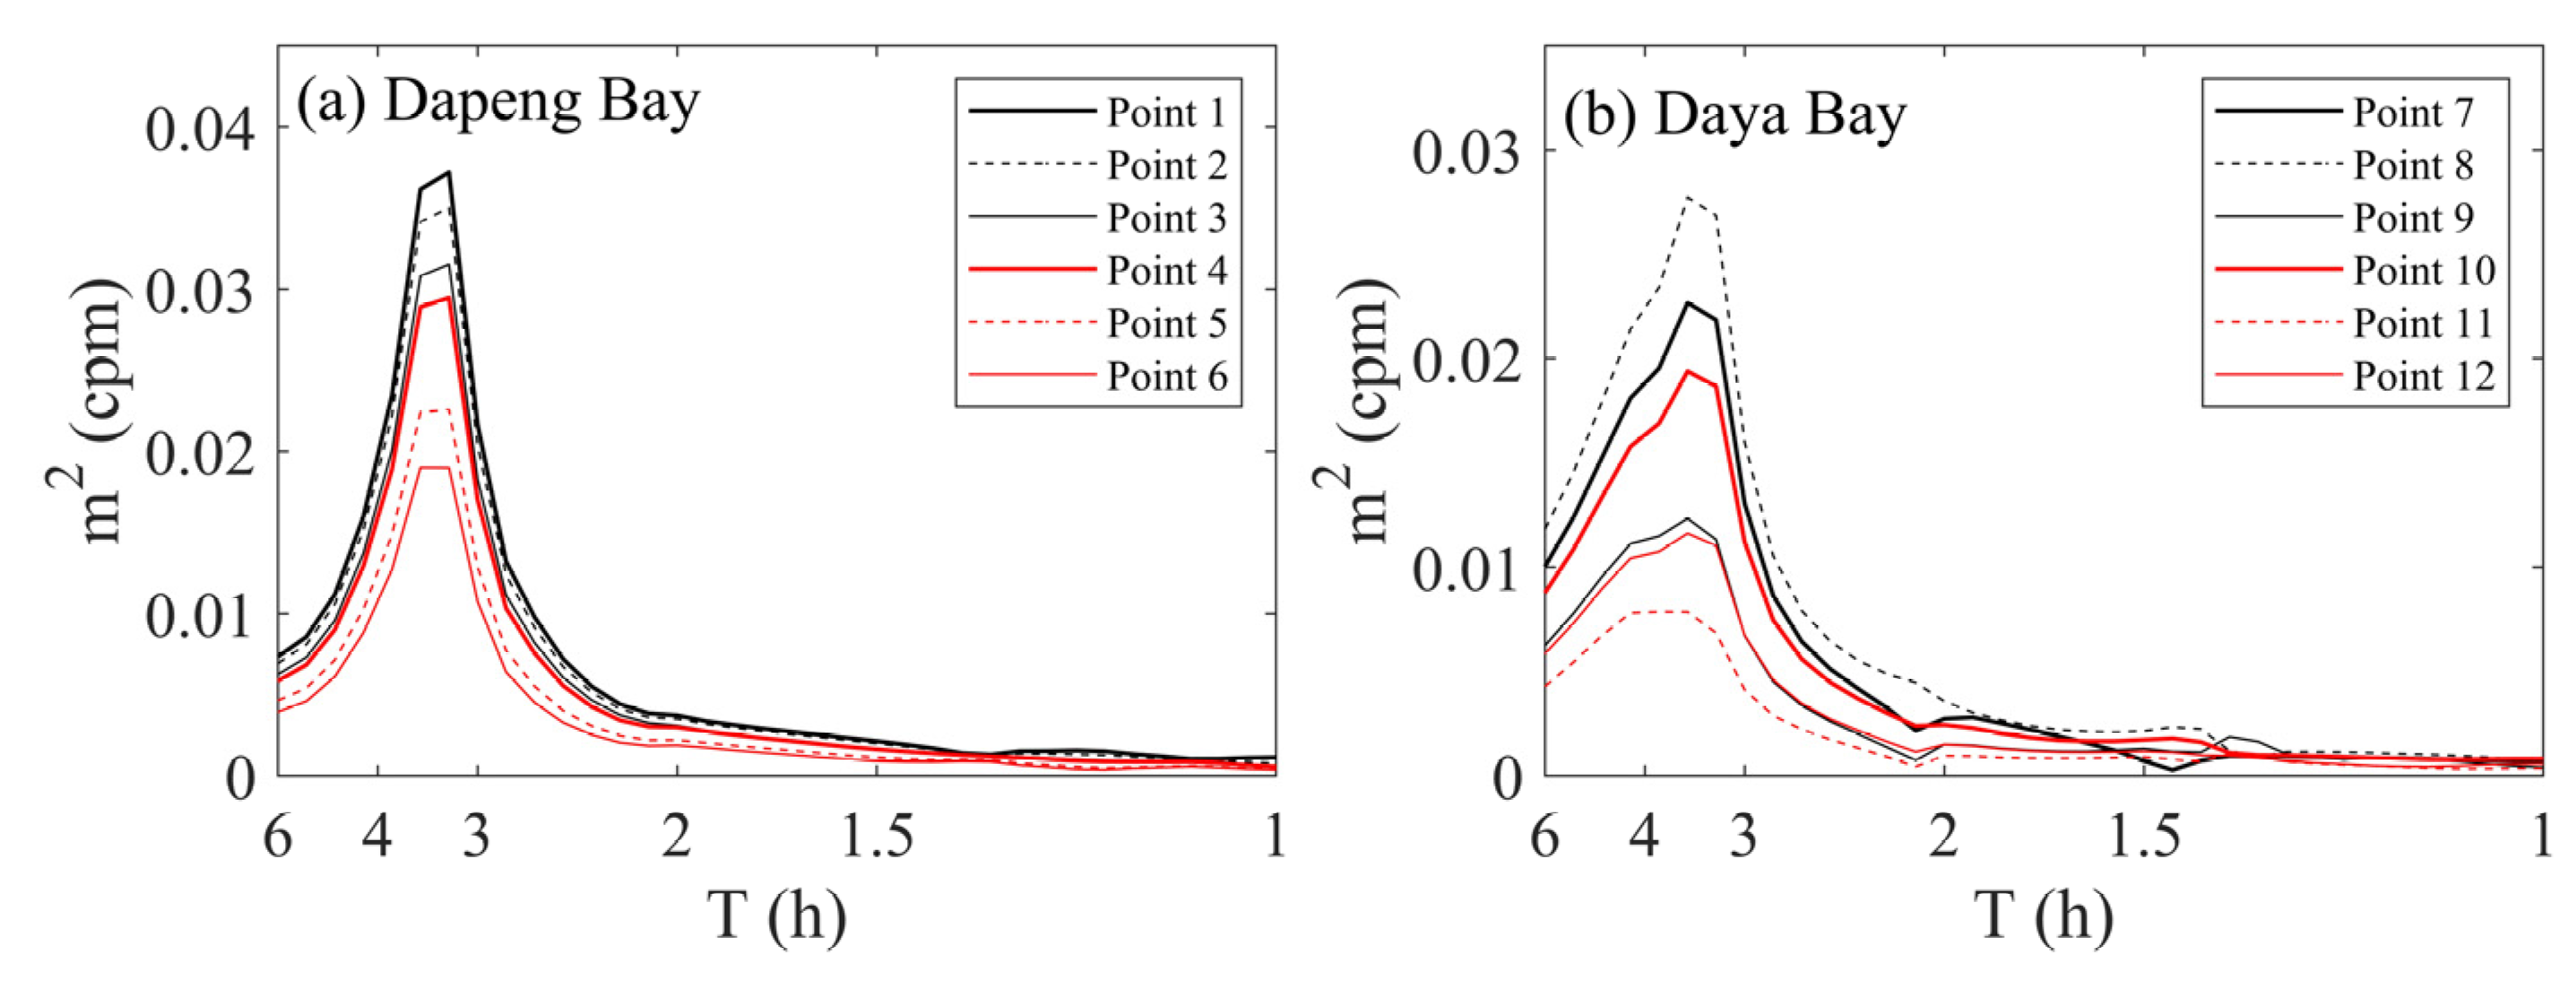
2.1. Observations of Seiches
2.2. Theoretical Consideration
3. Model Setup and Validation
4. The Mechanism of Seiches in Dapeng and Daya Bays
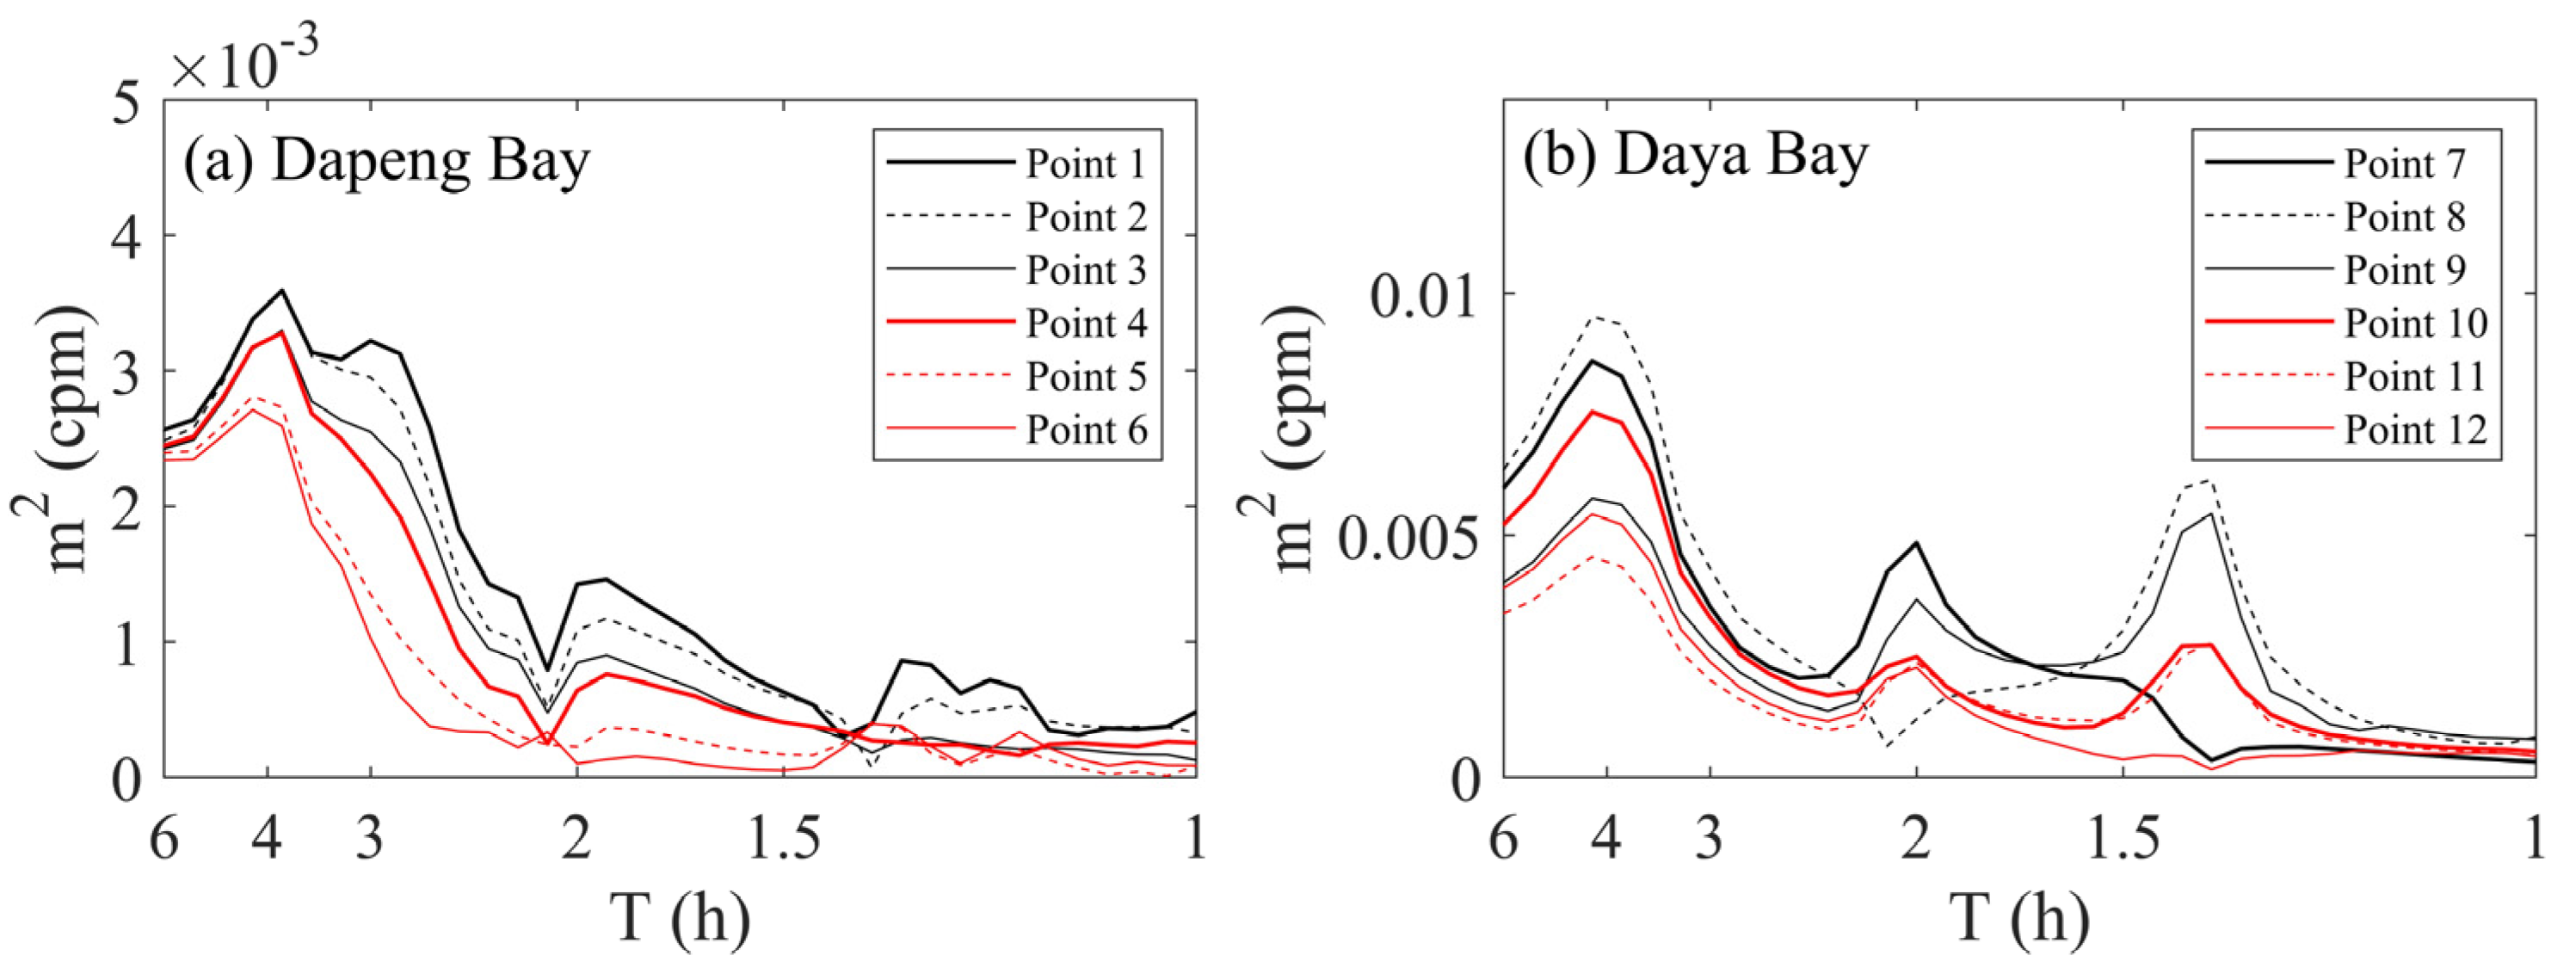
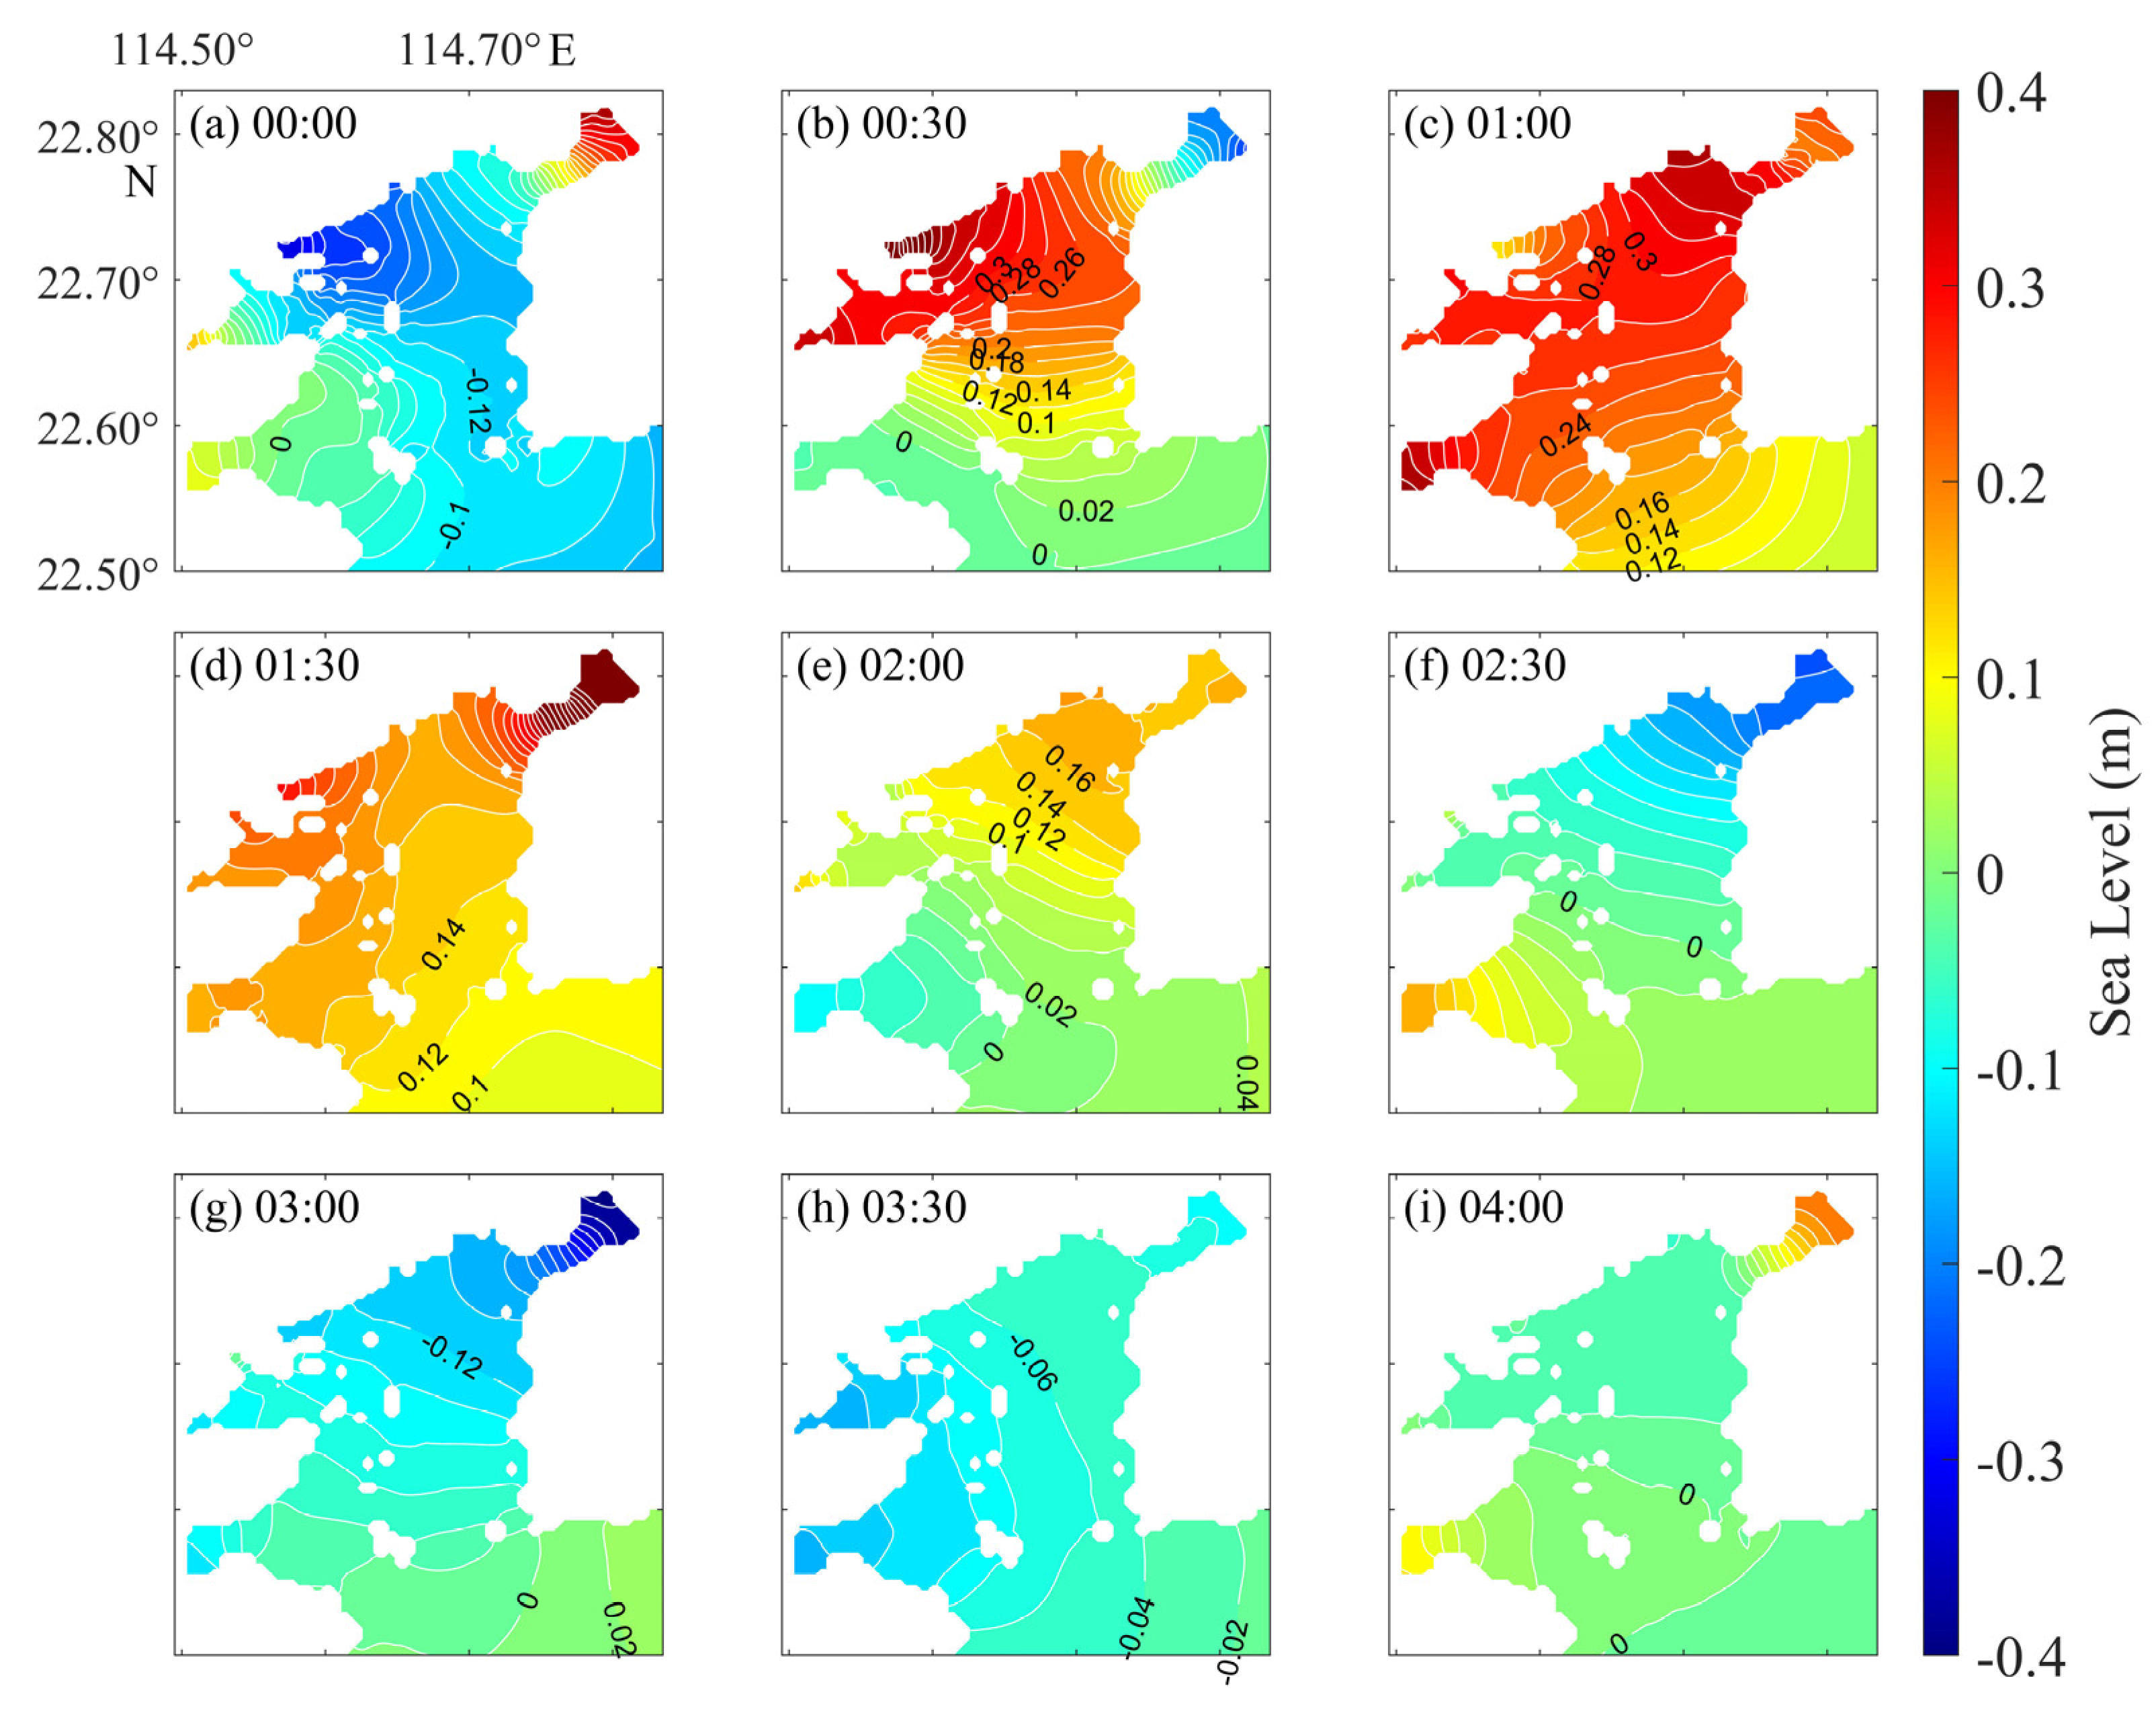
4.1. Seiches after the Passage of Typhoons
4.2. Effect of Wind Directions on Seiches
5. Summary
Author Contributions
Funding
Institutional Review Board Statement
Informed Consent Statement
Data Availability Statement
Acknowledgments
Conflicts of Interest
References
- Rif’atin, H.Q.; Magdalena, I. Seiches in a Closed Basin of Various Geometric Shape. J. Phys. Conf. Ser. 2019, 1245, 012061. [Google Scholar] [CrossRef]
- Rabinovich, A.B. Seiches and Harbor Oscillations. In Handbook of Coastal and Ocean Engineering; World Scientific: Singapore, 2009. [Google Scholar]
- Wu, S.; Wang, X.; Dai, M. Primary Study on Characteristics and Formation Cause of Seiches in the Bays. Mar. Sci. Bull. 1999, 18, 6–12. [Google Scholar]
- Li, K.; Wang, Y.; Huang, Y. The Seiche in Dapeng Bay. J. Oceanogr. Huanghai Bohai Seas 1990, 11–15. Available online: http://www.nmglib.com:8901/article/detail.aspx?id=288897 (accessed on 16 January 2022).
- Kenney, B.C. Lake surface fluctuations and the mass flow through the narrows of Lake Winnipeg. J. Geophys. Res. Ocean. 1979, 84, 1225–1235. [Google Scholar] [CrossRef]
- Chuang, W.S.; Boicourt, W.C. Resonant Seiche Motion in the Chesapeake Bay. J. Geophys. Res. Ocean. 1989, 94, 2105–2110. [Google Scholar] [CrossRef]
- Bajo, M.; Međugorac, I.; Umgiesser, G.; Orlić, M. Storm Surge and Seiche Modelling in the Adriatic Sea and the Impact of Data Assimilation. Q. J. R. Meteorol. Soc. 2019, 145, 2070–2084. [Google Scholar] [CrossRef]
- Gomis, D.; Monserrat, S.; Tintoré, J. Pressure-forced seiches of large amplitude in inlets of the Balearic Islands. J. Geophys. Res. 1993, 98, 14437–14445. [Google Scholar] [CrossRef]
- Luettich, R.A.; Carr, S.D.; Reynolds-Fleming, J.V.; Fulcher, C.W.; McNinch, J.E. Semidiurnal seiching in a shallow, micro-tidal lagoonal estuary. Cont. Shelf Res. 2002, 22, 1669–1681. [Google Scholar] [CrossRef]
- Lemon, D.D. Seiche Excitation in a Coastal Bay by Edge Waves Travelling on the Continental Shelf. Ph.D. Dissertation, University of British Columbia, Vancouver, BC, Canada, 1975. [Google Scholar]
- Fan, G.; Xu, Y. Seiche Phenomenon and the Cause Analysis in the Sea Area of Laohutan of Dalian. Trans. Oceanol. Limnol. 2014, 4, 139–143. [Google Scholar]
- Cao, C.; Guo, K.; Li, K.; Chen, Z. Synoptic analyses for the formation of large-amplitude seiche in the main harbors along the coasts of the Bohai Sea and the Huanghai Sea. Acta Oceanol. Sin. 2001, 23, 24–32. [Google Scholar]
- Li, M.; Zhong, L.; Boicourt, W.C.; Zhang, S.; Zhang, D.L. Hurricane-induced storm surges, currents and destratification in a semi-enclosed bay. Geophys. Res. Lett. 2006, 33, L02604. [Google Scholar] [CrossRef] [Green Version]
- Proudman, J. Dynamical Oceanography; Methuen: London, UK, 1953; pp. 85–89. [Google Scholar]
- Raichlen, F. Harbor resonance. In Estuary and Coastline Hydrodynamics; Ippen, A.T., Ed.; McGraw Hill Book Comp.: New York, NY, USA, 1966; pp. 281–340. [Google Scholar]
- Wu, Z.; Jiang, C.; Chen, J.; Long, Y.; Deng, B.; Liu, X. Three-Dimensional Temperature Field Change in the South China Sea during Typhoon Kai-Tak (1213) Based on a Fully Coupled Atmosphere–Wave–Ocean Model. Water 2019, 11, 140. [Google Scholar] [CrossRef] [Green Version]
- Yuxing, W.; Ting, G.; Ning, J.; Zhenyu, H. Numerical Study of the Impacts of Typhoon Parameters on the Storm Surge Based on Hato Storm over the Pearl River Mouth, China. Reg. Stud. Mar. Sci. 2020, 34, 101061. [Google Scholar] [CrossRef]
- Holland, G.J. An analytic model of the wind and pressure profiles in hurricanes. Mon. Weather. Rev. 1980, 108, 1212–1218. [Google Scholar] [CrossRef]
- Ying, M.; Zhang, W.; Yu, H.; Lu, X.; Feng, J.; Fan, Y.; Zhu, Y.; Chen, D. An Overview of the China Meteorological Administration Tropical Cyclone Database. J. Atmos. Ocean. Technol. 2014, 31, 287–301. [Google Scholar] [CrossRef] [Green Version]
- Lu, X.; Yu, H.; Ying, M.; Zhao, B.; Zhang, S.; Lin, L.; Bai, L.; Wan, R. Western North Pacific Tropical Cyclone Database Created by the China Meteorological Administration. Adv. Atmos. Sci. 2021, 38, 690–699. [Google Scholar] [CrossRef]
- Egbert, G.D.; Erofeeva, S.Y. Efficient Inverse Modeling of Barotropic Ocean Tides. J. Atmos. Ocean. Technol. 2002, 19, 183–204. [Google Scholar] [CrossRef] [Green Version]


| Natural Periods (Hours) | ||
|---|---|---|
| Dapeng Bay | Daya Bay | |
| L (km) in A–A direction | 25.0 | 25.0 |
| L (km) in B–B direction | 14.0 | 18.0 |
| h (m) | 8.5 | 6.3 |
| T1 (hours) in A–A direction | 3.0 | 3.5 |
| T1 (hours) in B–B direction | 0.9 | 1.3 |
| T2 (hours) in A–A direction | 1.0 | 1.2 |
| T2 (hours) in B–B direction | 0.4 | 0.6 |
| T3 (hours) in A–A direction | 0.6 | 0.7 |
| T3 (hours) in B–B direction | 0.3 | 0.4 |
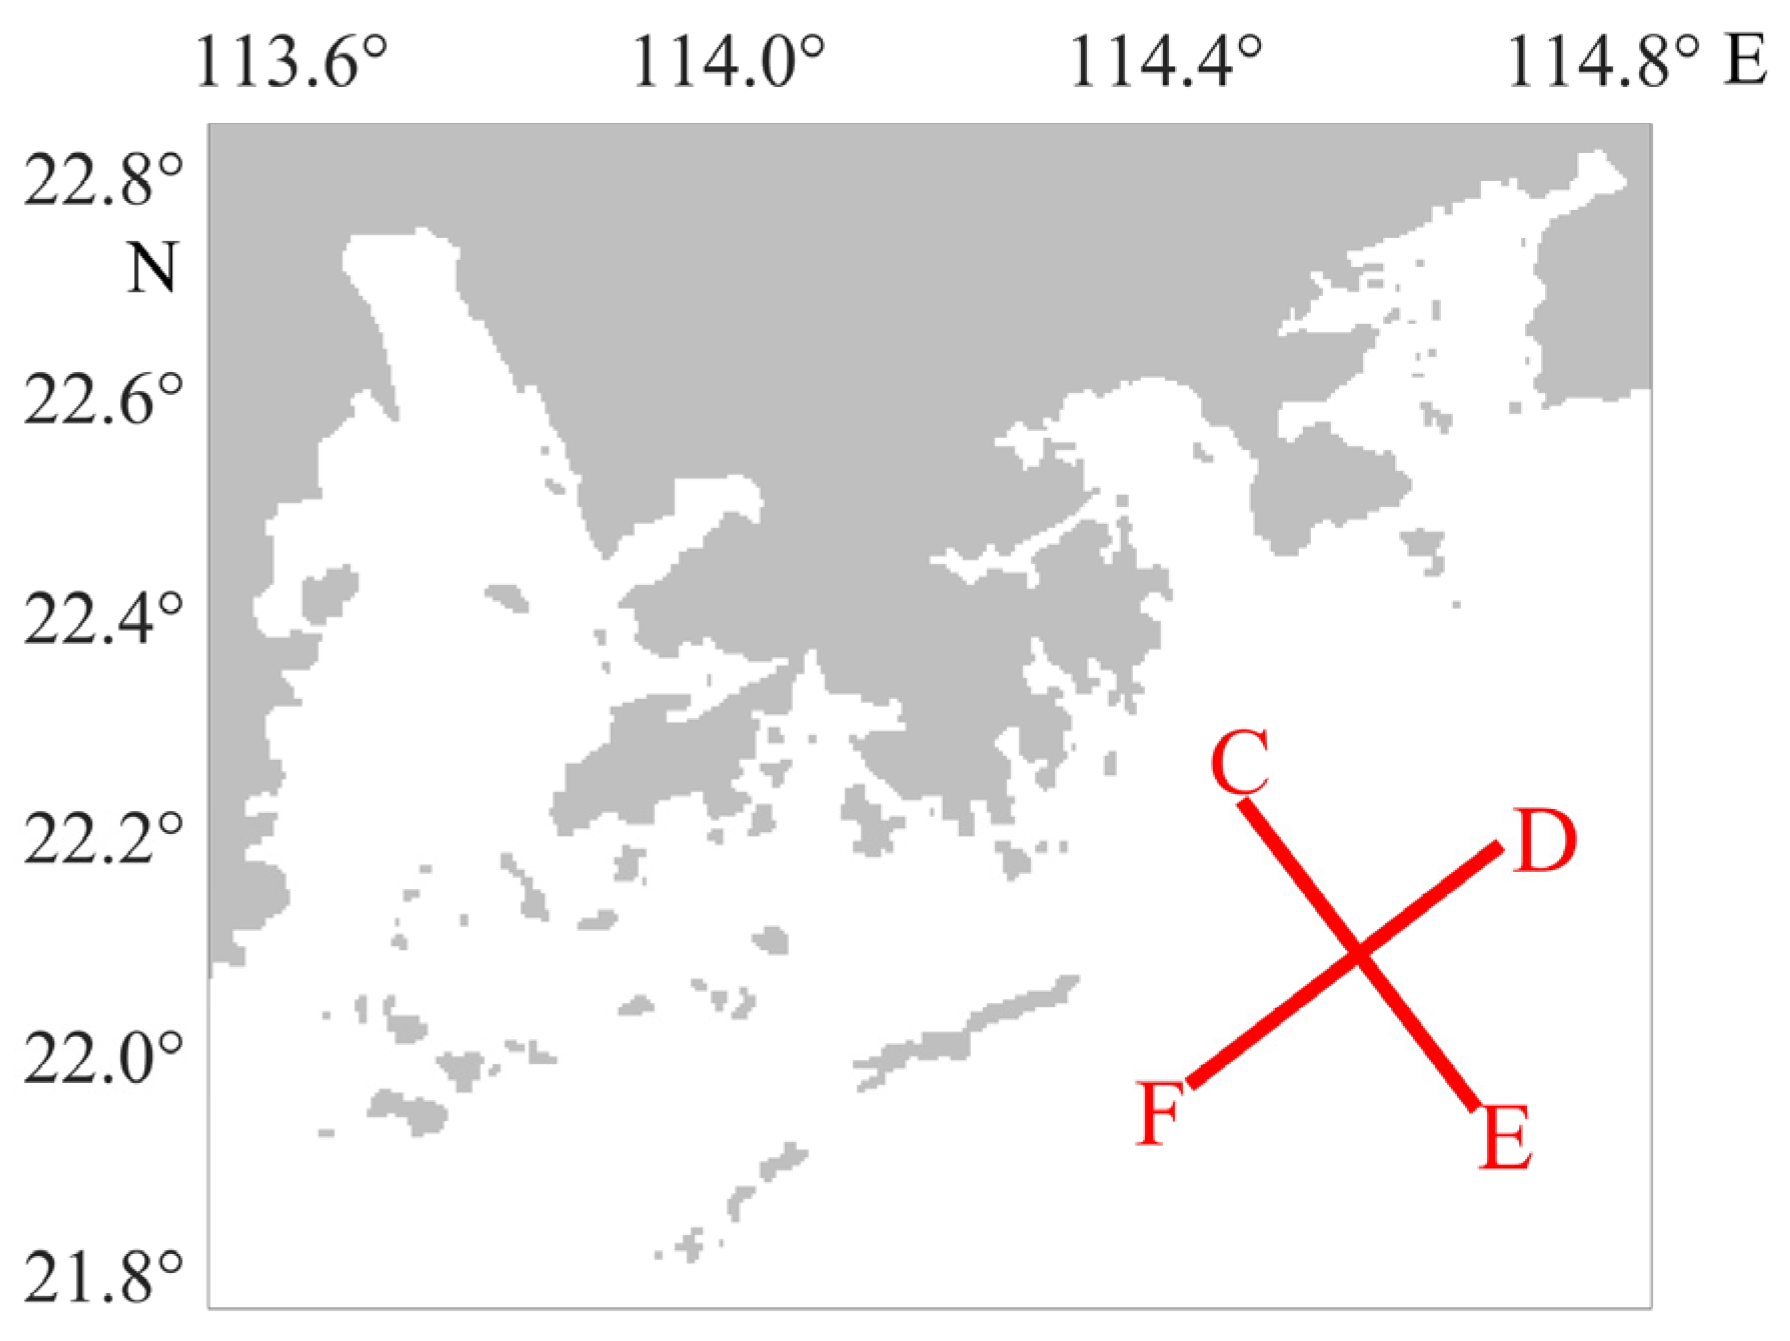
| Idealized Run | Direction | U (m/s) | V (m/s) |
|---|---|---|---|
| 1 | D–F | −30 | −20 |
| 2 | E–C | −20 | 30 |
| 3 | F–D | 30 | 20 |
| 4 | C–E | 20 | −30 |
Publisher’s Note: MDPI stays neutral with regard to jurisdictional claims in published maps and institutional affiliations. |
© 2022 by the authors. Licensee MDPI, Basel, Switzerland. This article is an open access article distributed under the terms and conditions of the Creative Commons Attribution (CC BY) license (https://creativecommons.org/licenses/by/4.0/).
Share and Cite
Deng, G.; Xing, J.; Sheng, J.; Chen, S. A Process Study of Seiches over Coastal Waters of Shenzhen China after the Passage of Typhoons. J. Mar. Sci. Eng. 2022, 10, 327. https://doi.org/10.3390/jmse10030327
Deng G, Xing J, Sheng J, Chen S. A Process Study of Seiches over Coastal Waters of Shenzhen China after the Passage of Typhoons. Journal of Marine Science and Engineering. 2022; 10(3):327. https://doi.org/10.3390/jmse10030327
Chicago/Turabian StyleDeng, Guotong, Jiuxing Xing, Jinyu Sheng, and Shengli Chen. 2022. "A Process Study of Seiches over Coastal Waters of Shenzhen China after the Passage of Typhoons" Journal of Marine Science and Engineering 10, no. 3: 327. https://doi.org/10.3390/jmse10030327
APA StyleDeng, G., Xing, J., Sheng, J., & Chen, S. (2022). A Process Study of Seiches over Coastal Waters of Shenzhen China after the Passage of Typhoons. Journal of Marine Science and Engineering, 10(3), 327. https://doi.org/10.3390/jmse10030327