Article

Modeling Coastal Freak Wave Occurrence

Department of Hydraulic and Ocean Engineering, National Cheng Kung University, Tainan 70101, Taiwan
*
Author to whom correspondence should be addressed.
J. Mar. Sci. Eng. 2022, 10(3), 323; https://doi.org/10.3390/jmse10030323
Submission received: 4 January 2022 / Revised: 20 February 2022 / Accepted: 23 February 2022 / Published: 25 February 2022
(This article belongs to the Special Issue Coastal Flooding and Protection)

Abstract

:
Fishermen frequently suffer accidents and may even drown when they are swept into the sea by coastal freak waves near the shore of northeastern Taiwan. To accurately predict the deformation of free surfaces when waves violently strike coastal structures, the smoothed particle hydrodynamics (SPH) model with a nonlinear and mesh-free numerical approach was adopted in this study. Eight cases based on an actual coastal freak wave accident were simulated. The results show that the maximum splash height of the coastal freak wave in the breakwater was dependent not only on the incident wave but also on the existence of armor blocks. The armor block installation reduces the overflow discharge but enhances the horizontal throw speed of the coastal freak wave by more than five times.

1. Introduction

Freak (rogue) waves are hazardous surface waves that occur in the world’s oceans. A wave such as this is defined as one that is larger than twice the significant wave height. Many shipwrecks have been reported to be attacked by freak waves [1,2,3,4,5]. Scientists have studied the mechanics of freak wave occurrence based on field measurements, experiments and numerical simulations [6,7,8,9,10,11,12,13,14].
Unlike freak waves that occur in the ocean, coastal freak waves (CFWs) are the large amounts of splash water that take place at the coast as a result of complex wave–structure interactions. These are recognized as the wave overtopping processes. Many people like fishing on harbor breakwaters or rocks in the coastal area of Taiwan. Sometimes, they are attacked by coastal freak waves or even washed into the sea. CFWs are often generated without any forewarning in the calm sea state. People, especially fishermen who stay in coastal zones, cannot protect themselves from overtopping flow or splashes that surge on the tops of breakwaters or in coastal zones. CFWs have happened anywhere and anytime. Especially before a typhoon arrives, long-period waves from the typhoon can propagate nearshore and generate CFWs after interacting with the coastal shelf or coastal structure. Wave groupness is one of the possible causes that generates CFWs [15]. CFWs have been reported worldwide [16,17,18,19,20]. Doong et al. [21,22] used an optical camera to monitor CFWs and built a warning system using an artificial neural network. Tsai et al. [15] proposed that the generation of a CFW is associated with typhoons and the winter monsoon, and they found that wave groups were highly correlated with the occurrence of CFWs. Nikolkina and Didenkulova [19] collected CFW events, including non-expected waves with extreme heights on the coast but sudden run-up events on the shoreline. Slunyaev et al. [23] noted that an extreme event may occur in coastal zones under strong wave–coast interactions.
The case in which a CFW occurs at the breakwater is often recognized as wave overtopping. Many empirical formulas are used to estimate the mean overtopping discharge for engineering purposes [24,25]. The amount of overtopping always corresponds to the wave conditions, seabed slope, structure arrangement, surf similarity parameter and other factors. However, the understanding of the water amount is insufficient to assess whether it is dangerous for people. Takahashi et al. [26] concluded from an experimental study on the conditions of danger for people due to floods caused by tsunamis that the depth and velocity of water flows are considered critical factors. Bruce et al. [27] estimated the throw speed generated by wave–structure interactions, which can be the key parameter to identify a dangerous coastal freak wave. In this study, a numerical approach is used to estimate the throw speed of wave overtopping, which appears to be a coastal freak wave.
Many researchers have investigated fluid–solid interactions using numerical models to simulate the hydrodynamic conditions for wave overtopping. For example, Peng and Zou [28] established a Reynold-averaged Navier–Stokes solver (RANS) with the volume of fluid (VOF) method to simulate the spatial distribution of wave overtopping. Their simulations were in good agreement with the experimental data. Quang and Van [29] extended the RANS–VOF with a nonlinear shallow water model (NLSW) to investigate wave overtopping in a sea dike in Vietnam. Another mesh-free smooth particle hydrodynamics (SPH) approach was identified by Didier et al. [30] to simulate wave deformation and breaking and predict the spatial distribution of water particles after wave interactions with coastal structures. Therefore, this study uses SPH with the Lagrangian approach to study the hydrodynamic properties of overtopping water triggered by coastal freak waves.

2. The Simulation CFW Event

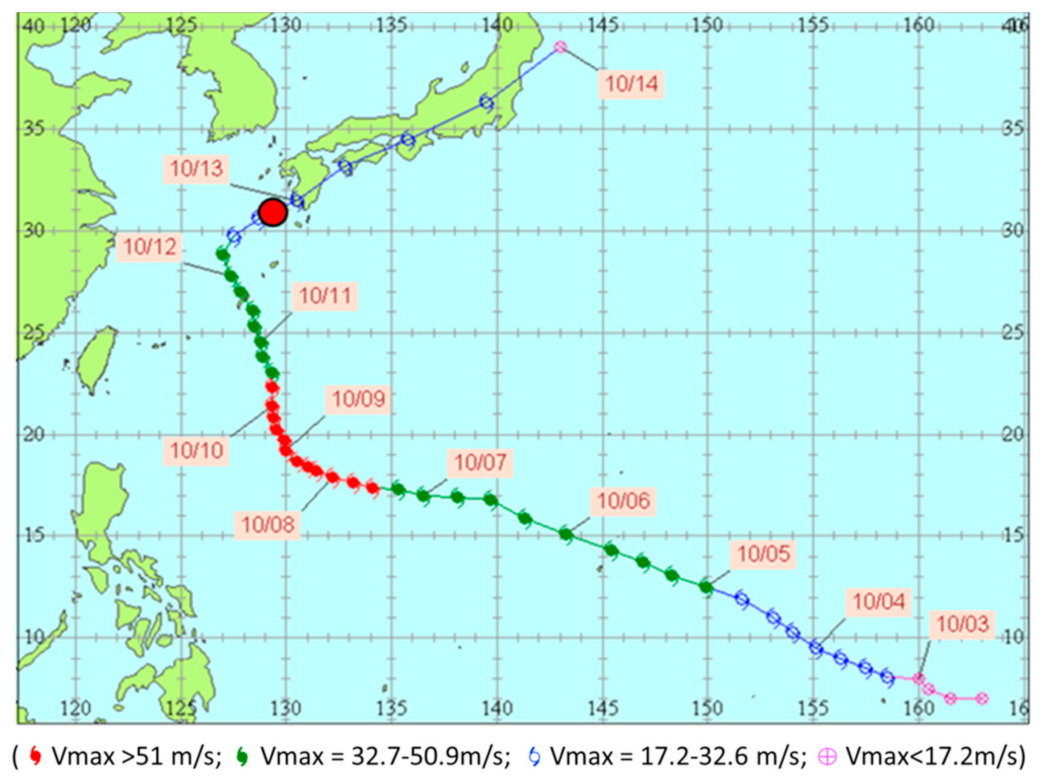
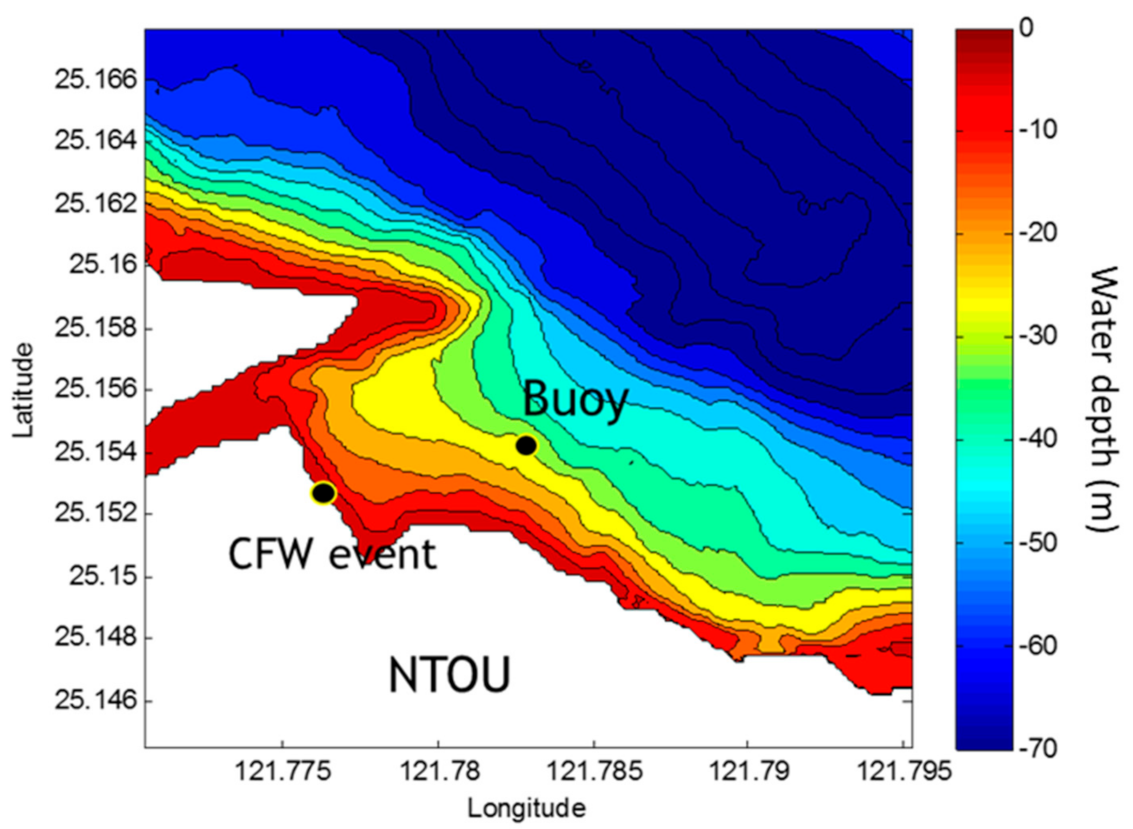
On 13 October 2014, a CFW swept a scooter rider into the sea from the breakwater at the National Taiwan Ocean University (NTOU) breakwater at the northern coast of Taiwan (Figure 1). The splash height was approximately 7 to 8 times the height of an adult. During this time, Typhoon Vongfong was in the northwest Pacific Ocean and moved to Japan. The typhoon track (Figure 2) shows that the distance between the typhoon and accident location was approximately 800 km. A wave buoy was deployed 1 km off the breakwater at a water depth of 40 m. Figure 3 shows the location of the buoy and the bathymetry of the study area. According to the buoy measurements, the significant wave height (SWH, Hm0) was 4.5 m with a significant period (Tm02) of 12 s (peak period 15.1 s) when the CFW occurred. Long-term statistics show that the mean SWH in October is 1.34 m and the period is 6.1 s (mean peak period 8.4 s) for this area. In addition, the measured wind speed was relatively low without being affected by Typhoon Vongfong. These data show that the sea state was significantly dominated by swell when this coastal freak wave occurred.

3. Numerical Simulations

3.1. Governing Equations

The Lagrangian description of the Navier–Stokes equations is used for each single fluid particle, which represents a finite volume of water centered about a point. The governing equations describe the motion of a viscous incompressible flow with full nonlinearity and without simplification. The mass and momentum equations of particle-scale flow can be derived from the Navier–Stokes equations, which can be expressed as
d ρ d t = ρ u
d u d t = Δ P ρ + g + υ 2 u
where ρ is the fluid density, u is the particle velocity, P is the pressure, g is the gravitational acceleration and υ is the fluid viscosity. The fluid is treated as compressible. To calculate the fluid pressure term in the momentum equation, the fluid is treated as weakly compressible, and the equation of state (Equation (3)) is used. Monaghan et al. [31] suggested that the relation between pressure and density could be assumed as follows
P = B ρ ρ 0 γ 1
where γ is the constant with a value of 7 suggested by Monaghan et al. [31], ρ0 is the reference density of water (1000 kg m−3), and B can be calculated by the formula below
B = c 0 ρ 0 / γ
where c0 is the speed of sound at reference density.

3.2. Numerical Scheme

To solve the Navier–Stokes equations, numerical technology has been applied to treat unsteady problems, especially highly nonlinear problems and turbulence problems. In computational fluid dynamics, the numerical solution of the equations has generally been achieved by the finite difference technique, the finite element method in the structural mechanics field and the finite volume method.
The particle method, smoothed particle hydrodynamics (SPH), is another method to solve Navier–Stokes equations. It is a mesh-free and particle method based on the Lagrangian approach. Every particle can be easily calculated independently, especially for fast moving objects with any shape. SPH was originally developed for astrophysics [32,33]. Later, Monaghan [34] first applied SPH to model surface flows and simulated dam breaking and wave breaking. The method has become more widely applied to solve computational fluid problems such as two-phase flows [35], weakly incompressible flows [36,37] and gravity flows [34]. The application of SPH in wave modeling is similar to the work of Lo and Shao [38]. The study combined a large eddy simulation (LES) approach with the SPH model to simulate solitary wave mechanics in the nearshore area. The SPH–LES model was used to simulate the wave interaction with the curtain wall [39]. The turbulence production and vortex motions near the structure were investigated. Khayyer et al. [40] found that the SPH model could accurately reproduce the water surface profile during wave breaking and post-breaking steps. Based on the Lagrangian approach and easily treating the wave breaking problem, Gómez-Gesteira et al. [41] explored wave overtopping on the decks of offshore platforms. Shao et al. [42] simulated the wave overtopping of coastal structures and proved that this model can predict the overtopping characteristics under different wave conditions. Didier and Neves [43] applied the SPH model to simulate wave overtopping phenomena on the Portuguese coast. Rao et al. [44] discussed the impact of overtopping flow on the leeward side of breakwaters. Pu and Shao [45] proposed a porous material for the SPH model and compared the wave overtopping load for different shapes of breakwaters. Altomare et al. [46] developed a three-dimensional grooved cubic block to investigate the effect of armor blocks on wave run-up height.
According to the fundamental property of the Dirac delta function, the partial differential equations of continuum fluid dynamics have to be transferred into the SPH form to approximate any function A(r) by
A ( r ) = Ω A ( r ) W ( r r , h ) d r
where h is the smoothing length or width of a kernel function W(rr′). The kernel function should generally satisfy the normalization, delta function and compactness conditions [47]. Thus, the gradient of A(r) can be expressed as
A ( r ) = Ω A r W r r , h d r
If the support domain of W(r) is inside the computational domain Ω, Equation (6) can be written as
A ( r ) = Ω A r W r r , h d r
For a fluid consisting of many particles in computational domain Ω, Equation (6) can be written as
A ( r a ) = b m b ρ b A r b W r r b , h
Hence, the continuity and momentum equations by the SPH approximation can be written as
d ρ a d t = b m b u a b a W a b
d u a d t = b m b P a ρ a 2 + P b ρ b 2 a W a b + g + b m b 4 υ r a b a W a b ρ a + ρ b r a b 2 v a b
where a denotes the critical particle and b denotes all other particles within the active kernel function radius of 2 h. uab is the velocity variation of the particle between the velocity ua of calculated particle a and that (ub) of other particles. Wab is the kernel function, and P is the fluid pressure. The laminar stress term simplifies, according to Lo and Shao [38], where υ is the kinetic viscosity of laminar flow, to rab = rarb. Capone et al. [48] proposed that the quintic kernel is the best compromise between accuracy and the cost of computation time. Hence, this kernel function has been adopted in the present model. According to Monaghan et al. [49], the force on each boundary particle is computed by summing the contribution from all the surrounding water particles. Denoting the force per unit mass on a moving body boundary particle k by fk, the equation is given by
f w p = M d V d t = k m k f k
where M is the mass of a rigid body, V is the velocity of the center of mass, the subscript wp indicates water particles and fwp is the force per unit mass exerted by water particles on the boundary particle. For a breakwater, the torque due to waves impacting the object must be considered.

3.3. Model Setup

A wave flume is simplified from the real water depth profile in front of the breakwater, which is the location of the CFW event without downscaling. From Figure 1, it is found that the study site is a bay-shaped coastal area that easily concentrates wave energy. Therefore, a large number of armor blocks stand in front of the breakwater to protect the structure. The size of the blocks is approximately 2 × 2 m with a weight of 15 tons. The water depth is 5.7 m at the toe of the breakwater but 20 m at 150 m offshore. The average slope of the seabed in front of the CFW location is approximately 1:9. Therefore the length of the computational domain is designed to be 360 m in length and 20 m in depth with a 1:9 seabed slope before the breakwater, as shown in Figure 4. The elevation of the breakwater is 3 m above the mean sea level. The left boundary is a piston-type wave maker. The seabed and right boundary are assumed to be impermeable boundaries. The fluid particle was initially set in a staggered grid with dimensions of dx = dz = 0.3 m, which led to 26,001 fluid particles and 2898 boundary particles. The smoothing length (h) is therefore 0.42 m. The particle per wavelength is between 600 to 2000 according to various simulation cases and is higher than 600 in Chen et al. [50], 500 in Gómez-Gesteira et al. [41] and 200~600 in Shao et al. [42] who ran simulations for wave–structure interactions or wave overtopping. In addition, the Courant number in this study is 0.005, which is very stable in the SPH simulation recommended by Shao and Lo [51]. The fixed dummy particle was used for the boundary. To reflect the real condition, armor blocks were randomly placed in front of the breakwater. Simulations with and without armor block installations were implemented. In this study, three parameters, the splash height (Hsplash), horizontal throw speed (ux) and vertical throw speed (uz), were estimated from the simulations. They were estimated averagely by the simulation results of all particles in the analysis zone as shown in Figure 4.

3.4. Model Validation and Convergence Analysis

The convergence, consistency and stability are important issues for numerical methods, including SPH. Vacondio et al. [52] showed they are one of Grand Challenges. A recent study [53] simulated the breaking waves and showed, in some cases, orders of magnitude improvement by halving the particle spacing. Akbari and Torabbeigi [54] presented a convergence study for SPH simulations on wave interactions with reshaped and non-reshaped berm breakwaters. Since the simulation is based on a real event, no experimental results can be used for validation or discussions. The dam-break flows according to Zhou et al.’s [55] experiment are used to validate the SPH model presented in this study as several researches did [56,57,58,59,60]. Figure 5 shows the simulations have good agreement with Zhou et al.’s [55] experimental results. In addition, Koshizuka et al.’s [61] experiment results are used for a validation and convergence study as Xu et al. [62] did. Figure 6 shows good agreements also with the experimental results. When the particle size is small enough (i.e., the particle number is large enough, for example, dx = 0.005 and 0.002 in Figure 6), the simulation results are close. These comparisons show the SPH model of this study works well and has convergent results. Table 1 shows the results of the convergence study of the CFW simulation by the presented SPH model. They were simulations of the conditions: wave height 4.5 m and period 12 s, i.e., the NTOU CFW scenario. The maximum splash height (Hsplash as shown in Figure 4), mean throw speed (ux) and the starting time of CFW occurrences (tini) were derived according to three particle sizes (dx = 0.5, 0.3 and 0.15 m). The results shows the biases are only 7.6% and 1.8% on max. Hsplash estimations when the particle sizes are twice larger or smaller, respectively. They are even less than 5% for throw speed estimations. For CFW occurrence time, they are almost the same for various particle sizes. These numbers show again the SPH model presented very convergent results.

4. Results and Discussion

4.1. Simulation Cases

The weakly compressible SPH numerical model was used to simulate the coastal freak waves that overtopped a vertical wall to compare the characteristics of overtopping flows under different wave conditions and the effect of armor blocks. The regular wave condition chosen for the simulation in this study represents a wave shape similar to a typhoon swell. The field measurements by the buoy show that the significant wave height was 4.5 m and the period was 12 s for the CFW event introduced in this study. The wave conditions for the simulation are therefore designed as in Table 2, which derives wave conditions with the same steepness. Eight cases that depend on wave conditions and armor block installation were simulated.
Bruce et al. [63] proposed the impulsive parameter to assess the overtopping types, and the definition is as follows
d * = d H 2 π D g T 2
where D is the water depth of the wave flume, d is the water depth at the toe of the breakwater, H is the wave height and T is the wave period. When waves are relatively small in relation to the water depth (i.e., lower wave steepness), a non-impulsive condition occurs (d* > 0.3). These waves run up and over the wall smoothly. However, impulsive conditions occur (d* < 0.2) when waves are larger because they may be shoaling up over the bathymetry or structure toe. These waves will break violently against the wall with very large forces. Overtopping discharge under these conditions is characterized by a powerful surging jet of water. The transition between conditions for which the overtopping response is dominated by breaking and nonbreaking waves lies from 0.2 to 0.3. The values of impulsive parameters for the eight simulation cases range from 0.04 to 0.76 and cover wide incident wave conditions.

4.2. Results without Armor Blocks Installation

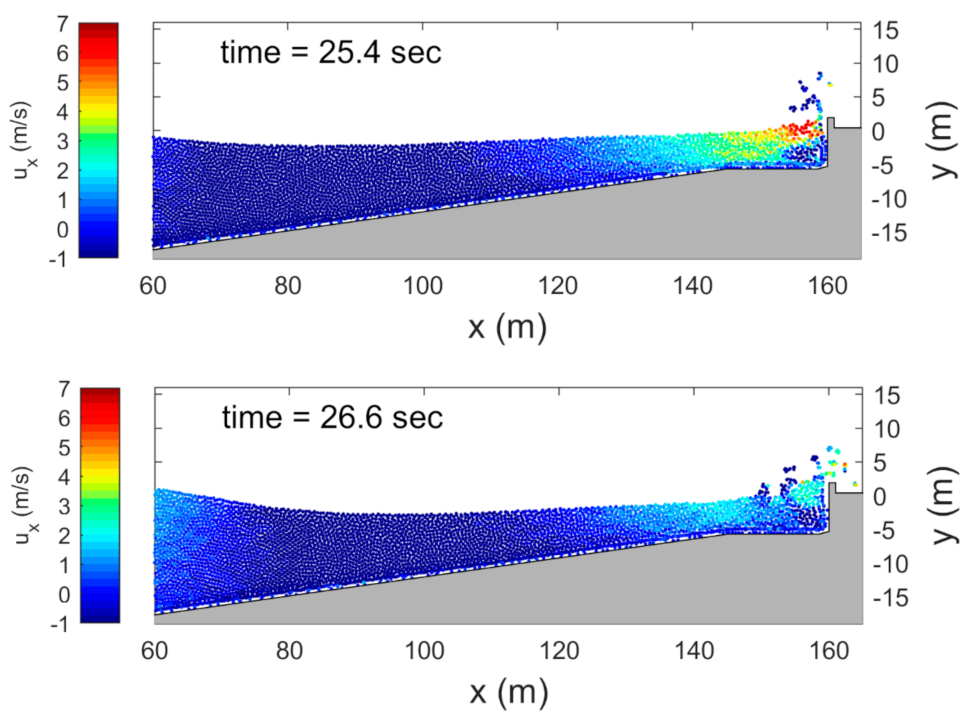
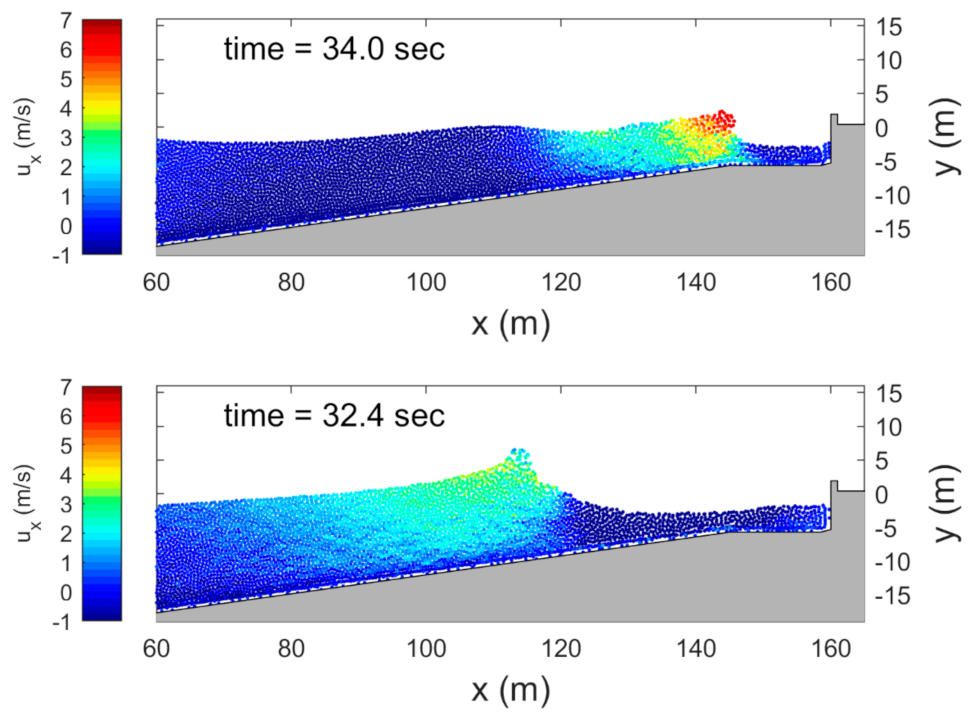
Snapshots of the simulation results for coastal freak waves without armor block installation (case nA3) are found in Figure 7, which shows the distribution of water particles under the process of wave overtopping. The color of each water particle represents the horizontal velocity. The wave shoaling effect occurred at 23 s. The wave front was too sharp to maintain the wave shape after propagating through the slope. The wave broke at 24.2 s and hit the breakwater at 25.4 s. The largest splash height of wave overtopping was 6.63 m above the breakwater elevation. Simulated results show that wave overtopping has been investigated in cases nA2, nA3 and nA4 (in impulsive conditions). Figure 8 shows the time series of the maximum splash height. In the case of nA2, overtopping was found at 24, 34 and 44 s. The maximum splash heights in each overtopping flow were 6.2, 3.9 and 5.8 m. The maximum splash height of the second overtopping flow decreased by 2.3 m compared with the first overtopping flow. This is because of the interaction with the reflected wave generated from the first incident wave. The second incident wave broke further than the first incident wave. However, in the nA3 case, the maximum splash height of the second overtopping flow reached 9.3 m, which was higher than that of the first overtopping flow. The effect of superposition was found due to the interaction between the incident wave and reflected wave. Figure 9 shows the different interaction results in different locations for cases nA2 and nA3. It was also found that the maximum splash heights of the first overtopping in cases nA2 and nA3 were similar. These results showed that the splash height was affected not only by the incident wave height but also by the interaction of the incident and reflective waves, especially depending on their phases. In this study, we focused on the overtopping flow occurring at the first incident wave, which is always an unexpected coastal freak wave.

4.3. Results with Armor Blocks Installation

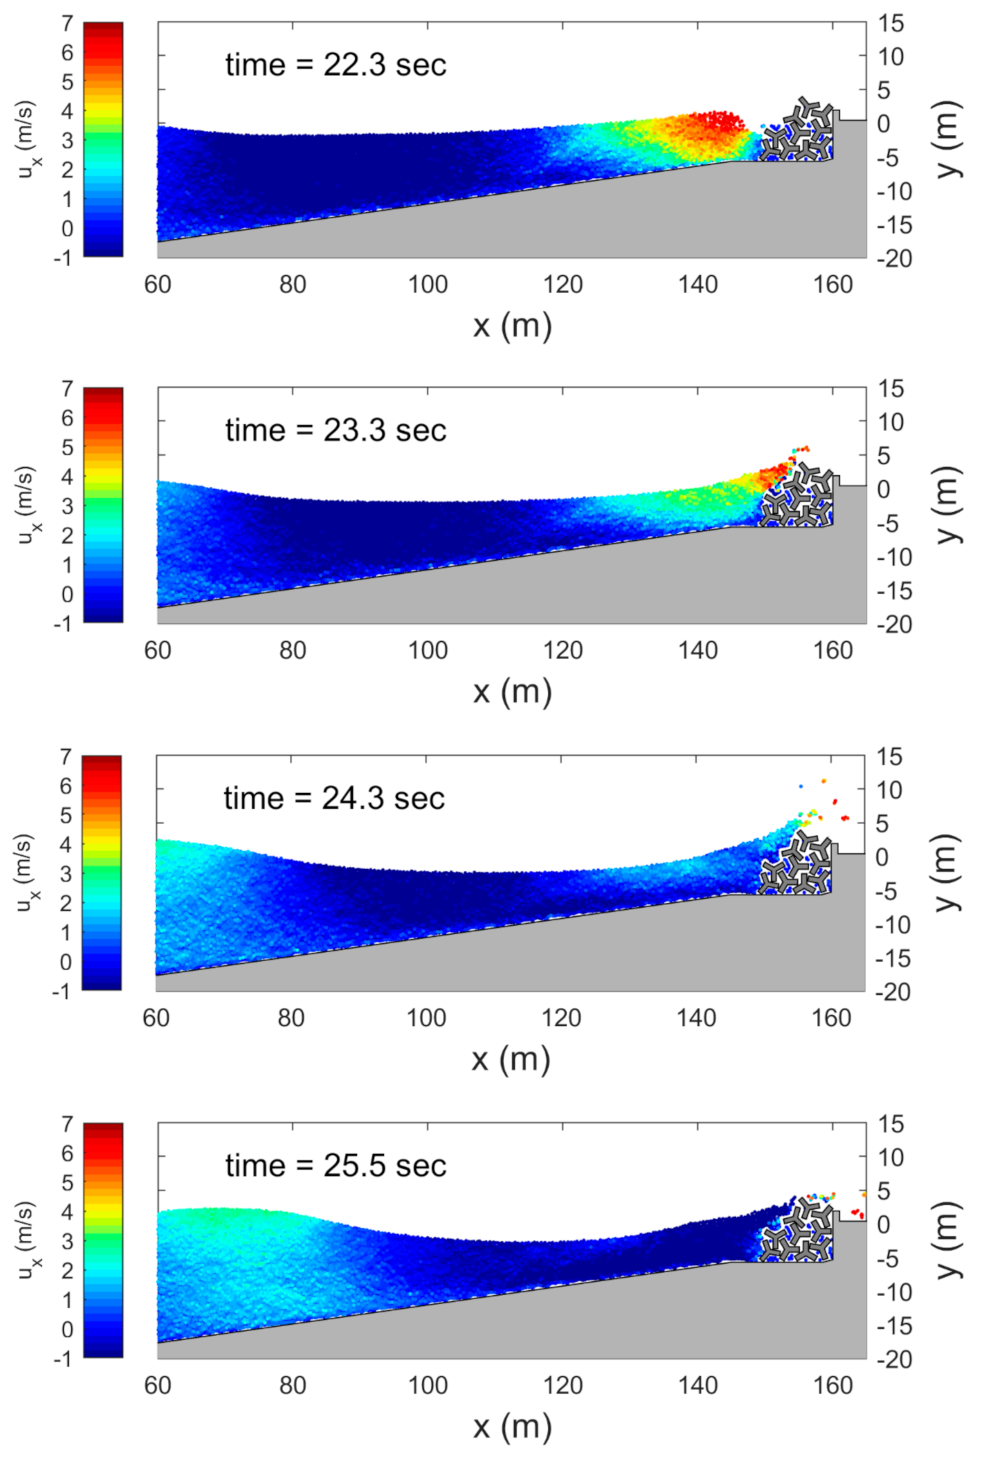
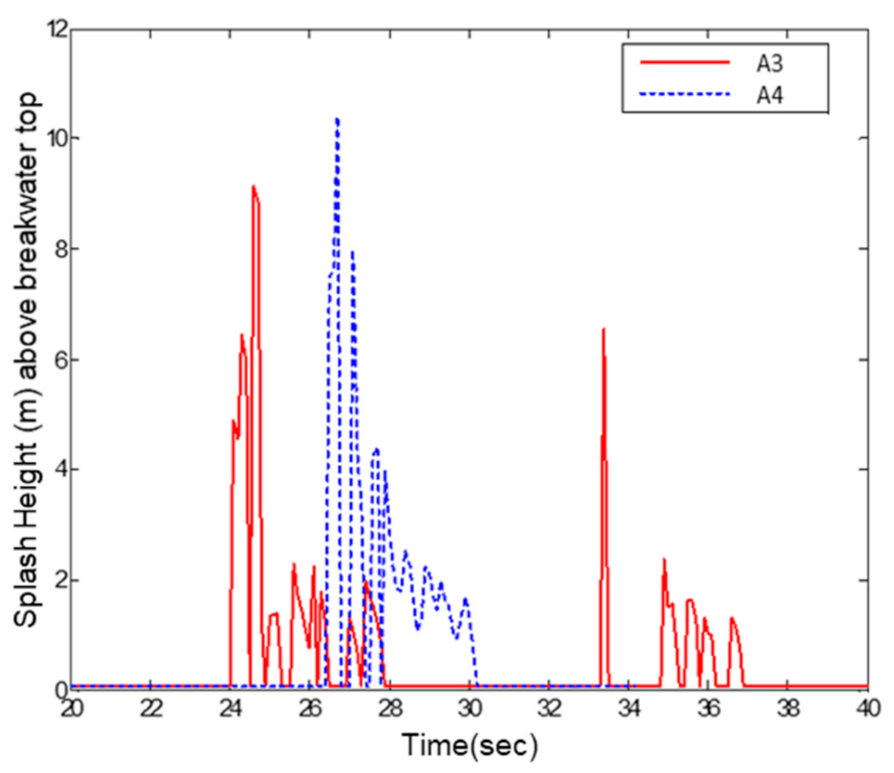
In this section, armor blocks were installed in front of the breakwater in the wave flume for coastal freak wave simulations. The overtopping flow was investigated in only cases A3 and A4. Snapshots of the simulation results for case A3 can be found in Figure 10, which shows the distribution of water particles under the process of wave overtopping. Compared with Figure 5, the discharge of overtopping flow was obviously less than that in case nA3 due to the armor block installation. The armor blocks change the overtopping flow pattern. The horizontal motion of water particles dominates the overtopping flow when armor blocks exist, for example, in case A3, which differs from the vertical motion of water particles in the cases without armor block installation, such as nA3. From the simulation, it is found that the mean horizontal throw speed is 4.3 m/s (case A3), which is more than five times that in case nA3. A larger horizontal throw speed in the splash increases the hazard of coastal freak waves. In case A3, overtopping was found at 24 and 33 s (Figure 11). The maximum splash heights in each overtopping flow were 6.2 and 5.8 m, respectively. The reflected wave was also found to affect the maximum splash height of overtopping flow, which reduced the splash height of the first overtopping flow by 31%. The simulation results show that the installation of armor blocks significantly influences the occurrence of hazardous coastal freak waves. Armor installation may not reduce the splash height; however, it increases the throw speed in the horizontal component.

4.4. Discussion

The simulated cases that investigated overtopping waves are listed in Table 3, including the splash height, throw speed and unit discharge of overtopping flow. The unit discharge (Q*) could be calculated during wave overtopping from the time (tF) of the first water particle flow passing through the breakwater (i.e., at x = 160 m cross section in Figure 4) to the time (tL) of the last water particle passing through the breakwater (i.e., at x = 161.5 m cross section in Figure 4). The formula can be written as
Q * = 1 t L t F t F t L n p a r t i c l e Δ x 2 d t
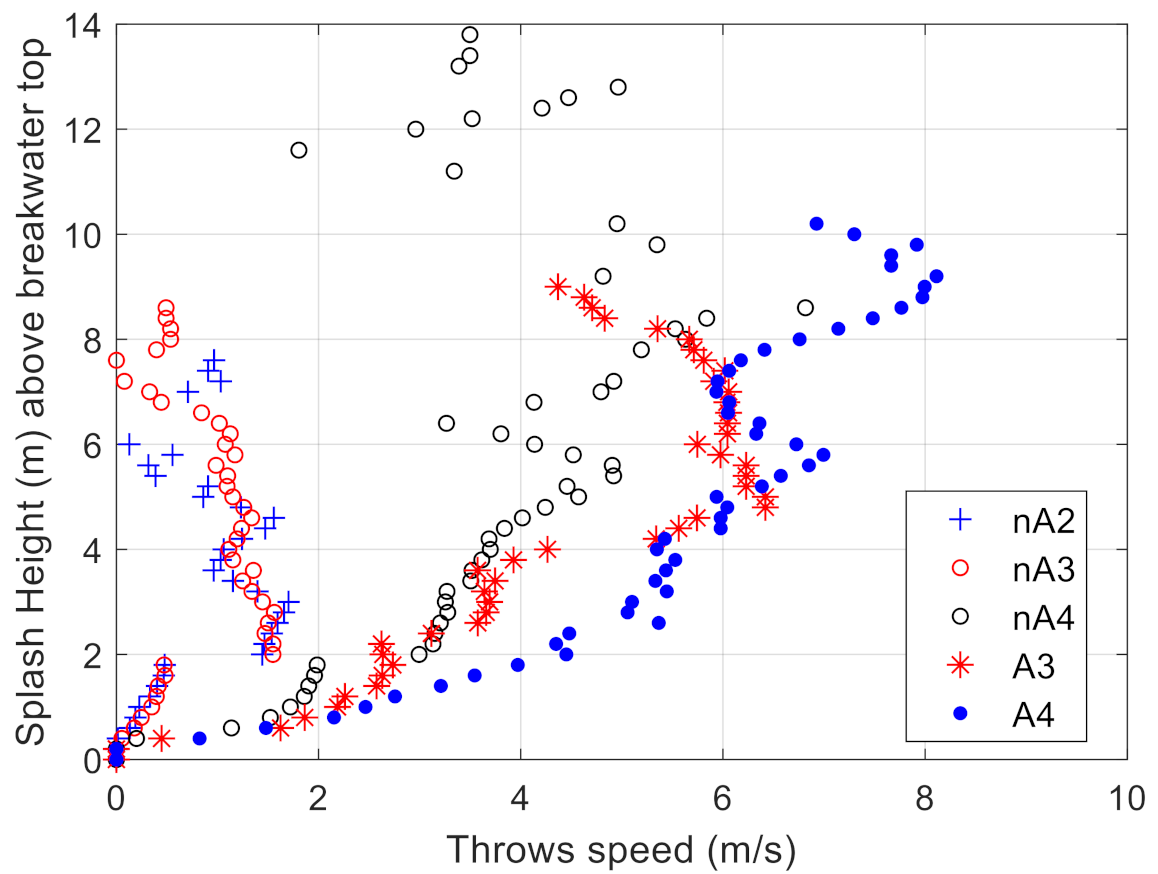
where nparticle is the number of water particles flowing through the breakwater and ∆x is the water particle size. The characteristics of the coastal freak waves that occurred with and without armor blocks were definitely different, especially in throw speed. In nA2 to nA4, the vertical throw speed was three to four times the horizontal throw speed. Under impulsive conditions, in case nA4, the discharge rate was also three to four times that of the non-impulsive conditions, in cases nA2 and nA3. The results show that coastal freak waves that are less dangerous occur in an environment with no armor block installation, especially under non-impulsive wave conditions. Under impulsive conditions, the hazard will be relatively insignificant because the horizontal throw speed of water is small, although the overtopping discharge is large. However, in cases A3 and A4, the horizontal throw speed was significantly larger than the vertical throw speed, which was up to 3.5 times, although the discharge rate decreased. Moreover, the horizontal throw speed in A4 (with armor block installation) was obviously larger than that in nA4 (both are in impulsive condition). The profile of horizontal throw speed versus height above the breakwater is shown in Figure 12. This shows that the maximum splash height of the coastal freak wave that appears on the breakwater did not strictly agree with the incident wave height. The effect of the armor block may change the direction of water particle movement from the vertical to horizontal direction. It is also shown that the discharge rate of overtopping flow decreased due to armor block installation.

5. Conclusions

A 2D SPH numerical model was developed to simulate the hydrodynamic properties of coastal freak waves. Coastal freak waves are splash waters that generally seem to be wave overtopping induced by wave–structure interactions. Coastal freak waves are not all dangerous for people if there is only a large amount of water. However, if the mass of water has its speed (in the horizontal direction in this study), this splash becomes hazardous. This study simulated the splash height and throw speed in the horizontal and vertical directions based on the wave conditions of a significant coastal freak wave event that occurred in northern Taiwan in 2014. Eight cases of combinations of various incident waves and armor block installation conditions were simulated. The impulsive parameter was also used to understand the overtopping conditions before the simulations. Coastal freak waves occur frequently in impulsive conditions because of their large steepness and stronger shoaling effect.
The simulation without armor block installation showed that the heights of coastal freak waves are more than twice the incident wave heights, as shown in Table 2 and Table 3. However, it is not only dependent on the incident wave height. The installation of armor blocks in front of the breakwater plays an important role in coastal freak wave occurrence. When armor blocks did not exist, the vertical throw speed of the coastal freak wave was three to four times the horizontal throw speed. However, the presence of armor blocks induced a smaller overtopping discharge rate and splash height and significantly increased the horizontal throw speed of the water of coastal freak waves. From the simulations in this study, it is found that the horizontal throw speed of coastal freak waves when armor blocks exist increases more than five times compared to when there are no armor blocks. It is assumed that coastal freak waves are hazardous when the horizontal throw speed is large enough to wash people away.
The simulations showed that the height of coastal freak waves was affected not only by the incident wave height but also by the interaction of the incident and reflective waves and the armor blocks. The occurrence of freak waves at the coast depends highly on the phase of the waves. In this study, we focused on the overtopping flow occurring at the first incident wave because it is always an unexpected coastal freak wave.

Author Contributions

Conceptualization, Y.-C.C. and D.-J.D.; formal analysis, Y.-C.C.; writing—original draft preparation, Y.-C.C.; writing—review and editing, D.-J.D. All authors have read and agreed to the published version of the manuscript.

Funding

This research was supported by the Central Weather Bureau (CWB) and the Ministry of Science and Technology (grant no. MOST 108-2923-E-006-007-MY4) of Taiwan.

Acknowledgments

This research was performed with joint support from the Central Weather Bureau (CWB) and the Ministry of Science and Technology (MOST) of Taiwan (grant no. MOST 108-2923-E-006-007-MY4). The authors express their gratitude for the above support.

Conflicts of Interest

The authors declare no conflict of interest.

References

  1. Kharif, C.; Pelinovsky, E. Physical mechanisms of the rogue wave phenomenon. Eur. J. Mech. B Fluids 2003, 22, 603–634. [Google Scholar] [CrossRef] [Green Version]
  2. Tamura, H.; Waseda, T.; Miyazawa, Y. Freakish sea state and swell-windsea coupling: Numerical study of the Suwa-Maru incident. Geophys. Res. Lett. 2009, 36, 36280. [Google Scholar] [CrossRef] [Green Version]
  3. Waseda, T.; Tamura, H.; Kinoshita, T. Freakish sea index and sea states during ship accidents. J. Mar. Sci. Technol. 2012, 17, 305–314. [Google Scholar] [CrossRef]
  4. Cavaleri, L.; Bertotti, L.; Torrisi, L.; Bitner-Gregersen, E.; Serio, M.; Onorato, M. Rogue waves in crossing seas: The Louis Majesty accident. J. Geophys. Res. Ocean. 2012, 117. [Google Scholar] [CrossRef]
  5. Toffoli, A.; Waseda, T.; Houtani, H.; Cavaleri, L.; Greaves, D.; Onorato, M. Rogue waves in opposing currents: An experimental study on deterministic and stochastic wave trains. J. Fluid Mech. 2015, 769, 277–297. [Google Scholar] [CrossRef] [Green Version]
  6. Mori, N.; Liu, P.C.; Yasuda, T. Analysis of freak wave measurements in the Sea of Japan. Ocean Eng. 2002, 29, 1399–1414. [Google Scholar] [CrossRef]
  7. Janssen, P.A. Nonlinear four-wave interactions and freak waves. J. Phys. Oceanogr. 2003, 33, 863–884. [Google Scholar] [CrossRef]
  8. Onorato, M.; Osborne, A.R.; Serio, M.; Bertone, S. Freak Waves in Random Oceanic Sea States. Phys. Rev. Lett. 2001, 86, 5831–5834. [Google Scholar] [CrossRef] [Green Version]
  9. Toffoli, A.; Gramstad, O.; Trulsen, K.; Monbaliu, J.; Bitner-Gregersen, E.; Onorato, M. Evolution of weakly nonlinear random directional waves: Laboratory experiments and numerical simulations. J. Fluid Mech. 2010, 664, 313–336. [Google Scholar] [CrossRef]
  10. Dysthe, K.; Krogstad, H.E.; Müller, P. Oceanic rogue waves. Annu. Rev. Fluid Mech. 2008, 40, 287–310. [Google Scholar] [CrossRef]
  11. Mori, N.; Onorato, M.; Janssen, P.A.E.M. On the Estimation of the Kurtosis in Directional Sea States for Freak Wave Forecasting. J. Phys. Oceanogr. 2011, 41, 1484–1497. [Google Scholar] [CrossRef] [Green Version]
  12. Sergeeva, A.; Slunyaev, A. Rogue waves, rogue events and extreme wave kinematics in spatio-temporal fields of simulated sea states. Nat. Hazards Earth Syst. Sci. 2013, 13, 1759–1771. [Google Scholar] [CrossRef] [Green Version]
  13. Slunyaev, A.V.; Pelinovsky, E. Role of Multiple Soliton Interactions in the Generation of Rogue Waves: The Modified Korteweg–de Vries Framework. Phys. Rev. Lett. 2016, 117, 214501. [Google Scholar] [CrossRef] [PubMed] [Green Version]
  14. Slunyaev, A. On the optimal focusing of solitons and breathers in long-wave models. Stud. Appl. Math. 2019, 142, 385–413. [Google Scholar] [CrossRef]
  15. Tsai, C.-H.; Su, M.-Y.; Huang, S.-J. Observations and conditions for occurrence of dangerous coastal waves. Ocean Eng. 2004, 31, 745–760. [Google Scholar] [CrossRef]
  16. Kharif, C.; Pelinovsky, E.; Slunyaev, A. Rogue Waves in the Ocean; Springer Science & Business Media: Berlin/Heidelberg, Germany, 2009. [Google Scholar]
  17. Didenkulova, I.; Anderson, C.J. Freak waves of different types in the coastal zone of the Baltic Sea. Nat. Hazards Earth Syst. Sci. 2010, 10, 2021–2029. [Google Scholar] [CrossRef] [Green Version]
  18. Nikolkina, I.; Didenkulova, I. Rogue waves in 2006–2010. Nat. Hazards Earth Syst. Sci. 2011, 11, 2913–2924. [Google Scholar] [CrossRef]
  19. Nikolkina, I.; Didenkulova, I. Catalogue of rogue waves reported in media in 2006–2010. Nat. Hazards 2012, 61, 989–1006. [Google Scholar] [CrossRef]
  20. Didenkulova, E. Catalogue of rogue waves occurred in the World Ocean from 2011 to 2018 reported by mass media sources. Ocean Coast. Manag. 2020, 188, 105076. [Google Scholar] [CrossRef]
  21. Doong, D.J.; Peng, J.P.; Chen, Y.C. Development of a warning model for coastal freak wave occurrences using an artificial neural network. Ocean. Eng. 2018, 169, 270–280. [Google Scholar] [CrossRef]
  22. Doong, D.J.; Chen, S.T.; Chen, Y.C.; Tsai, C.H. Operational probabilistic forecasting of coastal freak waves by using an artificial neural network. J. Mar. Sci. Eng. 2020, 8, 165. [Google Scholar] [CrossRef] [Green Version]
  23. Slunyaev, A.; Didenkulova, I.; Pelinovsky, E. Rogue waters. Contemp. Phys. 2011, 52, 571–590. [Google Scholar] [CrossRef]
  24. Goda, Y. Derivation of unified wave overtopping formulas for seawalls with smooth, impermeable surfaces based on selected CLASH datasets. Coast. Eng. 2009, 56, 385–399. [Google Scholar] [CrossRef]
  25. Van der Meer, J.W.; Allsop, N.W.H.; Bruce, T.; De Rouck, J.; Kortenhaus, A.; Pullen, T.; Schüt-trumpf, H.; Troch, P.; Zanuttigh, B. EurOtop, Manual on Wave Overtopping of Sea Defences and Related Structures. An Overtopping Manual Largely Based on European Research, but for Worldwide Application, 2nd ed. 2018. Available online: www.overtopping-manual.com (accessed on 3 January 2022).
  26. Takahashi, T.; Imamura, F.; Shuto, N. Research on flows and bathymetry variations by tsunami: The Case of Kesennuma Bay, Japan, due to the 1960 Chilean Tsunami. Tsunami Eng. Tech. Rep. 1992, 9, 185–201. [Google Scholar]
  27. Bruce, T.; Pearson, J.; Allsop, W.; Smith, J.M. Hazards at coast and harbour seawalls—Velocities and trajectories of violent overtopping jets. In Proceedings of the 28th International Conference on Coastal Engineering, Cardiff, Wales, 7–12 July 2003. [Google Scholar] [CrossRef]
  28. Peng, Z.; Zou, Q.-P. Spatial distribution of wave overtopping water behind coastal structures. Coast. Eng. 2011, 58, 489–498. [Google Scholar] [CrossRef]
  29. Quang, T.T.; Van, T.N. Numerical study of wave overtopping on sea-dikes with crown-walls. J. Hydro-Environ. Res. 2014, 8, 367–382. [Google Scholar] [CrossRef]
  30. Didier, E.; Neves, D.R.C.B.; Martins, R.; Neves, M.G. Wave interaction with a vertical wall: SPH numerical and experimental modeling. Ocean. Eng. 2014, 88, 330–341. [Google Scholar]
  31. Monaghan, J.J.; Cas, R.A.; Kos, A.M.; Hallworth, M. Gravity currents descending a ramp in a stratified tank. J. Fluid Mech. 1999, 379, 39–69. [Google Scholar] [CrossRef]
  32. Gingold, R.A.; Monaghan, J.J. Smoothed particle hydrodynamics: Theory and application to non-spherical stars. Mon. Not. R. Astron. Soc. 1977, 181, 375–389. [Google Scholar] [CrossRef]
  33. Lucy, L.B. A numerical approach to the testing of the fission hypothesis. Astron. J. 1977, 82, 1013–1024. [Google Scholar] [CrossRef]
  34. Monaghan, J. Simulating Free Surface Flows with SPH. J. Comput. Phys. 1994, 110, 399–406. [Google Scholar] [CrossRef]
  35. Monaghan, J.; Kocharyan, A. SPH simulation of multi-phase flow. Comput. Phys. Commun. 1995, 87, 225–235. [Google Scholar] [CrossRef]
  36. Morris, J.P.; Fox, P.J.; Zhu, Y. Modeling Low Reynolds Number Incompressible Flows Using SPH. J. Comput. Phys. 1997, 136, 214–226. [Google Scholar] [CrossRef]
  37. Morris, J.; Monaghan, J. A Switch to Reduce SPH Viscosity. J. Comput. Phys. 1997, 136, 41–50. [Google Scholar] [CrossRef]
  38. Lo, E.; Shao, S. Simulation of near-shore solitary wave mechanics by an incompressible SPH method. Appl. Ocean Res. 2002, 24, 275–286. [Google Scholar] [CrossRef]
  39. Gotoh, H.; Shao, S.; Memita, T. SPH-LES Model for Numerical Investigation of Wave Interaction with Partially Immersed Breakwater. Coast. Eng. J. 2004, 46, 39–63. [Google Scholar] [CrossRef]
  40. Khayyer, A.; Gotoh, H.; Shao, S. Corrected Incompressible SPH method for accurate water-surface tracking in breaking waves. Coast. Eng. 2008, 55, 236–250. [Google Scholar] [CrossRef] [Green Version]
  41. Gomez-Gesteira, M.; Cerqueiro, D.; Crespo, A.J.C.; Dalrymple, R. Green water overtopping analyzed with a SPH model. Ocean Eng. 2005, 32, 223–238. [Google Scholar] [CrossRef]
  42. Shao, S.; Ji, C.; Graham, D.I.; Reeve, D.E.; James, P.W.; Chadwick, A.J. Simulation of wave overtop-ping by an incompressible SPH model. Coast. Eng. 2006, 53, 723–735. [Google Scholar] [CrossRef]
  43. Didier, E.; Neves, M.G. Wave overtopping of a typical coastal structure of the Portuguese coast using a SPH model. J. Coast. Res. 2009, 1, 496–500. [Google Scholar]
  44. Rao, X.; Li, L.; Amini, F.; Tang, H. Numerical study of combined wave and surge overtopping over RCC strengthened levee systems using the smoothed particle hydrodynamics method. Ocean Eng. 2012, 54, 101–109. [Google Scholar] [CrossRef]
  45. Pu, J.H.; Shao, S. Smoothed Particle Hydrodynamics Simulation of Wave Overtopping Characteristics for Different Coastal Structures. Sci. World J. 2012, 2012, 163613. [Google Scholar] [CrossRef] [PubMed] [Green Version]
  46. Altomare, C.; Crespo, A.J.; Rogers, B.D.; Domínguez, J.M.; Gironella, X.; Gómez-Gesteira, M. Numerical modelling of armor block sea breakwater with smoothed particle hydrodynamics. Comput. Struct. 2014, 130, 34–45. [Google Scholar] [CrossRef]
  47. Liu, G.R.; Liu, M.B. Smoothed Particle Hydrodynamics—A Meshfree Particle Method; World Scientific Pub. Co. Pte Lt: Singapore, 2003. [Google Scholar]
  48. Capone, T.; Panizzo, A.; Cecioni, C.; Darlymple, R.A. Accuracy and stability of numerical schemes in SPH. In Proceedings of the 2nd International Workshop on Smoothed Particle Hydrodynamics rEsearch and engineeRing International Community (SPHERIC), Newark, NJ, USA, 8–11 June 2007; pp. 156–160. [Google Scholar]
  49. Monaghan, J.J.; Kos, A.; Issa, N. Fluid Motion Generated by Impact. J. Waterw. Port Coastal Ocean Eng. 2003, 129, 250–259. [Google Scholar] [CrossRef]
  50. Chen, D.-W.; Tzang, S.-Y.; Hsieh, C.-M.; Hwang, R.R.-J.; Zeng, N.-Y. A Case Study on Typhoon Wave-induced Hydrodynamic Behaviors Leading to Seawall Damages with the SPH Method. Procedia Eng. 2014, 79, 119–124. [Google Scholar] [CrossRef] [Green Version]
  51. Shao, S.; Lo, E. Incompressible SPH method for simulating Newtonian and non-Newtonian flows with a free surface. Adv. Water Resour. 2003, 26, 787–800. [Google Scholar] [CrossRef]
  52. Vacondio, R.; Altomare, C.; De Leffe, M.; Hu, X.; Le Touze, D.; Lind, S.; Marongiu, J.C.; Marrone, S.; Rogers, B.D.; Souto-Iglesias, A. Grand challenges for Smoothed Particle Hydrodynamics numerical schemes. Comp. Part. Mech. 2021, 8, 575–588. [Google Scholar] [CrossRef]
  53. Draycott, S.; Li, Y.; Stansby, P.; Adcock, T.; Bremer, T.V.D. Harmonic-induced wave breaking due to abrupt depth transitions: An experimental and numerical study. Coast. Eng. 2022, 171, 104041. [Google Scholar] [CrossRef]
  54. Akbari, H.; Torabbeigi, M. SPH modeling of wave interaction with reshaped and non-reshaped berm breakwaters with permeable layers. Appl. Ocean Res. 2021, 112, 102714. [Google Scholar] [CrossRef]
  55. Zhou, Z.Q.; De Kat, J.O.; Buchner, B. A nonlinear 3D approach to simulate green water dynamics on deck. In Proceedings of the seventh international conference on numerical ship hydrodynamics, Nantes, France, 19–22 July 1999; pp. 1–15. [Google Scholar]
  56. Colagrossi, A.; Landrini, M. Numerical simulation of interfacial flows by smoothed particle hydro-dynamics. J. Comput. Phys. 2003, 191, 448–475. [Google Scholar] [CrossRef]
  57. Abdolmaleki, K.; Thiagarajan, K.P.; Morris-Thomas, M.T. Simulation of the dam break problem and impact flows using a Navier-Stokes solver. Simulation 2004, 13, 17. [Google Scholar]
  58. Ferrari, A.; Dumbser, M.; Toro, E.F.; Armanini, A. A new 3D parallel SPH scheme for free surface flows. Comput. Fluids 2009, 38, 1203–1217. [Google Scholar] [CrossRef]
  59. Farzin, S.; Fatehi, R.; Hassanzadeh, Y. Position explicit and iterative implicit consistent incompressible SPH methods for free surface flow. Comput. Fluids 2019, 179, 52–66. [Google Scholar] [CrossRef]
  60. Yilmaz, A.; Kocaman, S.; Demirci, M. Numerical modeling of the dam-break wave impact on elastic sluice gate: A new benchmark case for hydroelasticity problems. Ocean Eng. 2021, 231, 108870. [Google Scholar] [CrossRef]
  61. Koshizuka, S.; Tamako, H.; Oka, Y. A particle method for incompressible viscous flow with fluid fragmentation. Comput. Fluid Dynam. 1995, 4, 29–46. [Google Scholar]
  62. Xu, X.; Jiang, Y.L.; Yu, P. SPH simulations of 3D dam-break flow against various forms of the obstacle: Toward an optimal design. Ocean Eng. 2021, 229, 108978. [Google Scholar] [CrossRef]
  63. Bruce, T.; van der Meer, J.; Franco, L.; Pearson, J. Overtopping performance of different armour units for rubble mound breakwaters. Coast. Eng. 2009, 56, 166–179. [Google Scholar] [CrossRef]
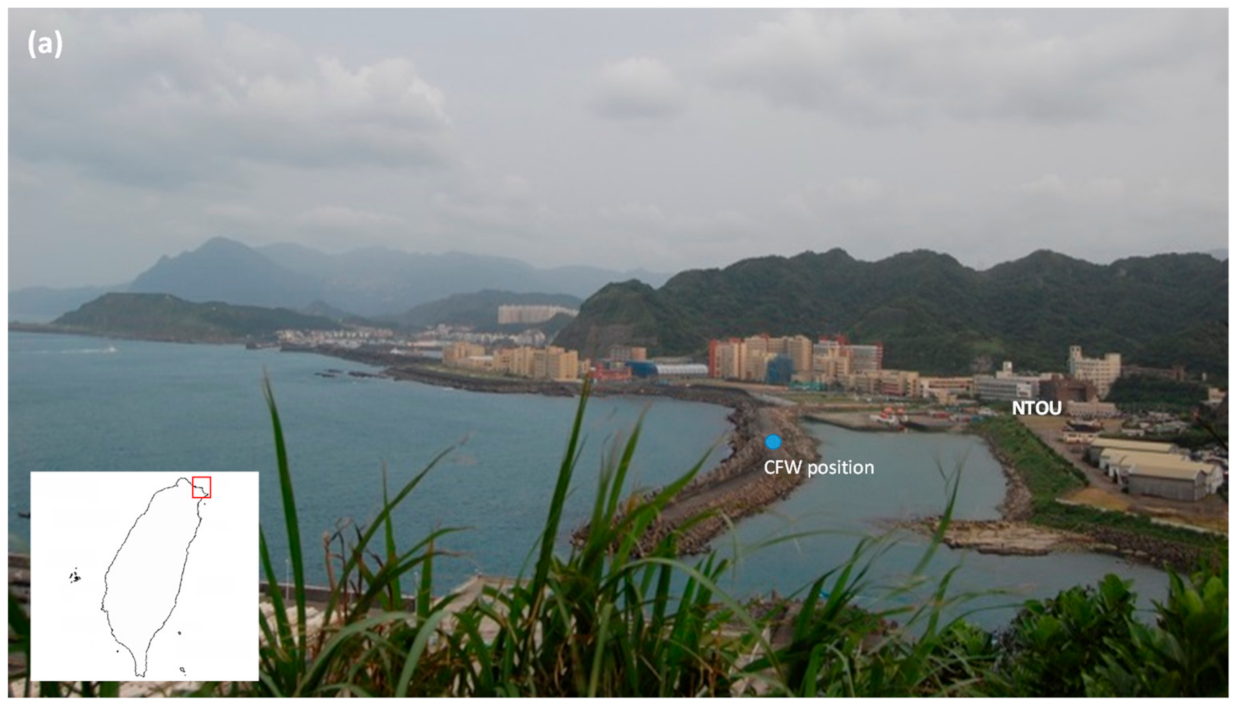
Figure 1. (a) Location of the coastal freak wave (CFW) occurrence in northern Taiwan; (b) Snapshot of the CFW accident. The scooter rider (white circle) was hit by the CFW and swept into the sea.
Jmse 10 00323 g001aJmse 10 00323 g001b
Figure 2. Track of Typhoon Vongfong. The red point is the position of the typhoon when the CFW occurred. Vmax is the maximum wind speed near typhoon center.
Jmse 10 00323 g002
Figure 3. Bathymetry of the CFW occurrence sea area and the wave buoy location.
Jmse 10 00323 g003
Figure 4. Layout of the model setup and the definition of overtopping parameters.
Jmse 10 00323 g004
Figure 5. Time series of the pressure at point (3.22 m, 0.16 m) in Zhou et al.’s [55] numerical tank. The red solid line is the SPH simulation result of this study. The circles are experimental results from Zhou et al. [55].
Jmse 10 00323 g005
Figure 6. Validation and convergence studies of the presented SPH model. (a) is the snapshot of the flow–structure interaction from the experiment implemented by [61]. The image was reproduced from [62] which is similar to the CFW condition in this study; (bd) are the SPH simulations of this study at 3 s after dam breaking; dx is the particle size and P is the particle number.
Jmse 10 00323 g006
Figure 7. Simulation results without armor blocks (case nA3; H = 4.5 m, T = 12 s).
Jmse 10 00323 g007aJmse 10 00323 g007b
Figure 8. Time series of the splash heights triggered by CFW when armor blocks are not installed (cases nA2, nA3 and nA4).
Jmse 10 00323 g008
Figure 9. Simulation results of the interaction of incident and reflective waves for cases nA2 (upper panel) and nA3 (lower panel). They show different types of interactions at different locations.
Jmse 10 00323 g009
Figure 10. Simulation results with armor blocks (case A3; H = 4.5 m, T = 12 s).
Jmse 10 00323 g010
Figure 11. Time series of the splash height triggered by the CFW when armor blocks are installed (cases A3 and A4).
Jmse 10 00323 g011
Figure 12. Profile of the average horizontal throw speed above the breakwater.
Jmse 10 00323 g012
Table 1. Results of the convergence study for SPH simulation by presented SPH model.
Particle Sizedx = 0.5 mdx = 0.3 mdx = 0.15 m
Particle number10,15626,001104,004
max. Hsplash (m)7.116.616.49
mean throw speed (m/s)0.770.810.84
tini (s)25.125.225.2
Table 2. List of simulation cases and corresponding conditions.
CaseWave Height
(m)
Wave Period
(s)
Impulsive Parameter (d*)Armor Block
Installation
nA11.580.76N
nA23.0100.24N
nA34.5120.11N
nA46.8150.04N
A11.580.76Y
A23.0100.24Y
A34.5120.11Y
A46.8150.04Y
Table 3. Simulation results: max splash height and average throw speed.
CaseMax Splash Height
(m)
Average Vertical Throw Speed (uz)
(m/s)
Average Horizontal Throw Speed (ux)
(m/s)
Discharge Rate
(m2/s)
nA26.632.570.749.3 × 10−2
nA36.613.670.811.5 × 10−1
nA414.1211.073.575.1 × 10−1
A39.141.214.301.0 × 10−1
A410.41.615.482.7 × 10−1
Publisher’s Note: MDPI stays neutral with regard to jurisdictional claims in published maps and institutional affiliations.