
Experimental Evaluation of Shear Properties of Lightweight PVC Core for Marine Application Using Digital Image Correlation System


Abstract
:1. Introduction
2. Experimental Research
2.1. Material and Specimen Geometry
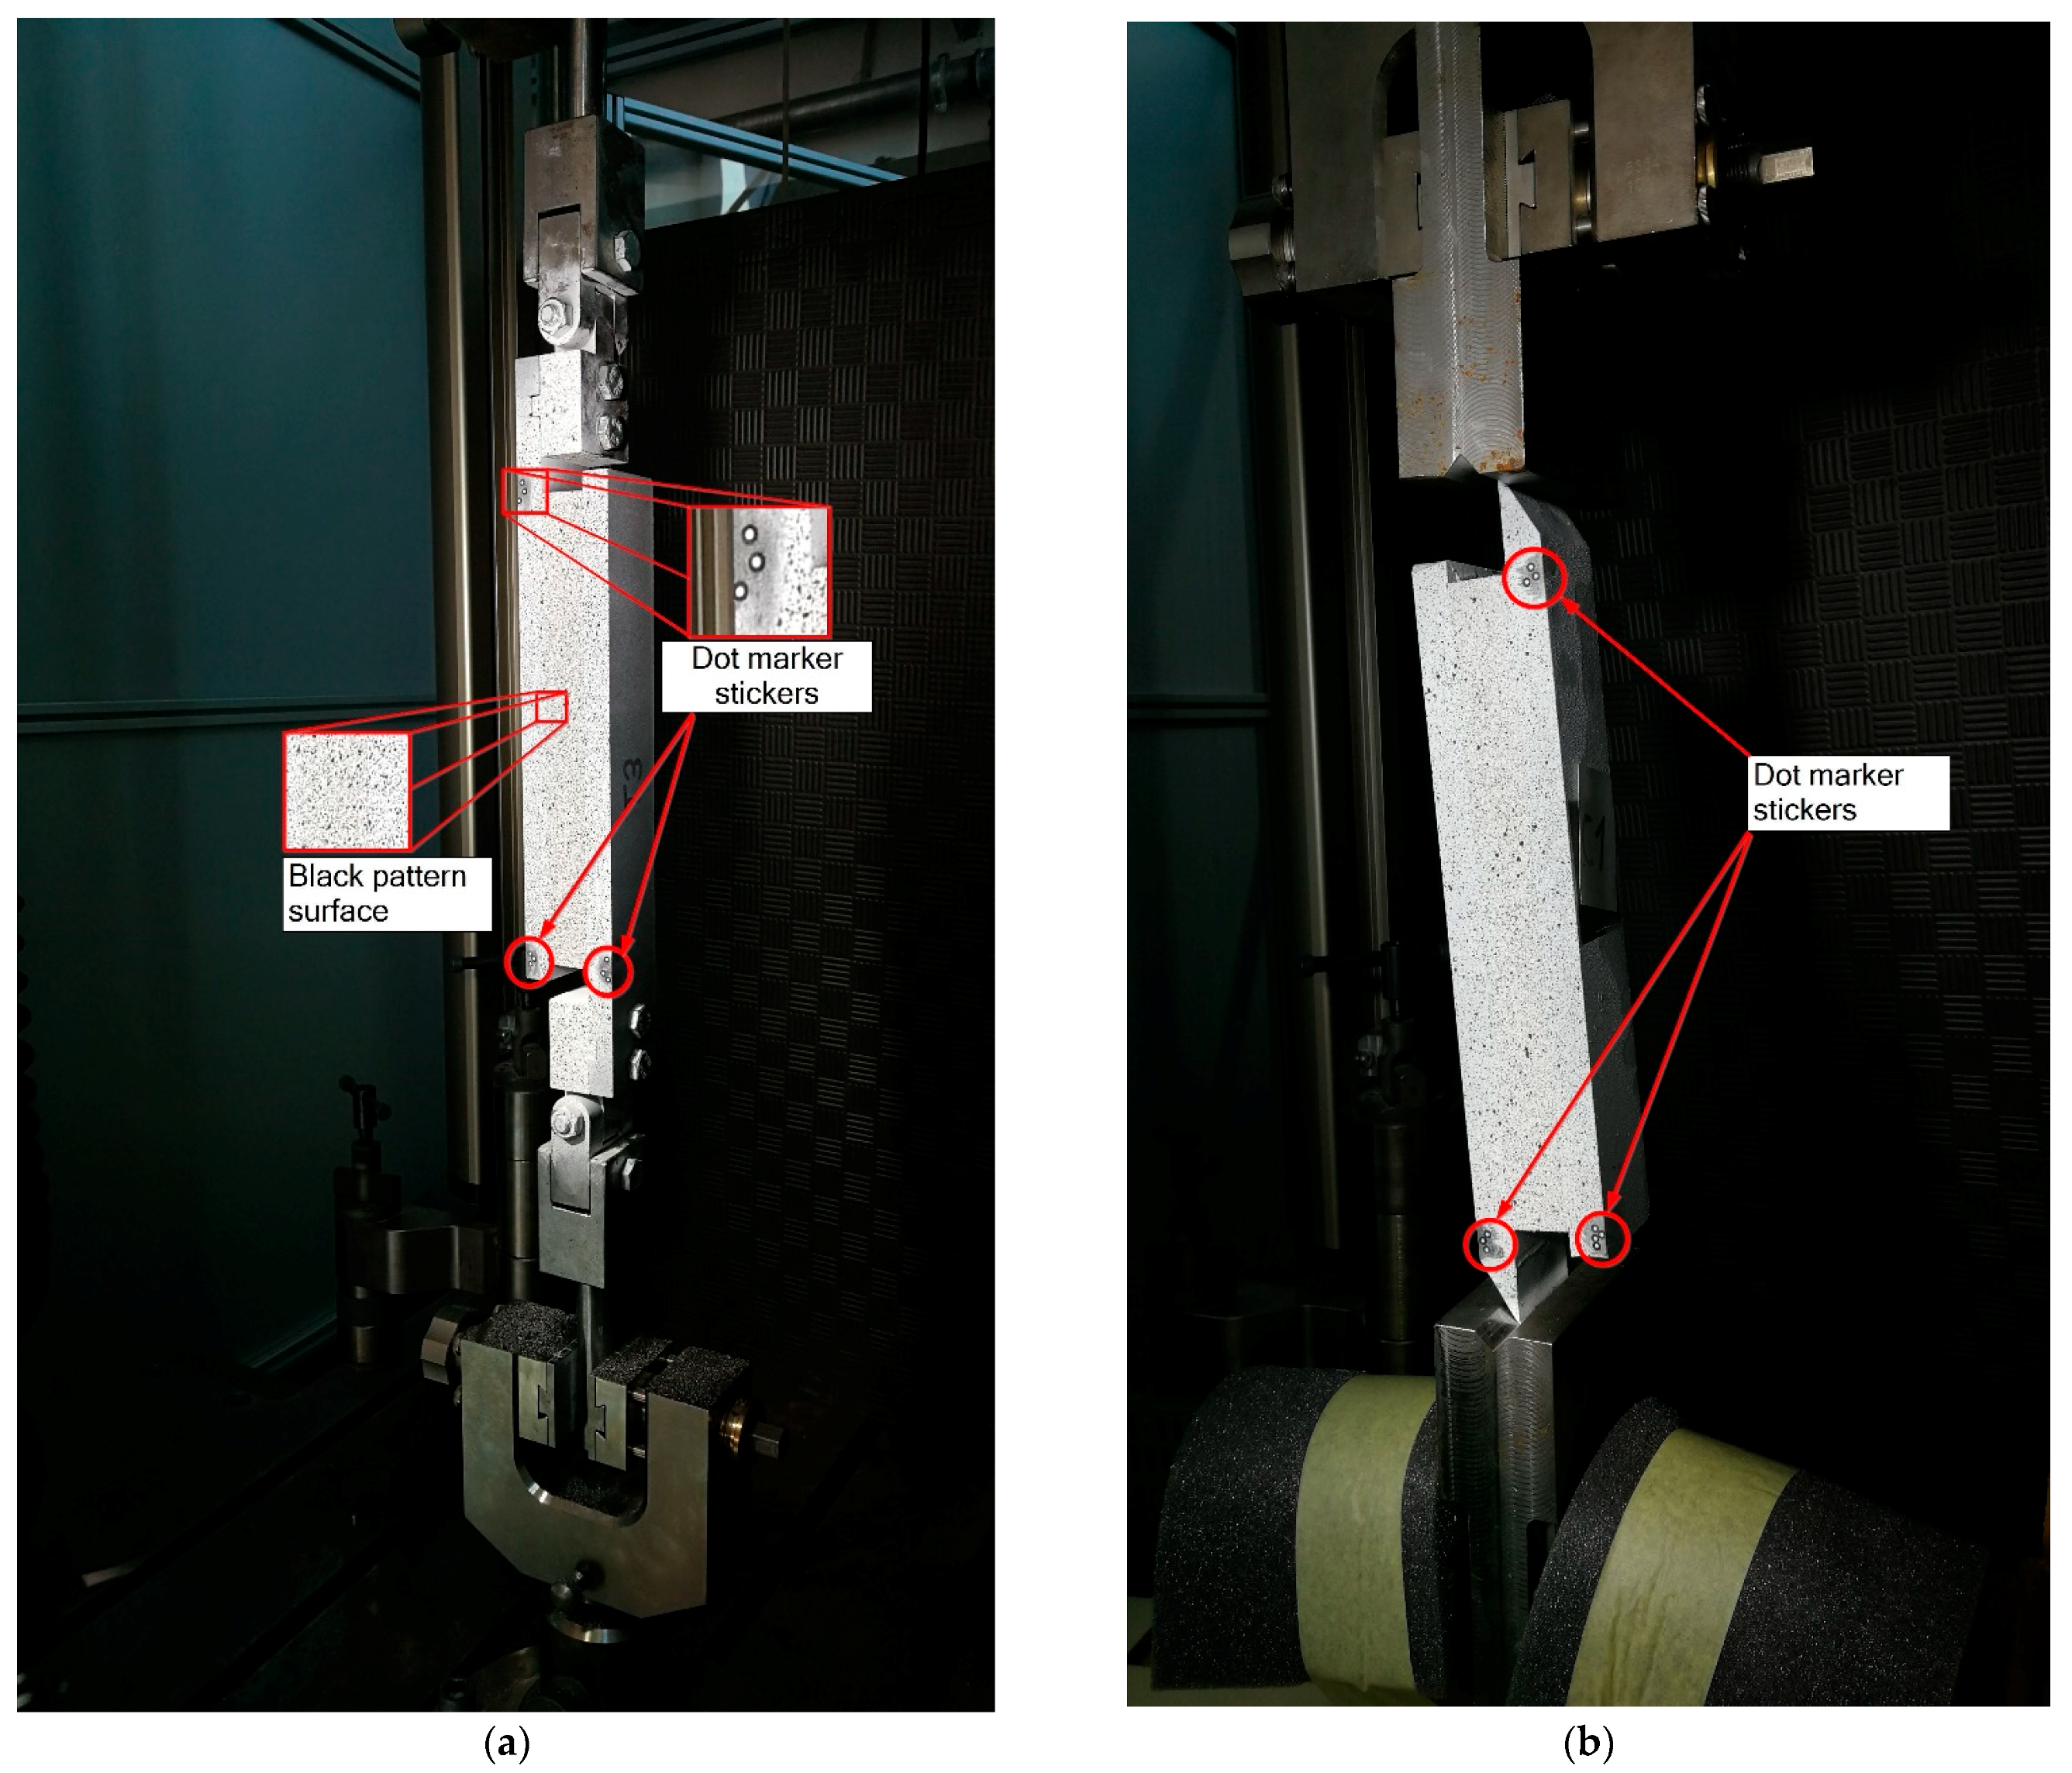
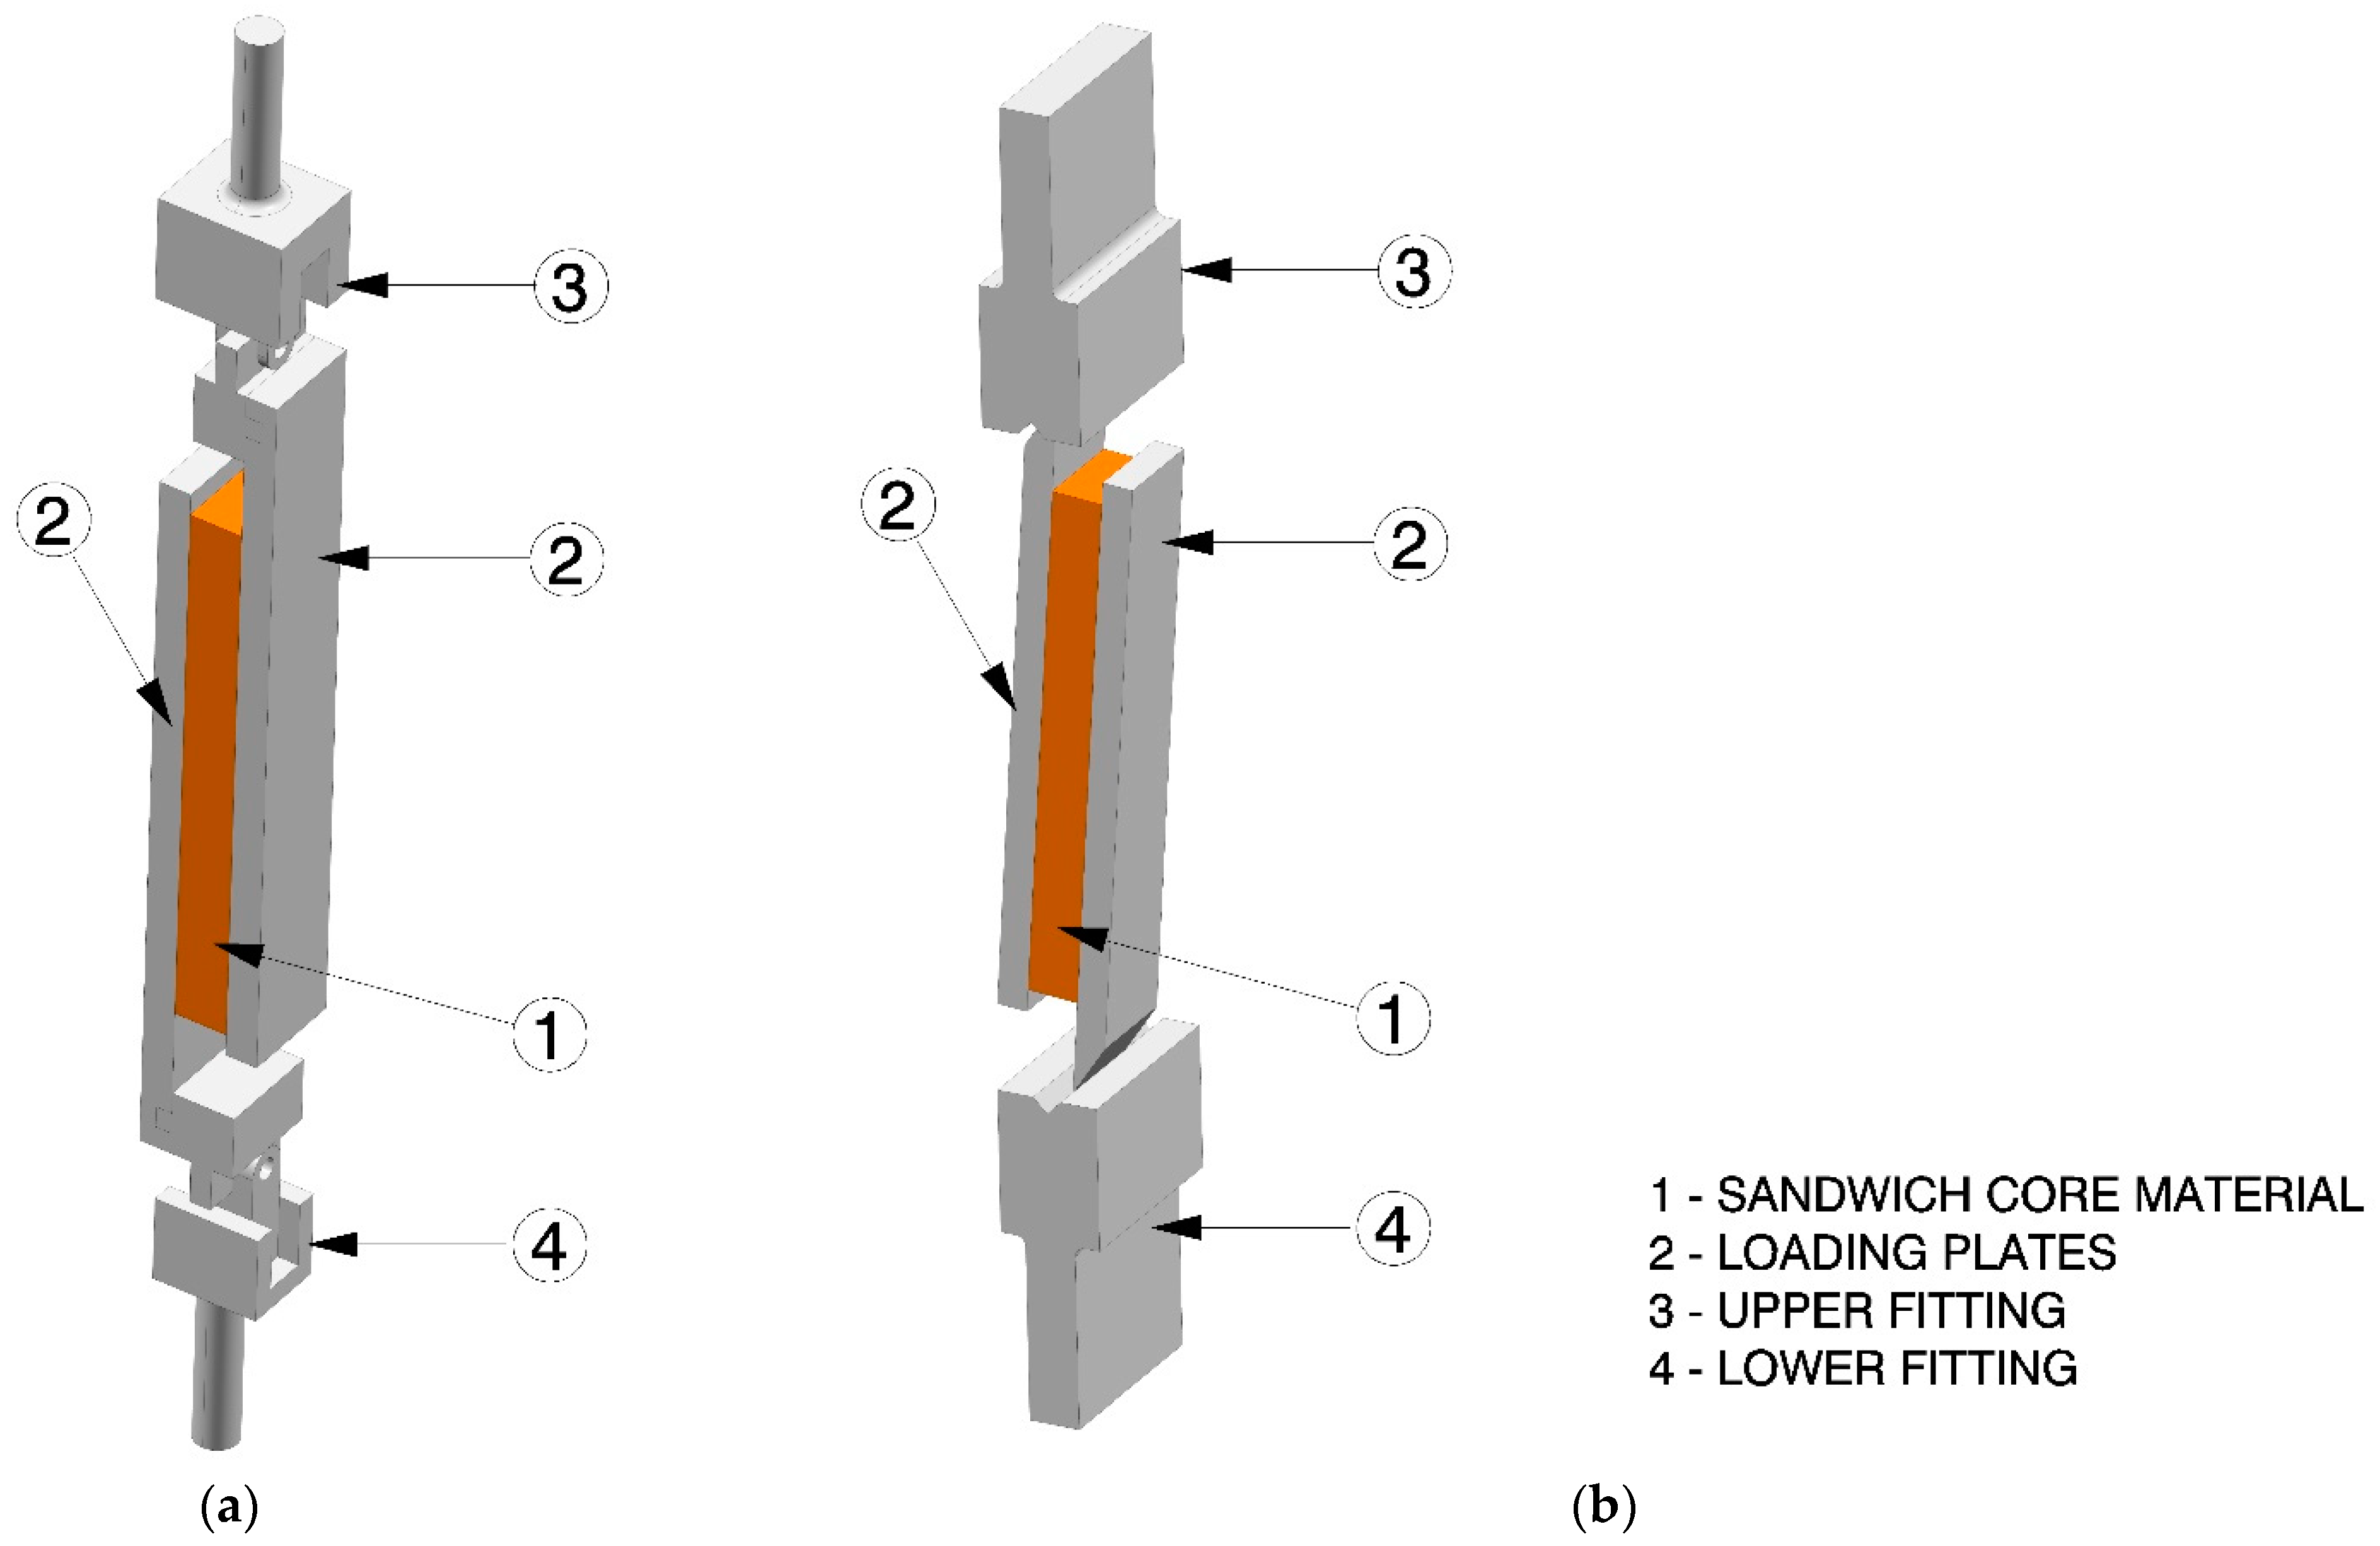
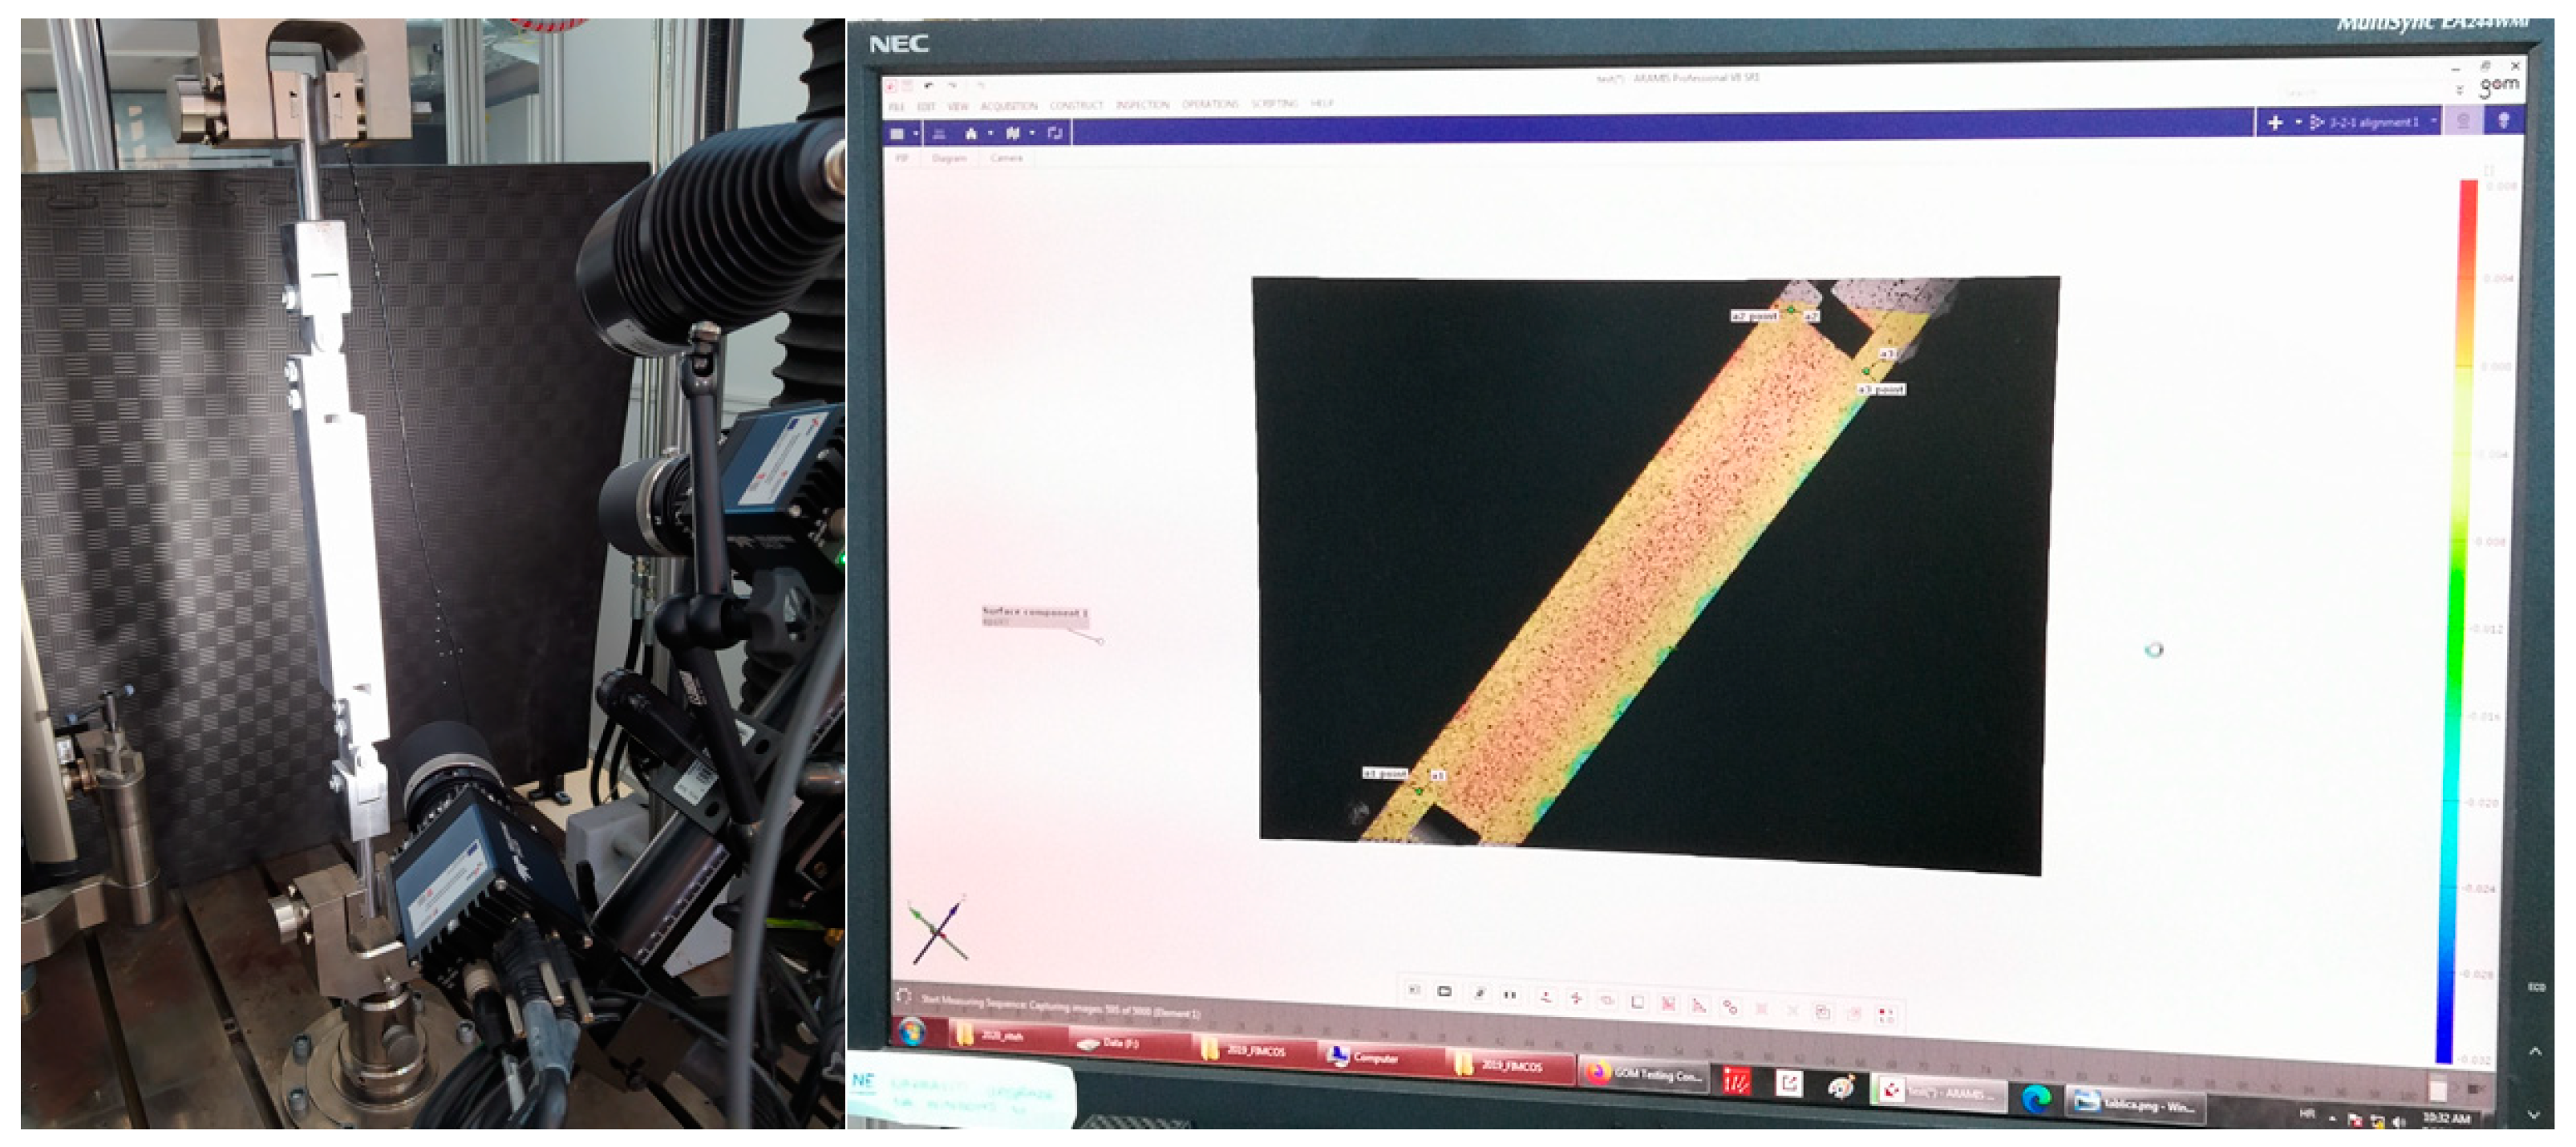
2.2. Test Set-Up and Equipment
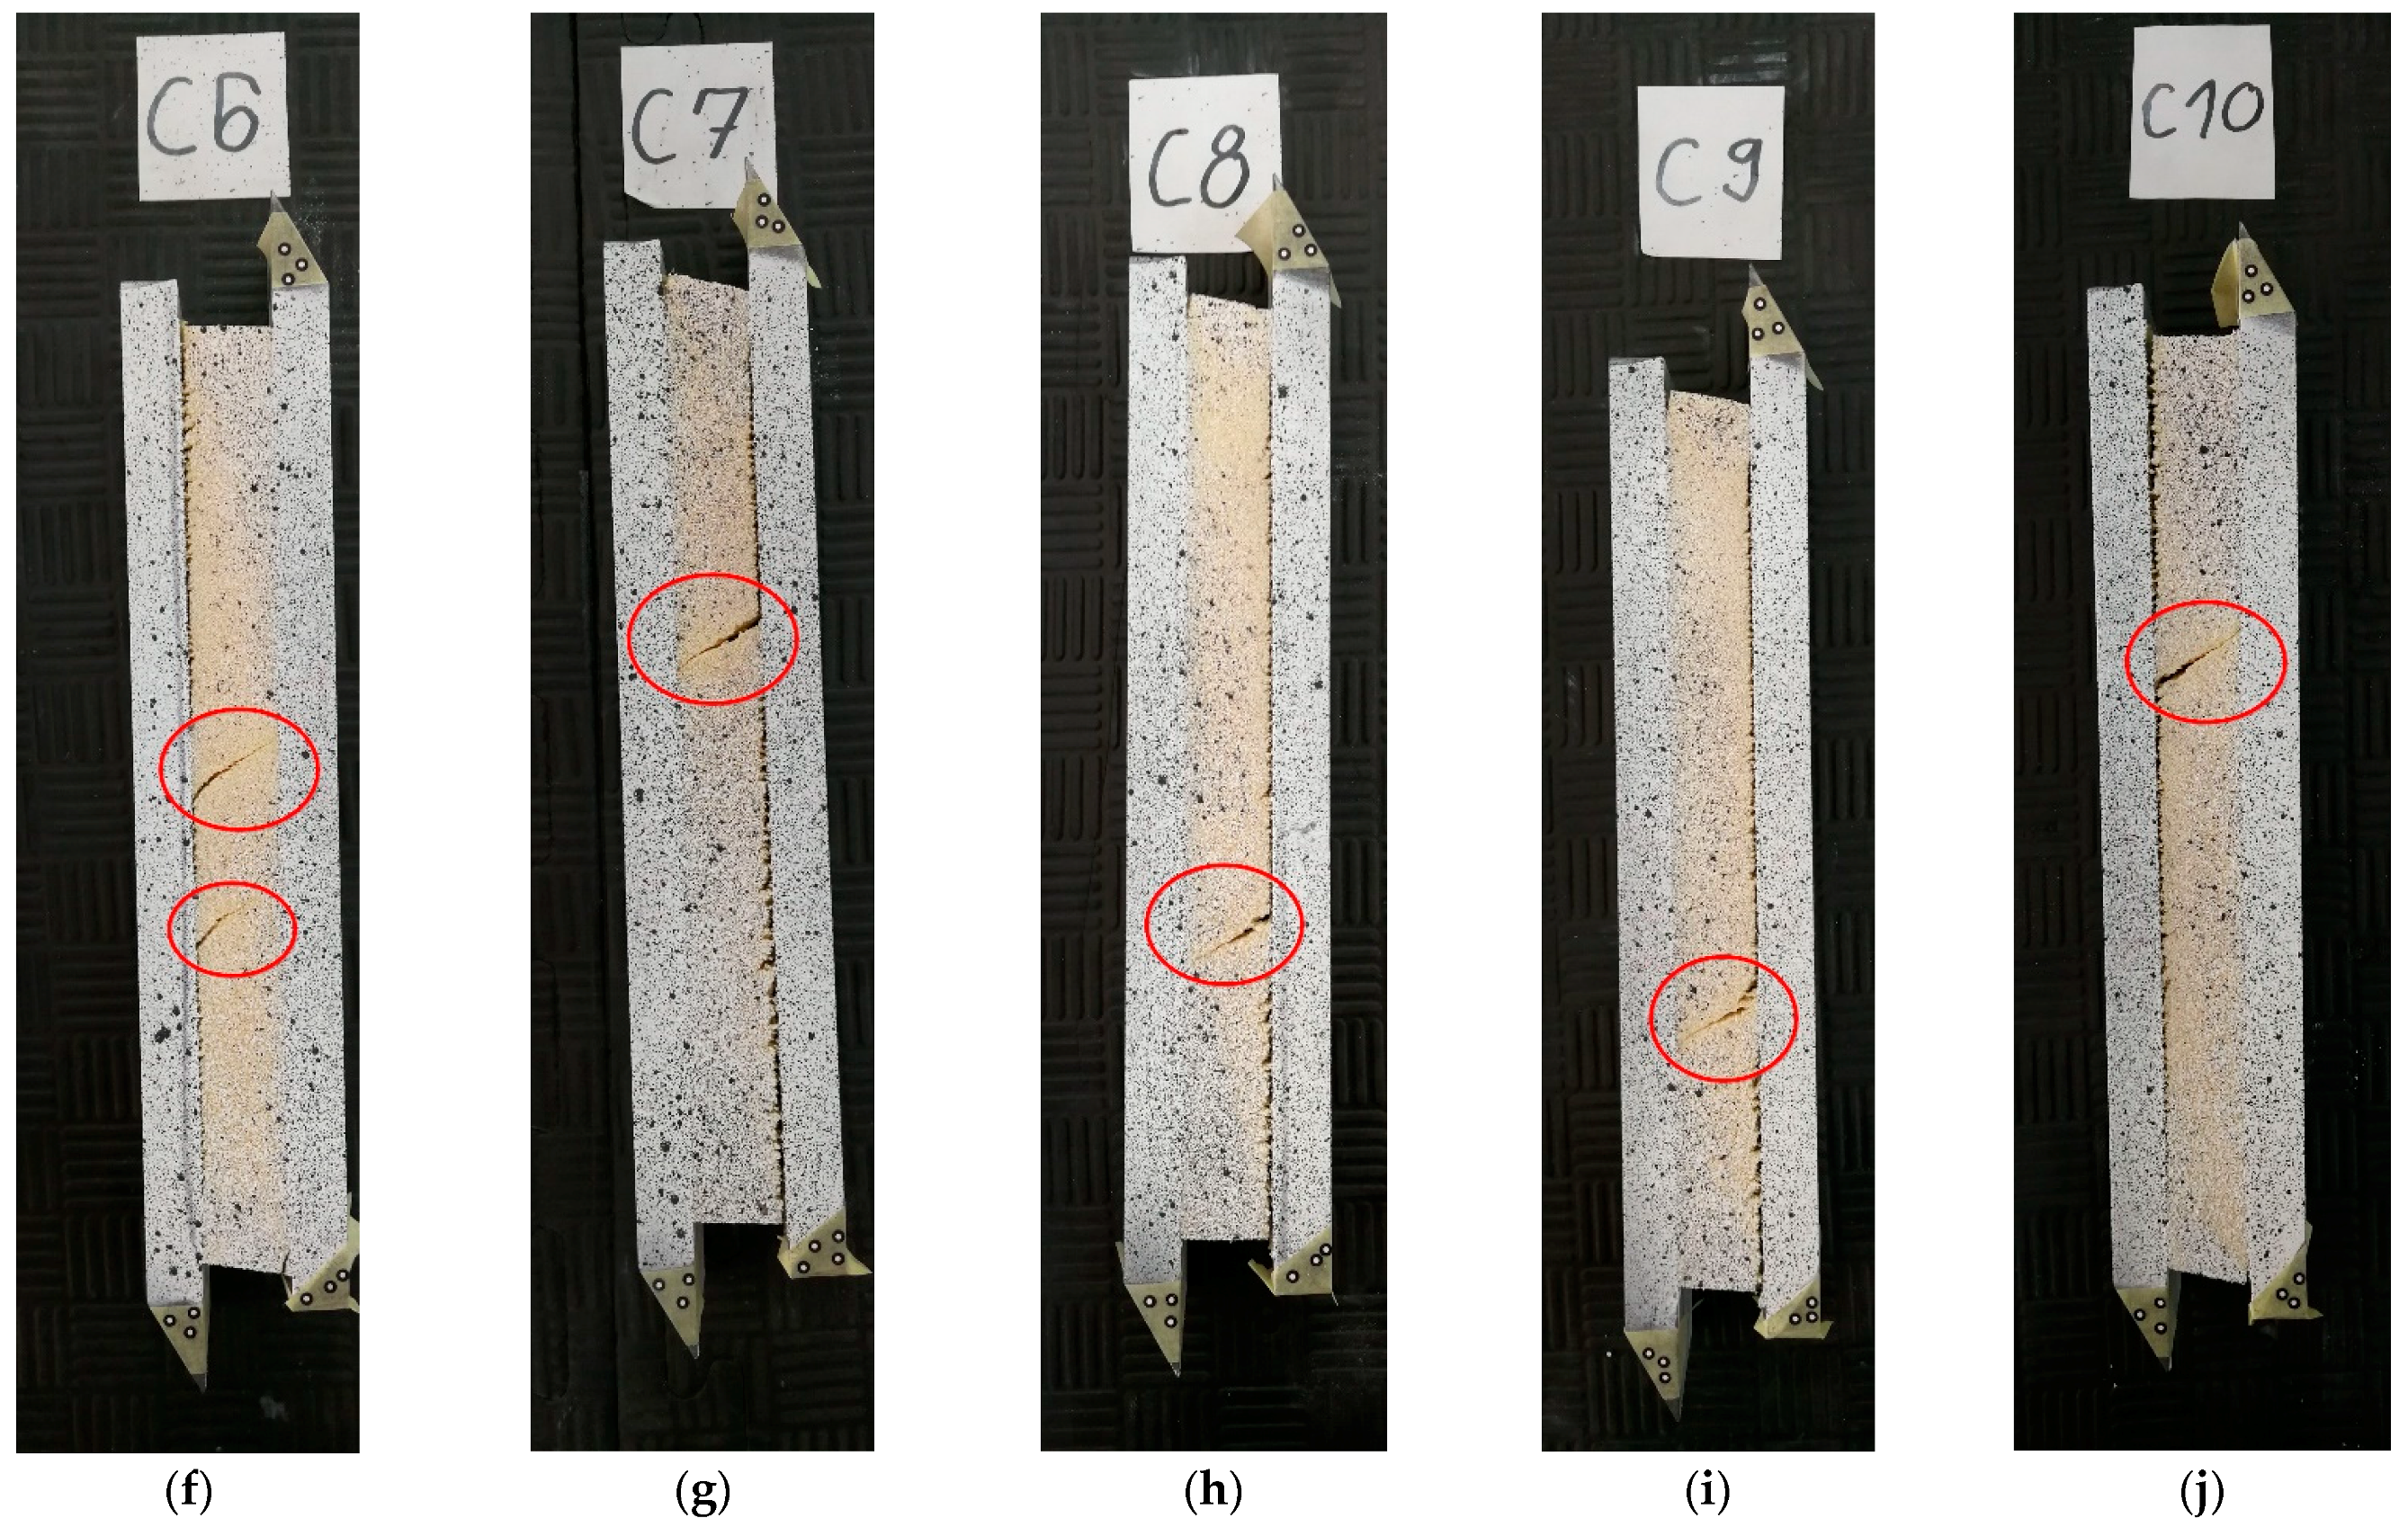
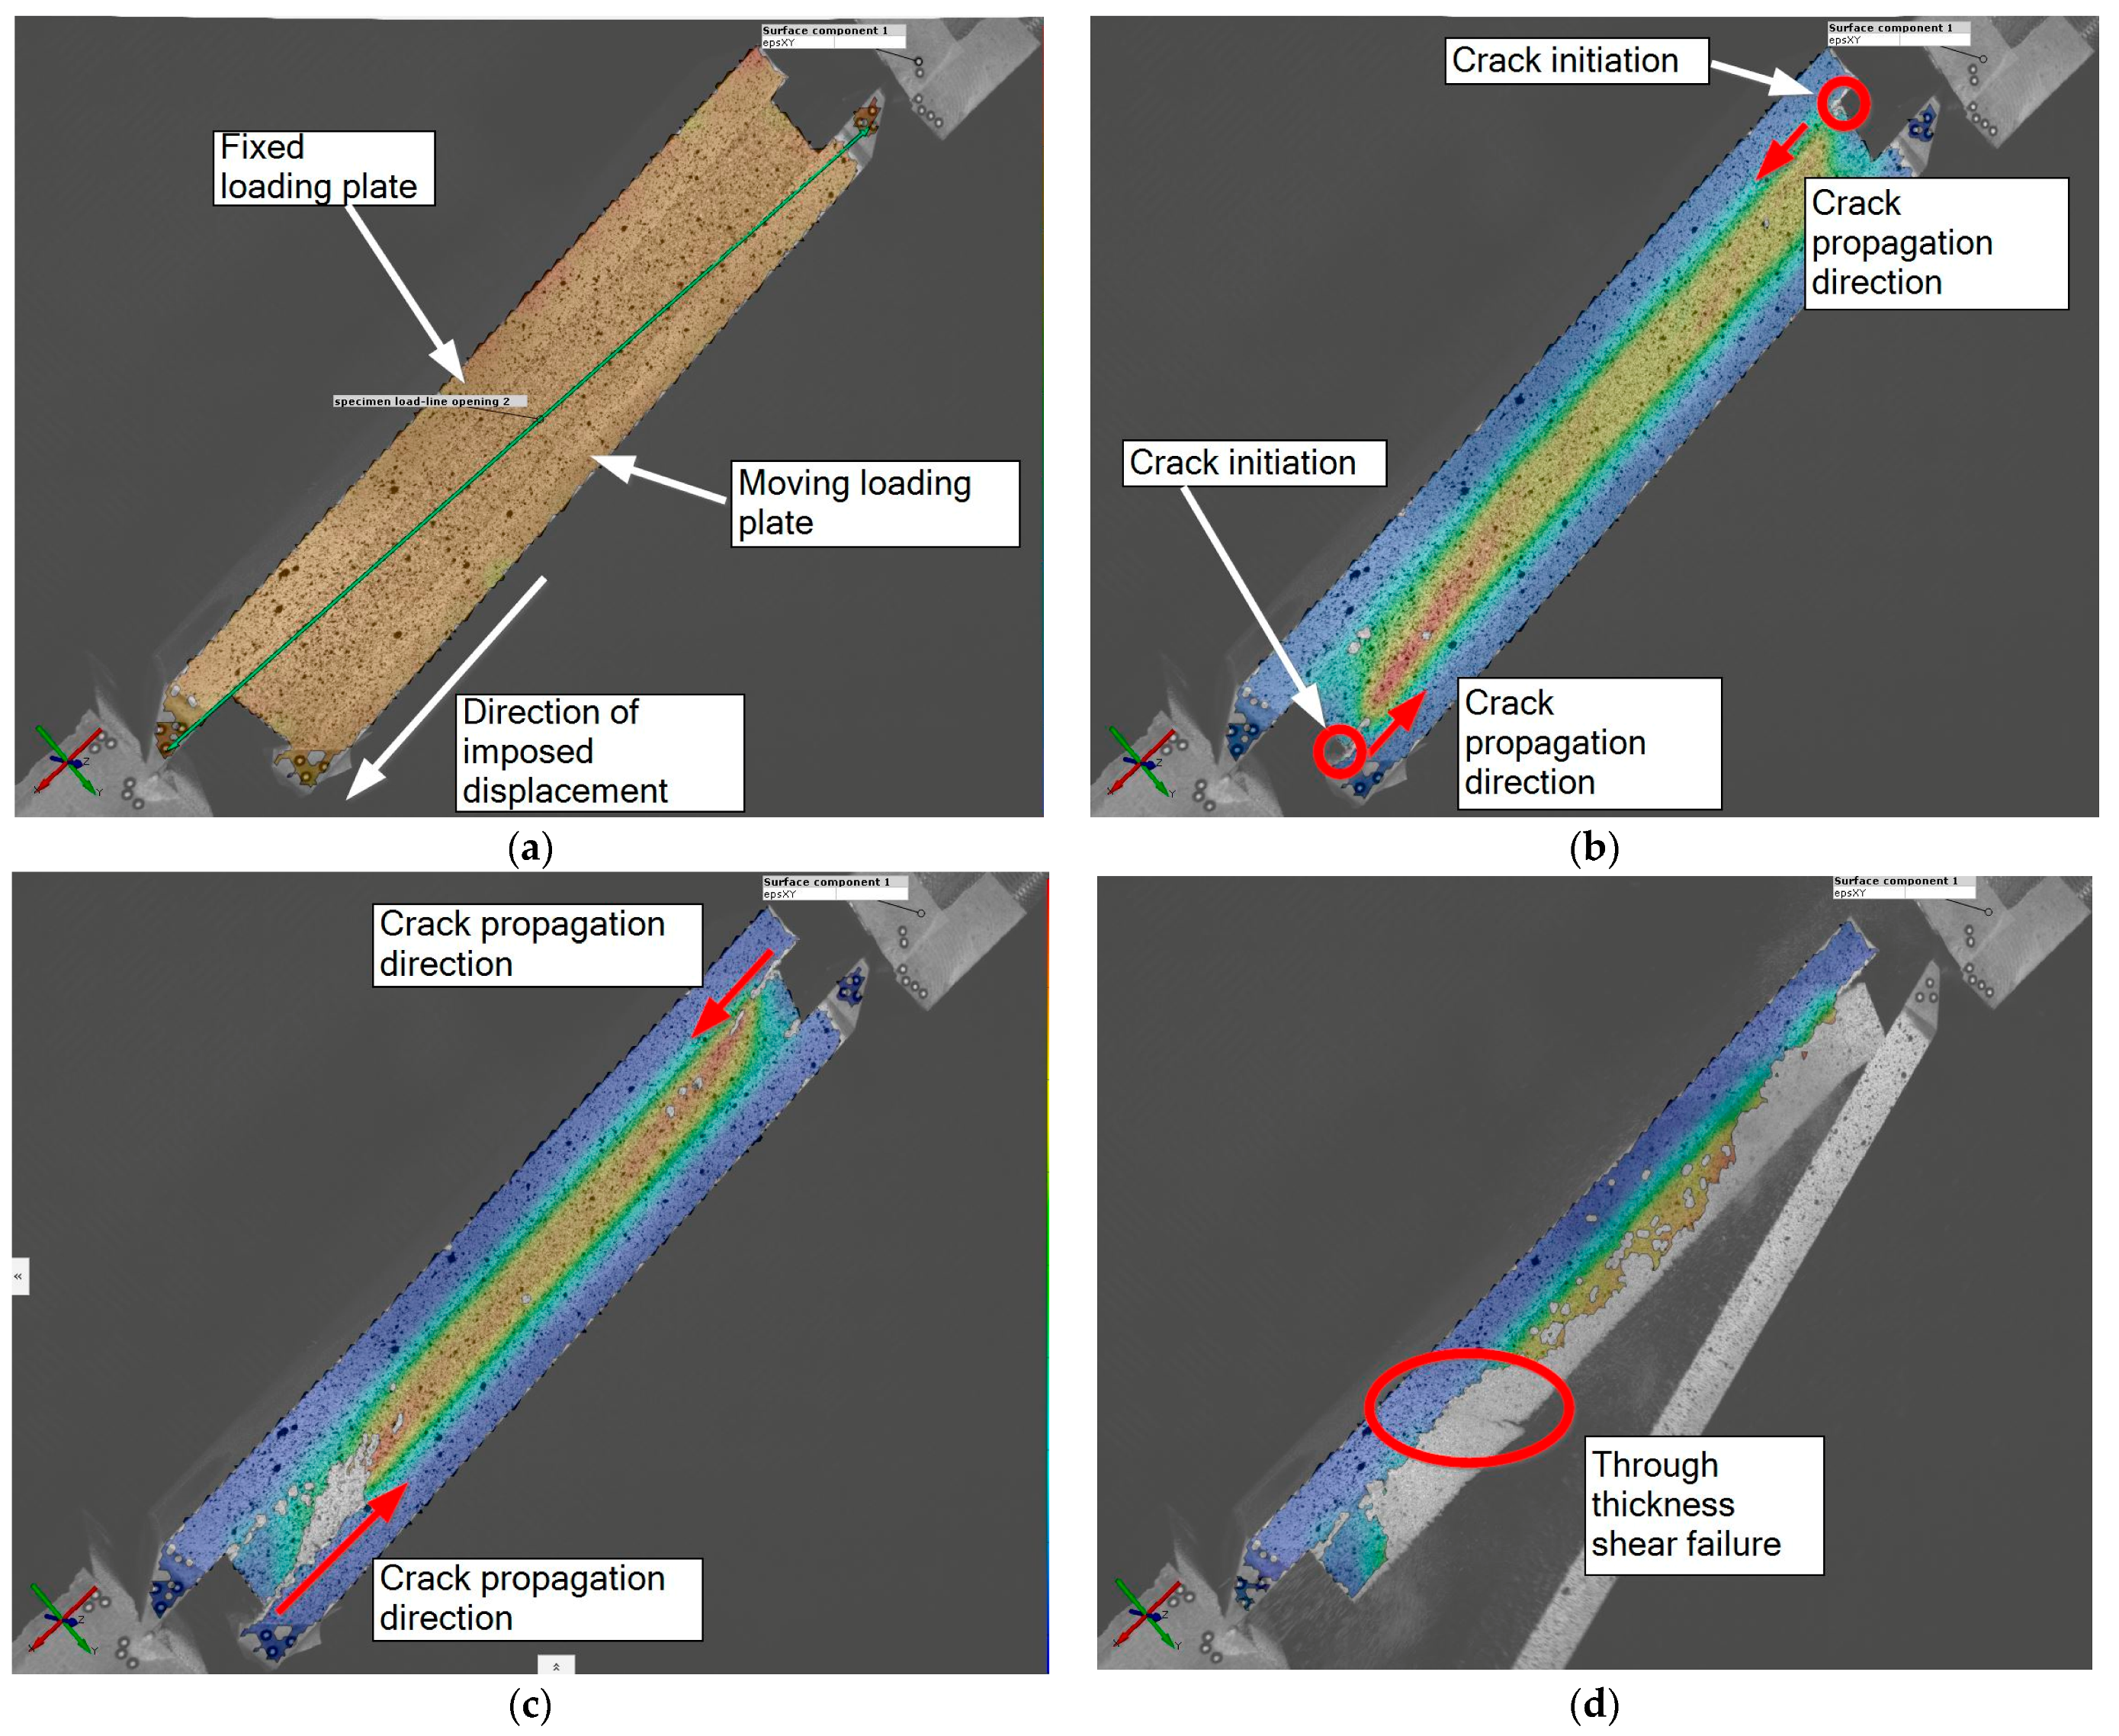
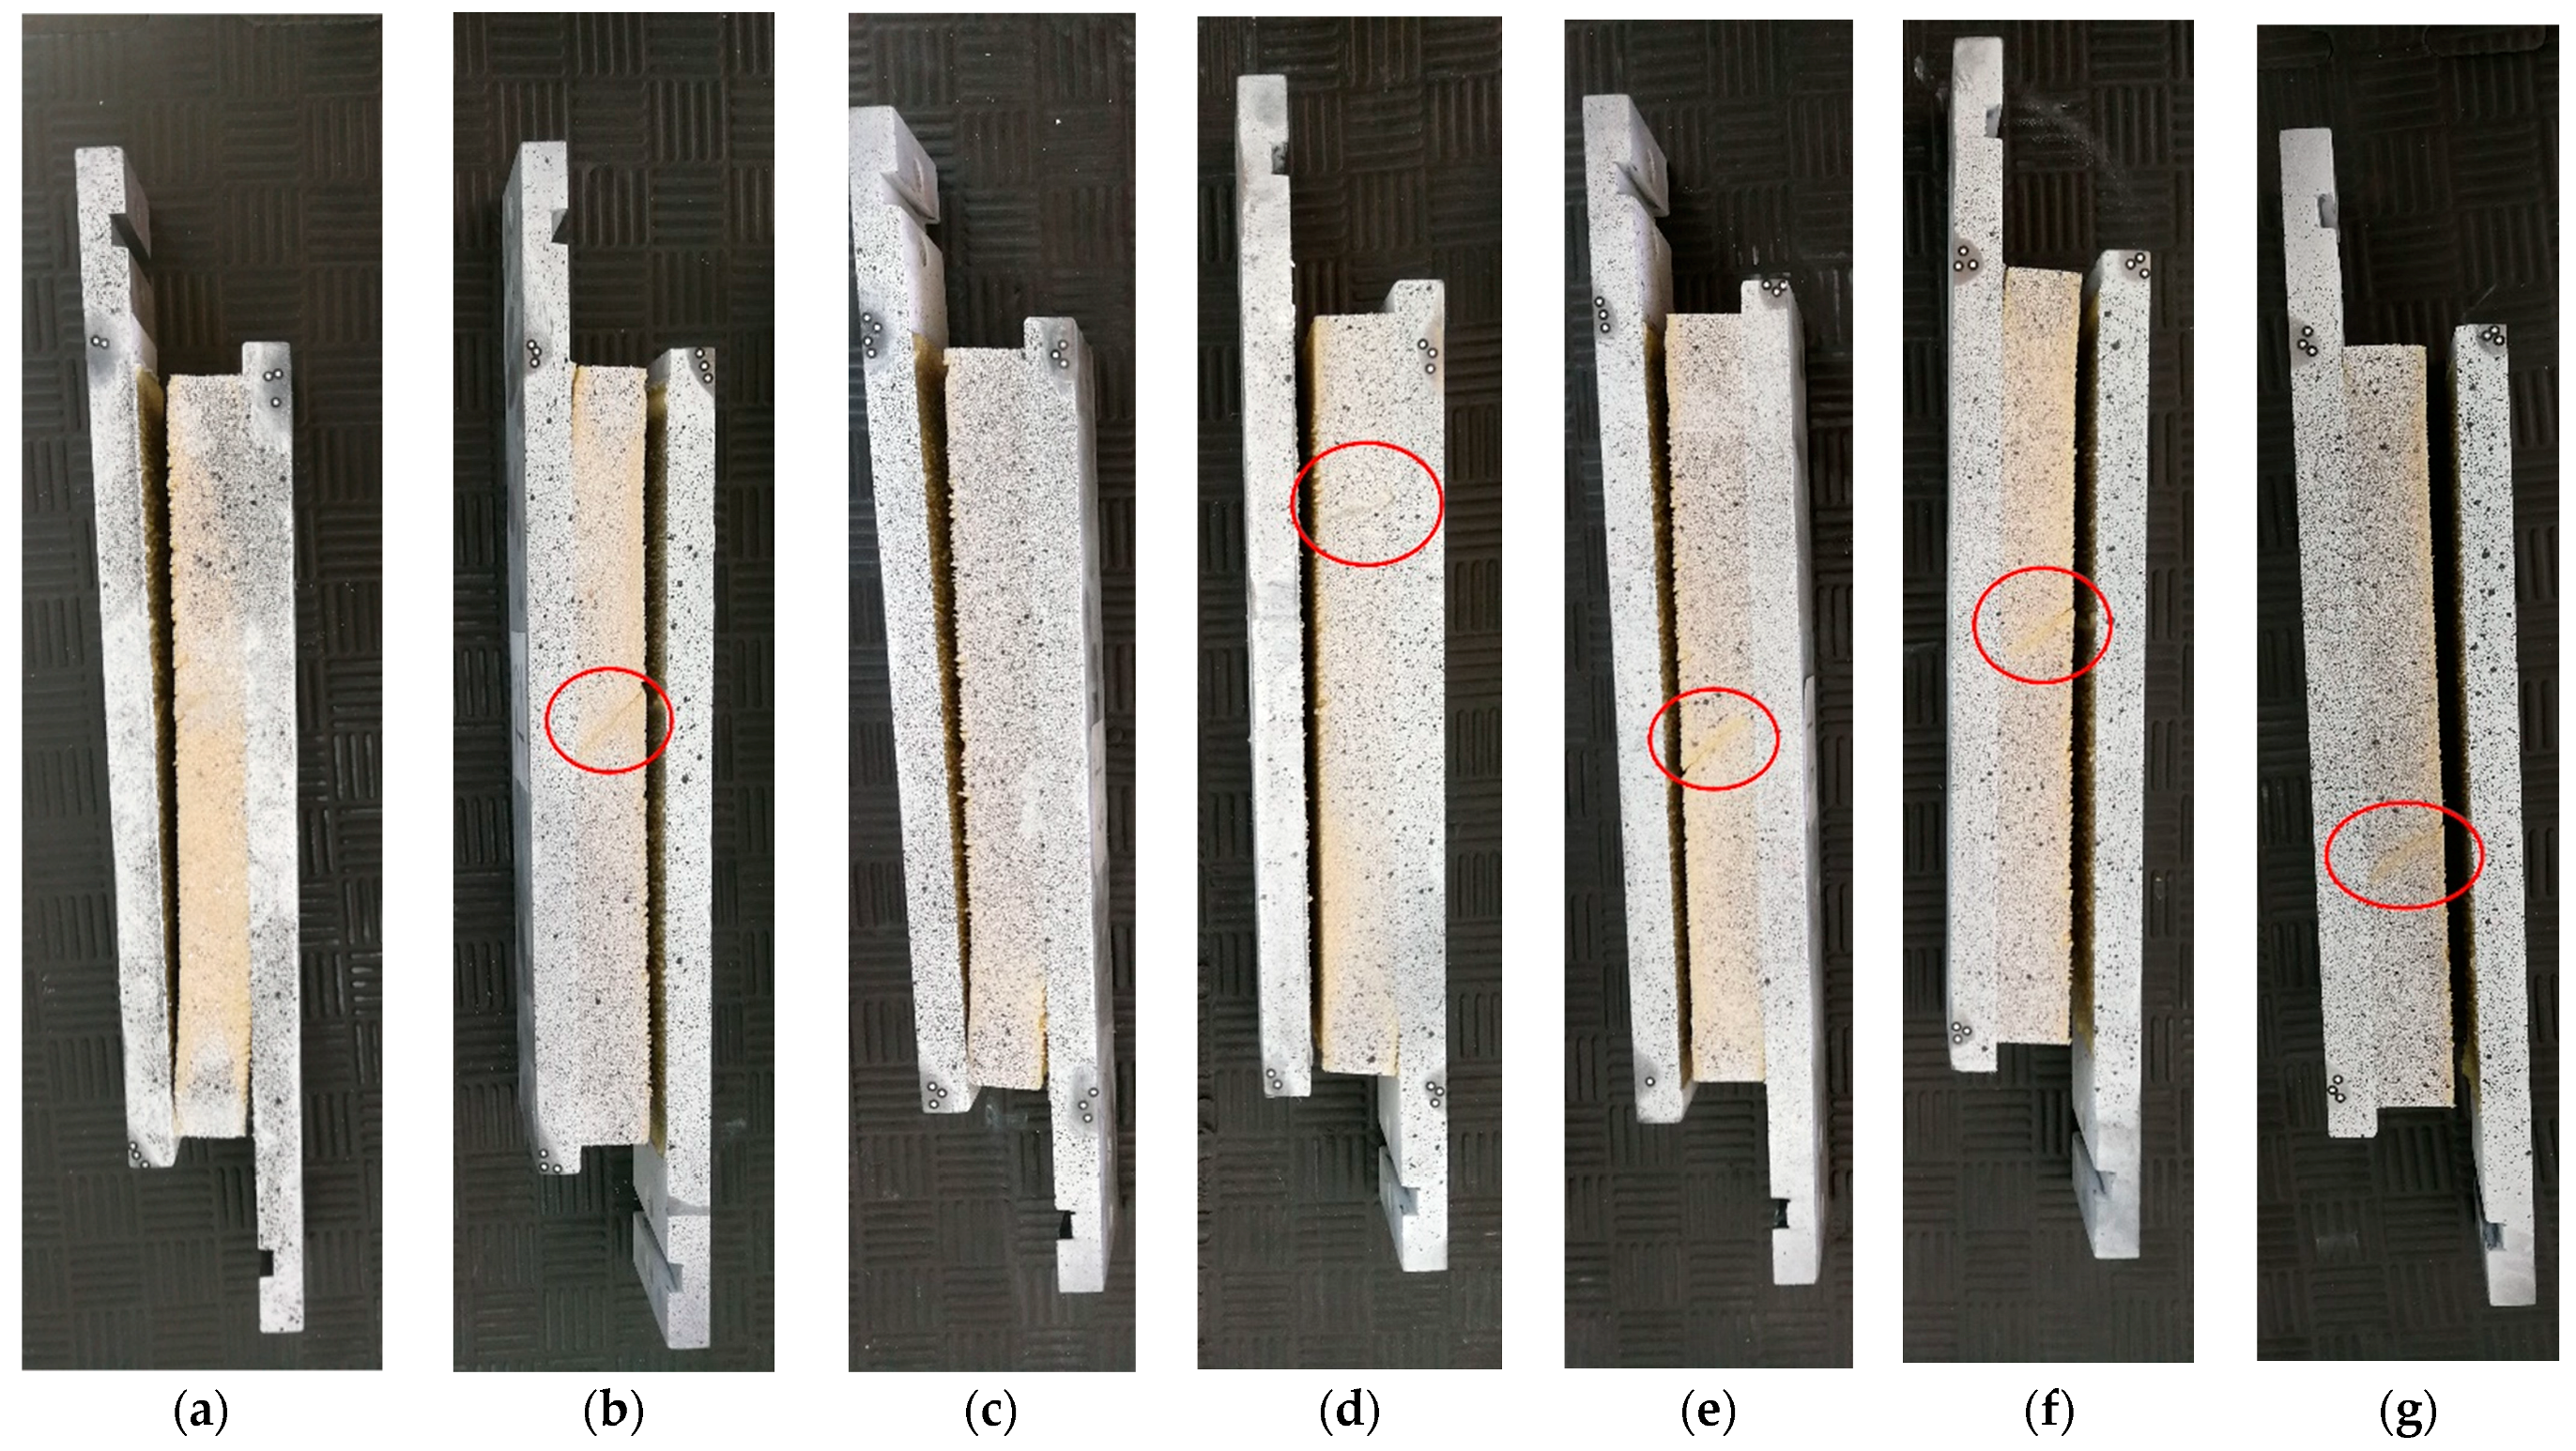
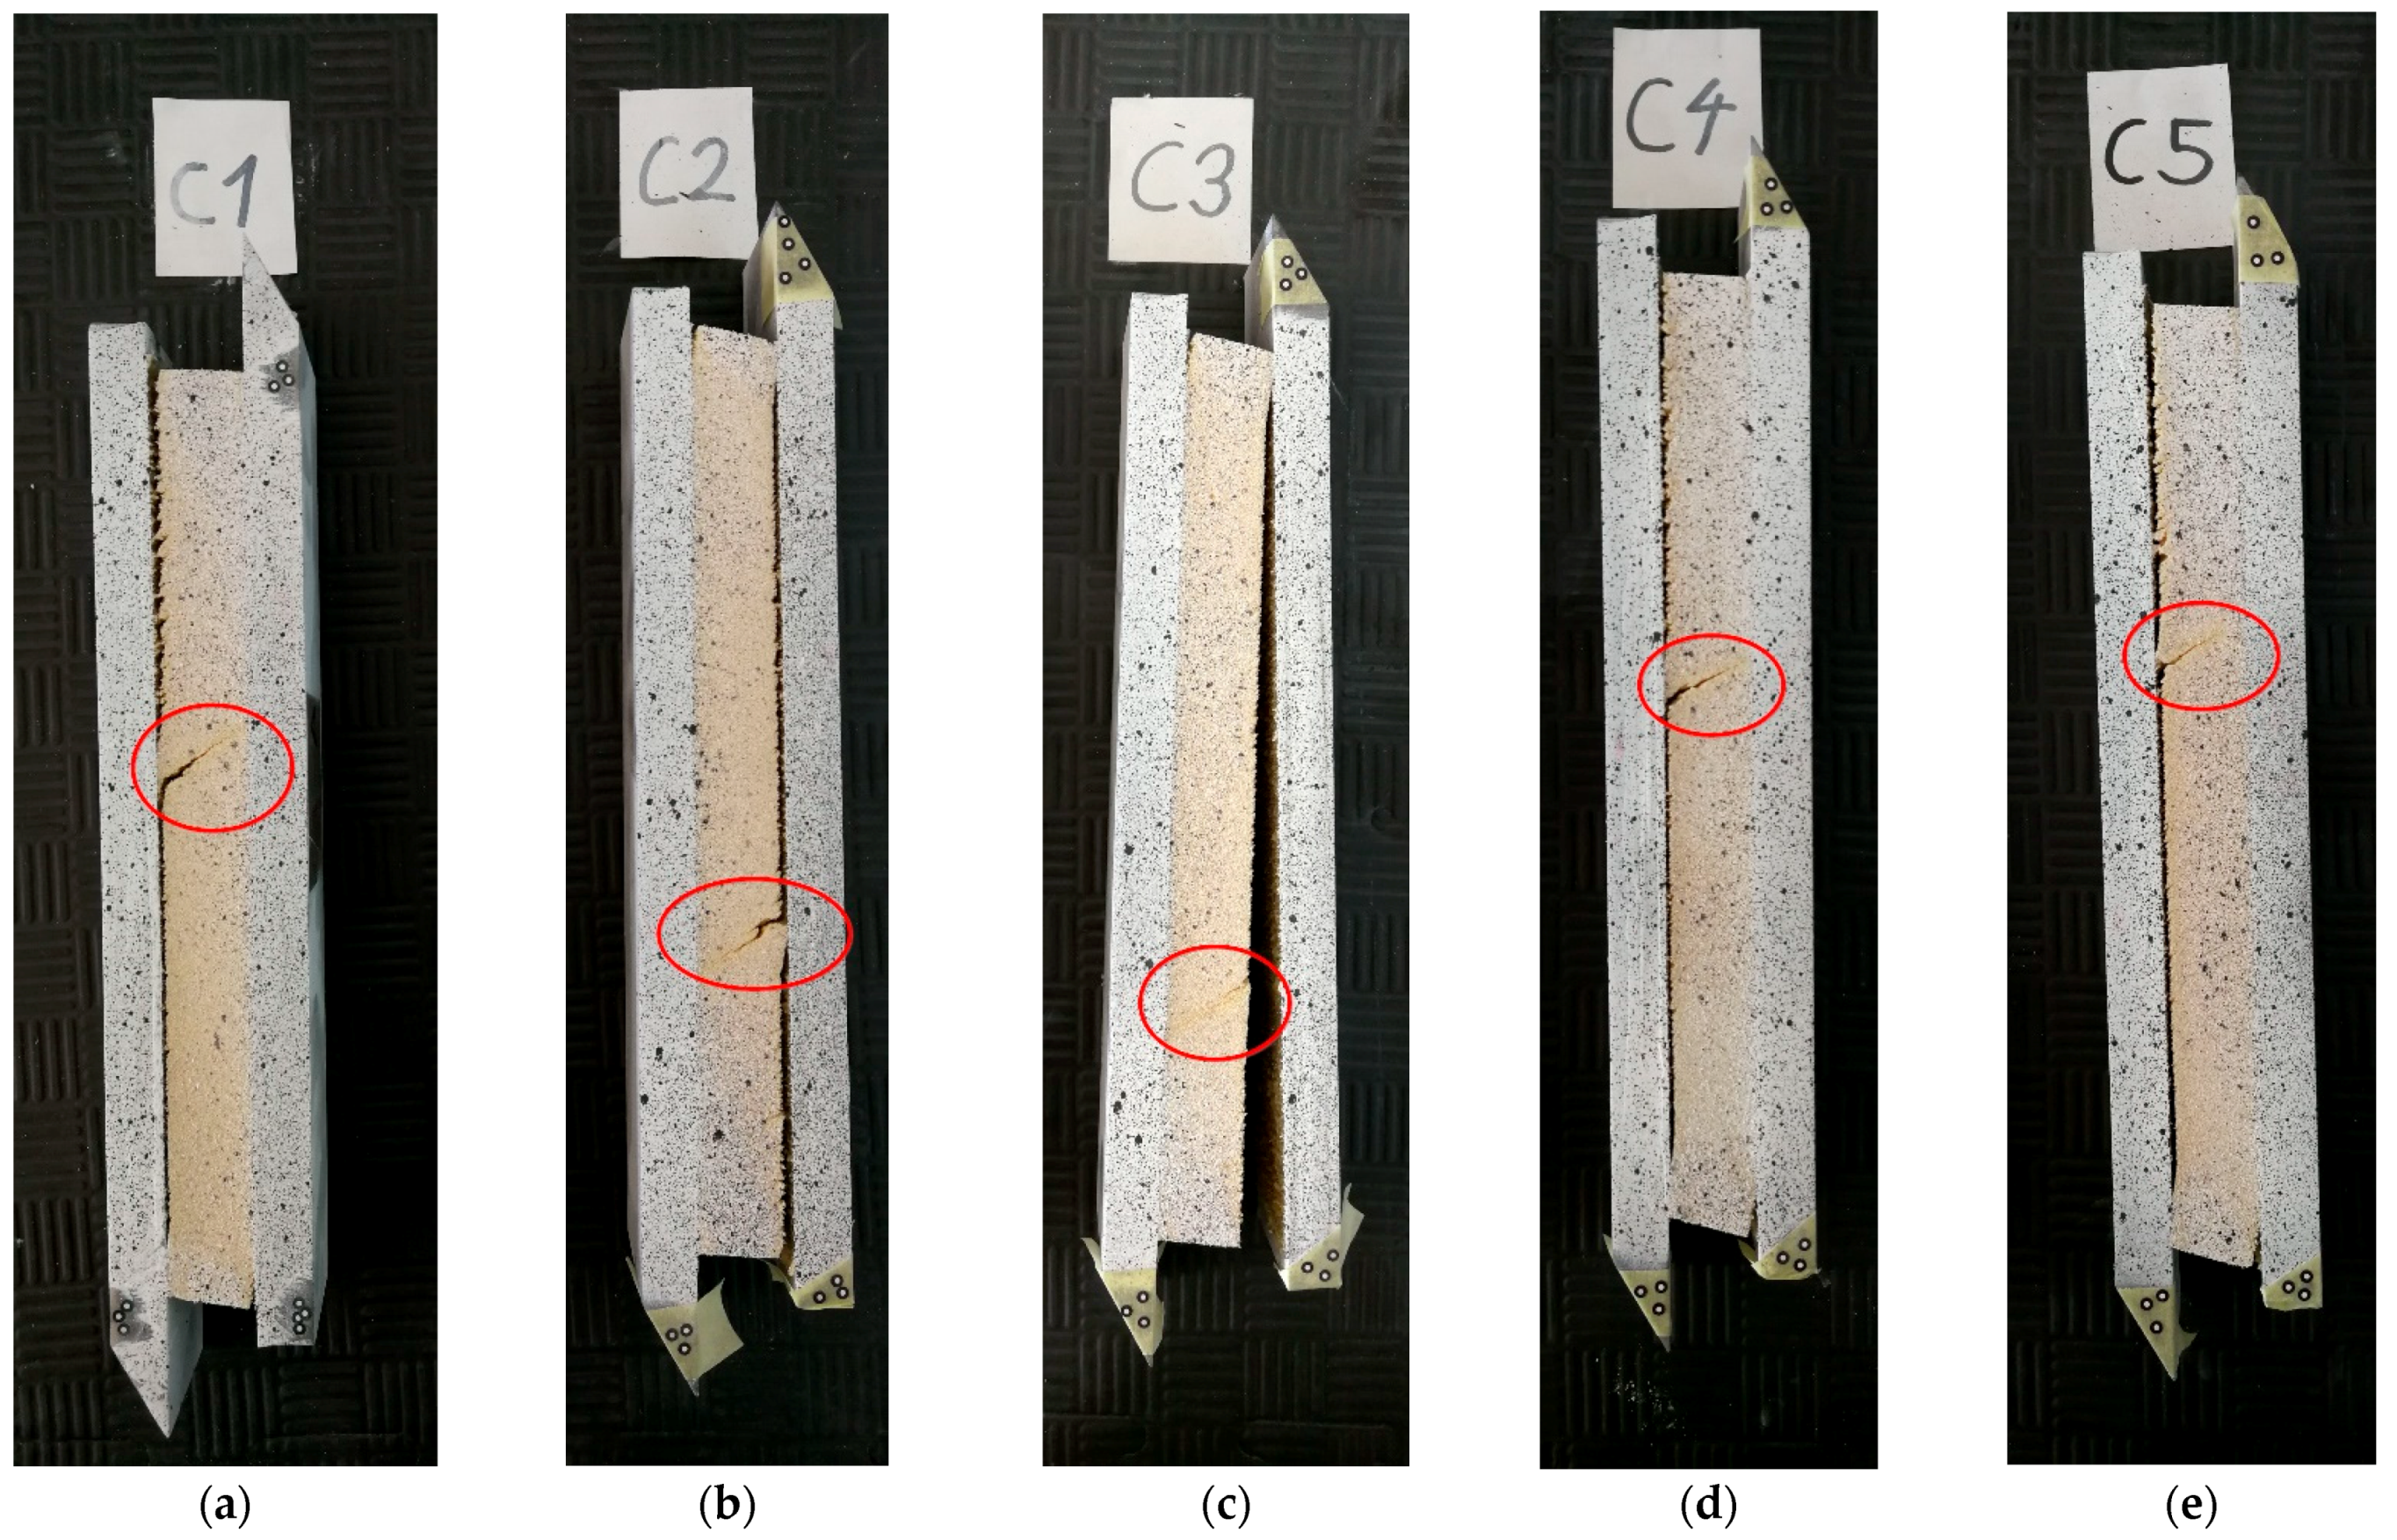
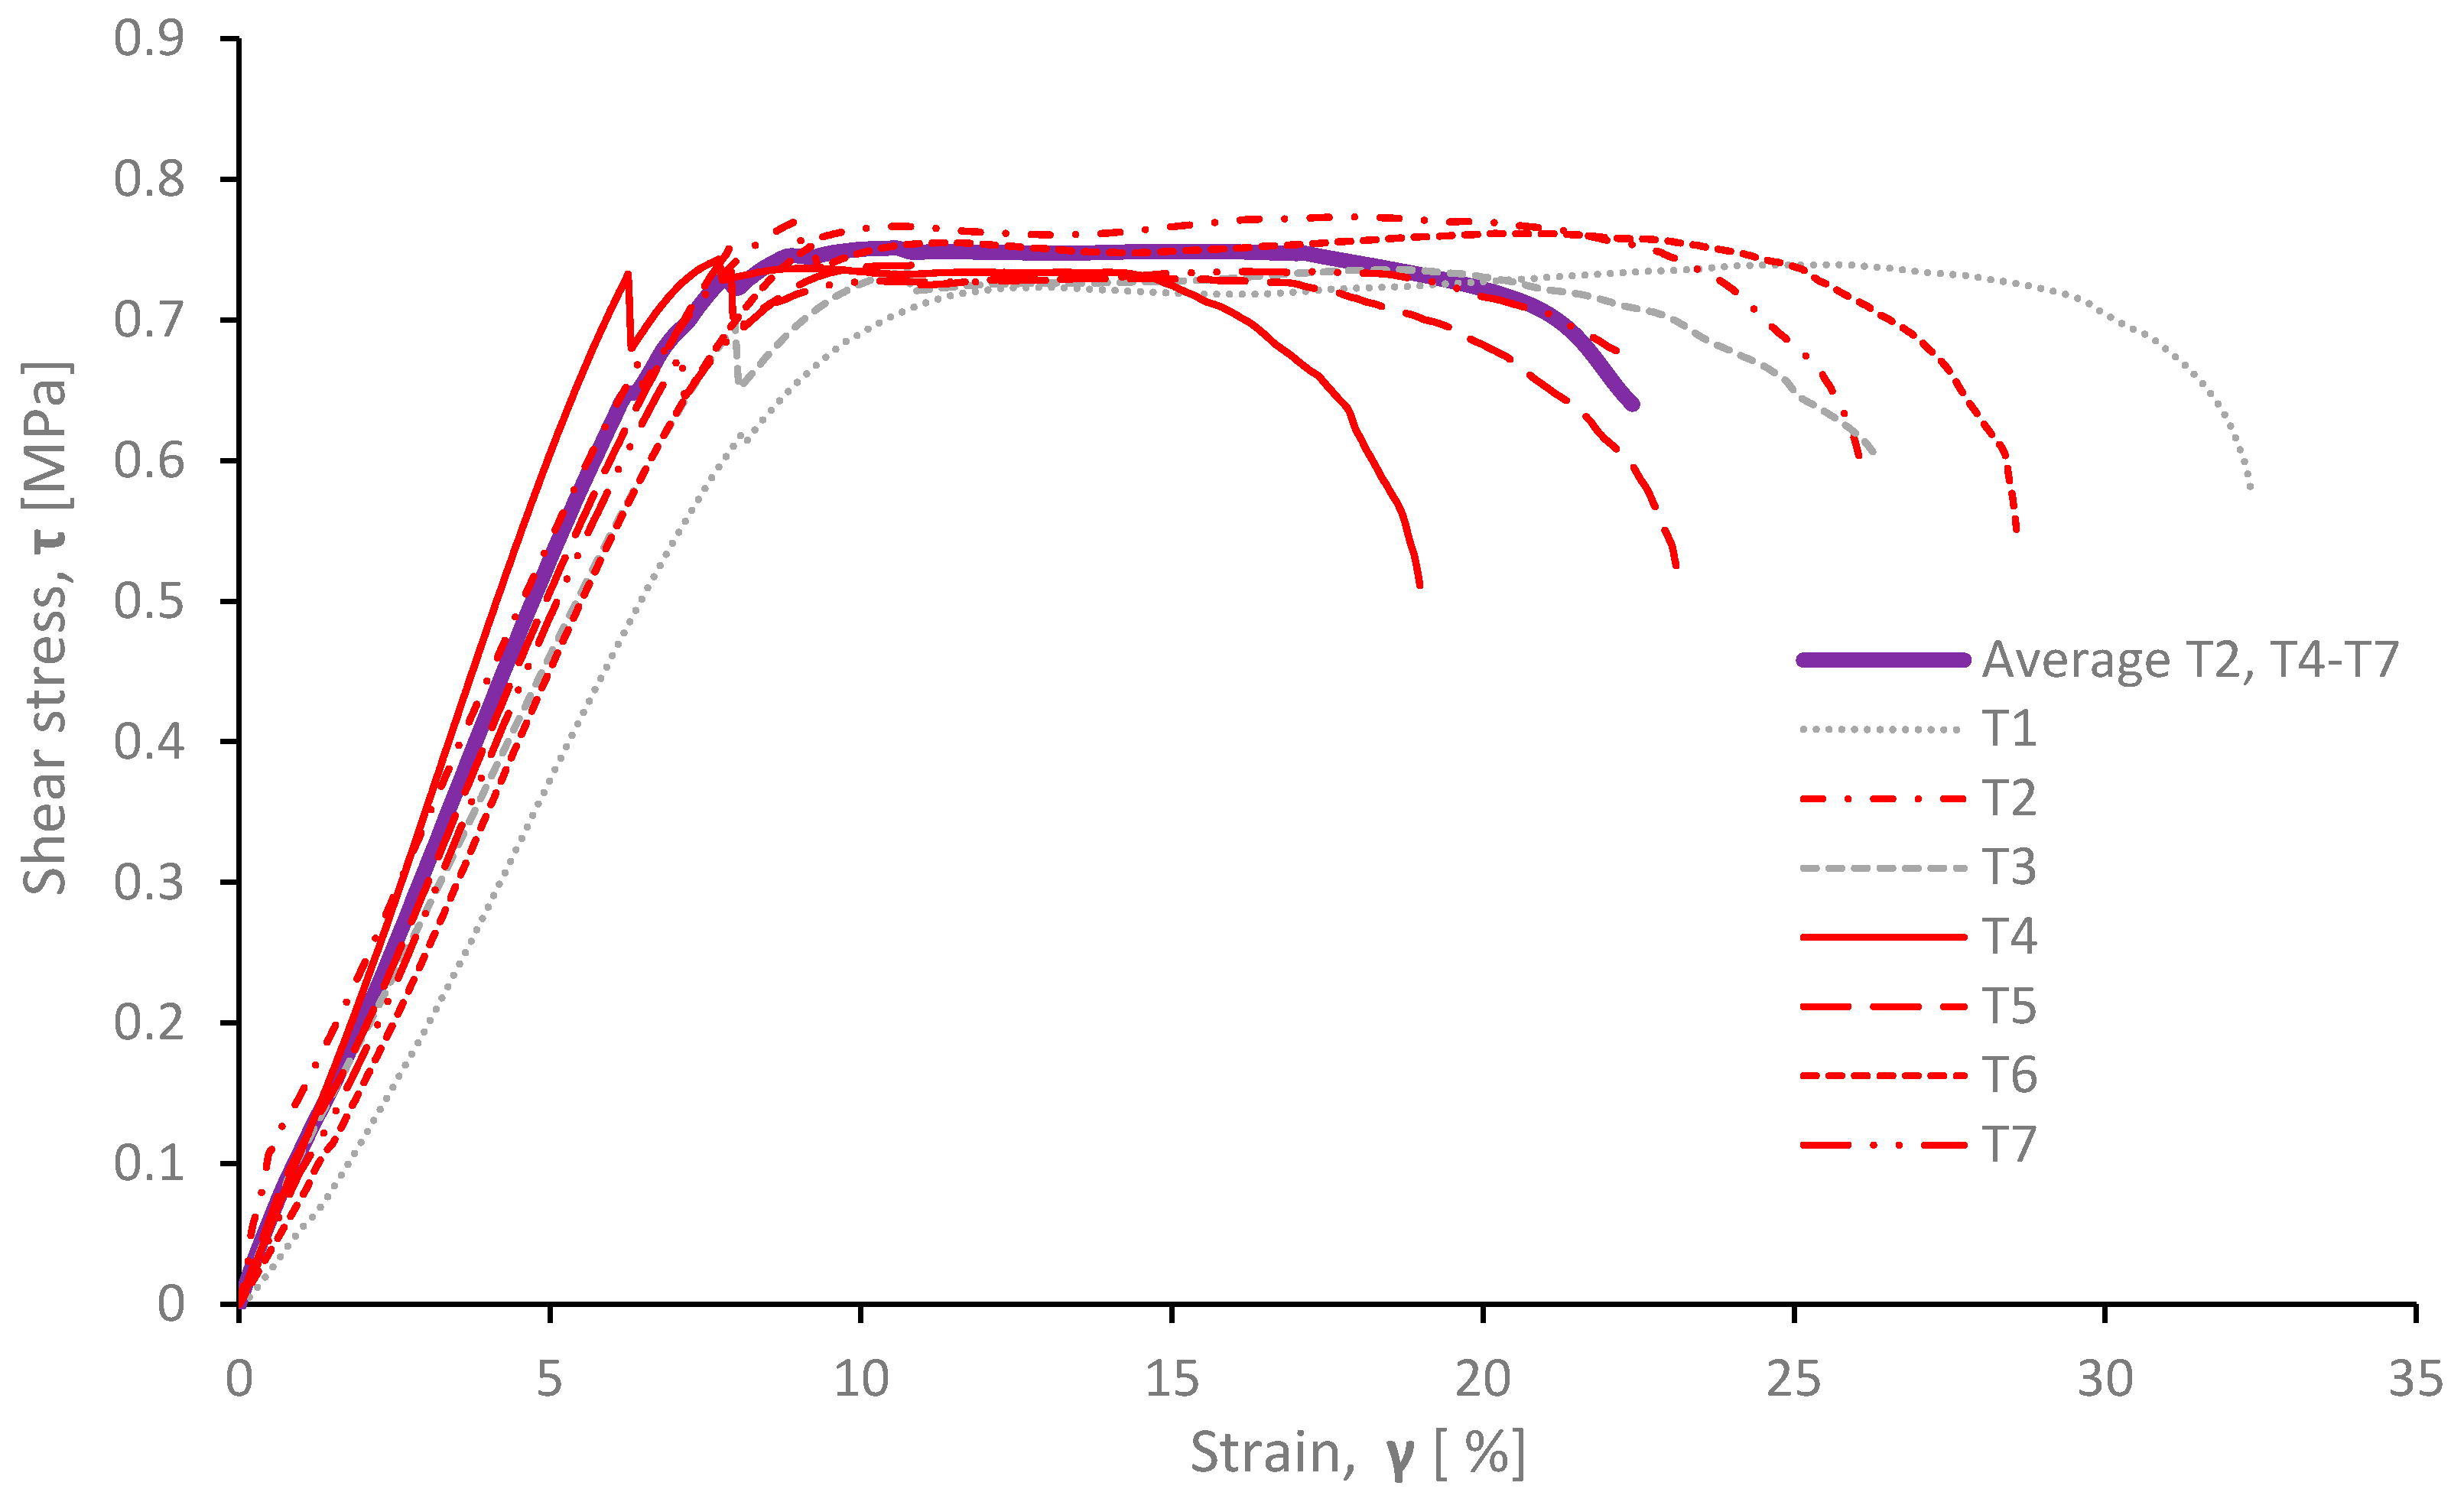
3. Results and Discussion
4. Conclusions
- The ASTM C273 gives conservative shear modulus values for specimens in the tensile loading direction, while specimens loaded in the compressive direction give very close values to the TDS and results provided by the manufacturer;
- The shear strength of the core is marginally different from the value designated in the TDS. The values for the specimens loaded in the tensile direction are somewhat smaller than those loaded in the compressive direction;
- The recommendation is to use ASTM C273 in both loading directions and perform apparent density measurement according to ISO 845:2006 standard;
- The DIC method can easily substitute standard extensometers. The DIC is capable of measuring displacements and the strain field on the sample, but the method of tracking crack propagation on foam materials should be improved;
- For a quick estimation of the shear modulus, the tests can be performed without DIC measuring system or the appropriate extensometer. However, these values tend to be conservative;
- The sampling method in the vessel production can differ from the sampling methods during the core manufacturing. Proper sampling in vessel manufacturing conditions is usually hard to achieve as the samples are usually taken from the limited amount of available core sheets;
- Taking all above mentioned into account, the authors stress the importance of verifying the material properties given by the manufacturer with experimental data prior to using them in any kind of calculations;
- An additional result of the presented approach and experimental evaluation of shear properties is the possibility of using the obtained shear stress-strain curves within standard structural FEA procedures, as well as more advanced ones where it is necessary to create a new or modify an existing material model of the core.
Author Contributions
Funding
Institutional Review Board Statement
Informed Consent Statement
Data Availability Statement
Acknowledgments
Conflicts of Interest
References
- Jang, J.-W.; Jeong, S.; Oh, D.; Cho, J.-H.; Noh, J. Test and Evaluation Procedure of Foam Core Materials for Composite Ships. J. Korean Soc. Mar. Environ. Saf. 2020, 26, 286–296. [Google Scholar] [CrossRef]
- Radolović, V.; Rahm, M. Design of Car Decks with Composite Panels Introduced on a 7000 Cars Car Carrier. In Proceedings of the E-LASS Conference, Pula, Croatia, 10–11 October 2017. [Google Scholar]
- Elenbaas, M. Custome Made Hull for Offshore Vessel. In Proceedings of the E-LASS Seminar Day, Online, 16 September 2020. [Google Scholar]
- Valbo, S. Visby Class Corvettes. In Proceedings of the E-LASS Seminar Day, Online, 27–28 January 2021. [Google Scholar]
- Zenkert, D. The Handbook of Sandwich Construction; Engineering Materials Advisory Services Ltd., Worley: West Midlands, UK, 1997. [Google Scholar]
- Filetin, T.; Marić, G.; Kramer, I. Metal Foams in Shipbuilding. Brodogradnja. 2005, 56, 228–237. [Google Scholar]
- Palomba, G.; Epasto, G.; Crupi, V. Lightweight sandwich structures for marine applications: A review. Mech. Adv. Mater. Struct. 2021, 1–26. [Google Scholar] [CrossRef]
- Bitzer, T. Honeycomb Marine Applications. J. Reinf. Plast. Compos. 1994, 13, 355–360. [Google Scholar] [CrossRef]
- Kujala, P.; Klanac, A. Steel Sandwich Panels in Marine Applications. Brodogradnja 2005, 56, 305–314. [Google Scholar]
- Daniel, I.M. Influence of Core Properties on the Failure of Composite Sandwich Beams. J. Mech. Mater. Struct. 2009, 4, 1271–1286. [Google Scholar] [CrossRef] [Green Version]
- Taher, S.T.; Thomsen, O.T.; Dulieu-Barton, J.M.; Zhang, S. Determination of mechanical properties of PVC foam using a modified Arcan fixture. Comp. Part A Appl. Sci. 2012, 43, 1698–1708. [Google Scholar] [CrossRef]
- Poapongsakorn, P.; Kanchanomai, C. Time-Dependant deformation of closed-cell PVC foam. J. Cell. Plast. 2011, 47, 323–336. [Google Scholar] [CrossRef]
- ASTM C393/C393M-16; Standard Test Method for Core Shear Properties of Sandwich Constructions by Beam Flexure. ASTM International: West Conshohocken, PA, USA, 2016. Available online: www.astm.org (accessed on 10 October 2021).
- ASTM D7250/C7250M-16; Standard Practice for Determining Sandwich Beam Flexural and Shear Stiffness. ASTM International: West Conshohocken, PA, USA, 2016. Available online: www.astm.org (accessed on 10 October 2021).
- Grédiac, M.; Dufort, L. Experimental Evidence of Parasitic Effects in the Shear Test on Sandwich Beams. Exp. Mech. 2002, 42, 186–193. [Google Scholar] [CrossRef]
- Gdoutos, E.E.; Daniel, I.M.; Wang, K.-A.; Abot, J.L. Failure Modes of Composite Sandwich Beams. Int. J. Damage Mech. 2002, 11, 309–334. [Google Scholar] [CrossRef]
- Steeves, C.A.; Fleck, N.A. Collapse mechanism of sandwich beams with composite faces and a foam core, loaded in three-point bending. Part I: Analytical models and minimum weight design. Int. J. Mech. Sci. 2004, 46, 561–583. [Google Scholar] [CrossRef]
- Steeves, C.A.; Fleck, N.A. Collapse mechanism of sandwich beams with composite faces and a foam core, loaded in three-point bending. Part II: Experimental investigation and numerical modelling. Int. J. Mech. Sci. 2004, 46, 585–608. [Google Scholar] [CrossRef]
- ASTM C273/C273M-16; Standard Test Method for Shear Properties of Sandwich Core Materials. ASTM International: West Conshohocken, PA, USA, 2016. Available online: www.astm.org (accessed on 10 October 2021).
- ISO 1922:2018; Rigid Cellular Plastics–Determination of Shear Properties. ISO: Geneva, Switzerland, 2018. Available online: www.iso.org (accessed on 10 October 2021).
- Voiconi, T.; Linul, E.; Marsavina, L.; Sadowski, T.; Kneć, M. Determination of Flexural Properties of Rigid PUR Foams Using Digital Image Correlation. Solid State Phenom. 2014, 216, 116–121. [Google Scholar] [CrossRef]
- Wang, P.; Pierron, F.; Thomsen, O.T. Identification of Material Parameters of PVC Foams using Digital Image Correlation and Virtual Fields Method. Exp. Mech. 2013, 53, 1001–1015. [Google Scholar] [CrossRef]
- Fathi, A.; Keller, J.-K.; Altstaedt, V. Full-field Shear Analyses of Sandwich Core Materials Using Digital Image Correlation (DIC). Compos. B Eng. 2015, 70, 156–166. [Google Scholar] [CrossRef]
- Krawczyk, L.; Goldyn, M.; Urban, T. Digital Image Correlation System in the Experimental Investigation: Capabilities and Limitations. Arch. Civ. Eng. 2019, 65, 171–180. [Google Scholar] [CrossRef] [Green Version]
- ISO 845:2006; Cellular Plastics and Rubbers–Determination of Apparent Density. ISO: Geneva, Switzerland, 2006. Available online: www.iso.org (accessed on 10 October 2021).
- Flexy Foam Datasheet, G. Angeloni. Available online: https://www.g-angeloni.com/elenco-prodotti/sanwich-cores/flexyfoam-pvc/ (accessed on 13 April 2021).
- Araldite 2014-2 Technical Data Sheet, Huntsman. Available online: https://www.intertronics.co.uk/wp-content/uploads/2015/12/ara2014-1.pdf (accessed on 24 January 2022).
- Chuda-Kowalska, M. Effect of the Foam’s Heterogeneity on the Behaviour of Sandwich Panels. Civ. Environ. Eng. Rep. 2019, 29, 97–111. [Google Scholar] [CrossRef] [Green Version]
- PVC 60 Foam Cores, CEL Composites. Available online: https://www.honeycombpanels.eu/en/products/foams/pvc-60-foam-core (accessed on 17 April 2021).
- Gibson, L.J. Cellular Solids; Cambrige University Press: Cambridge, UK, 1999. [Google Scholar]


| Spec. 1 | Spec. 2 | Spec. 3 | Spec. 4 | Spec. 5 | |
|---|---|---|---|---|---|
| Length * [mm] | 49.9 | 51.5 | 49.1 | 49.7 | 50.7 |
| Width * [mm] | 43.1 | 42.8 | 49.7 | 43.2 | 49.7 |
| Height * [mm] | 25.3 | 25.2 | 25.2 | 52.1 | 25.1 |
| Volume [mm3] | 54,340 | 55,589 | 61,496 | 54,051 | 63,375 |
| Weight [g] | 3.158 | 3.189 | 3.591 | 3.150 | 3.430 |
| Apparent Density [kg/m3] | 58.11 | 57.37 | 58.39 | 58.28 | 54.12 |
| Specimen | l [mm] | b [mm] | t * [mm] |
|---|---|---|---|
| Tensile Direction Specimens | |||
| T1 | 254.28 | 49.89 | 24.46 |
| T2 | 255.03 | 49.51 | 24.76 |
| T3 | 251.49 | 49.97 | 25.15 |
| T4 | 251.06 | 50.08 | 24.99 |
| T5 | 251.54 | 49.87 | 24.75 |
| T6 | 253.18 | 49.82 | 24.58 |
| T7 | 254.76 | 50.10 | 24.54 |
| Compressive Direction Specimens | |||
| C1 | 255.44 | 49.50 | 24.89 |
| C2 | 251.98 | 49.88 | 25.06 |
| C3 | 253.21 | 49.83 | 25.08 |
| C4 | 254.24 | 50.08 | 25.17 |
| C5 | 254.24 | 49.91 | 25.17 |
| C6 | 254.19 | 49.64 | 25.02 |
| C7 | 254.55 | 50.07 | 25.10 |
| C8 | 254.23 | 49.73 | 25.15 |
| C9 | 252.24 | 49.67 | 25.13 |
| C10 | 260.06 | 49.60 | 25.12 |
| Specimen | T2 | T4 | T5 | T6 | T7 |
|---|---|---|---|---|---|
| dDIC [mm] | 6.45 | 4.68 | 5.71 | 7.06 | 5.43 |
| dMACH [mm] | 7.54 | 6.64 | 6.88 | 8.13 | 6.52 |
| Δd [mm] | −1.09 | −1.76 | −1.17 | −1.07 | −1.09 |
| Specimen | T2 | T4 | T5 | T6 | T7 |
|---|---|---|---|---|---|
| GDIC [MPa] | 11.8 | 11.9 | 9.9 | 10.3 | 10.3 |
| GMACH [MPa] | 7.8 | 8.8 | 8.6 | 7.9 | 8.3 |
| ΔG [MPa] | 4.0 | 3.1 | 1.3 | 2.4 | 2.0 |
| ΔG [%] | 33.9 | 26.1 | 13.1 | 23.3 | 19.4 |
| Specimen | C1 | C2 | C3 | C4 | C5 | C6 | C7 | C8 | C9 | C10 |
|---|---|---|---|---|---|---|---|---|---|---|
| dDIC [mm] | 8.60 | 8.59 | 8.90 | 9.51 | 8.91 | 6.00 | 6.78 | 7.48 | 7.63 | 7.05 |
| dMACH [mm] | 9.52 | 9.22 | 9.50 | 10.05 | 9.70 | 6.60 | 7.94 | 8.11 | 8.41 | 7.61 |
| Δd [mm] | −0.92 | −0.63 | −0.60 | −0.54 | −0.79 | −0.60 | −1.16 | −0.63 | −0.78 | −0.56 |
| Specimen | C1 | C2 | C3 | C4 | C5 | C6 | C7 | C8 | C9 | C10 |
|---|---|---|---|---|---|---|---|---|---|---|
| GDIC [MPa] | 19.3 | 21.3 | 22.3 | 21.1 | 21.2 | 18.8 | 19.5 | 22.3 | 21.1 | 21.3 |
| GMACH [MPa] | 12.3 | 14.8 | 14.2 | 13.2 | 14.2 | 11.8 | 14.9 | 15.3 | 16.0 | 13.4 |
| ΔG [MPa] | 7.0 | 6.5 | 8.1 | 7.9 | 7.0 | 7.0 | 4.6 | 7.0 | 5.1 | 7.9 |
| ΔG [%] | 36.3 | 30.5 | 36.3 | 37.4 | 33.0 | 37.2 | 23.6 | 31.4 | 24.2 | 37.1 |
| Specimen | τ [MPa] |
|---|---|
| T1 | 0.739 |
| T2 | 0.773 |
| T3 | 0.736 |
| T4 | 0.743 |
| T5 | 0.753 |
| T6 | 0.761 |
| T7 | 0.735 |
| Average T1–T7 | 0.749 |
| Average T2, T4–T7 | 0.753 |
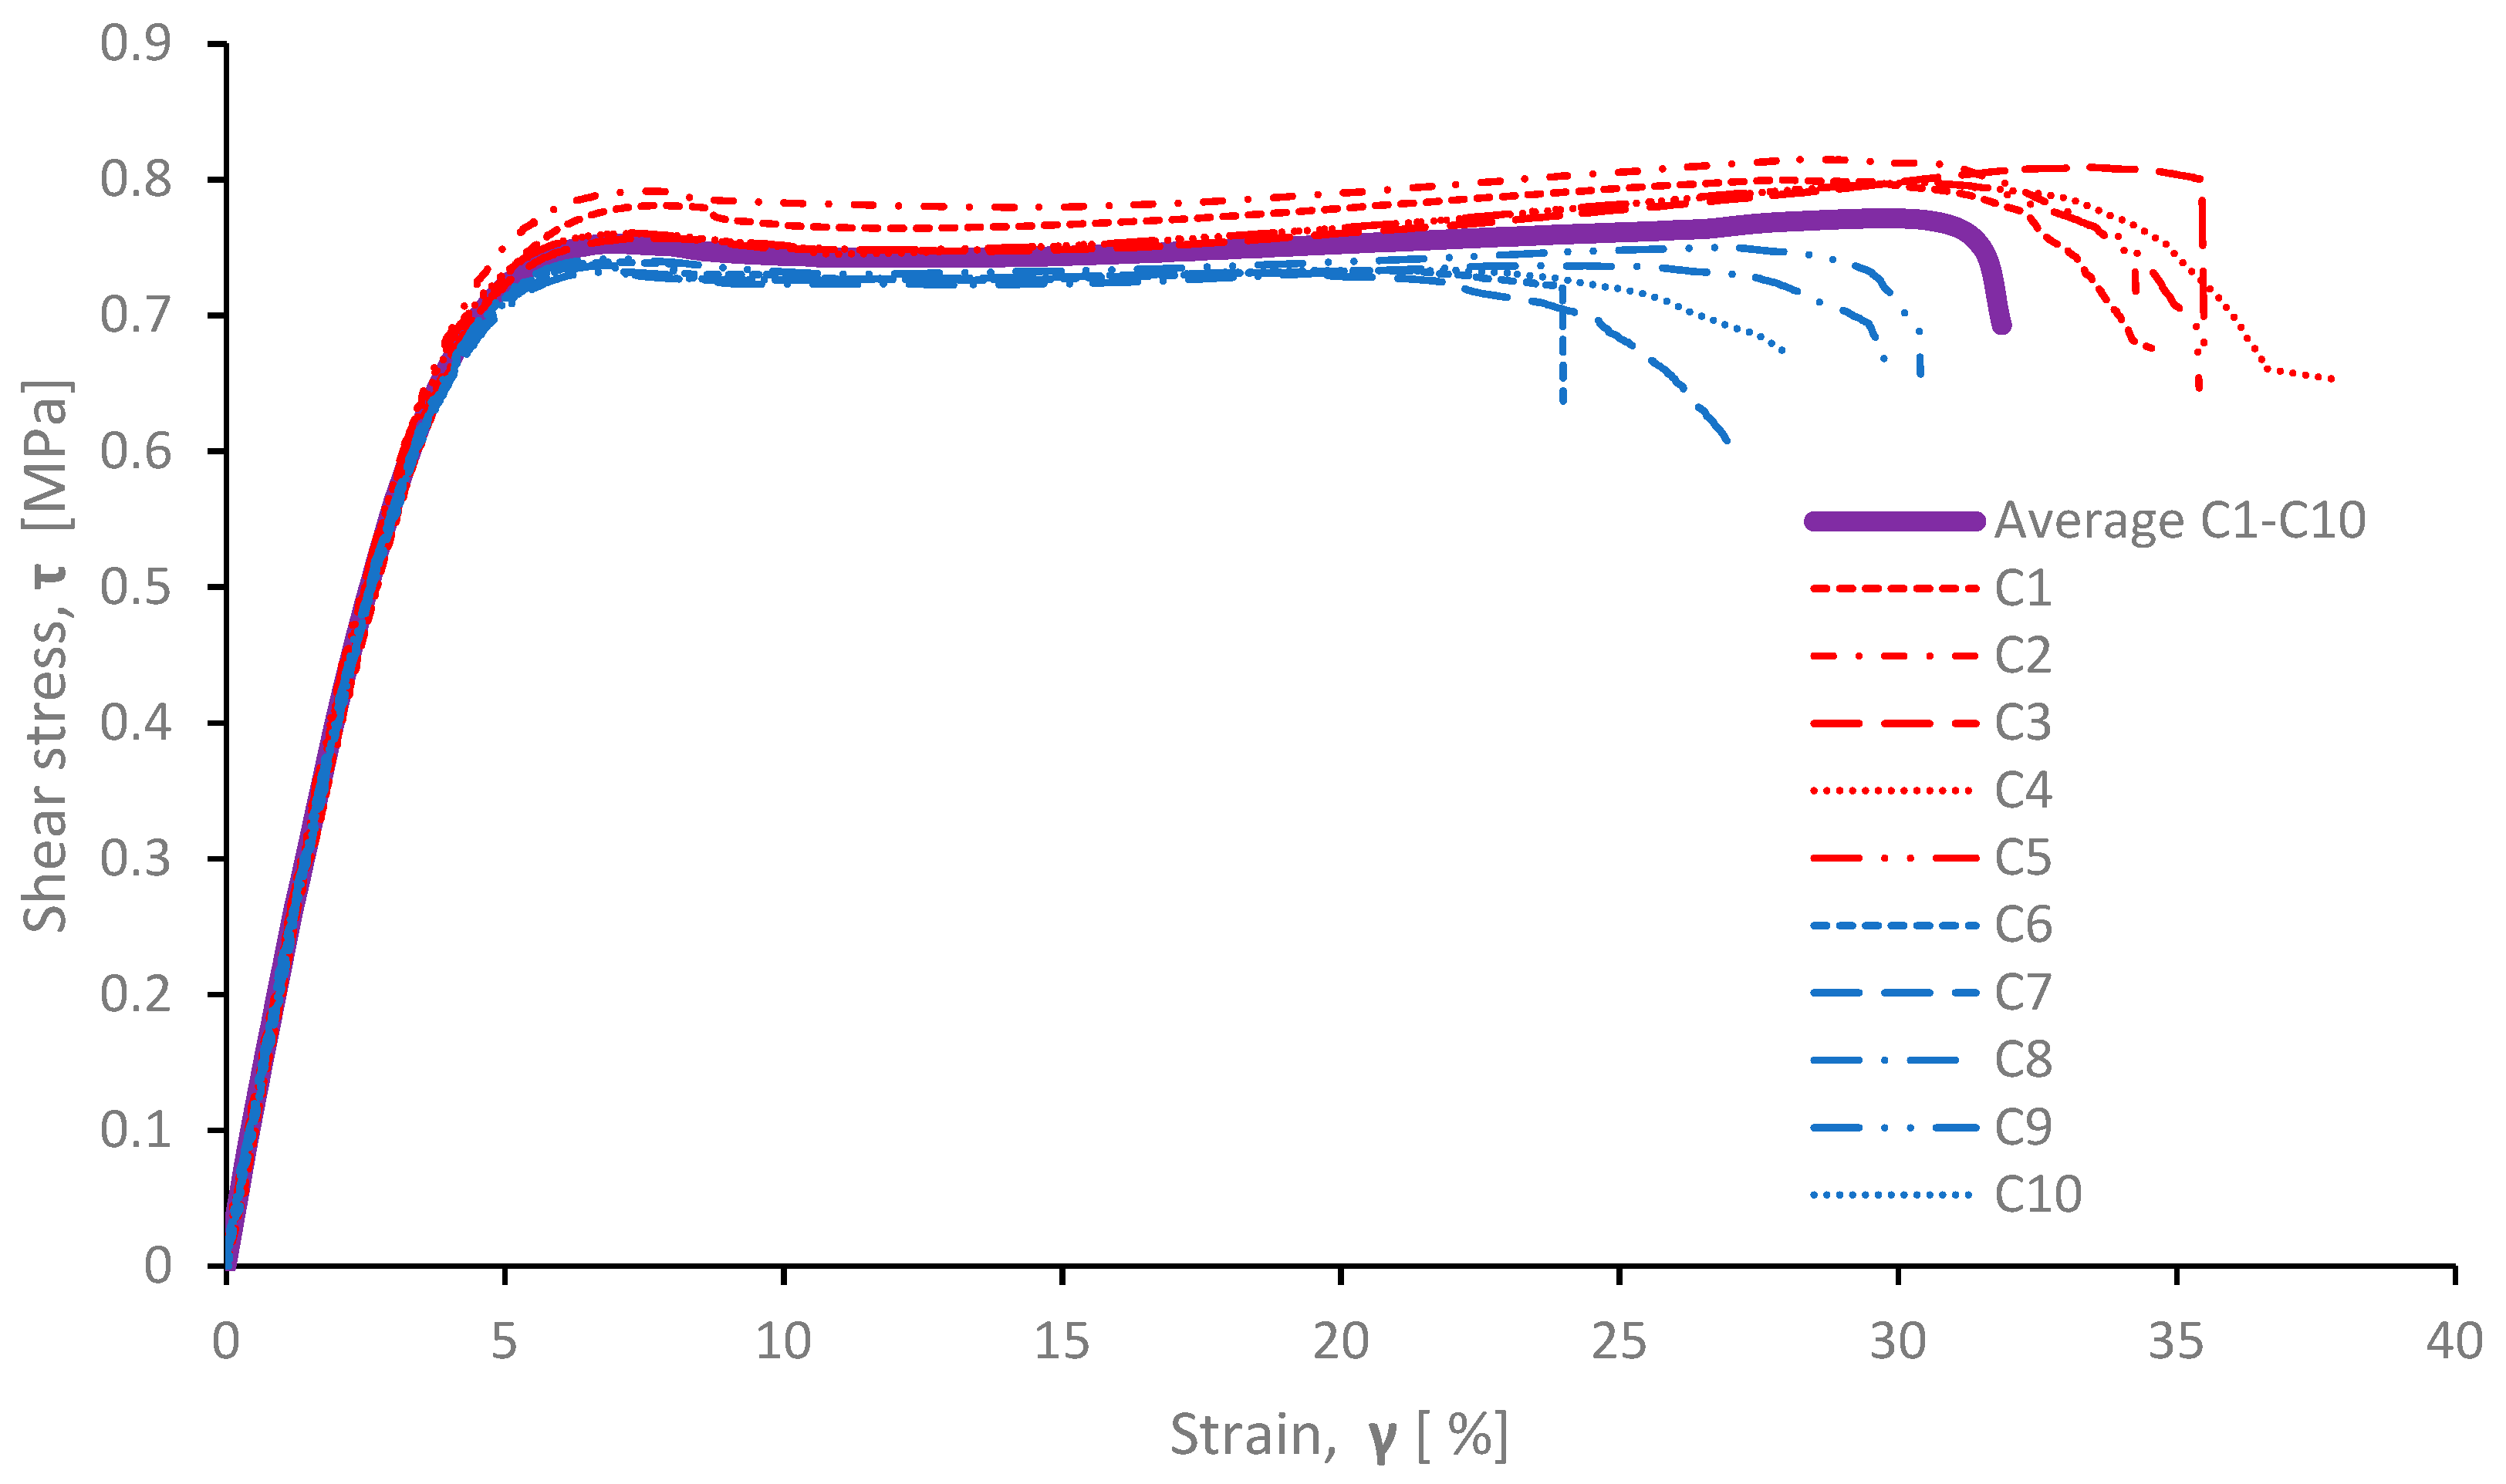
| C1 | 0.795 |
| C2 | 0.815 |
| C3 | 0.809 |
| C4 | 0.798 |
| C5 | 0.794 |
| C6 | 0.739 |
| C7 | 0.737 |
| C8 | 0.737 |
| C9 | 0.750 |
| C10 | 0.737 |
| Average C1–C10 | 0.771 |
Publisher’s Note: MDPI stays neutral with regard to jurisdictional claims in published maps and institutional affiliations. |
© 2022 by the authors. Licensee MDPI, Basel, Switzerland. This article is an open access article distributed under the terms and conditions of the Creative Commons Attribution (CC BY) license (https://creativecommons.org/licenses/by/4.0/).
Share and Cite
Bolf, D.; Zamarin, A.; Krolo, P.; Hadjina, M. Experimental Evaluation of Shear Properties of Lightweight PVC Core for Marine Application Using Digital Image Correlation System. J. Mar. Sci. Eng. 2022, 10, 280. https://doi.org/10.3390/jmse10020280
Bolf D, Zamarin A, Krolo P, Hadjina M. Experimental Evaluation of Shear Properties of Lightweight PVC Core for Marine Application Using Digital Image Correlation System. Journal of Marine Science and Engineering. 2022; 10(2):280. https://doi.org/10.3390/jmse10020280
Chicago/Turabian StyleBolf, Davor, Albert Zamarin, Paulina Krolo, and Marko Hadjina. 2022. "Experimental Evaluation of Shear Properties of Lightweight PVC Core for Marine Application Using Digital Image Correlation System" Journal of Marine Science and Engineering 10, no. 2: 280. https://doi.org/10.3390/jmse10020280
APA StyleBolf, D., Zamarin, A., Krolo, P., & Hadjina, M. (2022). Experimental Evaluation of Shear Properties of Lightweight PVC Core for Marine Application Using Digital Image Correlation System. Journal of Marine Science and Engineering, 10(2), 280. https://doi.org/10.3390/jmse10020280