Article

Effect of Bound Water Content on Secondary Compression of Three Marine Silty Clays

College of Construction Engineering, Jilin University, Changchun 130026, China
*
Author to whom correspondence should be addressed.
J. Mar. Sci. Eng. 2022, 10(2), 261; https://doi.org/10.3390/jmse10020261
Submission received: 14 December 2021 / Revised: 7 February 2022 / Accepted: 8 February 2022 / Published: 14 February 2022
(This article belongs to the Section Geological Oceanography)

Abstract

:
Secondary compression studies can provide insights for evaluating the engineering potential and environmental impact of soil. The objective of this research was to investigate the effect of bound water content on the secondary compression of marine silty clay. To this end, a novel method was established based on thermogravimetric analysis (TGA) to determine the contents and limits of strongly bound water and weakly bound water for three typical marine silty clays including Tianjin mucky silty clay (TJ), Qingdao mucky silty clay (QD), and Weihai silty clay (WH). A total of 17 groups of uniaxial confined compression tests were performed for reconstituted samples at different absolute water contents under the condition of multistage loading to investigate their secondary compression characteristics. The results show that the initial dehydration temperature of strongly bound water (Ts) corresponds to the peak of the derivative thermogravimetry (DTG) curve. The values of Ts for TJ, QD and WH are 112.35 °C, 109.67 °C and 118.46 °C, respectively. The initial dehydration temperatures of weakly bound water (Tw) for TJ, QD and WH are 55.26 °C, 52.56 °C and 56.56 °C, respectively. The secondary compression coefficient Cα changes little before the strongly bound water limit and increases dramatically as weakly bound water content increases at the same vertical stress. A piecewise linear model and a quadratic polynomial model are established for calculating the average secondary compression coefficient from bound water content. Weakly bound water is the determining factor controlling secondary compression. Increasing the bound water content weakens the connection force and friction force among the particles and the viscosity of weakly bound water. The results will guide decisions on long-term settlement assessment and facilitate understanding of the secondary compression mechanism of marine silty clays affected by bound water.

1. Introduction

Clays have been widely used in environmental, engineering and agricultural fields as adsorption materials [1], liners for sanitary landfills [2], embankment dams, roadbeds [3,4], foundation materials, hydraulic barriers, and barrier layers for nuclear waste [5]. Therefore, the compression of clays has been a research hotspot in the dehydration of sludge, subgrade settlement [6,7], nuclear waste treatment [5], and the risk assessment of agricultural soils [8]. Marine silty clays usually have particularly high water contents and high void ratios due to their special mineral and granular composition and, therefore, present with high compressibility, low bearing capacity and prominent creep behavior. With the rapid development of the economy and construction in coastal cities around the world, post-construction settlement assessment, underground space design [9] and reclamation projects [10,11,12] have become important topics in the areas of marine silty clays. In this context, a compression study on marine silty clays is critical for providing theoretical evidence for reclamation planning and environmental impact assessment.
Uniaxial confined compression for clays typically consists of two processes: primary and secondary compression. Secondary compression (creep) is related to continuous readjustment of clay particles and pore water, which is manifested as continuous vertical deformation with time under an approximately constant stress after primary compression [13,14]. It is generally recognized that creep behavior is essential in evaluating long-term deformation (post-construction settlement) [15]. Secondary compression is a long-term process that often requires experiments or models to predict. The secondary compression coefficient (Cα) is the most widely used parameter for describing and predicting secondary compression with conciseness and general applicability [13,14,16].
Water content and Atterberg limits (liquid limit and plastic limit) significantly influence secondary compression, which mainly manifests as the effect of water content on deformation [17] and Cα [18,19,20]. The main criticism of existing studies is the oversimplification of the compression mechanism, and the different pore water types and their effects are not properly considered. The liquid limit and plastic limit in fact have a certain correspondence with bound water in soil. In-depth analysis of the effect of bound water on secondary compression is required, which can also improve the understanding of clay compression under dry–wet cycle conditions.
Pore water in clay includes bound water, which is composed of polar water molecules that are closely attached to the clay particle surfaces, and outside free water [21,22]. Bound water can be further classified as strongly bound water (SBW) and weakly bound water (WBW) based on the difference in the interactive forces and water–particle distances. SBW is tightly adsorbed on the surface of soil particles including closely arranged water molecules, with high viscosity. WBW lies outside SBW with weaker connections and is susceptible to damage from increases in the stress or temperature compared to SBW. The different properties of SBW and WBW determine their different impacts on secondary compression. Few studies have been concerned with the effects and mechanisms of bound water on clay secondary compression. The major problem is the determination and classification of bound water. Previous techniques used to determine and classify bound water are mainly X-ray diffraction (XRD) [23], dilatometric tests [24], centrifugal setting tests [25], isothermal adsorption tests [22,26], volumetric flask method [27], drying tests [28] and nuclear magnetic resonance (NMR) [29]. These approaches reflect the continuing richness and deepening of experimental techniques and provide a theoretical and technological basis for the quantitative investigation of bound water but also have limitations, especially in accuracy. The accuracy offered by thermogravimetric analysis (TGA) has resulted in this method being widely applied in the measurement of bound water in various soils [21,22,28,30,31]. The main disadvantage of TGA is the absence of uniform standards for the partition between SBW and WBW. The classification criteria that rely only on thermogravimetry (TG) curves cannot address complex dehydration features that occur in some soils with complex mineral compositions [22]. Therefore, effective testing methods and classification criteria for bound water are the focus of future research and the basis for further analysis of the effect of bound water on the compression of clay.
This study shows how different types of bound water affect the secondary compression through thermogravimetric analysis on three typical marine silty clays and a series of uniaxial confined compression tests on three sets of reconstituted samples with different bound water contents. The objectives of this research were to (1) classify the bound water and determine the SBW limit and WBW limit for each marine silty clay and (2) quantitatively investigate the effect of bound water content on Cα and discuss the mechanism.

2. Materials and Methods
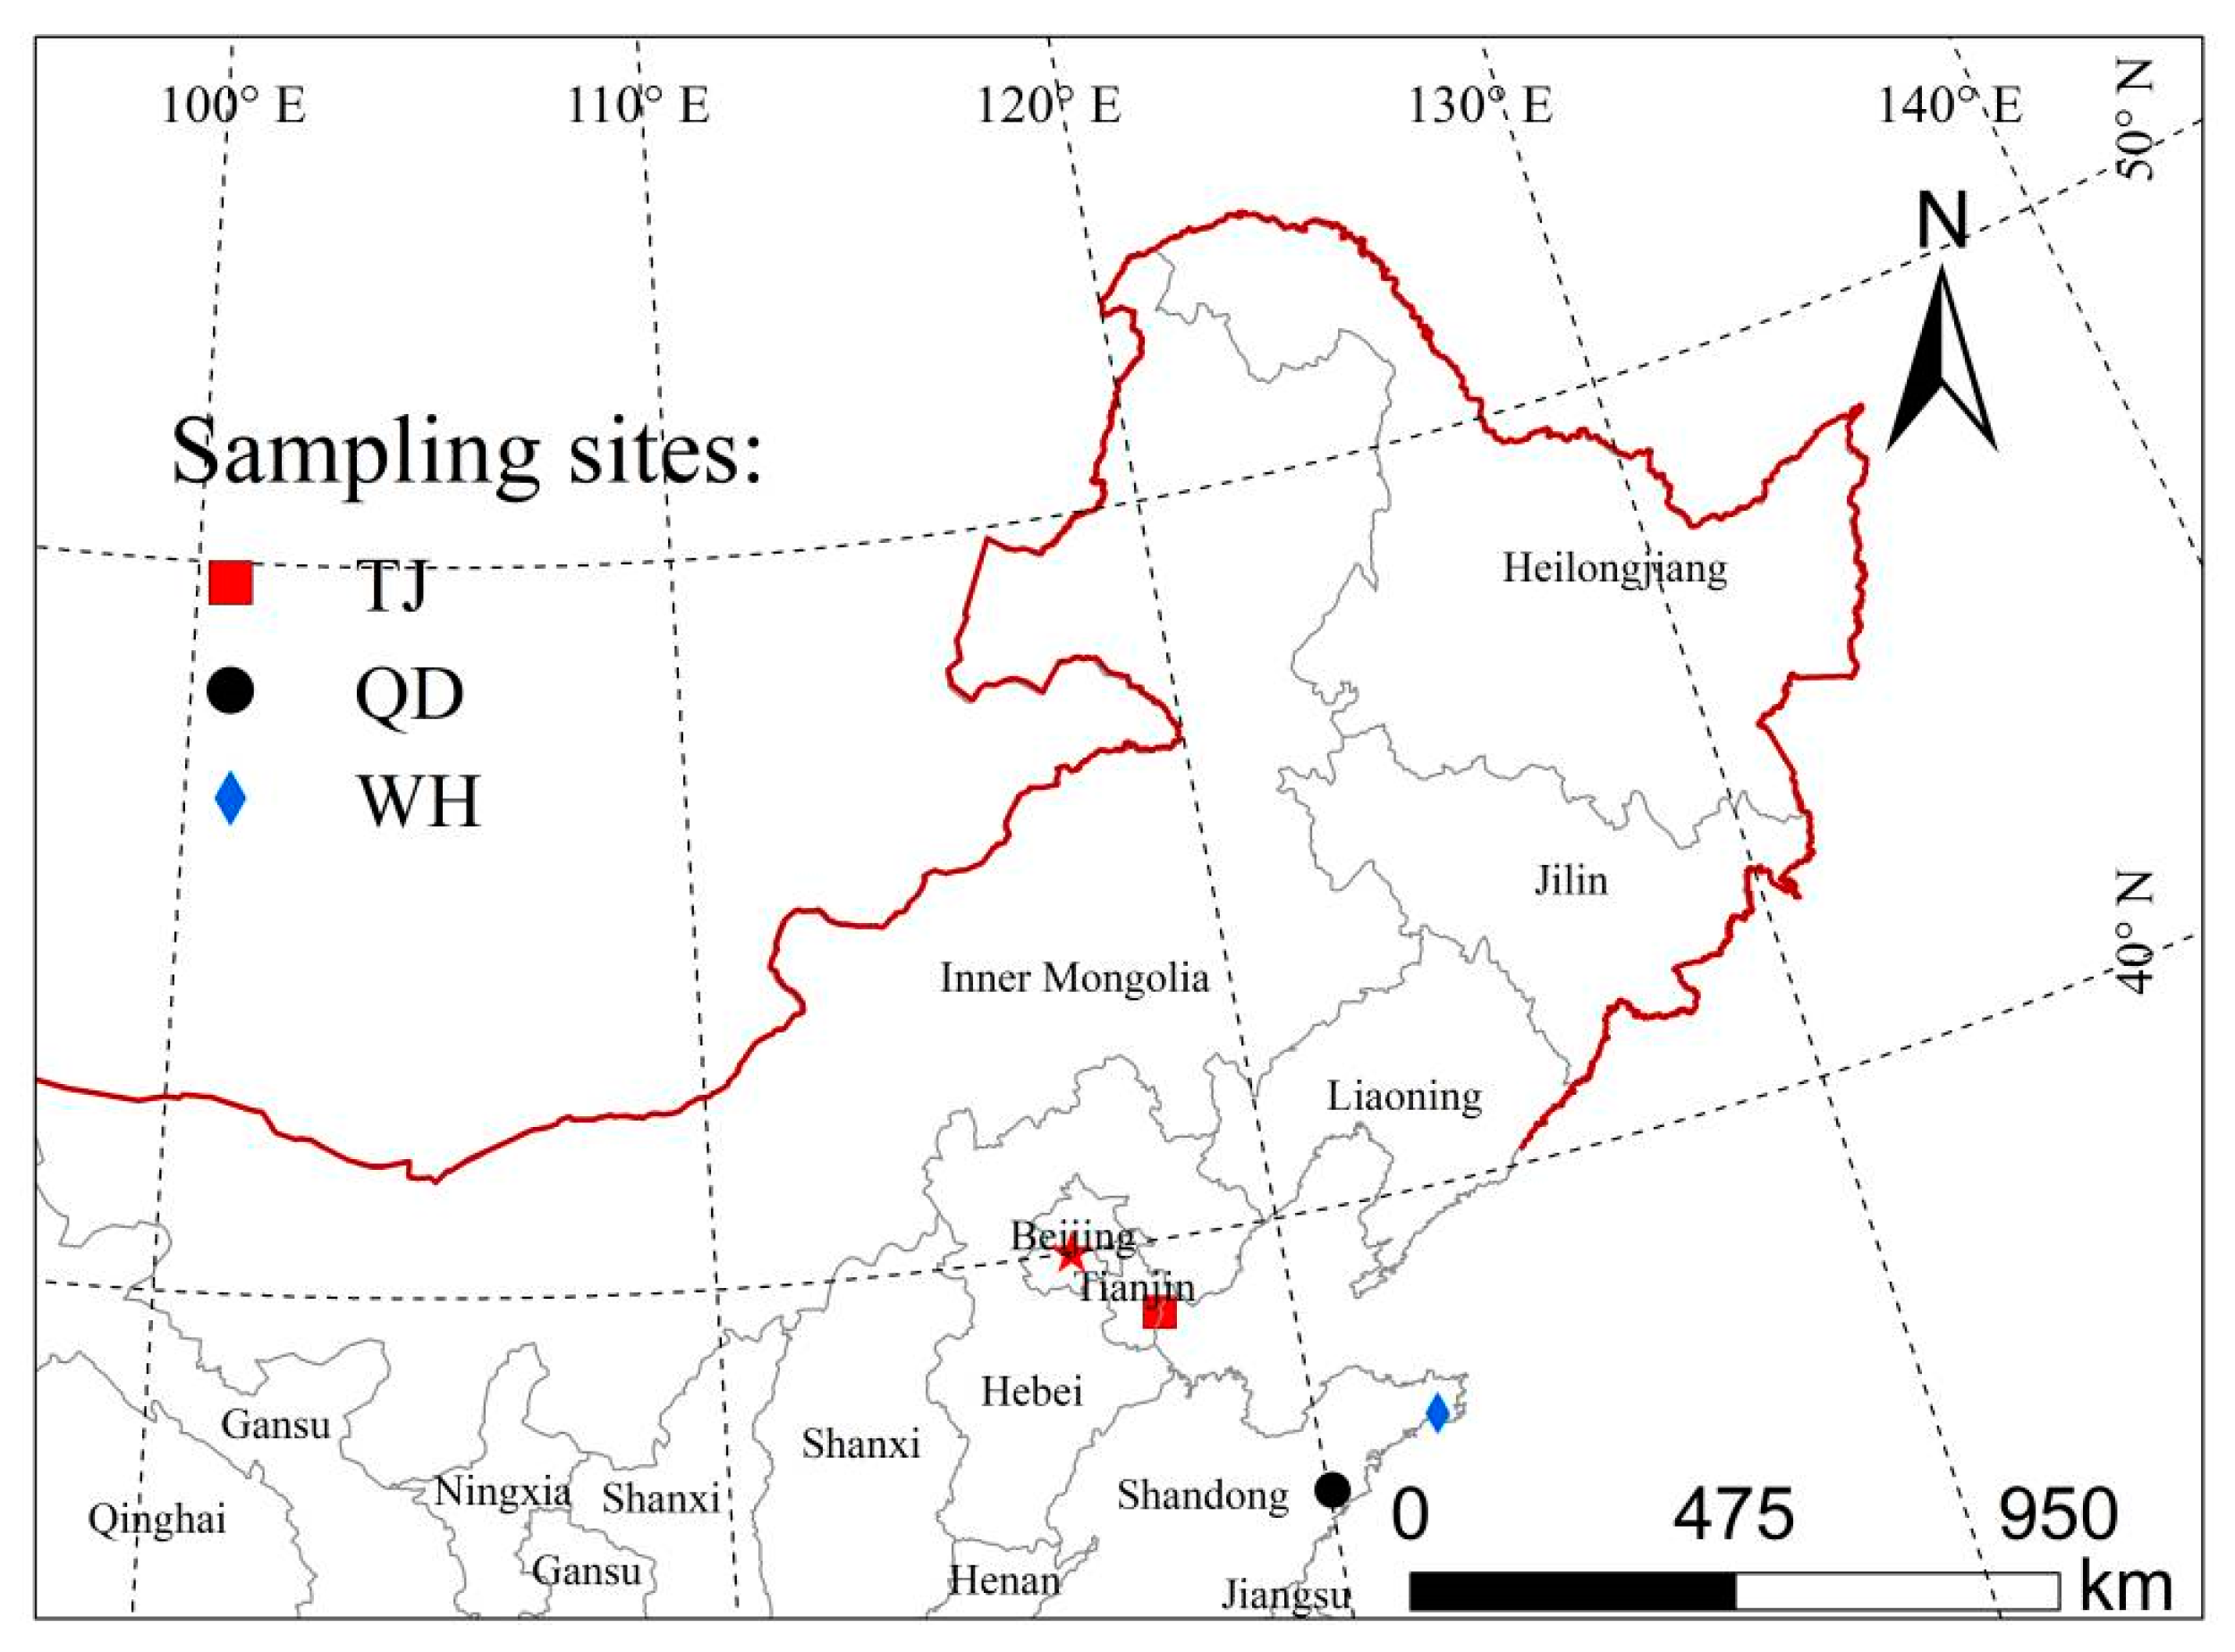
2.1. Samples

To examine the compression properties of marine silty clays over a wide range of bound water contents, three sets of typical samples were selected, as listed in Table 1, from three different locations in the coastal areas of China: Tianjin, Qingdao, and Weihai (Figure 1). The first set of samples in this paper, called Tianjin clay (TJ), was sampled from Binhai New District of Tianjin at a depth of 3.5–8.0 m (layer thickness of 1.5–4.7 m) and comprised gray, shiny, saturated Quaternary Holocene marine sedimentary mucky silty clay in a liquid plastic state. The second set of samples, called Qingdao clay (QD), was taken from a depth of 6.0–13.0 m (layer thickness of 3.4–8.2 m) [22] in northern Kiaochow Bay and comprised ash black, pure, saturated, Quaternary marine sedimentary mucky silty clay in a liquid plastic state. The third set of samples, called Weihai clay (WH), was taken from Wendeng District in Weihai and comprised gray brown, shiny, saturated Quaternary Holocene marine sedimentary silty clay. TJ and QD had water content higher than the liquid limit but the opposite was the case with WH.
Table 1 is a summary of the physical parameters, grain fractions, mineral components, and chemical components of the three sets of samples. Variation in water contents, ranging from 24.6% to 33.9%, was observed. For each soil, the contents of clay (<0.005 mm), silt (0.075–0.005 mm) and sand (2–0.075 mm) were determined based on an assay method combining sieving and hydrostatic sedimentation. The clay (<0.005 mm) contents of TJ, QD and WH are 38.52%, 20.62%, and 17.77%, respectively. Methylene blue (MB) spot tests were applied to measure the specific surface area (SSA) of soils based on the EN933-9 standard [32,33]. The SSA values for TJ, QD and WH are 114.2 m2/g, 83.2 m2/g, and 69.3 m2/g, respectively. The SSA values are positively correlated with the clay contents
X-ray diffraction (XRD) (tube voltage: 40 kV, measuring range: 2.6–45 degrees) and X-ray fluorescence (XRF) spectrometry were used to identify the mineral and chemical components of the soils, respectively. The primary minerals in the three soils consist of quartz, feldspar, calcite and pyrite, which are often the main components of silts. Therefore, the silt content of TJ is the lowest of the three. The secondary minerals in the three soils consist of four clay minerals, illite/smectite mixed layer, illite, kaolinite and chlorite, of which the illite/smectite mixed layer is absolutely dominant, followed by illite, and the contents of chlorite and kaolinite are relatively low. TJ has the highest amount of clay minerals of the three studied marine silty clays, accounting for 33% of the total minerals, indicating that the weathering degree of TJ is the highest of the three soils. With a large number of primary minerals remaining and a low weathering degree, QD and WH have similar amounts of clay minerals, accounting for 17.4% and 18.1% of the total minerals, respectively. Clay minerals are fine-grained and hydrophilic, with poor permeability and high compressibility, and are the material basis of bound water and directly impact the engineering properties of soil. The clay mineral contents in the clays of the three regions coincide well with their clay-size particles content. SiO2 has the highest content in the chemical components of the three clays, accounting for 60.58% (TJ), 74.51% (QD), and 69.22% (WH). Al2O3 ranks second, accounting for 12.63% (TJ), 11.50% (QD), and 12.16% (WH). The main reason for the high SiO2 content is the high quartz content. Al2O3 and K2O are associated with feldspar, illite, and the illite/smectite mixed layer.

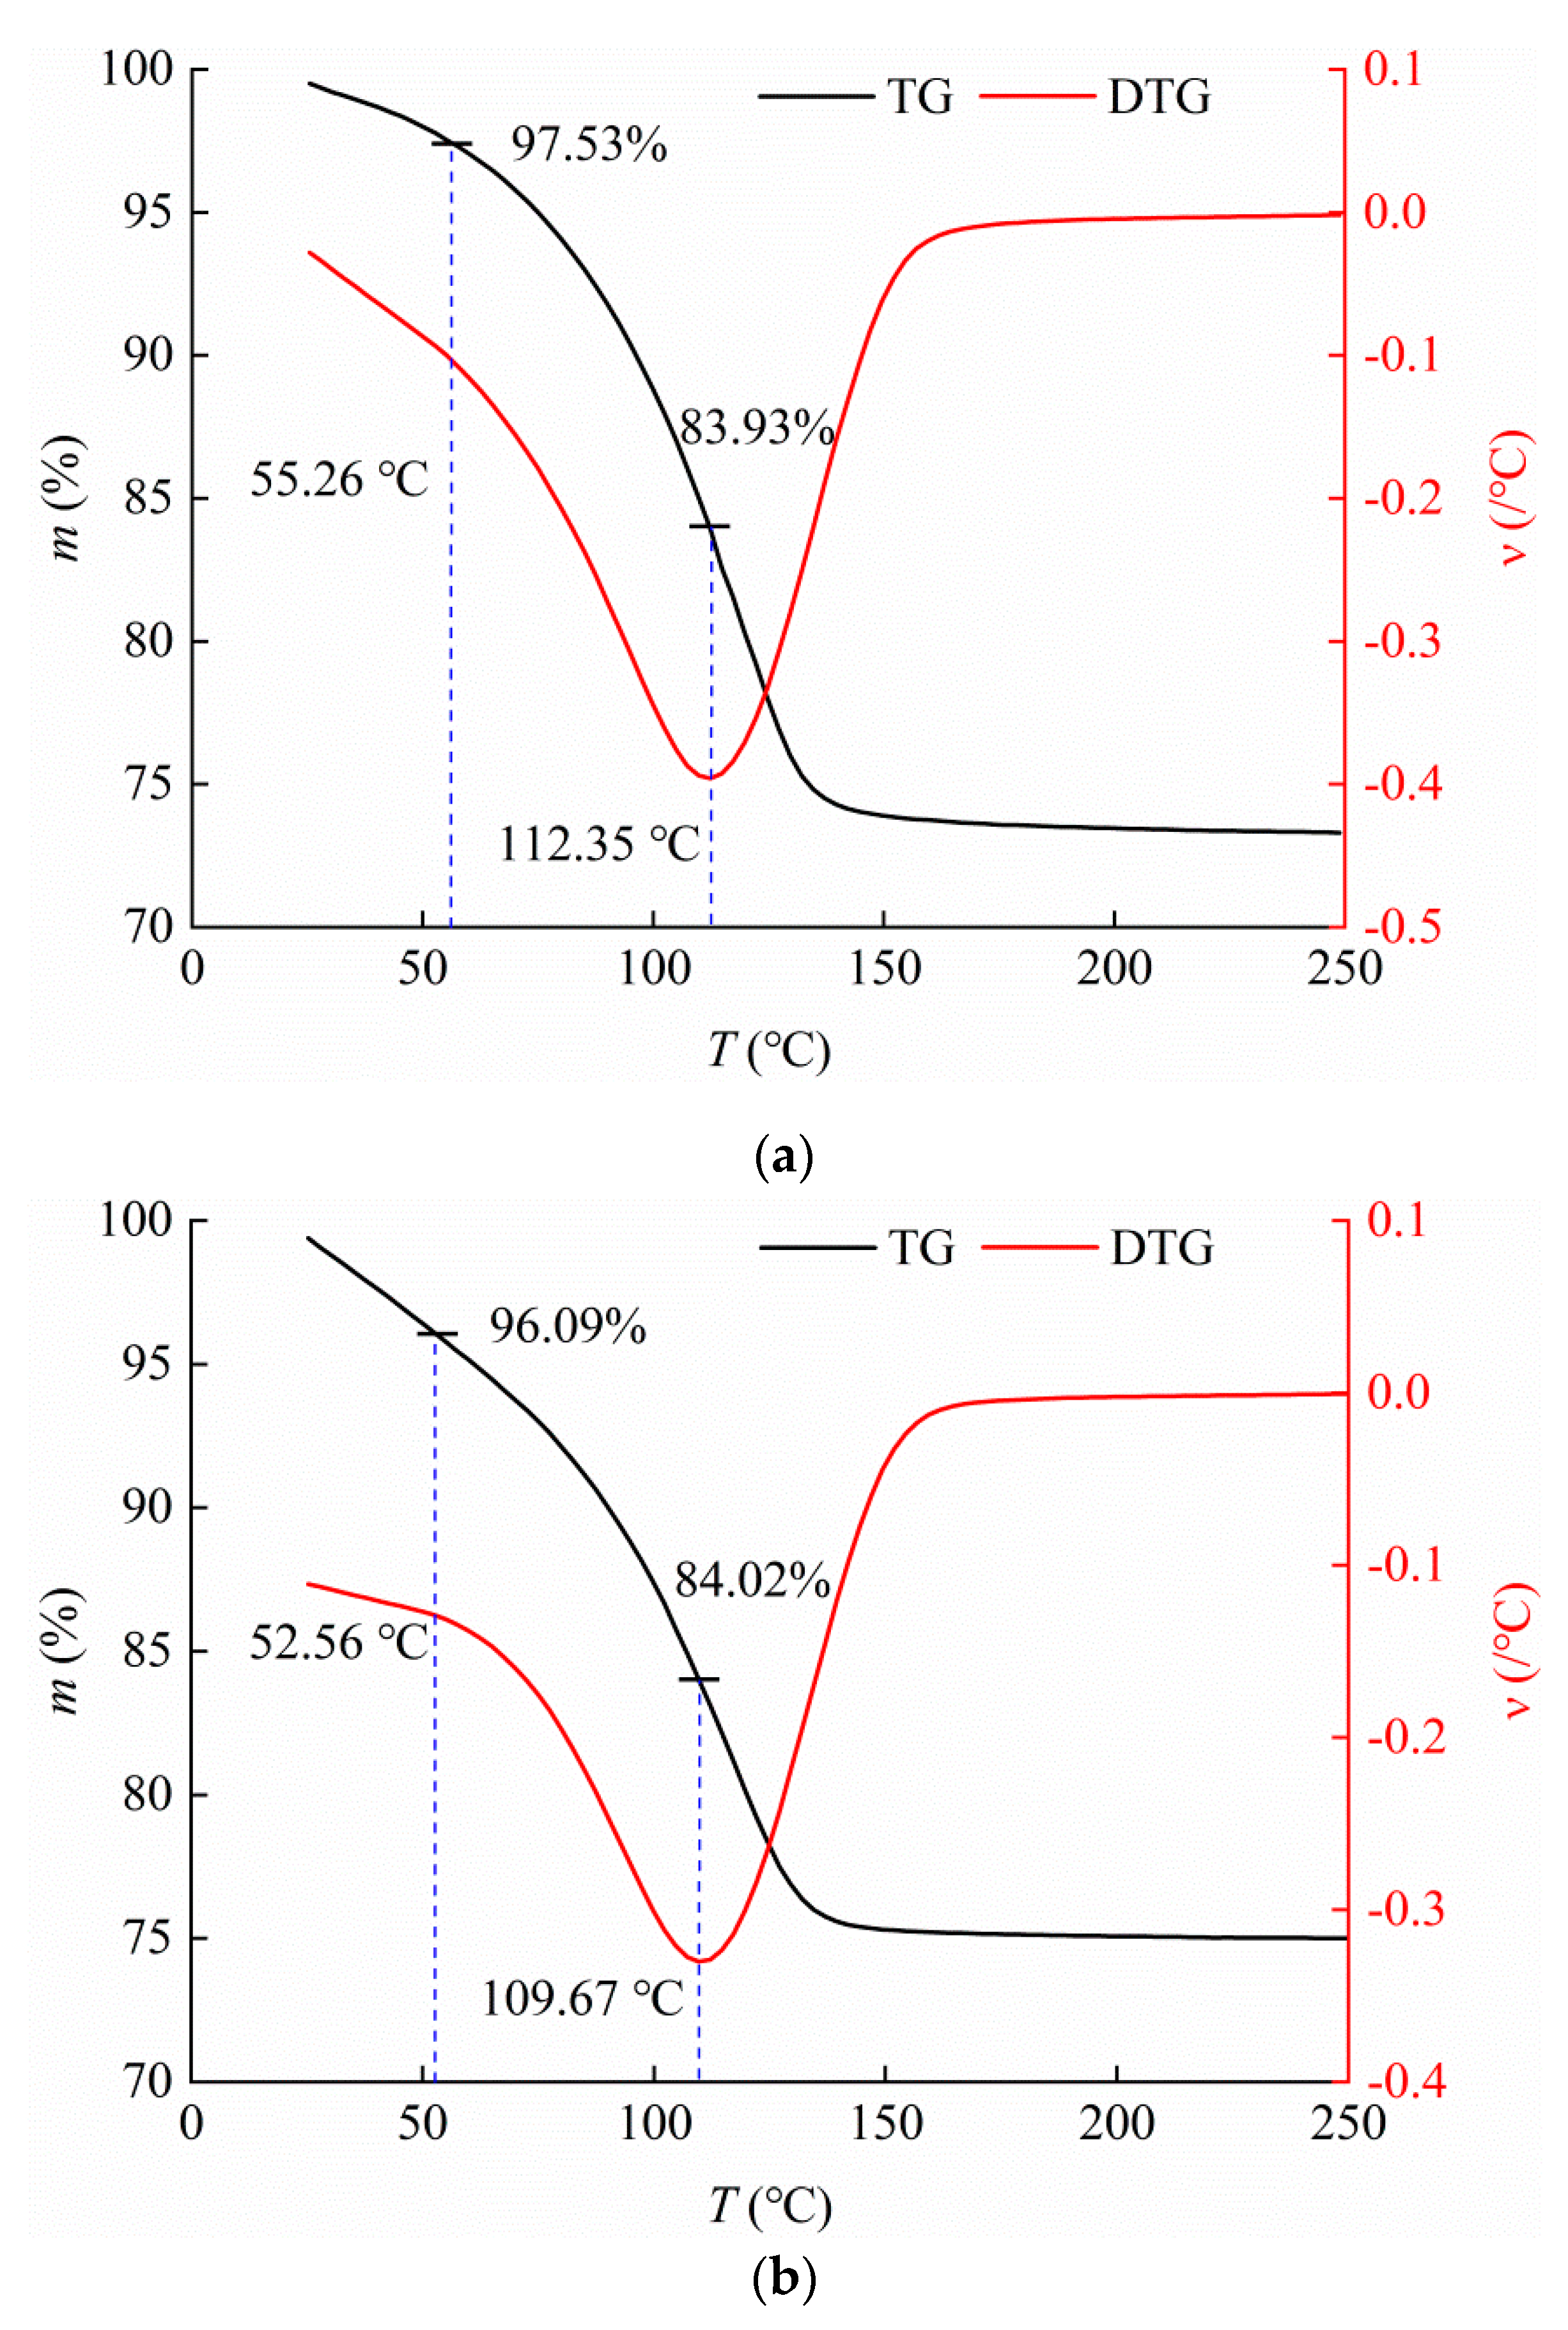
2.2. Thermogravimetric Analysis (TGA)

TGA was performed on the TJ, QD and WH samples using a Netzsch STA 449F3 synchronous thermal analyzer to determine and classify bound water, as the water separation from the surface of particles varies in quality and speed at different temperatures. Each test specimen was directly inserted into a crucible and heated from room temperature (25 °C) to 900 °C at a rate of 10 °C/min under a nitrogen atmosphere [22,34]. The mass loss of the sample and temperature ranges corresponding to different dehydration stages were determined from the thermogravimetry (TG) and derivative thermogravimetry (DTG) curves.

2.3. Uniaxial Confined Compression Tests

As bound water in clay can be removed in the temperature range of 200–250 °C [22,31,34], for each soil, air-dried soil was crushed, passed through a 2 mm sieve, and then dried at 250 °C to a constant mass to ensure that bound water was completely removed. Furthermore, rather than the water content (ω) measured by the traditional oven drying method (where the sample was heated at 100–110 °C for 24 h), the concept of “absolute water content” (ωa) was introduced to represent the mass of water removed from the soil by heating at 250 °C until no more mass was lost and to represent the pore water content in the soil.
The targeted values and ωa values measured for 17 sets of reconstituted samples (TJ-1~TJ-6, QD-1~QD-6, and WH-1~WH-5) by uniaxial confined compression tests are shown in Table 2. The preparation procedures of each sample consisted of adding a calculated amount of distilled water to the entirely dried clay and completely mixing it. Then, the moist clay was stored in sealed plastic bags for 24 h to achieve a uniform water content. The reconstituted samples were prepared to a diameter of 61.8 mm and a height of 20 mm by controlling the dry density, that is, samples in the same region maintained the same dry density (void ratio).
A sum of 17 groups of uniaxial confined compression tests (one-dimensional consolidation tests) were implemented to investigate the effect of bound water content on the secondary compression characteristics using leveraged high-pressure oedometers on reconstituted samples at different ωa values under multistage loading and double drainage conditions. The test temperature was constant at 22 ± 1 °C during the program. The inner wall of the highly polished stainless-steel ring-knife was coated with a thin film of Vaseline to minimize ring friction. Loading was performed on each sample in steps at a loading ratio of 1, as shown in Table 2. Loading lasted 7 days, even though the deformation had stabilized (the stability standard at each load level was that the deformation in 1 d was less than 0.01 mm). Three identical duplicate samples were measured in each group under the same test conditions. The middle curve of the three curves obtained was taken as the representative result for that condition.

3. Results

3.1. Demarcation Temperatures and Dehydration Phases

SBW and WBW have been demonstrated to correspond to different dehydration temperatures in a continuous heating process [22,28,31,34]. Figure 2 illustrates the staged dehydration characteristics of three marine silty clays. The pore water in the three soils can be released from 200 °C to 250 °C, which suggests that traditional oven-drying cannot remove all bound water. Unlike a single mineral, naturally deposited marine silty clay mostly has a complex mineral composition and, therefore, has a heterogeneous surface and complex dehydration process without conspicuous steps in its TG curve. Considering this situation, an integrated approach incorporating TG and DTG curves was developed to identify and distinguish the different stages of the thermal reaction and distinguish between SBW and WBW by introducing a DTG curve, which has a higher resolution than the TG curve, rather than using the TG curve alone.
The dehydration process of TJ can be segmented into three phases based on the TG-DTG curves. Two demarcation temperatures appear at 55.26 °C and 112.35 °C. The first phase is from room temperature to 55.26 °C. The sample mass slowly decreases with temperature, which manifests as a gentle oblique straight line in the DTG curve. This phase represents the dehydration process of free water. The second phase is from 55.26 °C to 112.35 °C. The mass loss rate of the sample increases with increasing temperature until it reaches the maximum. This phase represents the dehydration process of WBW. The third phase is from 112.35 °C to 250 °C. The mass loss rate decreases with increasing temperature, indicating the release of a new type of water, i.e., SBW [22,34].
The TG-DTG curves of QD and WH were similar to those of TJ, with three phases present. The first phase is from room temperature to 52.56 °C for QD, representing the dehydration process of free water. The second phase is from 52.56 °C to 109.67 °C, reflecting the dehydration of WBW. The third phase starts at 109.67 °C, with a gradually reduced mass loss rate, which represents the dehydration of SBW. For WH, the three temperature intervals are from room temperature to 56.56 °C, from 56.56 °C to 118.46 °C, and 118.46 °C upwards.
The initial temperature for the second phase, which is the temperature limit of free water and WBW, is also referred to as the initial dehydration temperature of WBW (Tw). The values of Tw for TJ, QD and WH are 55.26 °C, 52.56 °C and 56.56 °C, respectively, which are similar to those already found (release of WBW on a clay surface begins at approximately 60 °C) by Morin and Silva [35]. The clearest temperature limit occurs at the peak of the DTG curve, which corresponds to the maximum mass loss rate (reaction rate) and is also referred to as the initial dehydration temperature of SBW (Ts). The values of Ts for TJ, QD and WH are 112.35 °C, 109.67 °C and 118.46 °C, respectively.

3.2. Contents and Limits for Strongly Bound Water (SBW) and Weakly Bound Water (WBW)

The contents of SBW (ωs) and WBW (ωw) can be identified by the mass losses in their corresponding temperature intervals based on TG curves. The values of ωs for saturated TJ, QD and WH are 14.49%, 12.03% and 9.99%, respectively. The values of ωw for saturated TJ, QD and WH are 18.55%, 16.09% and 13.63%, respectively. QD and WH record the highest and lowest contents of free water among the three soils, 5.21% and 1.84%, respectively. The results based on the three marine silty clays indicate that ωs and ωw both have a significantly positive correlation with specific surface area (SSA) and clay (< 0.005 mm) content.
Furthermore, the SBW limit and the bound water limit (ωb) can be determined based on the values of ωs and ωw for saturated TJ, QD and WH, which represent the maximum contents of SBW and bound water in the soil at a specific void ratio, respectively. The SBW limit accounts only for the contents of SBW (ωs) in saturation. The values of ωb for TJ, QD and WH are 33.04%, 28.12% and 23.62%, respectively.

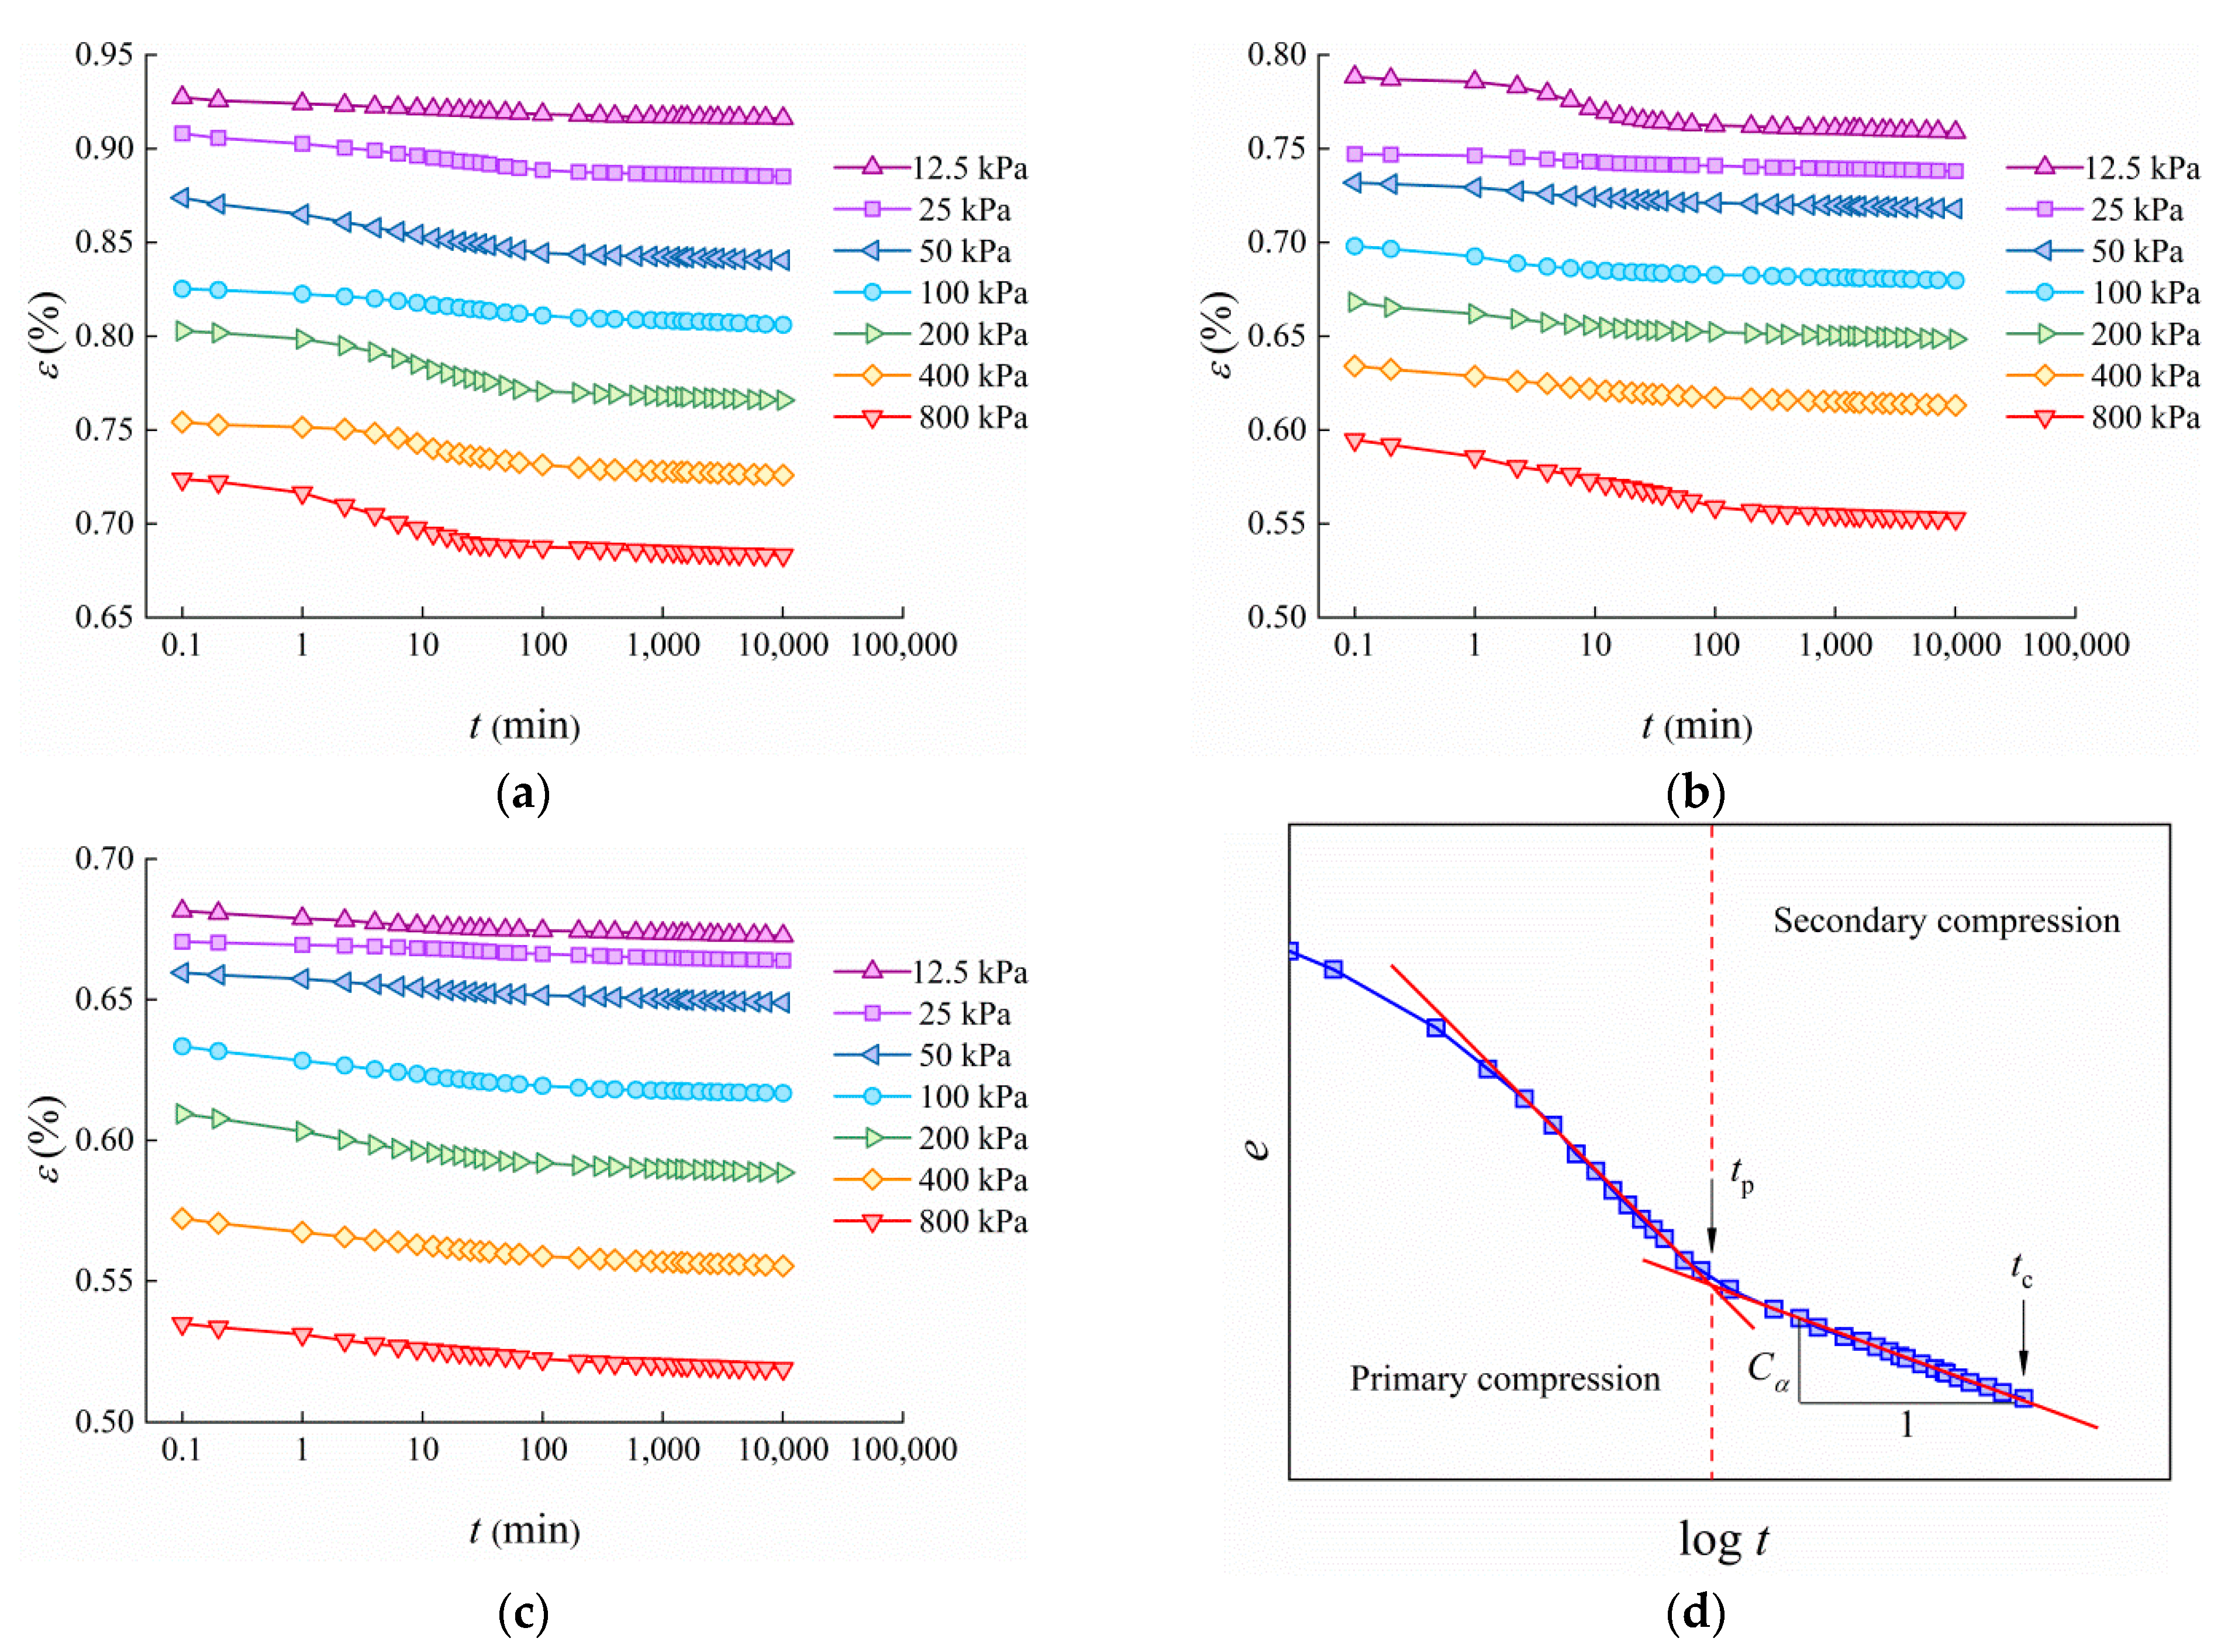
3.3. Secondary Compression Characteristics for Reconstituted Samples

Vertical strain-time (εt) curves (Figure 3) of reconstituted samples under different vertical stresses all present typical decay creep characteristics. The overall trend is manifested as a certain amount of transient strain at the moment of loading, which increases with vertical stress ( σ v ). After transient deformation, ε gradually enters the decay and stable creep phase. Strain increases with time with decreasing growth rate. None of the εt curves have a sharp flow stage. The vertical strain increases with the absolute water content at the same vertical stress and time (Figure 3a–d). TJ has the highest vertical strain in the three soils at similar absolute water contents (Figure 3c,e,f) and the same vertical stress and time, followed by QD and WH, which is due to the difference in the void ratios of the three soils.
The compression process can also be properly indicated by the void ratio versus the logarithm of the time (elog t) curves (Figure 4a–c). The elog t curve exhibits an inverse S-shaped characteristic, which mainly consists of a parabolic phase (primary compression) and a nearly linear gentle phase (secondary compression). The intersection of two phases marks the end of primary compression (EOP). The horizontal coordinate for the EOP point is tp and the corresponding void ratio is ep. Cα is defined as the slope of the elog t curve in the linear phase, as shown in Equation (1) and Figure 4d:
C a = e / ( l o g t c l o g t p )
where tp is the time at the EOP; tc is the computing time; and Δe is the void ratio variation from tp to tc.
Figure 5 demonstrates Cα as a function of vertical stress for TJ, QD and WH at different absolute water contents. In most cases, Cα increases with increasing vertical stress to a peak and slowly decreases, thereafter. Most of the Cα values display peaks at 200 kPa or 400 kPa. In a few cases, Cα increases from 400 kPa to 800 kPa.

4. Discussion

4.1. Determination and Classification of Bound Water

One of the aims of this study was to determine and classify the bound water in marine silty clay. Although TGA has an advantage in measuring accuracy [22,34] for bound water in contrast to other methods [24,25,26,27], there are no uniform standards to distinguish between SBW and WBW by TGA [21,28,30,31]. To solve this problem, a more universal and definitive method is proposed based on TG and DTG curves to classify pore water in the specimen.
This method uses intuitive and concrete demarcation temperatures including Ts and Tw (Figure 2) instead of stipulated temperatures [28,31] and steps on the TG curves [21], and therefore has a wider range of applications and higher accuracy, especially for some soils without obvious phasing characteristics in their dehydration intervals. Note that the initial dehydration temperatures (Ts and Tw) are diverse for different soils and are both variables that are influenced by mineral composition, water content and other physico-chemical properties of soils. Marine silty clays in three different regions have produced similar results for the values of Ts and Tw. These good coincidences verify the validity of the TG-DTG approach for the determination and classification of bound water.

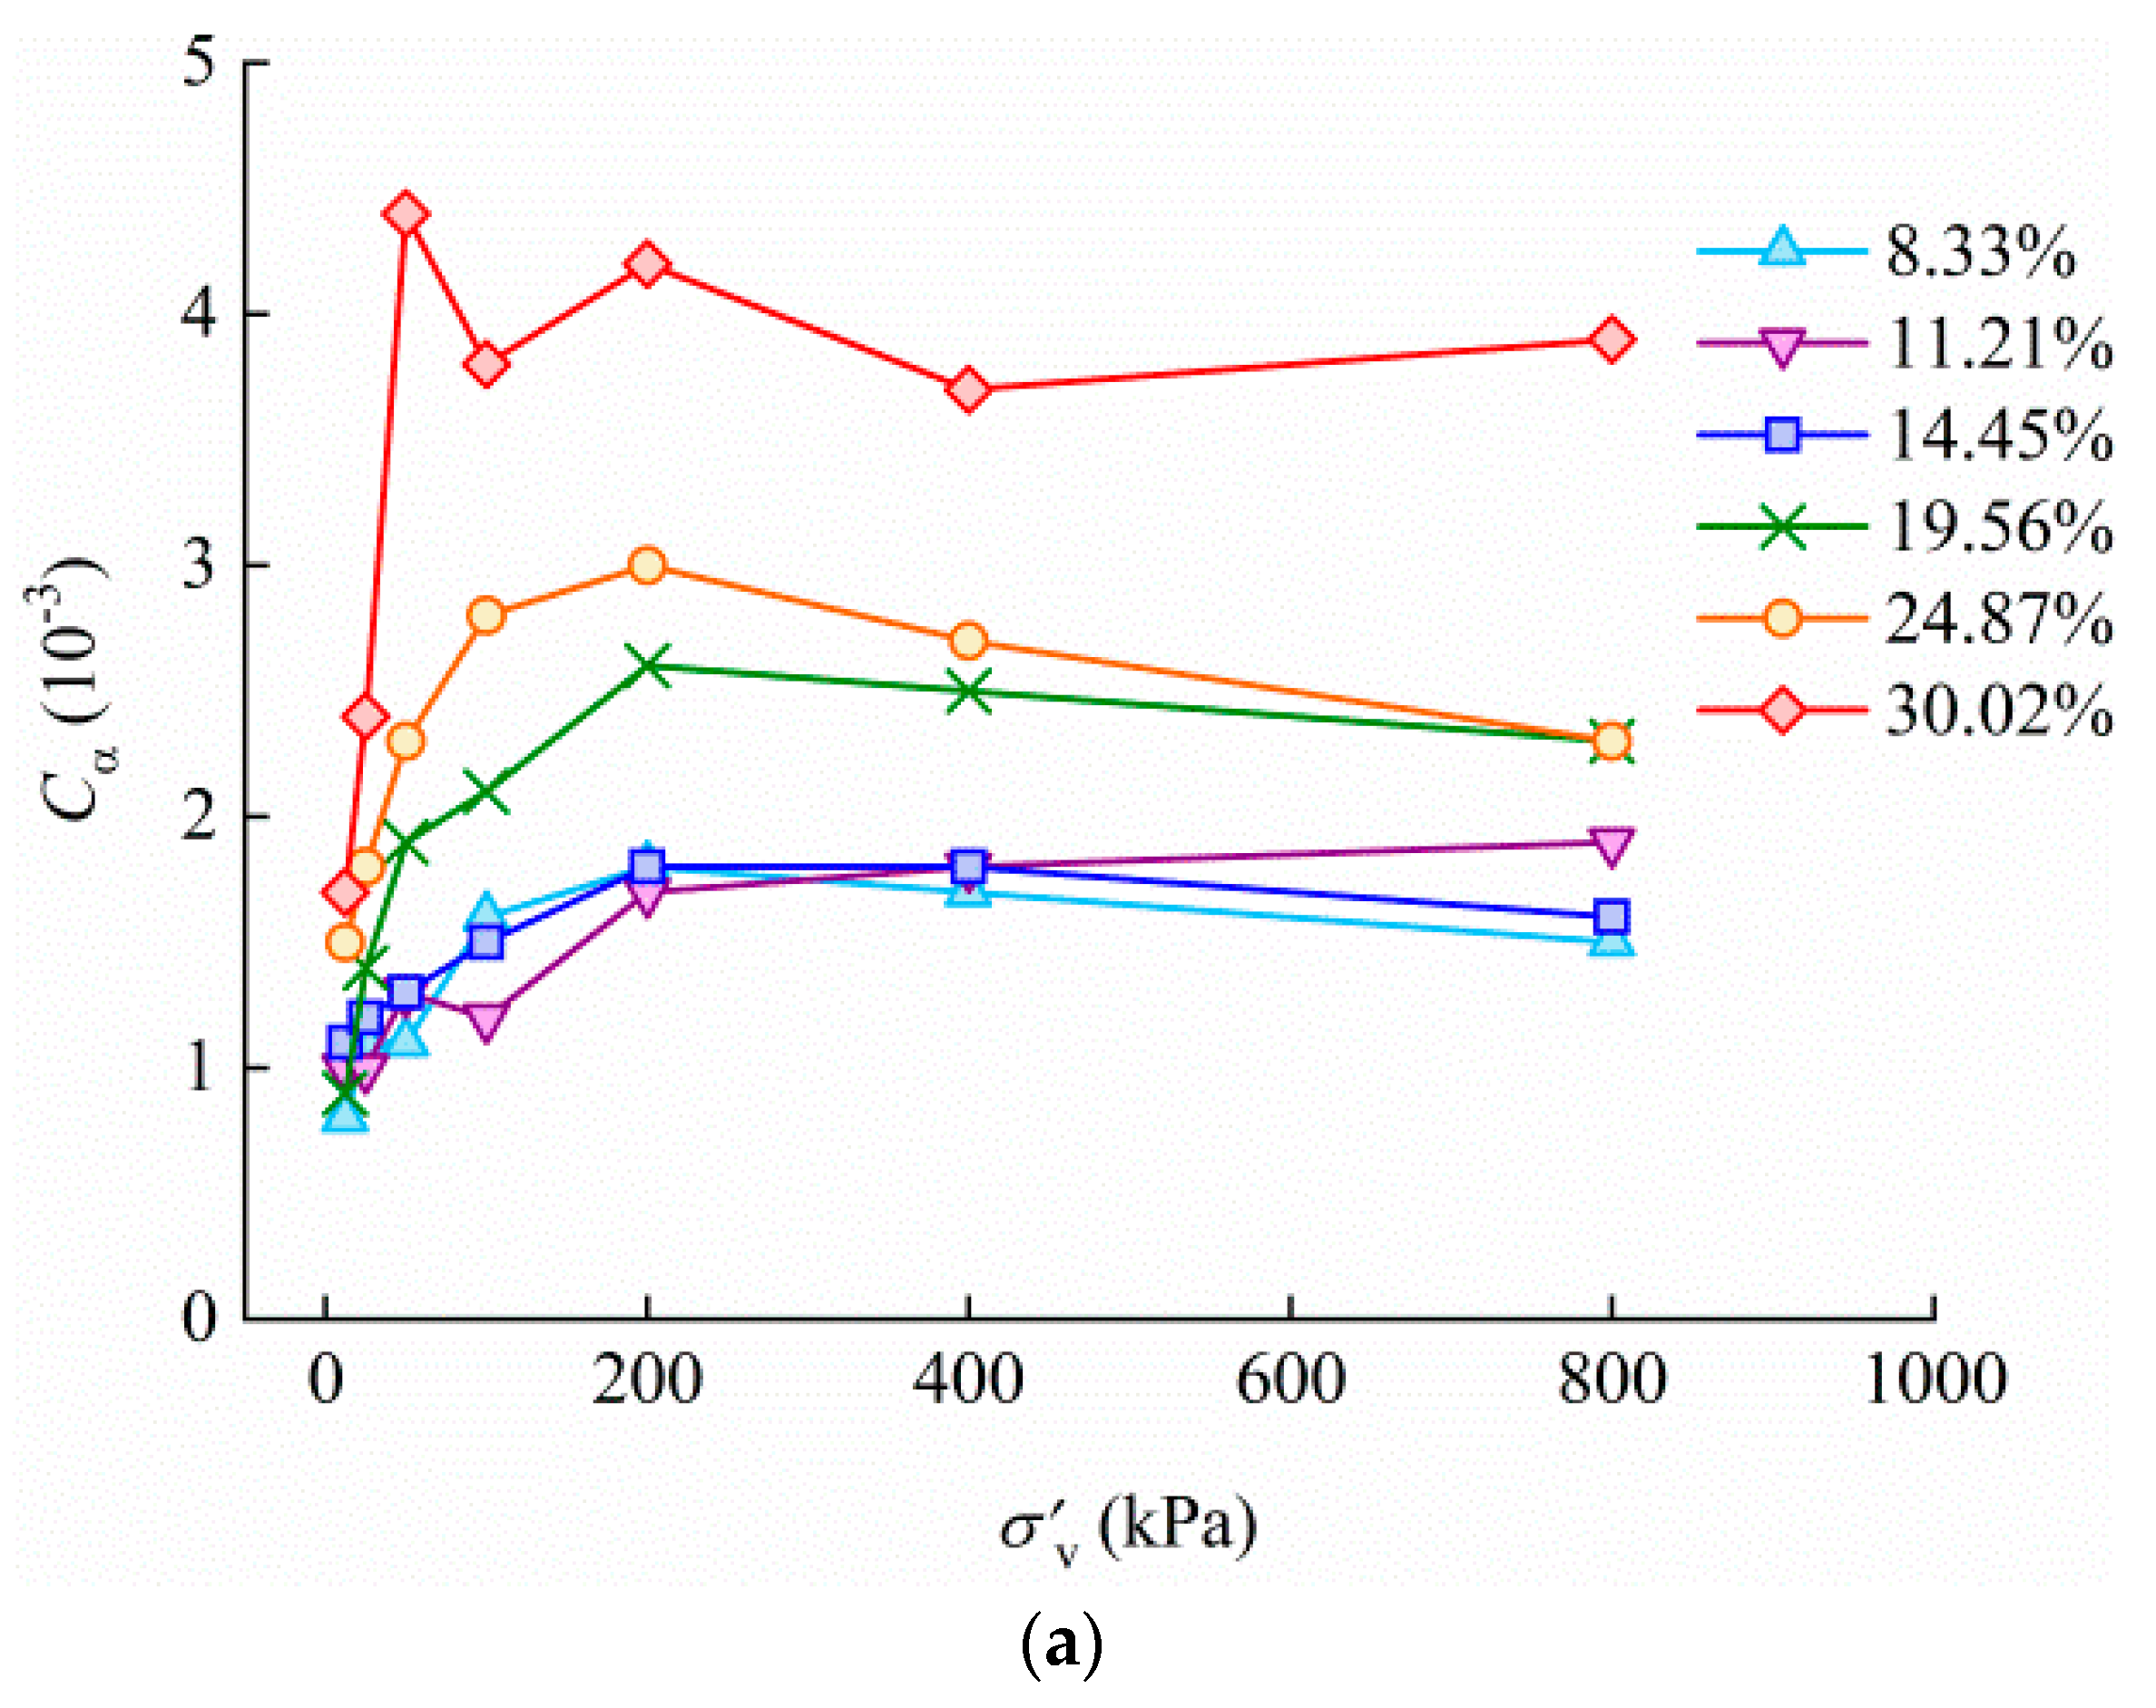
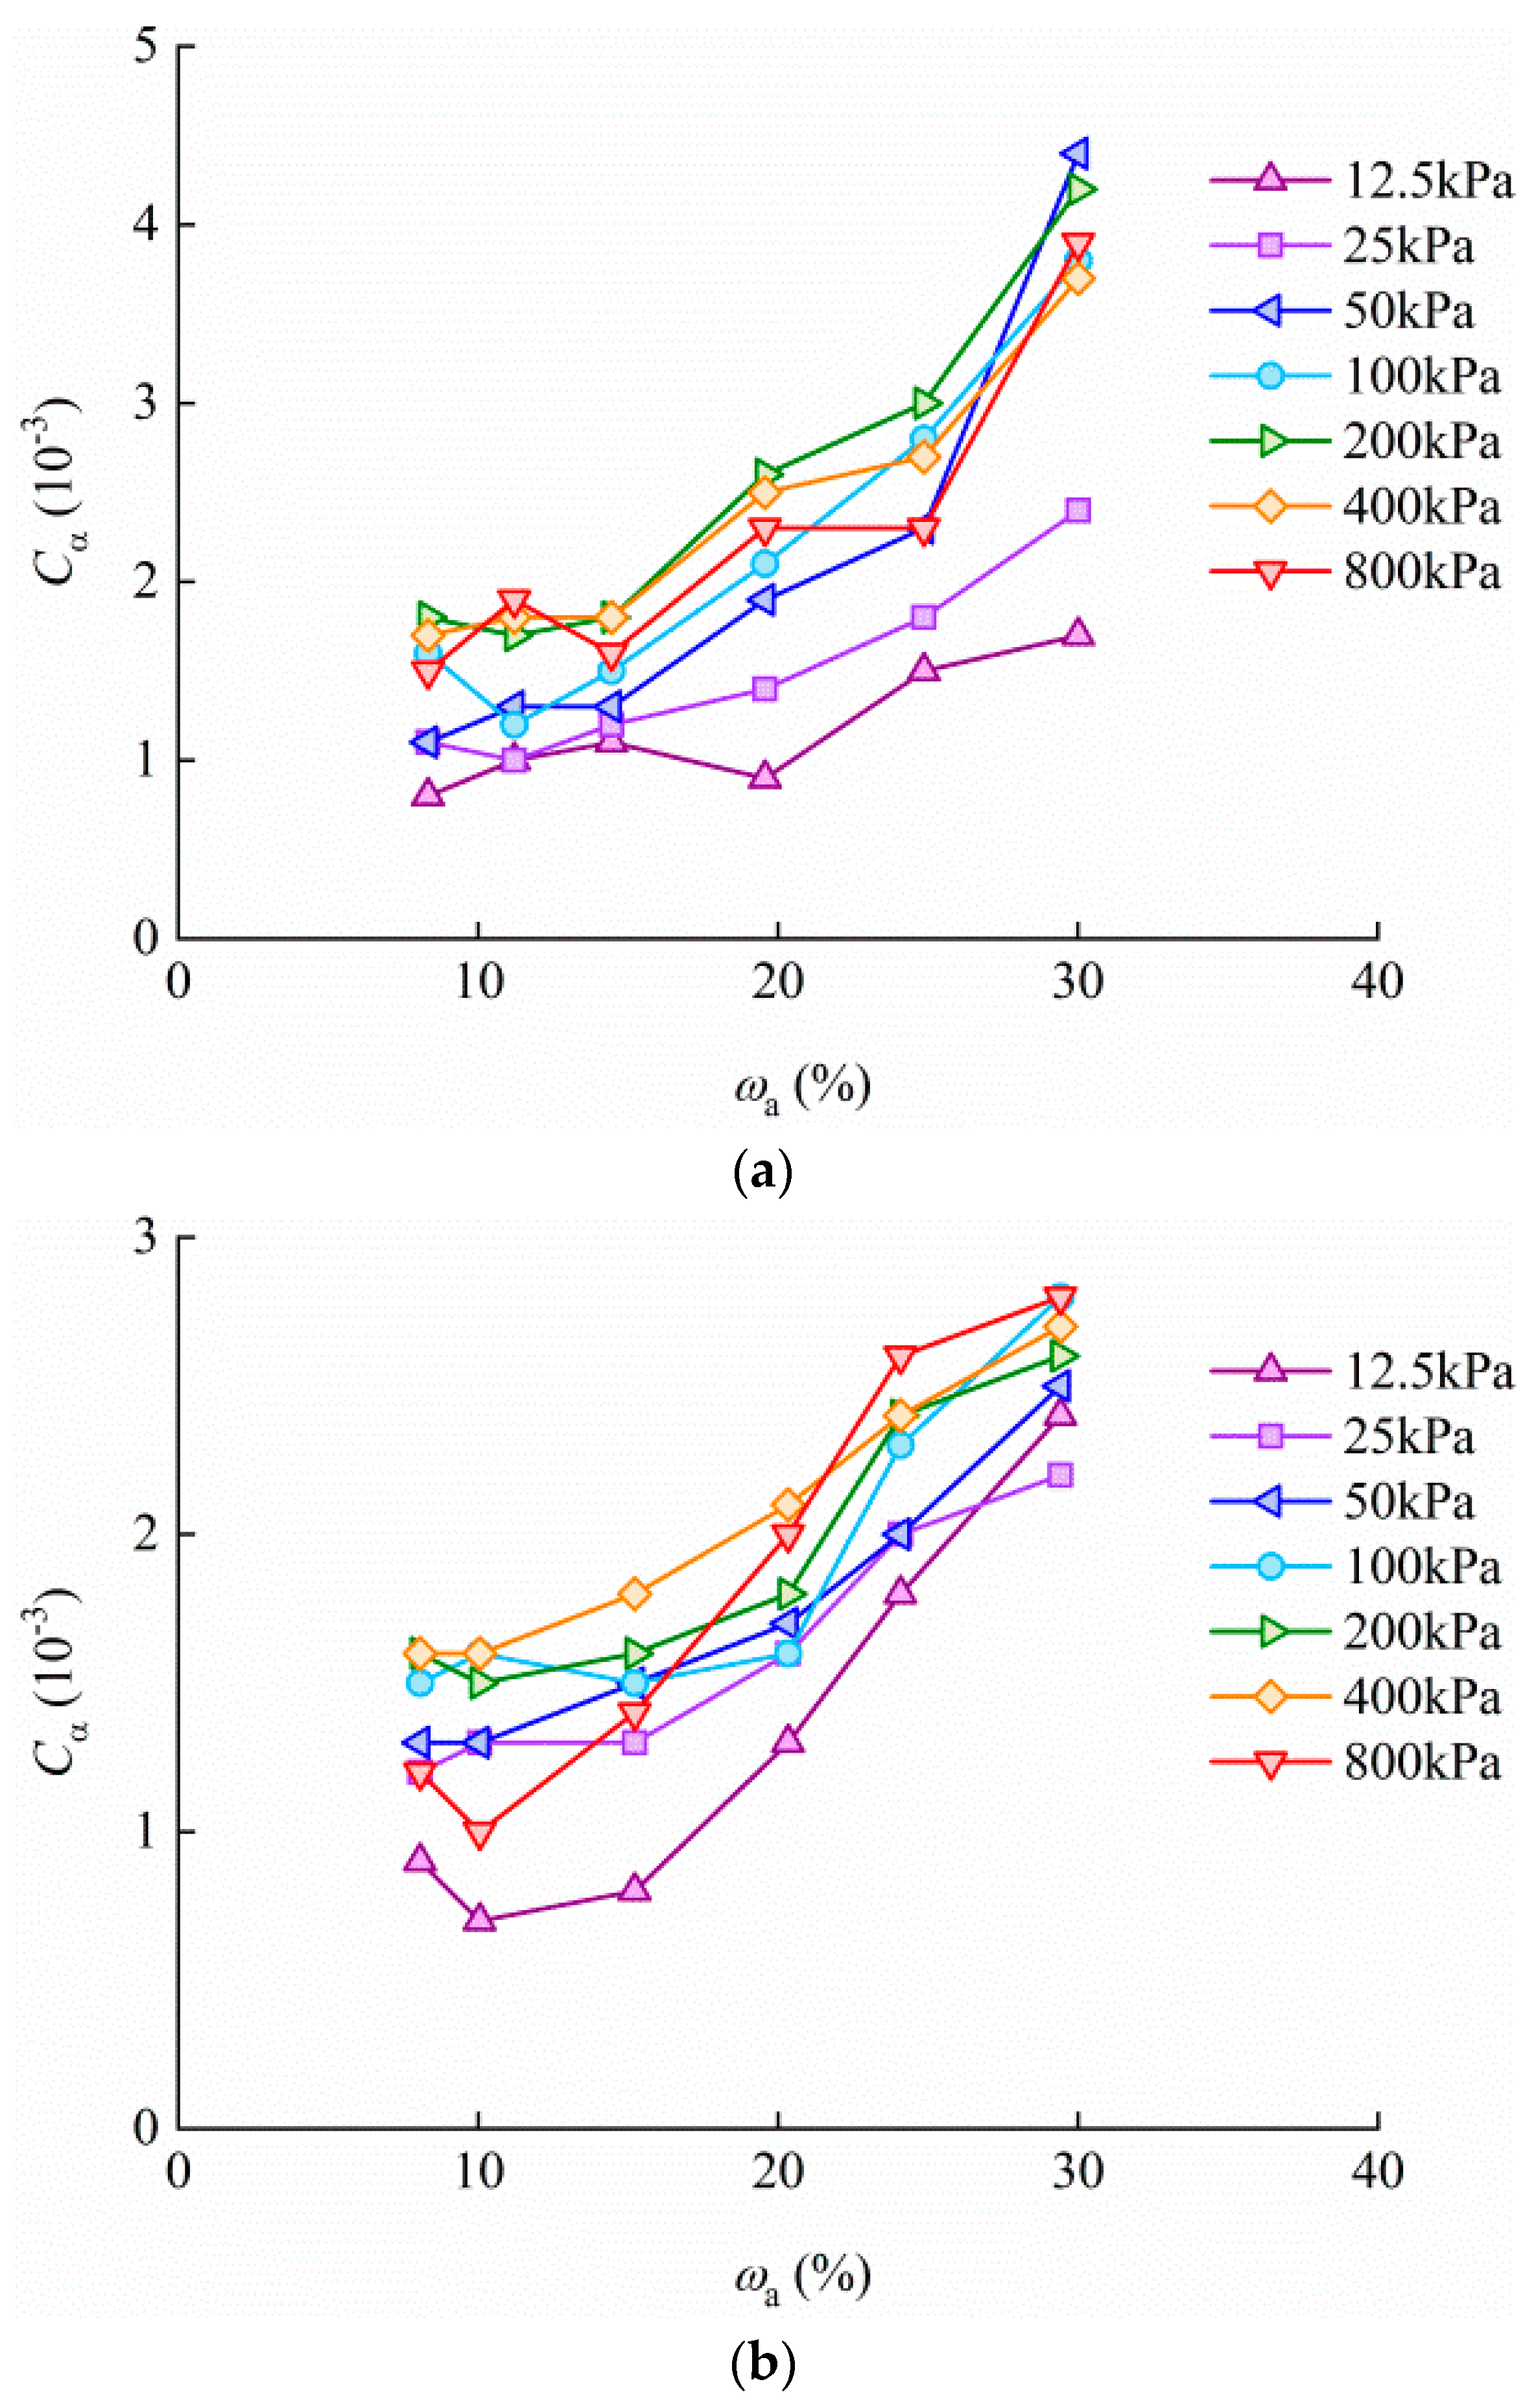
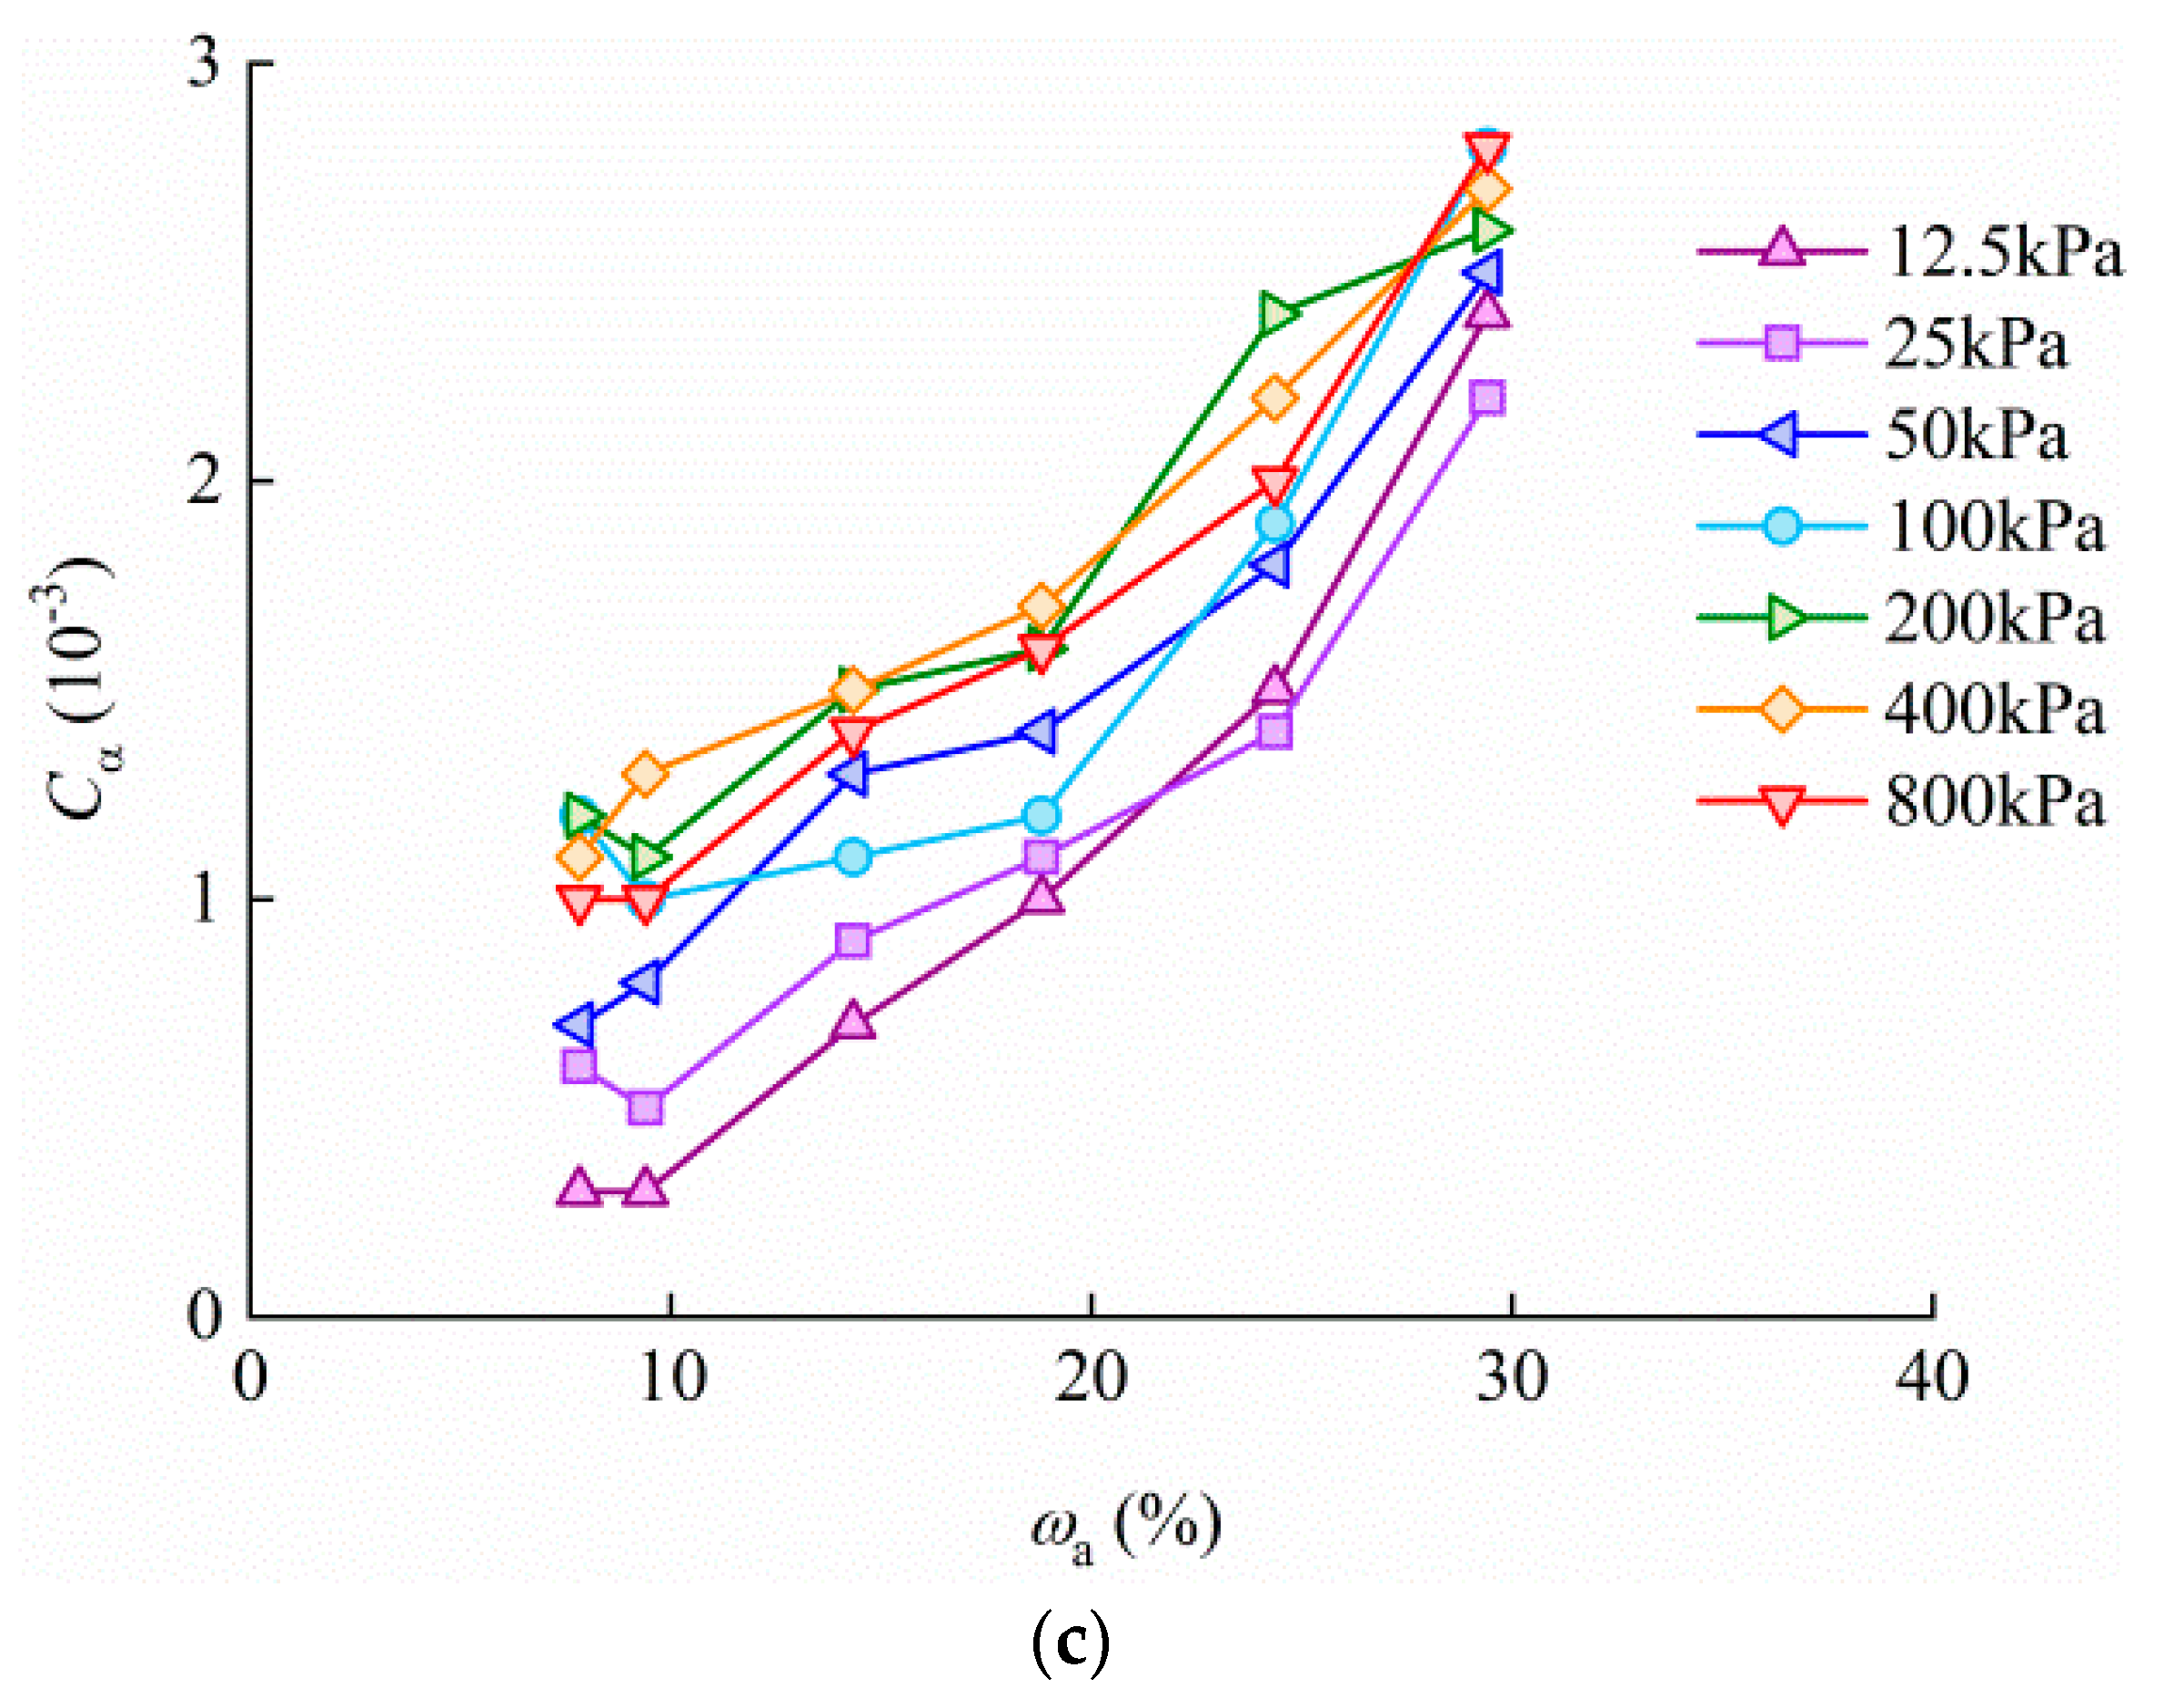
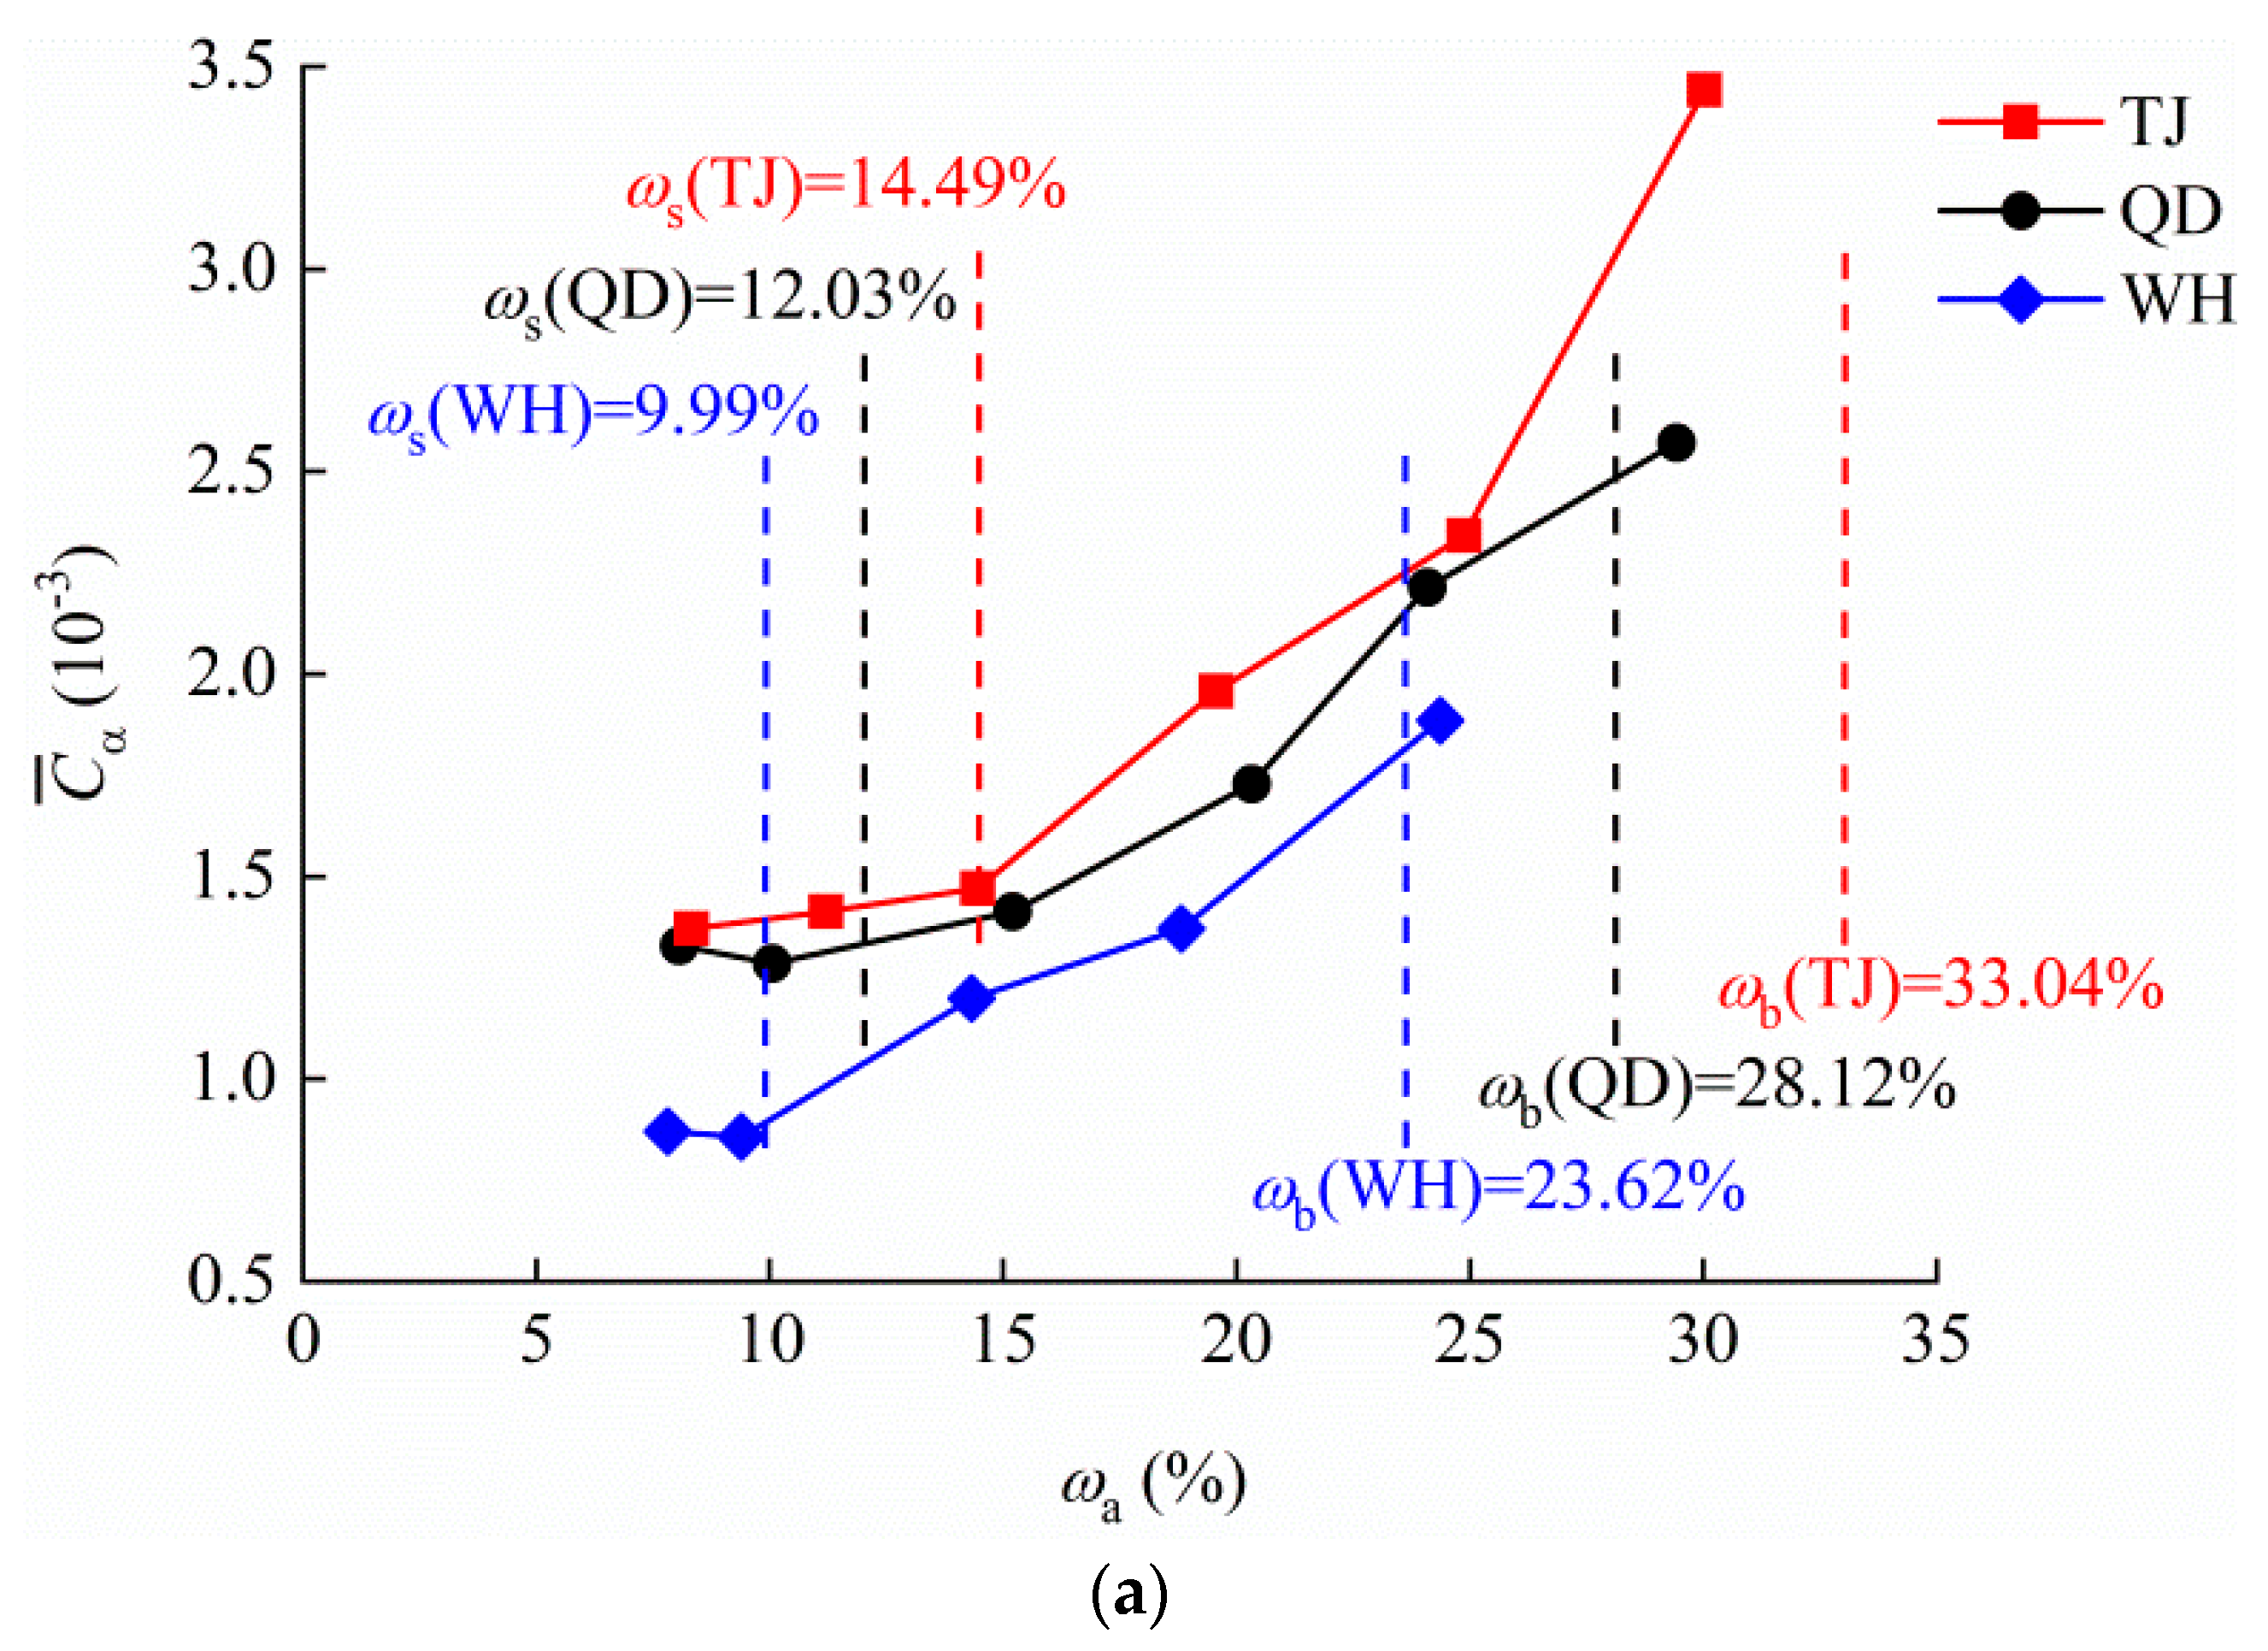
4.2. Relationship between Cα and ωa

On the basis of determining the limits for SBW and WBW, this paper explores the effect of bound water content on secondary compression by establishing a quantitative relationship between Cα and ωa. When ωa < ωb, the value of ωa represents the bound water content in the sample. Figure 6a–c shows the effect of ωa on Cα for TJ, QD and WH. A general trend of the plotted data is that Cα increases with ωa, which agrees with Mesri et al. [36] and Shahriar and Jadid [15], who observed that Cα at a particular vertical stress increases with increasing initial water content. Note that when ωa < ωs, i.e., when only SBW is present in the soil, increasing ωa does not have a significant impact on Cα overall. However, when ωa > ωs, i.e., when SBW and WBW coexist in the soil, Cα increases significantly with increasing ωa.
The research on the compression characteristics of reconstituted samples with different bound water contents is of guidance for practical engineering, especially for an accurate forecasting on the sedimentation behaviors of dredged slurries [10,37] and marine silty clays. The dredged slurries after siltation can be considered as reconstituted soils since their original structures have been completely destroyed during dredging. Existing research shows that compression properties of reconstituted soils are associated with soil properties and their initial water contents [10,37,38], and the compression indices increase non-linearly with increasing water content [37,39]. Cαωa curves (Figure 6) of three marine silty clays also have non-linear characteristics. The advantage is that this study provides an idea of understanding secondary compression from the perspective of bound water, rather than regarding all the pore water as free water, as in previous studies and engineering calculations. The differences in states and properties (Figure 2) [22] between SBW and WBW lead to their different influence degrees on secondary compression. Analysis on the Cαωa relationship can better reflect the actual situation and the effects of different types of bound water on secondary compression.

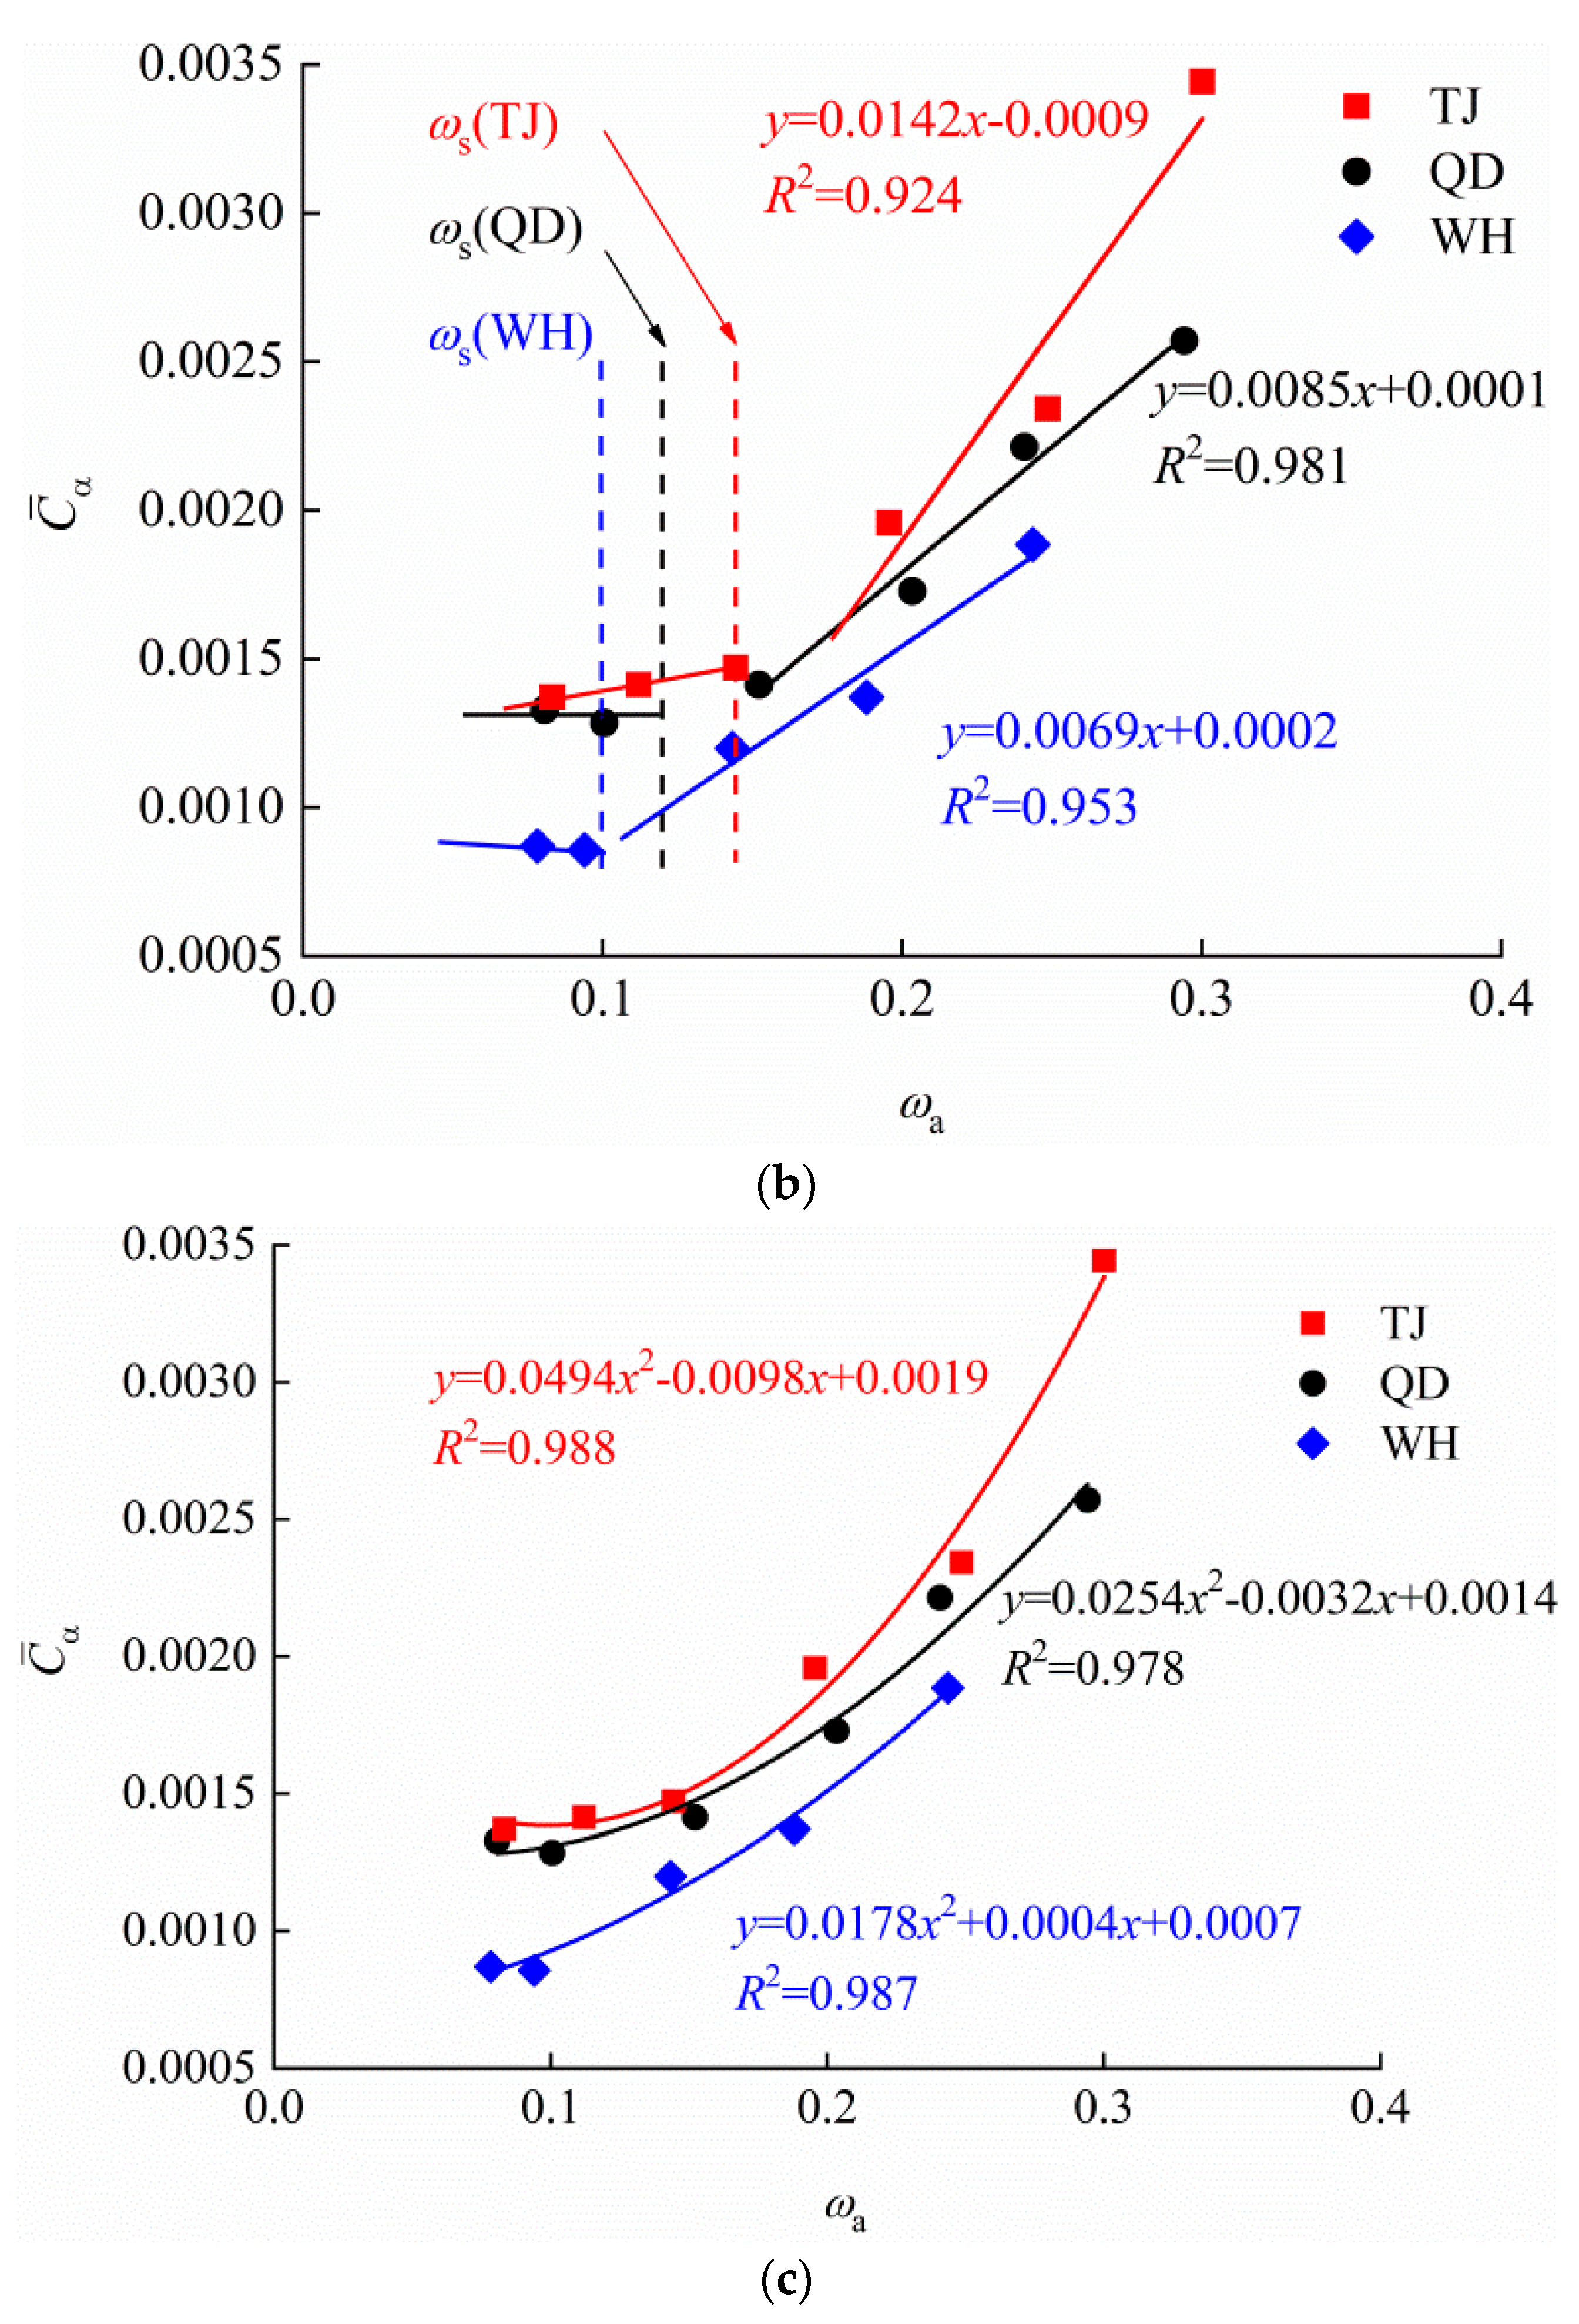
4.3. Calculation Models of Average Secondary Compression Coefficient

As clusters of Cαωa curves (Figure 6) show similar characteristics, in order to simplify the calculation and meet the engineering needs, the average secondary compression coefficient ( C ¯ α ) was introduced for a more visual, simple and comprehensive representation of the effect of ωa on secondary compression, which represents the average value of Cα at all levels of vertical stresses at a specified ωa. As shown in Figure 7a, when ωa < ωs, the change in C ¯ α with ωa is not obvious. When WBW begins to appear in the soil, C ¯ α increases significantly with increasing ωa, indicating that weakly bound water has a significant impact on secondary compression. Phased features can be presented by piecewise linear regression lines, which are fitted to the data, as shown in Figure 7b, and the resulting regression equation can be expressed as Equation (2).
{ C ¯ α ( TJ ) = 0.0142 ω a 0.0009   C ¯ α ( QD ) = 0.0085 ω a + 0.0001 C ¯ α ( WH ) = 0.0069 ω a + 0.0002 ( ω a > ω s )
The correlation coefficients (R2) for TJ, QD and WH are 0.924, 0.981 and 0.953, respectively, which indicates that it is reasonable to describe C ¯ α as a function of bound water content. TJ has the fitted line with the largest slope, followed by QD and WH, which is mainly due to the difference in void ratios.
The C ¯ α ωa relationship can also be expressed in the form of a quadratic polynomial, as shown in Figure 7c and Equation (3). The correlation coefficient (R2) values for TJ, QD and WH in Equation (3) are 0.988, 0.978 and 0.987, respectively.
{ C ¯ α ( TJ ) = 0.0494 ω a 2 0.0098 ω a + 0.0019   C ¯ α ( QD ) = 0.0254 ω a 2 0.0032 ω a + 0.0014 C ¯ α ( WH ) = 0.0178 ω a 2 0.0004 ω a + 0.0007
Both models can accurately and reliably reflect the quantitative relationship between C ¯ α and ωa. The piecewise linear model is simple and clear and can visualize the effect of different types of bound water on secondary compression; that is, WBW plays a controlling role in secondary compression. It can be assumed that C ¯ α remains constant when ωa < ωs in deformation prediction. It was suggested that ωa is also a viable tool to estimate Cα. The proposed models can provide a reference for long-term deformation calculation.

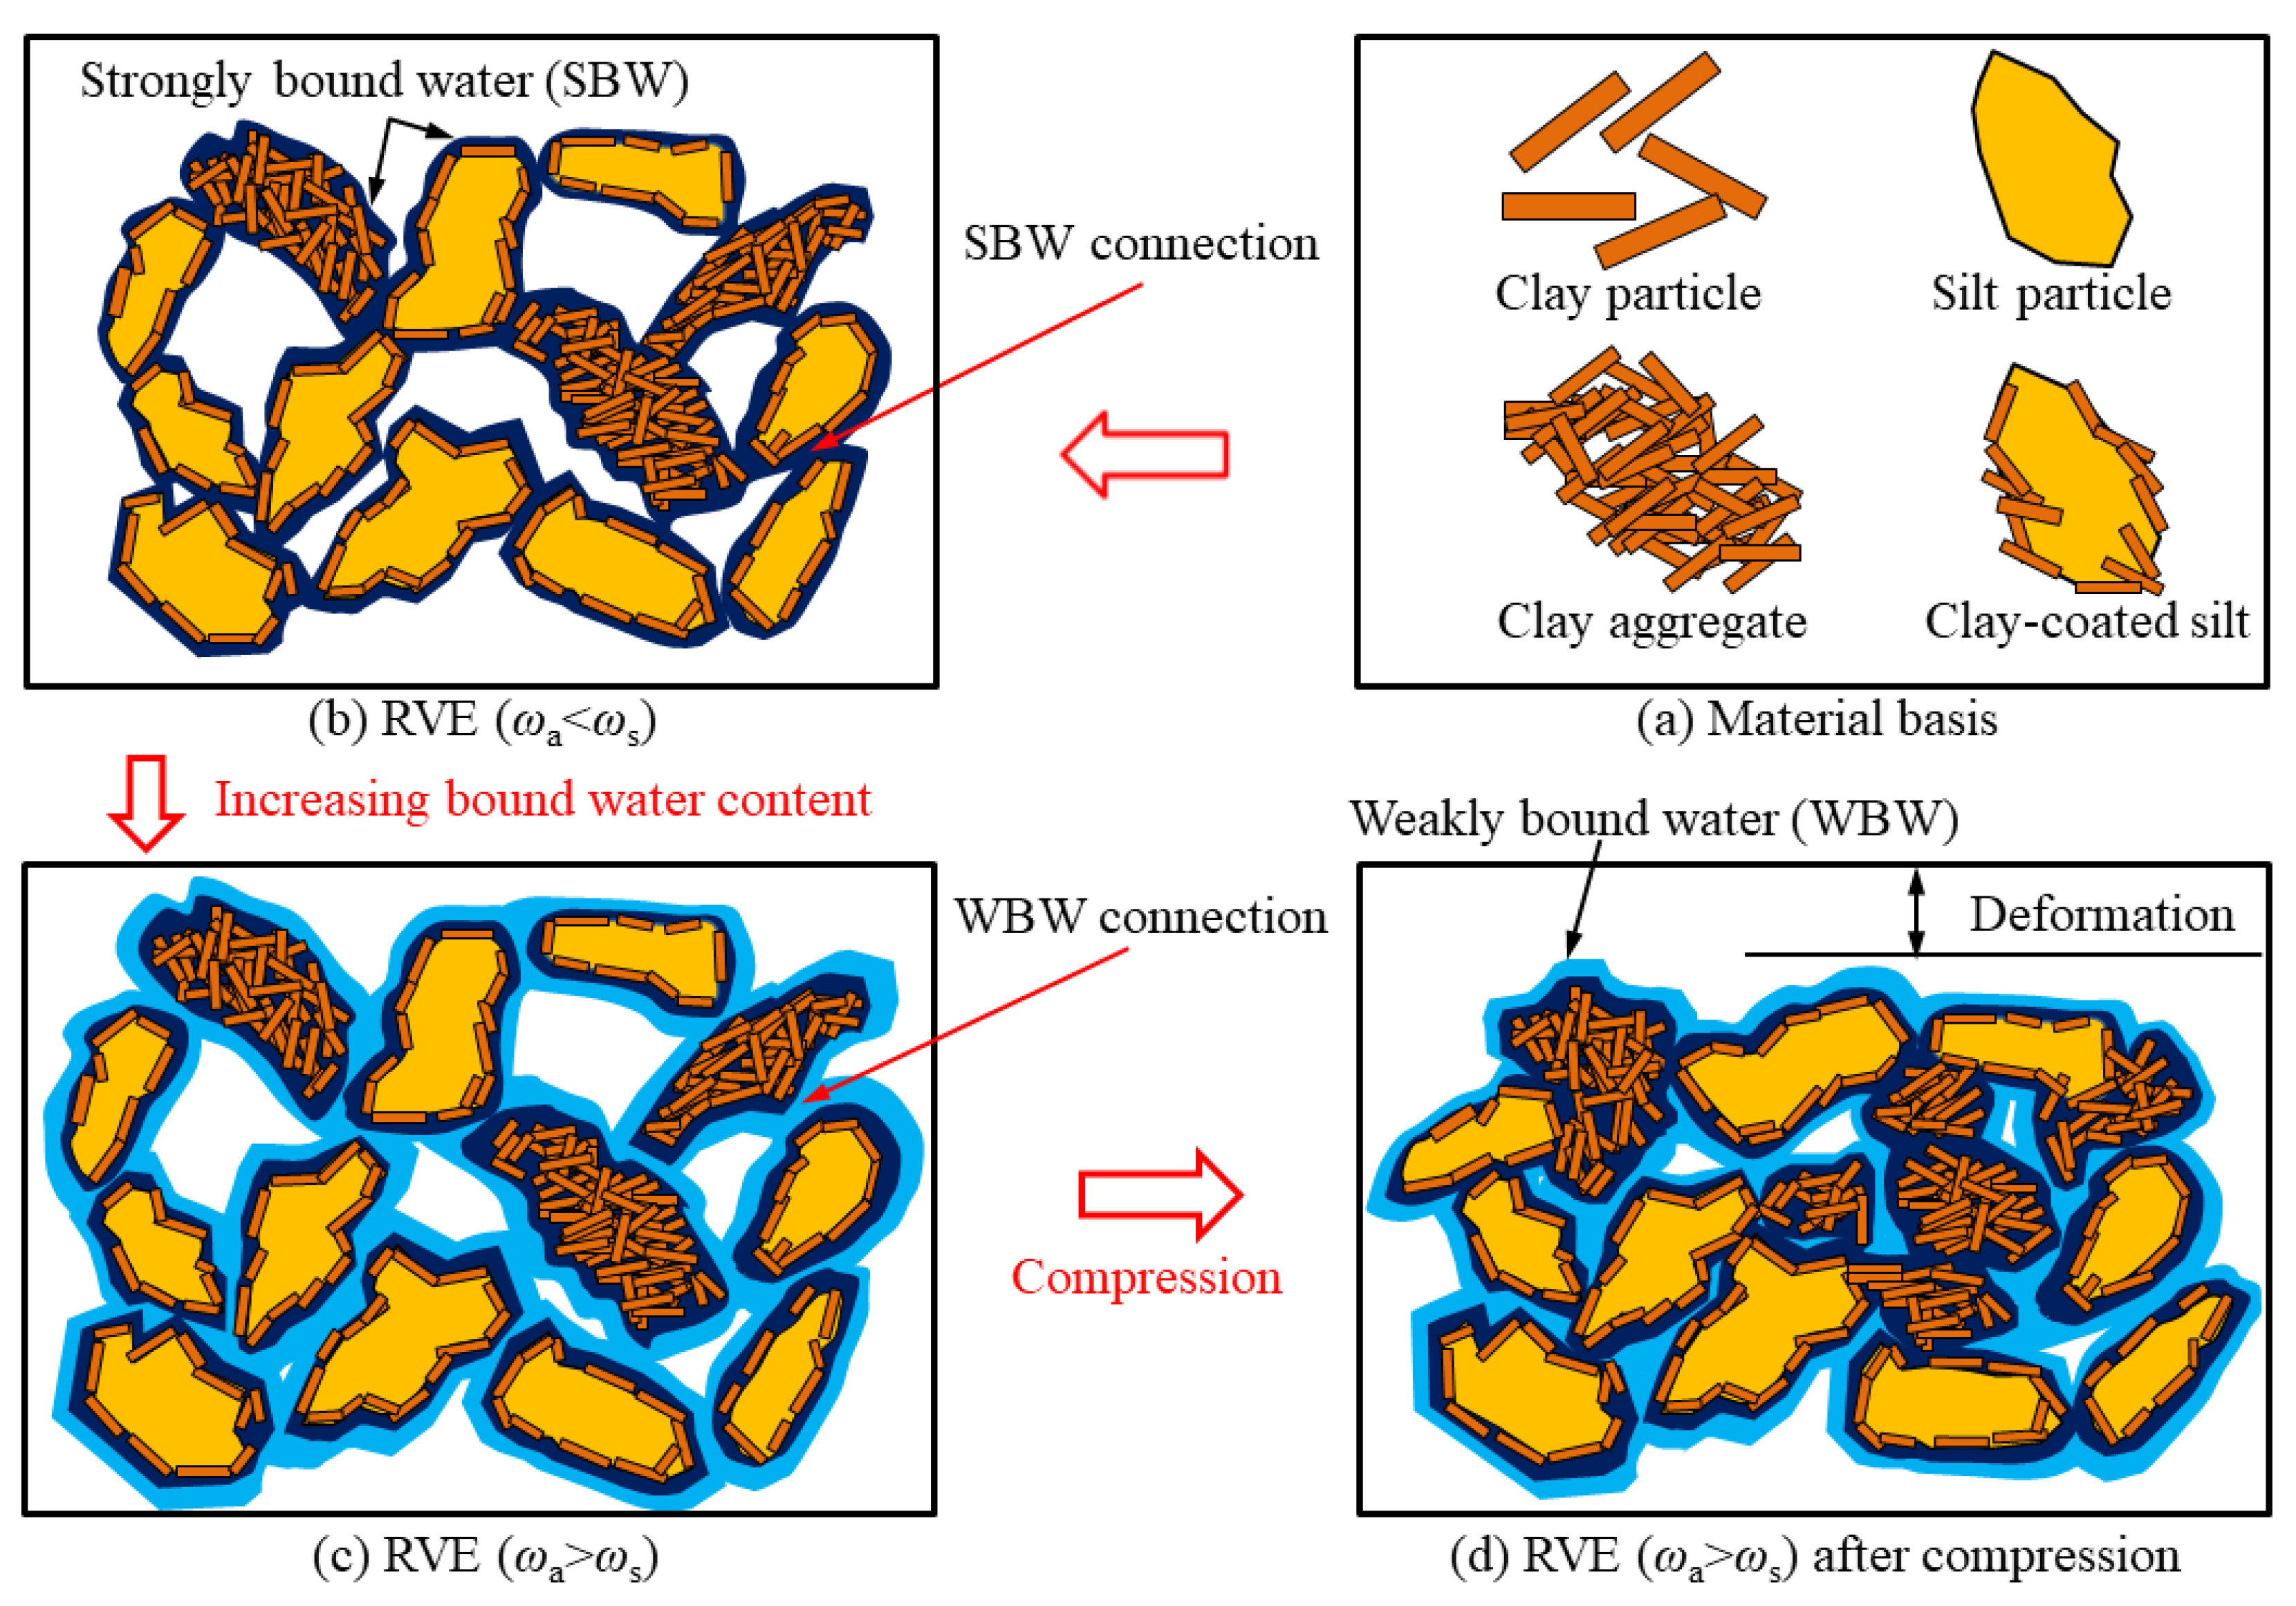
4.4. Controlling Mechanism of Bound Water on Secondary Compression

A conceptual model (Figure 8) is proposed to expound the interactions and associations between particles and different types of pore water in a representative volume element (RVE) and delineate the controlling mechanism of bound water on secondary compression from the standpoint of system synergy instead of the evolution of individual elements based on the grain fractions, mineral components and pore water characteristics of three marine silty clays considering that the schematic diagram [34,40] is widely used for mechanism explanation. The proposed conceptual model is a four-level hierarchy. Tier I consists of clay particle and silt particle. Tier II includes two major larger units, clay-coated silts and clay aggregates as most particles are present as clay-coated silts and clay aggregates instead of as individual units [34]. Tier III (Figure 8b) represents the particle–water system under the condition of ωa < ωs consisting of strongly bound water and the elements of tier II. In tier IV (Figure 8c), weakly bound water is included in the particle–water system to represent the distribution of pore water and the state of particle connection for the condition of ωa > ωs. Figure 8d shows the condition of the particle–water system (tier IV) after compression under a certain vertical stress. The particle orientation is also considered in the model.
Soil particles retain water molecules by different physicochemical processes [41], such as hydration and adsorption, under different bound water content ranges [22]. The magnitude of adsorptive forces depends on the relative position between water molecules and the particle surface, which leads to differences in the properties, including density [22], viscosity and fluidity [27] between SBW, WBW and free water. Variations in ωa can lead to differences in the connection mode and connection forces between soil particles and consequently affect the mechanical response of the soil particles. The Cαωa relationship is the external manifestation of the effect of bound water content on the evolution of connections (water film connections) and particle rearrangement [27,34,42] under a certain vertical stress, accompanied by the discharge of pore air, free water, and the outermost WBW [27,34] on particle surfaces (free water only exists in QD-6 and WH-5 in this study).
There is only SBW in the soil before the SBW limit (ωa < ωs). Soil particles are mainly connected by SBW, which was once thought to be similar to the solid phase in terms of its properties [26]. Secondary compression is mainly from the dislocation of particles and air discharge, and the SBW content is almost unchanged during compression due to the strong connection force between SBW and particles. The connection force and sliding friction force between soil particles are so strong that relative motion among particles is difficult, causing only a slight change in Cα with the increase in ωa.
When ωa > ωs, the connection mode among particles changes from the SBW connection to the WBW connection (Figure 8c) with increasing bound water content. Due to the weak connection between the WBW and particles, the connection force and friction force among the particles are significantly reduced with increasing ωa, and the resistance of particle dislocations is obviously weakened. This implies an increase in the number of particles that can participate in relative slip. The thicker the bound water film is, the more obvious this weakening effect, which is macroscopically reflected in the significant increase in Cα with ωa (Figure 6). In addition, increasing the bound water content weakens the viscosity and strengthens the fluidity of WBW, making it easier to migrate and discharge under the same stress. The outermost WBW starts to convert into free water and is discharged, which also contributes to the creep deformation of clays (Figure 8d). WBW is the main factor affecting the secondary compression of marine silty clays.
The compression mechanism can be explained in various perspectives and expounded in different forms [34]. A widely adopted method is to explore the elements that are most closely associated with macro deformation such as pores [34] and particles [43]. However, the effect of bound water on compression has received scarce attention. The experimental results and conceptual model show that bound water content control secondary compression by changing the contacts between particles. For marine silty clay with water content over the SBW limit, decreasing bound water content can hinder particle rearrangement and water film creep, which weakens secondary compression.

5. Future Research

The results and the proposed models based on only three types of marine silty clays cannot represent the full variability of marine silty clays. Different clays exhibit different bound water contents and secondary compression behaviors due to the differences in the amount of clay content and clay minerals. Sample preparation and testing are difficult for specimens with high and low bound water contents. Although the test scheme (Table 2) maximizes the coverages of bound water contents under the premise of ensuring the accuracy and experimental effect, the samples cover limited ranges of bound water contents. Thus, additional research on a large variety of naturally marine silty clays, with a broad range of bound water contents, is required to refine Figure 6 and models (Figure 7) for wider application. This paper discusses the mechanism from the perspective of the effect of bound water content on particle connections and particle dislocation, rather than from the perspective of traditional water content or matric suction. Although the mechanism of secondary compression with respect to bound water content variation needs further quantitative study, this research provides clear parameters, models and a theoretical basis for accurate long-term settlement assessment of marine silty clays and related engineering applications.

6. Conclusions

This paper quantitatively investigates the effect of bound water content on the secondary compression of three typical marine silty clays using an integrated approach incorporating thermogravimetric analysis and uniaxial confined compression tests. The contents and limits of SBW and WBW can be determined based on TG and DTG curves. At a particular vertical stress, secondary compression coefficient changes little in the SBW limit at first, and then increases dramatically with increasing absolute water content. A piecewise linear model and a quadratic polynomial model are established to reflect the relationship between average secondary compression coefficient and bound water content. WBW is the main factor affecting the secondary compression.

Author Contributions

Conceptualization, C.W. and S.L.; methodology, C.W. and S.L.; software, S.L., F.G. and R.G.; investigation, S.L., S.H. and X.L.; writing—original draft preparation, S.L.; writing—review and editing, C.W. and S.L.; project administration, C.W.; funding acquisition, C.W. All authors have read and agreed to the published version of the manuscript.

Funding

This research was funded by the National Natural Science Foundation of China (No. 41572257; No. 41972267).

Institutional Review Board Statement

Not applicable.

Informed Consent Statement

Not applicable.

Data Availability Statement

Not applicable.

Acknowledgments

The authors would like to thank the anonymous reviewers for their constructive comments and suggestions.

Conflicts of Interest

The authors declare no conflict of interest.

Abbreviations

TGA: thermogravimetric analysis; TG, thermogravimetry; DTG, derivative thermogravimetry; TJ, Tianjin mucky silty clay; QD, Qingdao mucky silty clay; WH, Weihai silty clay; SBW, strongly bound water; WBW, weakly bound water; MB, Methylene blue; SSA, specific surface area; XRD, X-ray diffraction; XRF, X-ray fluorescence; EOP, end of primary compression; RVE, representative volume element.

References

  1. Campos, B.; Aguilar-Carrillo, J.; Algarra, M.; Gonçalves, M.A.; Rodríguez-Castellón, E.; Esteves da Silva, J.C.G.; Bobos, I. Adsorption of uranyl ions on kaolinite, montmorillonite, humic acid and composite clay material. Appl. Clay Sci. 2013, 85, 53–63. [Google Scholar] [CrossRef]
  2. Malizia, J.P.; Shakoor, A. Effect of water content and density on strength and deformation behavior of clay soils. Eng. Geol. 2018, 244, 125–131. [Google Scholar] [CrossRef] [Green Version]
  3. Han, Z.; Vanapalli, S.K. Normalizing variation of stiffness and shear strength of compacted fine-grained soils with moisture content. J. Geotech. Geoenviron. Eng. 2017, 143, 04017058. [Google Scholar] [CrossRef]
  4. Sun, Y.Q.; Meng, S.J.; Wang, M.; Mu, H.L.; Tang, X.C. Deterioration effect of freeze-thaw on mechanical properties of roadbed clay under unfavorable conditions. Bull. Eng. Geol. Environ. 2021, 80, 4773–4790. [Google Scholar] [CrossRef]
  5. Jalal, F.E.; Xu, Y.F.; Li, X.Y.; Jamhiri, B.; Iqbal, M. Fractal approach in expansive clay-based materials with special focus on compacted GMZ bentonite in nuclear waste disposal: A systematic review. Environ. Sci. Pollut. Res. 2021, 28, 43287–43314. [Google Scholar] [CrossRef]
  6. Sobhan, K.; Ramirez, J.C.; Reddy, D.V. Cement stabilization of highly organic subgrade soils to control secondary compression settlement. Transp. Res. Rec. 2012, 2310, 103–112. [Google Scholar] [CrossRef]
  7. Zhang, Z.; Huang, M. Geotechnical influence on existing subway tunnels induced by multiline tunneling in Shanghai soft soil. Comput. Geotech. 2014, 56, 121–132. [Google Scholar] [CrossRef]
  8. De Boer, H.C.; Deru, J.G.C.; van Eekeren, N. Sward lifting in compacted grassland: Contrasting effects on two different soils. Soil Tillage Res. 2020, 201, 104564. [Google Scholar] [CrossRef]
  9. Huang, W.; Wen, K.J.; Li, J.J.; Fu, X.M.; Liu, S.H.; Li, Y.; Li, L.; Amini, F. Mechanical properties of soft soils experiencing lateral unloading under initial excess pore water pressure. Arab. J. Geosci. 2020, 13, 718. [Google Scholar] [CrossRef]
  10. Zeng, L.L.; Hong, Z.-S.; Cui, Y.J. Time-dependent compression behavior of dredged clays at high water contents in China. Appl. Clay Sci. 2016, 123, 320–328. [Google Scholar] [CrossRef]
  11. Yao, K.; Wang, W.; Li, N. Investigation on strength and microstructure characteristics of Nano-MgO admixed with cemented soft soil. Constr. Build. Mater. 2019, 206, 160–168. [Google Scholar] [CrossRef]
  12. Feng, W.Q.; Zheng, X.C.; Yin, J.H.; Chen, W.B.; Tan, D.Y. Case study on long-term ground settlement of reclamation project on clay deposits in Nansha of China. Mar. Georesources Geotechnol. 2021, 39, 372–387. [Google Scholar] [CrossRef]
  13. Deng, Y.F.; Cui, Y.J.; Tang, A.M.; Li, X.L.; Sillen, X. An experimental study on the secondary deformation of Boom clay. Appl. Clay Sci. 2012, 59–60, 19–25. [Google Scholar] [CrossRef] [Green Version]
  14. Olek, B.S. An experimental investigation of the influence of plasticity on creep degradation rate. Acta Geotech. 2021, 1–15. [Google Scholar] [CrossRef]
  15. Shahriar, A.R.; Jadid, R. An experimental investigation on the effect of thixotropic aging on primary and secondary compression of reconstituted dredged clays. Appl. Clay Sci. 2018, 162, 524–533. [Google Scholar] [CrossRef]
  16. Yin, Z.Y.; Xu, Q.; Yu, C. Elastic-viscoplastic modeling for natural soft clays considering nonlinear creep. Int. J. Geomech. 2015, 15, A601400. [Google Scholar] [CrossRef] [Green Version]
  17. Kamoun, J.; Bouassida, M. Creep behavior of unsaturated cohesive soils subjected to various stress levels. Arab. J. Geosci. 2018, 11, 77. [Google Scholar] [CrossRef]
  18. Miao, L.C.; Kavazanjian, E. Secondary Compression Features of Jiangsu Soft Marine Clay. Mar. Georesources Geotechnol. 2007, 25, 129–144. [Google Scholar] [CrossRef]
  19. Anagnostopoulos, C.A.; Grammatikopoulos, I.N. A new model for the prediction of secondary compression index of soft compressible soils. Bull. Eng. Geol. Environ. 2011, 70, 423–427. [Google Scholar] [CrossRef]
  20. Jiang, N.; Wang, C.; Wu, Q.; Li, S. Influence of Structure and Liquid Limit on the Secondary Compressibility of Soft Soils. J. Mar. Sci. Eng. 2020, 8, 627. [Google Scholar] [CrossRef]
  21. Li, Y.L.; Wang, T.H.; Su, L.J. Determination of bound water content of loess soils by isothermal adsorption and thermogravimetric analysis. Soil Sci. 2015, 180, 90–96. [Google Scholar]
  22. Li, S.; Wang, C.M.; Zhang, X.W.; Zhou, L.L.; Dai, Z.X. Classification and characterization of bound water in marine mucky silty clay. J. Soils Sediments 2019, 19, 2509–2519. [Google Scholar] [CrossRef]
  23. Logsdon, S.D.; Laird, D.A. Electrical conductivity spectra of smectites as influenced by saturating cation and humidity. Clays Clay Miner. 2004, 52, 411–420. [Google Scholar] [CrossRef]
  24. Lee, D.J. Interpretation of bound water measured via dilatometric technique. Water Res. 1996, 30, 2230–2232. [Google Scholar] [CrossRef]
  25. Yen, P.S.; Lee, D.J. Errors in bound water measurements using centrifugal setting method. Water Res. 2001, 35, 4004–4009. [Google Scholar] [CrossRef]
  26. Xie, Y.H.; Zeng, Z.T.; Zhang, B.H.; Zhang, Y.; Tang, S.H. Analysis and modeling of bound water adsorption by mixed clay based on adsorption theory. Arab. J. Geosci. 2021, 14, 1089. [Google Scholar] [CrossRef]
  27. Li, S.; Wang, C.M.; Wu, Q.; Zhang, Z.M.; Zhang, Z.N. Variations of bound water and microstructure in consolidation-creep process of Shanghai mucky clay. Rock Soil Mech. 2017, 38, 2809–2816. [Google Scholar] [CrossRef]
  28. Wang, Y.; Lu, S.; Ren, T.; Li, B.G. Bound water content of air-dry soils measured by thermal analysis. Soil Sci. Soc. Am. J. 2011, 75, 481–487. [Google Scholar] [CrossRef]
  29. Yuan, Y.J.; Rezaee, R.; Verrall, M.; Hu, S.-Y.; Zou, J.; Testmanti, N. Pore characterization and clay bound water assessment in shale with a combination of NMR and low-pressure nitrogen gas adsorption. Int. J. Coal Geol. 2018, 194, 11–21. [Google Scholar] [CrossRef]
  30. Kuligiewicz, A.; Derkowski, A. Tightly bound water in smectites. Am. Mineral. 2017, 102, 1073–1090. [Google Scholar] [CrossRef]
  31. Kucerik, J.; Tokarski, D.; Demyan, M.S.; Merbach, I.; Siewert, C. Linking soil organic matter thermal stability with contents of clay, bound water, organic carbon and nitrogen. Geoderma 2018, 316, 38–46. [Google Scholar] [CrossRef]
  32. EN 933-9:2009. Tests for Geometrical Properties of Aggregates–Part 9: Assessment of Fines–Methylene Blue Test; European Committee for Standardization: Brussels, Belgium, 2009. [Google Scholar]
  33. Maček, M.; Mauko, A.; Mladenovič, A.; Majes, B.; Petkovšek, A. A comparison of methods used to characterize the soil specific surface area of clays. Appl. Clay Sci. 2013, 83–84, 144–152. [Google Scholar] [CrossRef]
  34. Li, S.; Wang, C.M.; Zhang, S.Y.; Li, T.; Khan, K.U.J. Bound water characteristics and microstructure evolution during uniaxial compression of mucky silty clay. J. Soils Sediments 2021, 1–15. [Google Scholar] [CrossRef]
  35. Morin, R.; Silva, A.J. The effects of high pressure and high temperature on some physical properties of ocean sediments. J. Geophys. Res. Solid Earth. 1984, 89, 511–526. [Google Scholar] [CrossRef] [Green Version]
  36. Mesri, G.; Rokhsar, A.; Bohor, B.F. Composition and compressibility of typical samples of Mexico City clay. Géotechnique 1975, 25, 527–554. [Google Scholar] [CrossRef]
  37. Xu, G.Z.; Yin, J. Compression behavior of secondary clay minerals at high initial water contents. Mar. Georesources Geotechnol. 2016, 34, 721–728. [Google Scholar] [CrossRef]
  38. Cerato, A.B.; Lutenegger, A.J. Determining intrinsic compressibility of fine-grained soils. J. Geotech. Geoenviron. Eng. 2004, 130, 872–877. [Google Scholar] [CrossRef]
  39. Hong, Z.S.; Yin, J.; Cui, Y.J. Compression behaviour of reconstituted soils at high initial water contents. Geotechnique 2010, 60, 691–700. [Google Scholar] [CrossRef] [Green Version]
  40. Zhang, T.; Yang, Y.L.; Liu, S.Y. Application of biomass by-product lignin stabilized soils as sustainable geomaterials: A review. Sci. Total Environ. 2020, 728, 138830. [Google Scholar] [CrossRef] [PubMed]
  41. Lu, N.; Likos, W.J. Unsaturated Soil Mechanics; John Wiley and Sons: New York, NY, USA, 2004. [Google Scholar]
  42. Wong, R.C.K.; Varatharajan, S. Viscous behaviour of clays in one-dimensional compression. Can. Geotech. J. 2014, 51, 795–809. [Google Scholar] [CrossRef]
  43. Jia, R.; Lei, H.Y.; Li, K. Compressibility and microstructure evolution of different reconstituted clays during 1D compression. Int. J. Geomech. 2020, 20, 04020181. [Google Scholar] [CrossRef]
Figure 1. Geographical locations of the sampling sites.
Jmse 10 00261 g001
Figure 2. Thermogravimetric curves for (a) Tianjin clay, (b) Qingdao clay [34] and (c) Weihai clay.
Jmse 10 00261 g002aJmse 10 00261 g002b
Figure 3. εt curves: (a) TJ, ωa = 8.33%; (b) TJ, ωa = 14.45%; (c) TJ, ωa = 19.56%; (d) TJ, ωa = 30.02%; (e) QD, ωa = 20.33%; (f) WH, ωa = 18.81%.
Jmse 10 00261 g003
Figure 4. e–log t curves: (a) TJ, ωa = 20%; (b) QD, ωa = 20%; (c) WH, ωa = 20%; (d) diagram of primary and secondary compression partition.
Jmse 10 00261 g004
Figure 5. Cα σ v curves at different absolute water contents for (a) TJ, (b) QD, and (c) WH.
Jmse 10 00261 g005aJmse 10 00261 g005b
Figure 6. Cαωa curves at different vertical stresses for (a) TJ, (b) QD, and (c) WH.
Jmse 10 00261 g006aJmse 10 00261 g006b
Figure 7. Relationship of C ¯ α with ωa: (a) C ¯ α ωa curves and boundary water contents; (b) piecewise linear fitting; (c) secondary polynomial fitting.
Jmse 10 00261 g007aJmse 10 00261 g007b
Figure 8. The four-tiered conceptual model for the particle–water system and uniaxial confined compression: (a) material basis; (b) RVE (ωa < ωs); (c) RVE (ωa > ωs); (d) RVE (ωa > ωs) after compression.
Jmse 10 00261 g008
Table 1. Physical parameters, mineral and chemical compositions of soils.
PropertiesIndexValue
Tianjin Clay (TJ)Qingdao Clay (QD)Weihai Clay (WH)
Physical indexNatural density, ρ (g/cm3)1.831.951.96
Specific gravity, ρs (g/cm3)2.692.682.66
Void ratio, e0.960.790.69
Water content, ω (%)33.930.324.6
Liquid limit, ωL (%)30.826.825.2
Plasticity limit, ωP (%)20.415.715.1
Plasticity index, IP (%)10.411.110.0
Liquidity index, IL1.301.310.94
Specific surface area, SSA (m2/g)114.283.269.3
Grain fractions2–0.075 mm (%)7.298.276.93
0.075–0.005 mm (%)54.1971.1175.29
<0.005 mm (%)38.5220.6217.77
<0.002 mm (%)17.7810.537.58
Mineral componentsQuartz (%)36.351.355.3
Plagioclase (%)10.124.514.0
Potash feldspar (%)2.33.65.4
Calcite (%)12.51.94.3
Pyrite (%)2.41.30.5
Illite/Smectite mixed layer (%)17.513.19.8
Illite (%)7.92.44.5
Kaolinite (%)3.30.91.6
Chlorite (%)4.31.02.2
Chemical componentsSiO2 (%)60.5874.5169.22
Al2O3 (%)12.6311.5012.16
Fe2O3 (%)3.252.402.95
FeO (%)1.410.710.93
CaO (%)6.071.252.87
MgO (%)2.461.131.74
K2O (%)2.632.432.42
Na2O (%)2.162.442.40
TiO2 (%)0.670.730.69
LOI (%)7.732.494.23
Table 2. Test program.
Sample IDAbsolute Water Content, ωa (%)Targeted Pore Water StateLoad (kPa) Sequence and
Duration for Each Load (d)
Total Duration
(d)
Targeted ValueMeasured Value
TJ-17.58.33SBW12.5-25-50-100-200-400-800 (7)49
TJ-210.011.21SBW12.5-25-50-100-200-400-800 (7)49
TJ-315.014.45SBW12.5-25-50-100-200-400-800 (7)49
TJ-420.019.56SBW + WBW12.5-25-50-100-200-400-800 (7)49
TJ-525.024.87SBW + WBW12.5-25-50-100-200-400-800 (7)49
TJ-630.030.02SBW + WBW12.5-25-50-100-200-400-800 (7)49
QD-17.58.06SBW12.5-25-50-100-200-400-800 (7)49
QD-210.010.05SBW12.5-25-50-100-200-400-800 (7)49
QD-315.015.21SBW + WBW12.5-25-50-100-200-400-800 (7)49
QD-420.020.33SBW + WBW12.5-25-50-100-200-400-800 (7)49
QD-525.024.08SBW + WBW12.5-25-50-100-200-400-800 (7)49
QD-630.029.42SBW + WBW + FW12.5-25-50-100-200-400-800 (7)49
WH-17.57.82SBW12.5-25-50-100-200-400-800 (7)49
WH-210.09.40SBW12.5-25-50-100-200-400-800 (7)49
WH-315.014.33SBW + WBW12.5-25-50-100-200-400-800 (7)49
WH-420.018.81SBW + WBW12.5-25-50-100-200-400-800 (7)49
WH-525.024.36SBW + WBW + FW12.5-25-50-100-200-400-800 (7)49
Publisher’s Note: MDPI stays neutral with regard to jurisdictional claims in published maps and institutional affiliations.

