Article

Dynamic Analysis and Extreme Response Evaluation of Lifting Operation of the Offshore Wind Turbine Jacket Foundation Using a Floating Crane Vessel

1
Key Laboratory of High Performance Ship Technology (Wuhan University of Technology), Ministry of Education, Wuhan 430063, China
2
School of Naval Architecture, Ocean and Energy Power Engineering, Wuhan University of Technology, Wuhan 430063, China
3
Sanya Science and Education Innovation Park of Wuhan University of Technology, Sanya 572025, China
4
Department of Engineering, Poly Changda Engineering Co., Ltd., Guangzhou 510620, China
5
Department of Mechanical and Structural Engineering and Materials Science, University of Stavanger, 4036 Stavanger, Norway
*
Author to whom correspondence should be addressed.
J. Mar. Sci. Eng. 2022, 10(12), 2023; https://doi.org/10.3390/jmse10122023
Submission received: 14 November 2022 / Revised: 10 December 2022 / Accepted: 15 December 2022 / Published: 18 December 2022
(This article belongs to the Topic Wind, Wave and Tidal Energy Technologies in China)

Abstract

:
The jacket is the most widely-used fixed foundation for offshore wind turbines due to its superior strength and low installation cost in relatively deep waters. Floating crane vessels are commonly used to install jacket foundations. However, the dynamic coupling between the jacket and the floating vessel might generate complex dynamic responses under wave action. The complexity of the multi-body system requires comprehensive time-domain simulations and statistical analysis to obtain reliable results, especially for the evaluation of the operational safety of offshore lift installations of a jacket foundation. In this context, this study performs numerical simulations and statistical analyses to predict the extreme responses and the preliminary allowable sea states for guiding the lowering operation of a jacket using a floating crane vessel. First, ANSYS-AQWA is used to obtain the hydrodynamic coefficients of the vessel in the frequency domain. A nonstationary time-domain simulation of jacket lowering with winches is performed to identify several preliminary critical vertical positions of the jacket from the time series in an irregular wave. The extreme responses of a target probability are evaluated by the extreme distribution model after a large number of steady-state time-domain simulations of the critical vertical positions in irregular waves. The most critical vertical position is determined from three preliminary critical vertical positions by comparing the extreme responses. Eigenvalue analysis and spectrum analysis of the most critical vertical position of the jacket are carried out to find the natural periods of the system and the dynamic coupling characteristics between different components. The influence of wave direction, significant wave height, and spectrum peak period on the dynamic responses are also analyzed in the most critical vertical position. Furthermore, the optimal wave direction is determined as the head sea. Preliminary allowable sea states are derived by comparing the calculated dynamic amplification coefficient with the defined operational criteria.

1. Introduction

Renewable energy has proven to be an extremely important direction of study to achieve carbon peaking and carbon neutrality goals while ensuring energy security. Wind energy is generally considered to be one of the cleanest sources of various types of renewable energy [1]. As an important component of wind energy, offshore wind energy has more advantages than onshore wind energy and has great development potential. In recent years, the installed capacity of offshore wind energy has been growing rapidly. According to statistics, by 2025, its share of new installed capacity in the world will rise to 21% from 6.5% in 2020 [2]. China is rich in offshore wind energy reserves and is the most important growth point of global offshore wind energy. In 2021, China added 12.689 MW of new installed capacity, with a total installed capacity of 19.7 GW, making it the world’s largest offshore wind energy market [3]. However, the utilization of offshore wind energy faces more challenges than that of onshore wind energy. One of the challenges is that the installation of an offshore wind turbine (OWT) is more costly and risky. Based on NREL’s statistical data for the 2019 reference project which has been operating for 25 years, the Levelized Cost of Energy (LOCE) for the assembly and installation of offshore wind turbines is 1.5 times that of onshore [4]. Meanwhile, the unstable and harsh marine environment leads to more complex loads on the OWT structures, especially those in contact with water, which makes offshore operations riskier. In addition, the components of the OWT need to be installed within certain tolerances; as a result the weather windows for installation operations are very limited [5]. Therefore, dynamic response assessment is of great importance in the construction planning phase for the installation of offshore wind turbines.
The foundation of an offshore wind turbine is a critical structure that supports the OWT and protects the superstructure from waves. Sea depth is one of the most important factors in the utilization of offshore wind energy because the cost of foundations increases significantly with depth [6]. The fixed foundation forms mainly include gravity foundation, monopile foundation, tripod foundation, triangle pile foundation, and suction bucket foundation, which are primarily used in water depths below 50 m [7,8]. Monopile foundations are the most widely used foundations and are mainly installed in shallow waters below 30 m. However, as the water depth and the size of the OWT increase, the diameter and length of the monopile foundation increase, leading to an increase in material and installation costs. [9]. Jacket foundations are suitable for installation in 30–50 m deep or even deeper seas, and are subjected to smaller wave and current loads compared to other structures [10]. Finally, jacket foundations are the most economical solution for large-capacity offshore wind turbines [11].
Compared to the jacket foundation used for offshore oil and gas, the jacket foundations for OWTs are smaller in weight and size. Therefore, a lifting operation is usually used for the installation of the jacket foundation of an OWT. The lifting process of the jacket foundation usually includes several steps: transportation, lift-off, lowering, docking, and concrete pouring; crane vessels are essential construction equipment. At present, the crane vessels used for the construction of offshore wind farms mainly include floating crane vessels and jack-up vessels. Jack-up vessels can provide a stable construction platform. However, due to the rapid growth of offshore wind energy in China, the supply of jack-up vessels is insufficient. Moreover, their use is more flexible due to the ability to float crane vessels to transfer quickly between foundations [5]. Therefore, the floating crane vessel is selected for the installation of the jacket foundation, and the lowering of the jacket foundation is highlighted in this study.
The lowering system of the jacket foundation is complex. For such offshore operations, time-domain simulation is required. Li et al. [12] used the time-domain simulation method based on an external connection library (DLL) to compare and analyze the influence of the vessel-shielding effects on the lowering operation of the monopile foundation and the jacket foundation of offshore wind turbines. Zhu et al. [13] studied the responses to and allowable sea state for the static and dynamic process of the lowering of the tripod foundation in the frequency domain and time domain, and the results showed that time-domain simulation is necessary for such problems. Zhang et al. [14] studied the dynamic characteristics of the coupling lifting system of the vessel-three-bucket jacket foundation during the lowering process. The hydrodynamic characteristics of the crane vessel were calculated in the frequency domain, and then the feasibility of the lowering operation was analyzed by time-domain simulation for a specific sea area. The slamming load, the lowering speed [15,16], and the change in added mass [16] for the bucket jacket are also of concern. However, there are few dynamic analyses for lowering traditional pile-jacket foundations for OWTs.
To reduce the risk of offshore operation, it is important to carry out risk management of the critical events which have the potential to affect safe operation during the planning and design stage, and to derive offshore operating extreme conditions for construction decision-making. Acero et al. [17] proposed a general method based on the extreme conditions of marine parameters for offshore operations, which can be used for various offshore operations which are affected by the environment. There are generally two critical steps in the process of assessing allowable sea states for operations using this method: defining critical events and the associated parameters, and evaluating extreme responses. Both of these critical steps require extensive dynamic response analysis using numerical simulations. Based on the numerical simulation data, the extreme response values are evaluated by mathematical methods. Zhao et al. [18] carried out the simulation of single-blade installation of an OWT, and the extreme value was evaluated based on the mean up-crossing rate method and Poisson probability distribution. The frequency spectrum analysis is used to calculate the extreme values of operation and maintenance of the OWT [19] and the lifting operation of a tripod foundation for the OWT [13]. In addition, time-domain simulation and extreme value distribution model are also used in offshore piling [20] and installation of an OWT [21]. Thus, numerical simulations and dynamic analysis are performed and statistical analysis of the data is carried out to analyze the response of the lowering system and obtain the preliminary allowable sea states.
In this study, the dynamic responses of a four-pile jacket foundation lowering system under different random wave actions are studied and a method to define the extreme response and the allowable sea state is established, which has been rarely discussed in the installation of jacket foundations of OWTs. The frequency-domain and time-domain simulations are carried out by AQWA [22,23]. The frequency domain hydrodynamic analysis of the floating crane vessel is first carried out, and the responses of the free-floating vessel under different wave directions are obtained. A multi-body coupled model of the jacket lowering operation is established, which includes a floating crane vessel, wires, a spreader bar, slings, and a jacket. The jacket is established by the tube element. Based on the results of hydrodynamic analysis, the time-domain simulations are performed. First of all, a nonstationary time-domain simulation [24] of the whole lowering operation with the winches paying out [23] at a given rate is performed. In addition, several preliminary critical vertical positions of the jacket, which are determined by the vertical position of the bottom of the jacket leg1, are found by looking at the time series of tension in the sling and wire. Then, the response maxima or minima in different wave realizations (defined by wave seeds) [5] are obtained by using steady-state time-domain simulation in irregular waves. The extreme values of the responses, which include the tension of the sling and the wire, as well as the motion of the jacket, are evaluated as extreme responses by an extreme-value distribution model. Besides, the Dynamic Amplification Factor (DAF) is defined as the ratio of the extreme value of the tension to the static tension, which is also called the extreme response. Thus, the most critical vertical position of the jacket is determined by comparing the extreme responses of the preliminary critical vertical positions. Thirdly, the natural periods and eigenvalues of the motion of the lowering system are obtained by ANSYS-AQWA [23]. Based on these results, spectrum analysis is carried out to analyze the dynamic characteristics of the lowering system. Finally, the extreme responses are used for environmental parameter analysis. The environmental parameters include wave direction, the significant wave height (Hs), and the spectral peck period (Tp). Moreover, the preliminary allowable sea states described by Tp and Hs are forecast by comparing the calculated DAF with the extreme value DAF specified by the accepted standard.

2. Mathematical Backgrounds

2.1. Frequency-Domain Analysis

In this study, frequency-domain hydrodynamic analyses of a floating crane vessel are carried out using the well-proven hydrodynamic software AQWA based on the linear potential flow theory. The jacket is not included in the frequency-domain hydrodynamic analysis, because the jacket was initially positioned above free sea level. The total velocity potential of the vessel can be expressed as follows:
φ ( X ) e i ω t = [ ( φ I + φ D ) + 6 j = 1 φ r j x j ] e i ω t
where   φ I   is the isolated space-dependent incident velocity potential, φ D   is the diffraction wave potential, φ r j is the radiation wave potential due to the jth motion, x j   is the motion amplitude of the jth degree of freedom, ω denotes the wave frequency, and i is the imaginary unit.
For the single floater, the hydrodynamic coefficients can be obtained by AQWA. The motion response will be solved using the frequency-domain equations of motion, which can be expressed as follows:
[ ω 2 ( M v + A v ( ω ) ) i ω B v ( ω ) + C v ] x ^ ( i ω ) = F ^ ( i ω )
where the matrices Mv and Cv denote the rigid-body mass matrix and hydrostatic restoring stiffness matrix of the vessel, respectively; A v ( ω ) and B v ( ω ) represent the frequency-dependent hydrodynamic added mass and damping matrices, respectively; x ^   ( i ω ) is the complex Response Amplitude Operator (RAO); F ^ ( i ω ) denotes the complex wave excitation force vector.
Because the viscosity of the fluid is not considered based on the potential flow theory, the roll RAO peak value is too large; therefore, the damping in the roll motion needs to be corrected. The critical damping [25] of the vessel motion is:
B critical = 2 ( I x x + Δ I x x ) C Roll
where   I x x is the roll moment of inertia; Δ I x x is the additional mass moment of inertia, C Roll is the roll stiffness. The 6% critical damping is used as a viscous damping modifier.
The accuracy of the time-domain model can be confirmed by comparing the time-domain motion with the RAO-based motion in the case of the freely-floating vessel. The frequency-domain RAO obtained by Equation (2) can be converted into the time-domain, and the RAO-based motion can be derived in the following expression [26]:
x R A O ( t ) = A w Re [ x ^ ( i ω ) e i ω t ]
where   x R A O   ( t ) denotes the RAO-based motion; A w refers to the amplitude of the incident wave.

2.2. Time-Domain Model

Once the frequency-domain hydrodynamic analyses of the vessel are completed, the time-domain model can be established using the inverse Fourier transform method based on the Cummins equations [27]. By considering both the lifting system and mooring system, similar to the multi-module floating system [28], the time-domain model of the floating vessel with zero forward speed can be expressed in the following:
[ M v + A v ( ) ] x ¨ v ( t ) + 0 t K ( t τ ) x ˙ v ( τ ) d τ + C v x v ( t ) = F exc ( t ) + F moor ( t ) + F v wire ( t )
where A v ( ) denotes the infinite-frequency added mass matrix of the vessel; the kernel of the convolution term K ( t ) is the matrix of the impulse response functions; x v ( t ) refers to the vector of time-domain responses; F exc ( t ) , F moor ( t ) , and F v wire ( t ) denote the vector of time-domain wave excitation forces, mooring forces, and the forces of the wires, respectively.
The parameters of the time-domain motion function can be obtained based on Ogilvie relations from the frequency-domain results [29,30]:
K ( t ) = 2 π 0 B ( ω ) cos ( ω t ) d ω
A ( ) = A ( ω ) + 1 ω 0 K ( τ ) sin ( ω τ ) d τ
According to the rigid-body motion equations, the motion equations of the jacket and the spreader bar can be expressed in the following, respectively:
M j x ¨ j ( t ) + B j x ˙ j = F j wave ( t ) + F j sling ( t )
M b x ¨ b ( t ) + B b x ˙ b = F b sling ( t ) + F b wire
where M j and M b are the mass matrix of the jacket and spreader bar, respectively; B j and B b denote the damping matrix of jacket and spreader bar, respectively; F j wave ( t ) and F j sling ( t ) are the vector of wave excitation forces and sling force of the jacket; F b sling ( t ) and F b wire are the vector of sling force and wire force of the spreader bar.
The diameter of the stabbing cones in the jacket is the largest, being 3.5 m. This diameter is relatively small compared with the wavelength. For periods from 5 s to 12 s, the diameter is less than 1/5 of the wavelength. In this case, the linear potential flow theory based on the panel method is not applicable. Thus, the Morrison equation should be used when solving for the wave forces of this structure. The tubular structure of the jacket is modelled as a slender structure in AQWA using TUBE elements. The wave force acting on the cross-section of the slender structural element can be expressed as [22,31]:
F wave = 1 2 ρ D C d | u f u s | ( u f u s ) + ρ A C m u ˙ f ρ A C a u ˙ s
where C d is the drag coefficient; D is the characteristic drag diameter; C a and C m are added mass and inertia coefficients, respectively, and C m = C a + 1 ; u f and u s are the transverse directional fluid particle velocity and the structure velocity, respectively.
The first term in the equation is the quadratic drag term. The second term is the wave excitation force, including diffraction and Froude–Krylov force. The third term is the inertial term. The C m and C d are empirically estimated and are affected by parameters such as Reynolds number, Keulegan–Carpenter number, etc. In this paper, C m and C d are taken as 2 (or C a =1) and 0.75, respectively.
The wires between the spreader bar and the crane tips are modelled by a linear elastic line and the crane winch is modelled by a linear drum winch. Figure 1 shows the paying-out condition of the crane winch. The wire tension at a moment in time can be expressed as [22]:
F w i r e = E A L u ( t ) [ L ( t ) L u ( t ) ]
E A = k L 0
L ( t ) = Z 1 ( t ) Z 2 ( t )
where E is Young’s modulus; A is the cross-sectional area; k is the line stiffness; EA is assumed to be a constant in this study; L 0 , L ( t ) , and L u ( t ) are the unstretched length at the initial stage, the stretched length at a time moment, and the unstretched free line length corresponding to L ( t ) , respectively; Z1 and Z2 are the attachment points on two points.
The slings between the jacket lift point and the spreader bar are modelled by steel wire. The sling force can be calculated as [22]:
F sling = k a ( L ( t ) L s )
where k a is the asymptotic stiffness; L s is the unstretched free line length of the sling.

2.3. Statistical Model

Statistical methods are frequently used to process a large number of results to obtain extreme responses [32], and probability distribution models are commonly used in statistical analysis. Various probability distribution models have been used in the fatigue reliability analysis of marine structures. Ten different PDFs were used to carry out statistical and probabilistic analyses of stress concentration factors (SCFs) in tubular X-connections retrofitted with the FRP of the jacket structure based on the 324 FE stress analyses, and suitable distribution models under different loads are proposed [33].
In addition, probability distribution models have also been applied to offshore operations. Rayleigh distribution [19], Gumbel distribution [21], and Weibull distribution [34] have been used for the installation, operation, and maintenance of offshore wind turbines. Rayleigh distribution is commonly used to count the amplitude of random waves and the amplitude of motion of vessels caused by random waves, and at this time, it is efficient to use the frequency domain analysis method. However, the responses of marine structure lowering operation systems are nonlinear and the Gumbel and Weibull distributions are often used. At present, Gumbel distribution has been applied to the offshore installation of tripod foundations, OWTs, subsea templates, and large subsea spool pieces [13,21,32,35]. Therefore, Gumbel’s extreme value distribution is selected as the extreme value statistical model in this study. The distribution is given as:
F X ( x ) = e x p [ e x p ( x λ κ ) ]
where X is the random variable, x represents the independent variable, and λ and κ are the location and shape parameters, respectively.
To construct a Gumbel probability paper, Equation (15) is reorganized to:
ln [ ln F X ( x ) ] = 1 κ x λ κ
In the probability paper, x is the horizontal axis and ln [ ln F X ( x ) ] is vertical axis; a Gumbel distribution will be a straight line.
For a plot in a probability paper, the data sample is formed by, first, extracting n maxima or minima from the time domain results for n wave seeds, and the sample is organized in increasing order: {x1x2 ≤⋯≤ xk ≤⋯≤ xn}. The location and shape parameters can be estimated based on the linear regression estimation using the data sample, and the empirical distribution is calculated. Next, it is checked whether the empirical distribution is close to a straight line in the probability paper. Finally, the extreme values can be calculated for a target probability of non-exceedance with the fitted Gumbel distribution. A target probability of non-exceedance between 0.9 and 0.99 is usually used based on the associated risks of the operation, and a high probability of non-exceedance may introduce high uncertainties in the extreme values when the sample size (seed number) is small [32]. The convergence of the seed number of the lowering operation is discussed in Section 5.3, and 50 wave seeds are used for each sea state. A target probability of non-exceedance of 0.95 is considered to provide a reliable prediction of the extreme responses and allowable sea states.

3. Model of the Lowering System

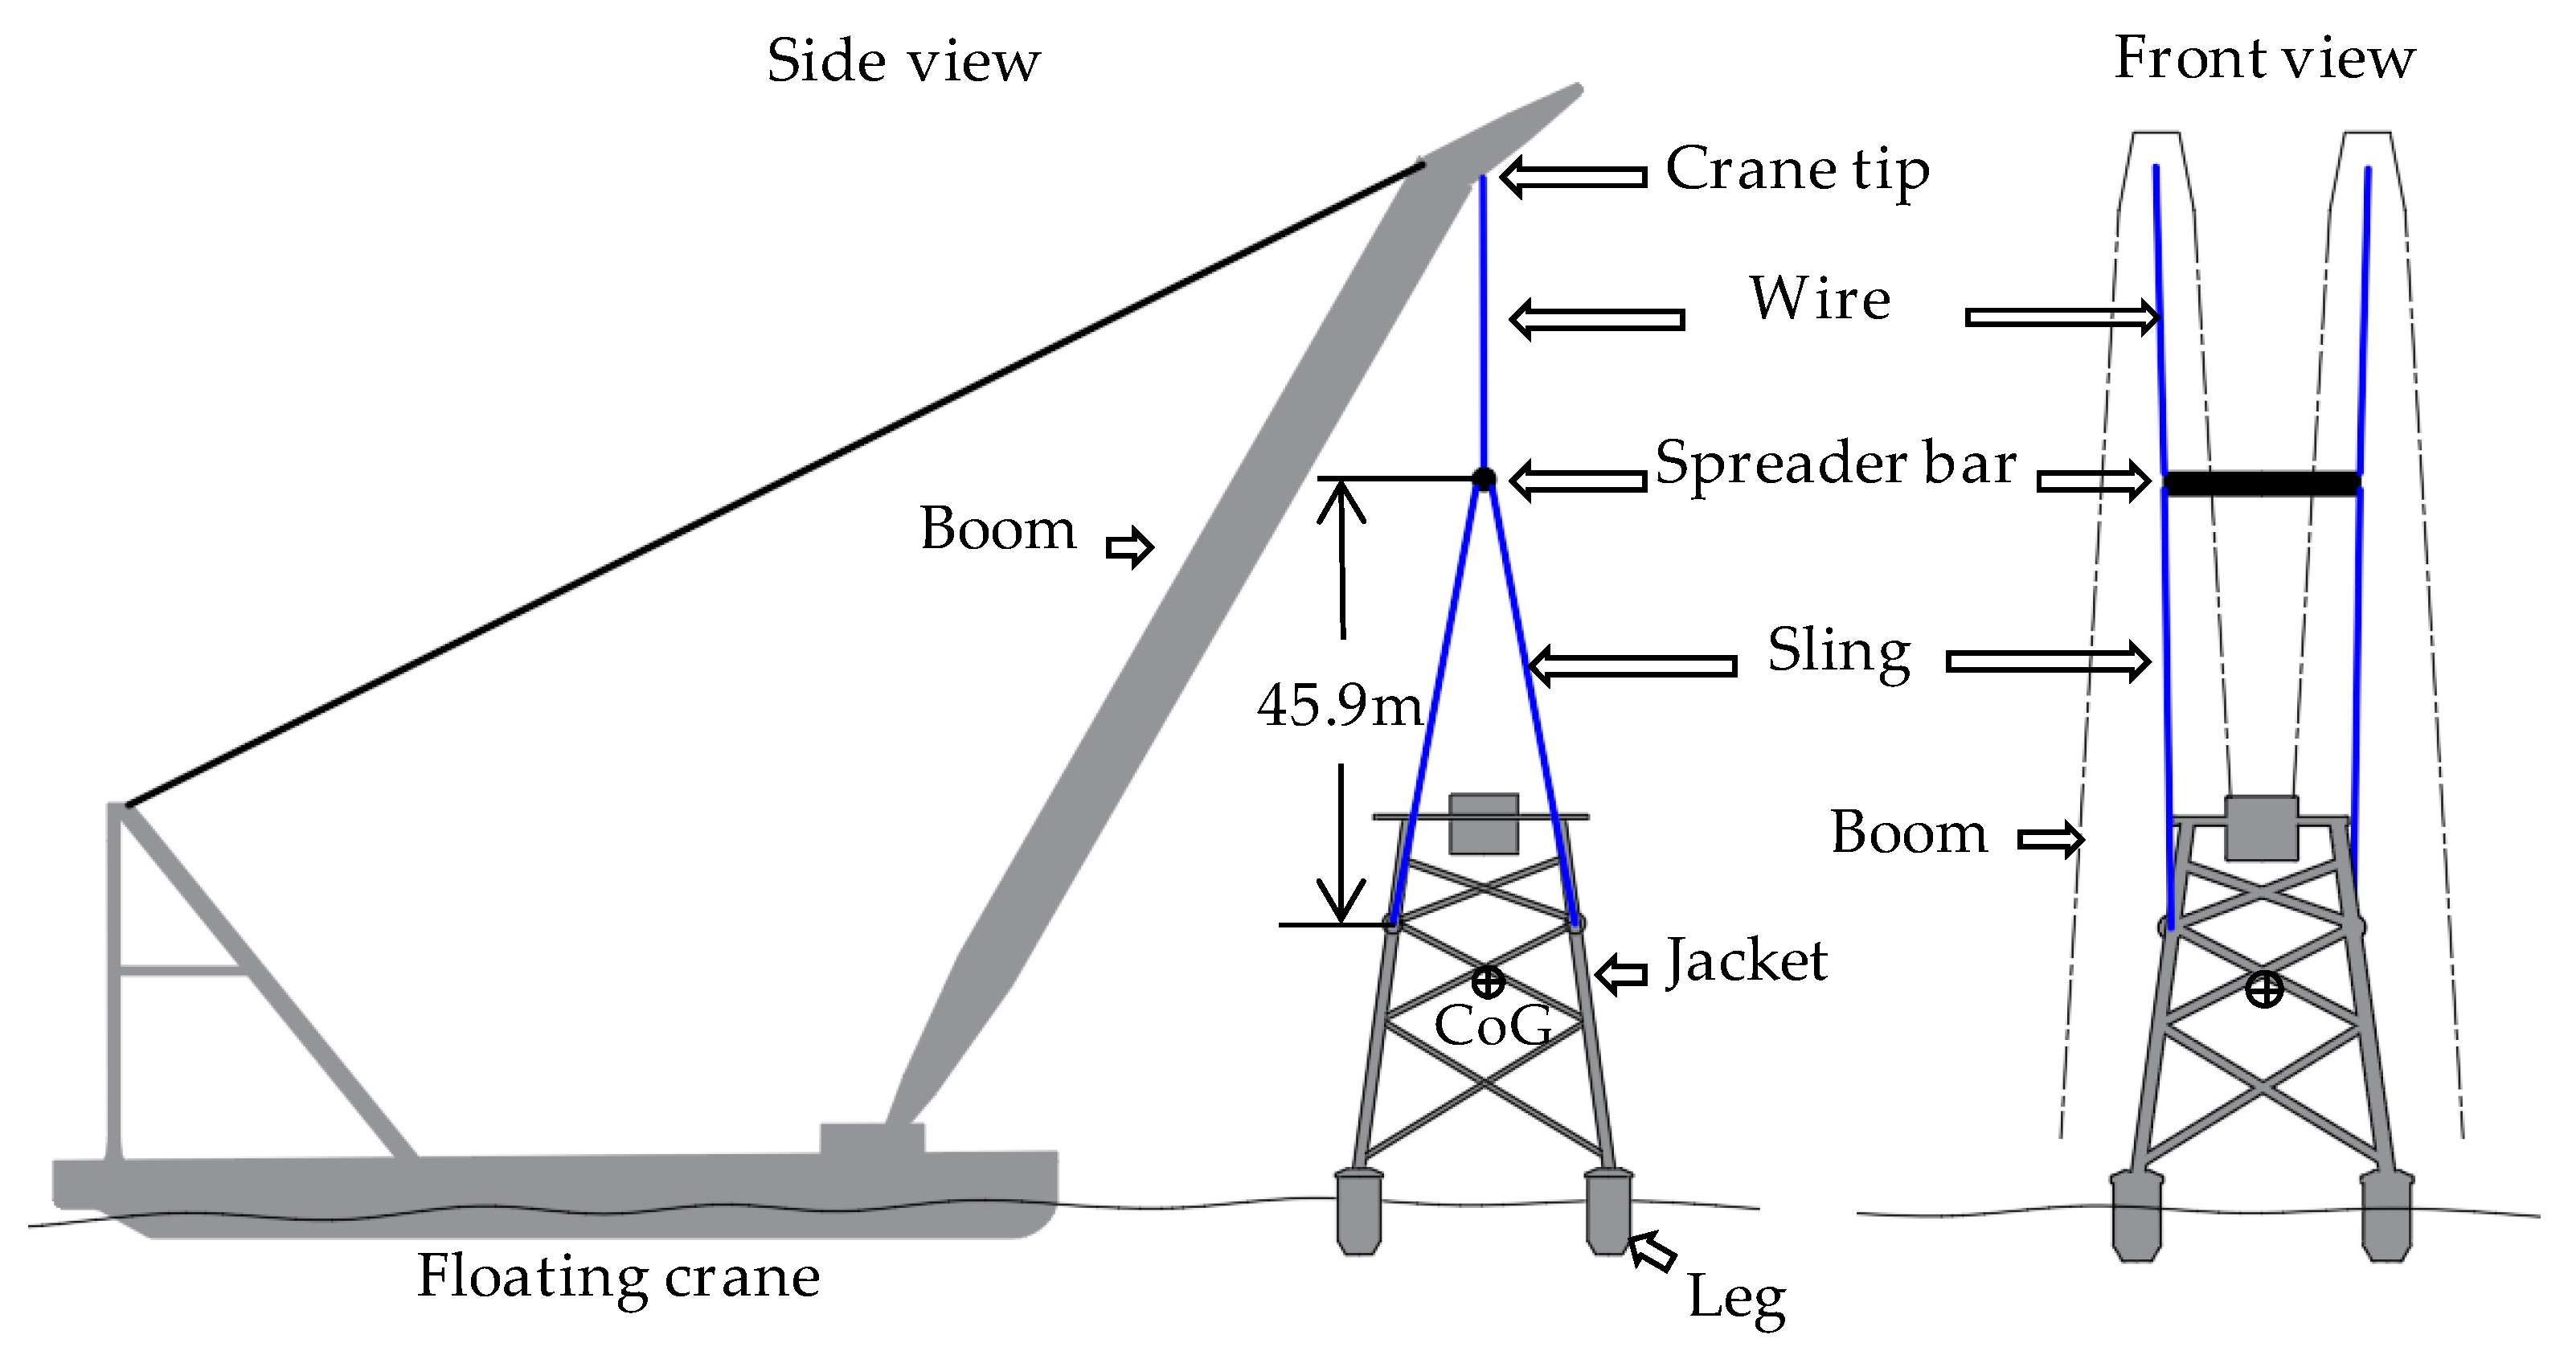
The numerical simulation code was run on a computer with Windows 64-bit operating system, AMD Ryzen 7 2700 Eight-Core Processor, 3.20 GHz of processing frequency, and 32 GB of memory. For accurate numerical simulation, a multi-body coupled model that is almost identical to the actual operation was built. The side and front views of the lowering system of the jacket are shown in Figure 2. The lowering system arrangement and the Centre of Gravity (COG) of the jacket are given. The multi-body lowering system in this study included 15 degrees of freedom (DOF), the vessel and jacket were considered 6-DOF, and the spreader bar was limited to three rotational degrees of freedom.
The numerical model and the determined data of the global coordinate system for the lowering system are shown in Figure 3. The global coordinate system is a right-handed coordinate system with the following directions: X-axis points to the bow, Y-axis points to the port, and Z-axis points up. When the vessel is stationary, the origin is at [midship section, midline, still waterline].
The jacket in this study is a four-pile jacket for a 7 MW offshore wind turbine. The main frame is composed of multiple steel pipes, and the main body height of the jacket is 42 m without legs. The bottom end of the jacket has four legs with stabbing cones, which insert into the steel pipe pile pre-drilled on the seabed during docking. The arrangement of the four legs is given in detail in Figure 8 in Chapter 5. The footprint of the jacket is 28 × 28 m, and the total mass of the jacket is 1050 t. The main parameters of the jacket are shown in Table 1. The Z-direction COG of the jacket is relative to the bottom of leg1; the COG of the other directions is relative to the origin of the global coordinate system.
The construction vessel used for the jacket installation was a double-arm luffing floating-crane vessel, as shown in Figure 2. Table 2 shows the main features of the floating crane vessel. The crane vessel has four main hooks with a single main hook lifting capacity of 800 t. For the lowering operation of the jacket, tow hooks are used. In actual operation, the crane tips and the hooks are connected by wires, and the hooks and the spreader bar are connected by short ropes. Because the rope is too short, this study ignores the connection between the hooks and the spreader bar, instead regarding the hooks and the spreader as a structure, and adds the mass of the hooks to the spreader bar. Therefore, there are two wires in this operation. The spreader bar is cylindrical. The total mass of the spreader bar and the two hooks is 72 t. In addition, the vessel is positioned by eight mooring lines, shown in Figure 3. Each mooring line is 800 m long and consists of two parts, the part connected to the anchor is the anchor chain, and the upper part is the wire rope; the parameters of the mooring lines are shown in Table 3.
In addition, the jacket is lifted by four slings, which connect the spreader bar and the jacket. The arrangement of the slings is shown in Figure 2. The COG of the spreader bar is aligned with the COG of the jacket in the vertical direction. The vertical distance between the spreader bar and the lift point in the jacket is 45.9 m. The slings have fixed lengths during the lowering operation, whereas the length of the wires increases as a function of time. The main parameters of the wire and the sling are shown in Table 4.

4. Frequency-Domain Analyses and its Validation

4.1. Hydrodynamic Analysis Settings

Hydrodynamic analyses of the floating vessel should be carried out first before the dynamic response analysis of the coupled system. In this study, the hydrodynamic analyses of the free-floating vessel were carried out by using ANSYS-AQWA. The module is symmetric along the X axes. The water depth was 29 m. The top view of the hydrodynamic analysis model is shown in Figure 4.
The boundary element method was used for the hydrodynamic analysis in ANSYS-AQWA. The wet surface of the vessel was divided into diffraction elements, the boom and trusses were built using the line body only for display viewing, and elements above the water surface were not considered in the hydrodynamic analysis. In this study, the Surface Only Meshing algorithm is used to automatically generate polygon face mesh by defining the maximum mesh size, and the 64-bit version of the AQWA solver is limited to 40,000 elements, of which 30,000 may be diffraction elements [23]. The same hydrodynamic analysis tool, ANSYS-AQWA, has been applied to multi-body systems and has been verified, and mesh convergence of this study has been checked by using the same method as the multi-body system [26]. In addition, the vessel in this study was also used in the operation of lift-off offshore platforms from a barge. A mesh size of 1.8 m was used, and the accuracy of the simulation was verified by calculating the impulse-response functions ( K ( t ) ) [36].
Considering the simulation time and accuracy, a maximum mesh size of 1.8 m was selected for simulation. Hydrodynamic analysis was performed with 15 wave directions spaced by 22.5 degrees. The frequency range was 0.05–2.4 rad/s with a frequency step of 0.052 rad/s. The computational time of each hydrodynamic simulation lasts for 1.25 h, and 4 hydrodynamic simulations were performed due to the different jacket states.

4.2. Hydrodynamic Analyses

The floating crane vessel used in this study is symmetrical along its longitudinal axis. From the 0–180 wave direction, a wave direction every 45 degrees was taken for hydrodynamic analysis. The Response Amplitude Operator (RAO) of first-order wave excitation force and motion of the floating crane vessel under different wave incident angles were calculated, as shown in Figure 5 and Figure 6. The first-order wave excitation forces in the surge, roll, and pitch directions first increased and then decreased with the increase in wave frequency, while the first-order wave excitation force in the heave direction gradually decreased. The wave forces of the following sea and head sea were larger than those of the quartering sea and the quarter head sea, except for the wave frequency range of 0.5–0.8 rad/s. The pitch wave excitation moment also showed this phenomenon. The heave exciting force was largest under the beam sea; however, the wave exciting forces of the beam sea and quartering sea gradually decreased to less than those of the following sea and head sea. Similarly, the roll wave exciting moment was the largest in the beam sea, except for the wave frequency of 12–1.4 rad/s. In addition, the wave forces of surge and pitch were slightly different under the action of two symmetrical wave directions to beam sea because of the characteristics of shape and quality.
A general phenomenon is reflected in that the motion RAOs of the surge and heave gradually decreased to zero with the increase in wave frequency, while roll and pitch showed a trend of first increasing and then decreasing. Meanwhile, the motion RAOs in two symmetrical directions relative to the beam sea were the same; therefore, only the 0–90-degree wave direction will be analyzed later in this section. The heave motion RAO showed an increasing trend with the increase in the wave direction angle; however, the opposite law also occurred when the frequency reached a certain value. The frequency corresponding to the peak value of the pitch RAO increased with the increase in wave angle.
The frequency domain RAOs are the parameters which reflect the seakeeping of the floating crane vessel, as its motion is mainly affected by waves. It can be seen that the motion and force of the crane vessel are more sensitive to the wave incident angle and wave frequency. The changes in frequency responses caused by the wave incident angle were also different under different wave frequencies.

4.3. Time-Domain Verification

Figure 7 shows the comparisons of the time-domain wave-induced motions found by Equation (5) and the time-domain responses based on the RAO found by Equation (4), with only wave excitation forces in a regular wave with a wave height of 1 m, a wave period of 7 s, and a wave direction of 0 degrees. In this case, the time domain model should be equivalent to the frequency domain model in analyzing the motion of the single vessel without the jacket, the mooring system, and the lifting system [37]. As can be seen from Figure 7, the time-domain model calculation results are in good agreement with the time-domain results directly converted from the frequency-domain RAO.

5. Time-Domain Simulation and Evaluation of Extreme Responses

5.1. Simulation Settings

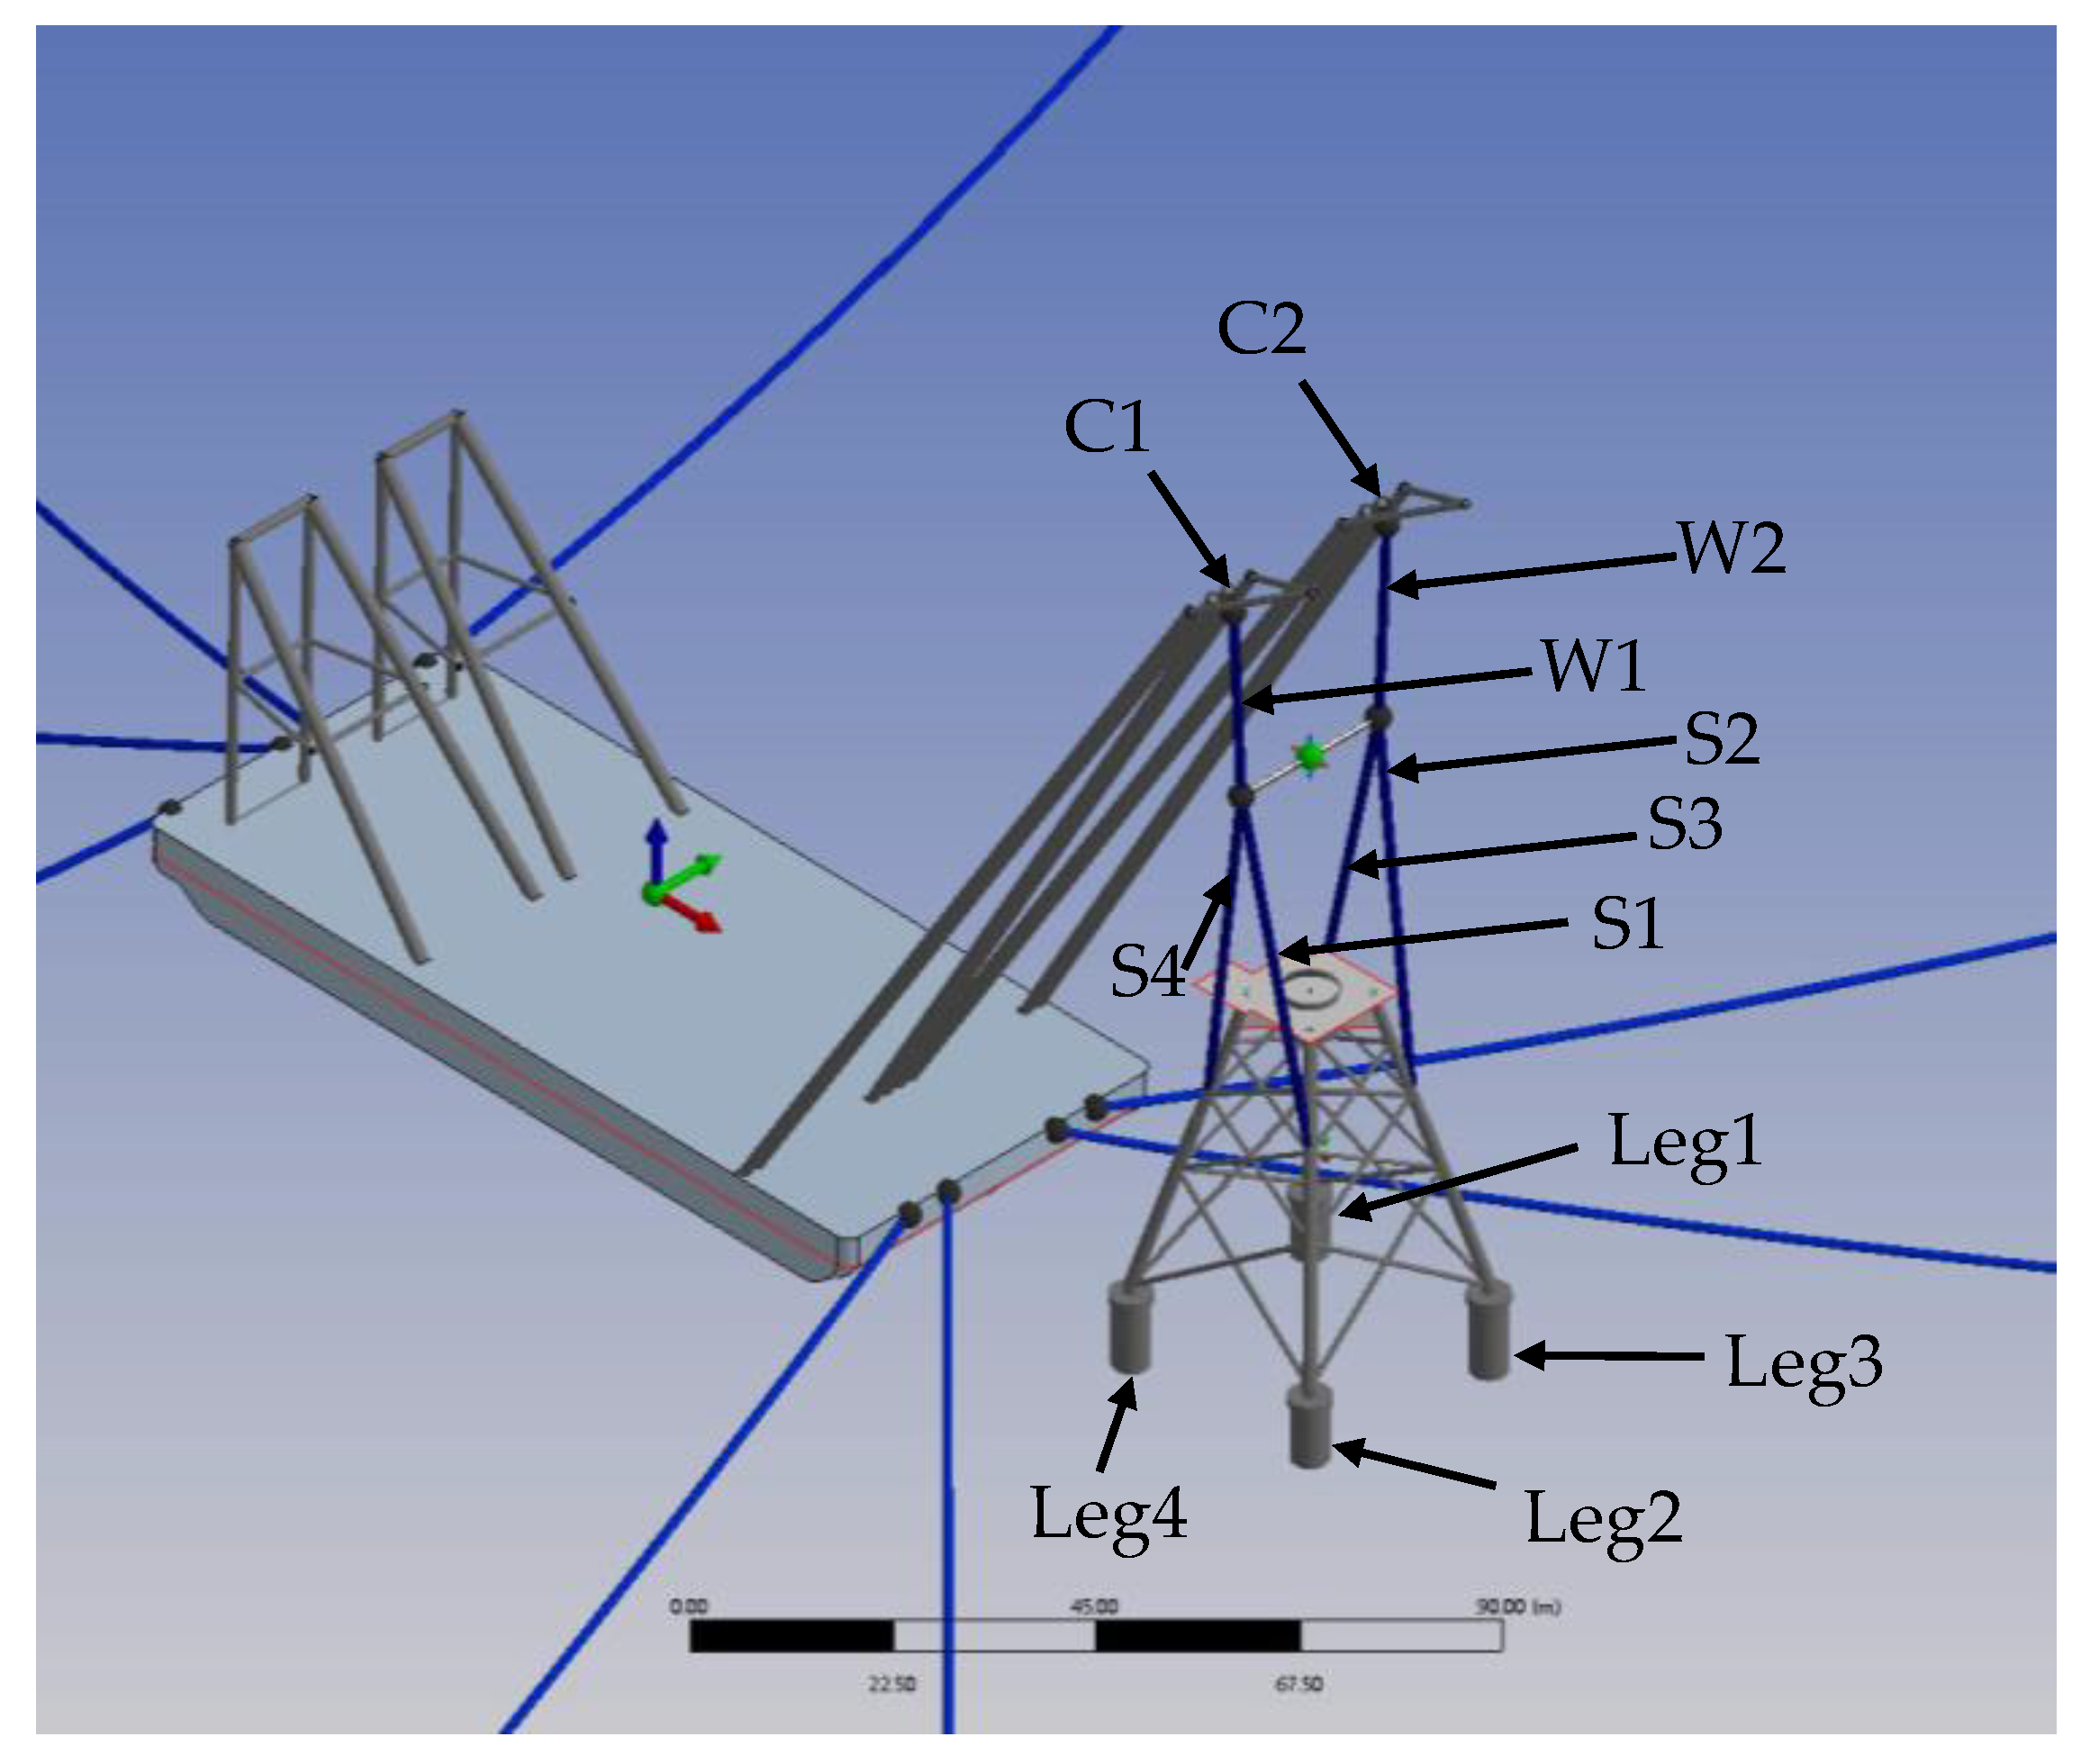
Figure 8 shows the arrangement and numbering of the lifting system. C1 and C2 represent the crane tip, W1 and W2 represent the wire, and S1–S4 represent the sling. The legs of the jacket are leg1–leg4. The time-domain motion equation, as shown in Equation (5), was solved by using a two-stage predictor-corrector numerical integration scheme in AQWA [22]. Step-by-step integration methods were applied to calculate the responses of the lowering system. The time step must be short enough to capture the highest frequencies of the resonant phenomena, and about 15 time steps are required to capture a single cycle of phenomena in the time domain [5]. Without considering the spreader bar, the lowest natural period in the system was the heave natural period of the jacket because the spreader bar had a slight impact on the system. Therefore, from Section 6.1, the time step should be smaller than the heave natural period (1.62 s) divided by 15. The dynamic simulation time step was finally chosen as 0.02 s, and the time-domain simulation time was 1000 s, corresponding to the actual computational time of 1 h.
For the whole continuous lowering operation, the winch was run at 400 s to avoid initial transient effects. Referring to the actual engineering operation, the lowering speed was 0.01 m/s for the nonstationary simulation. The total length of lowering was 25.3 m from the beginning to the position where the jacket was about 1 m away from the seabed pile, and the simulation duration was 4000 s. For the steady-state time-domain simulation of a certain position, the long-time simulations of different wave realizations were carried out.
The environmental conditions for the time-domain simulations were selected in Table 5. For each combination of Hs and Tp, the irregular waves were modelled by the JONSWAP spectrum, and the linear wave theory was used. For each case, simulations for different realizations of irregular waves were carried out to account for the variability of waves.

5.2. Selection of Preliminary Critical Vertical Positions

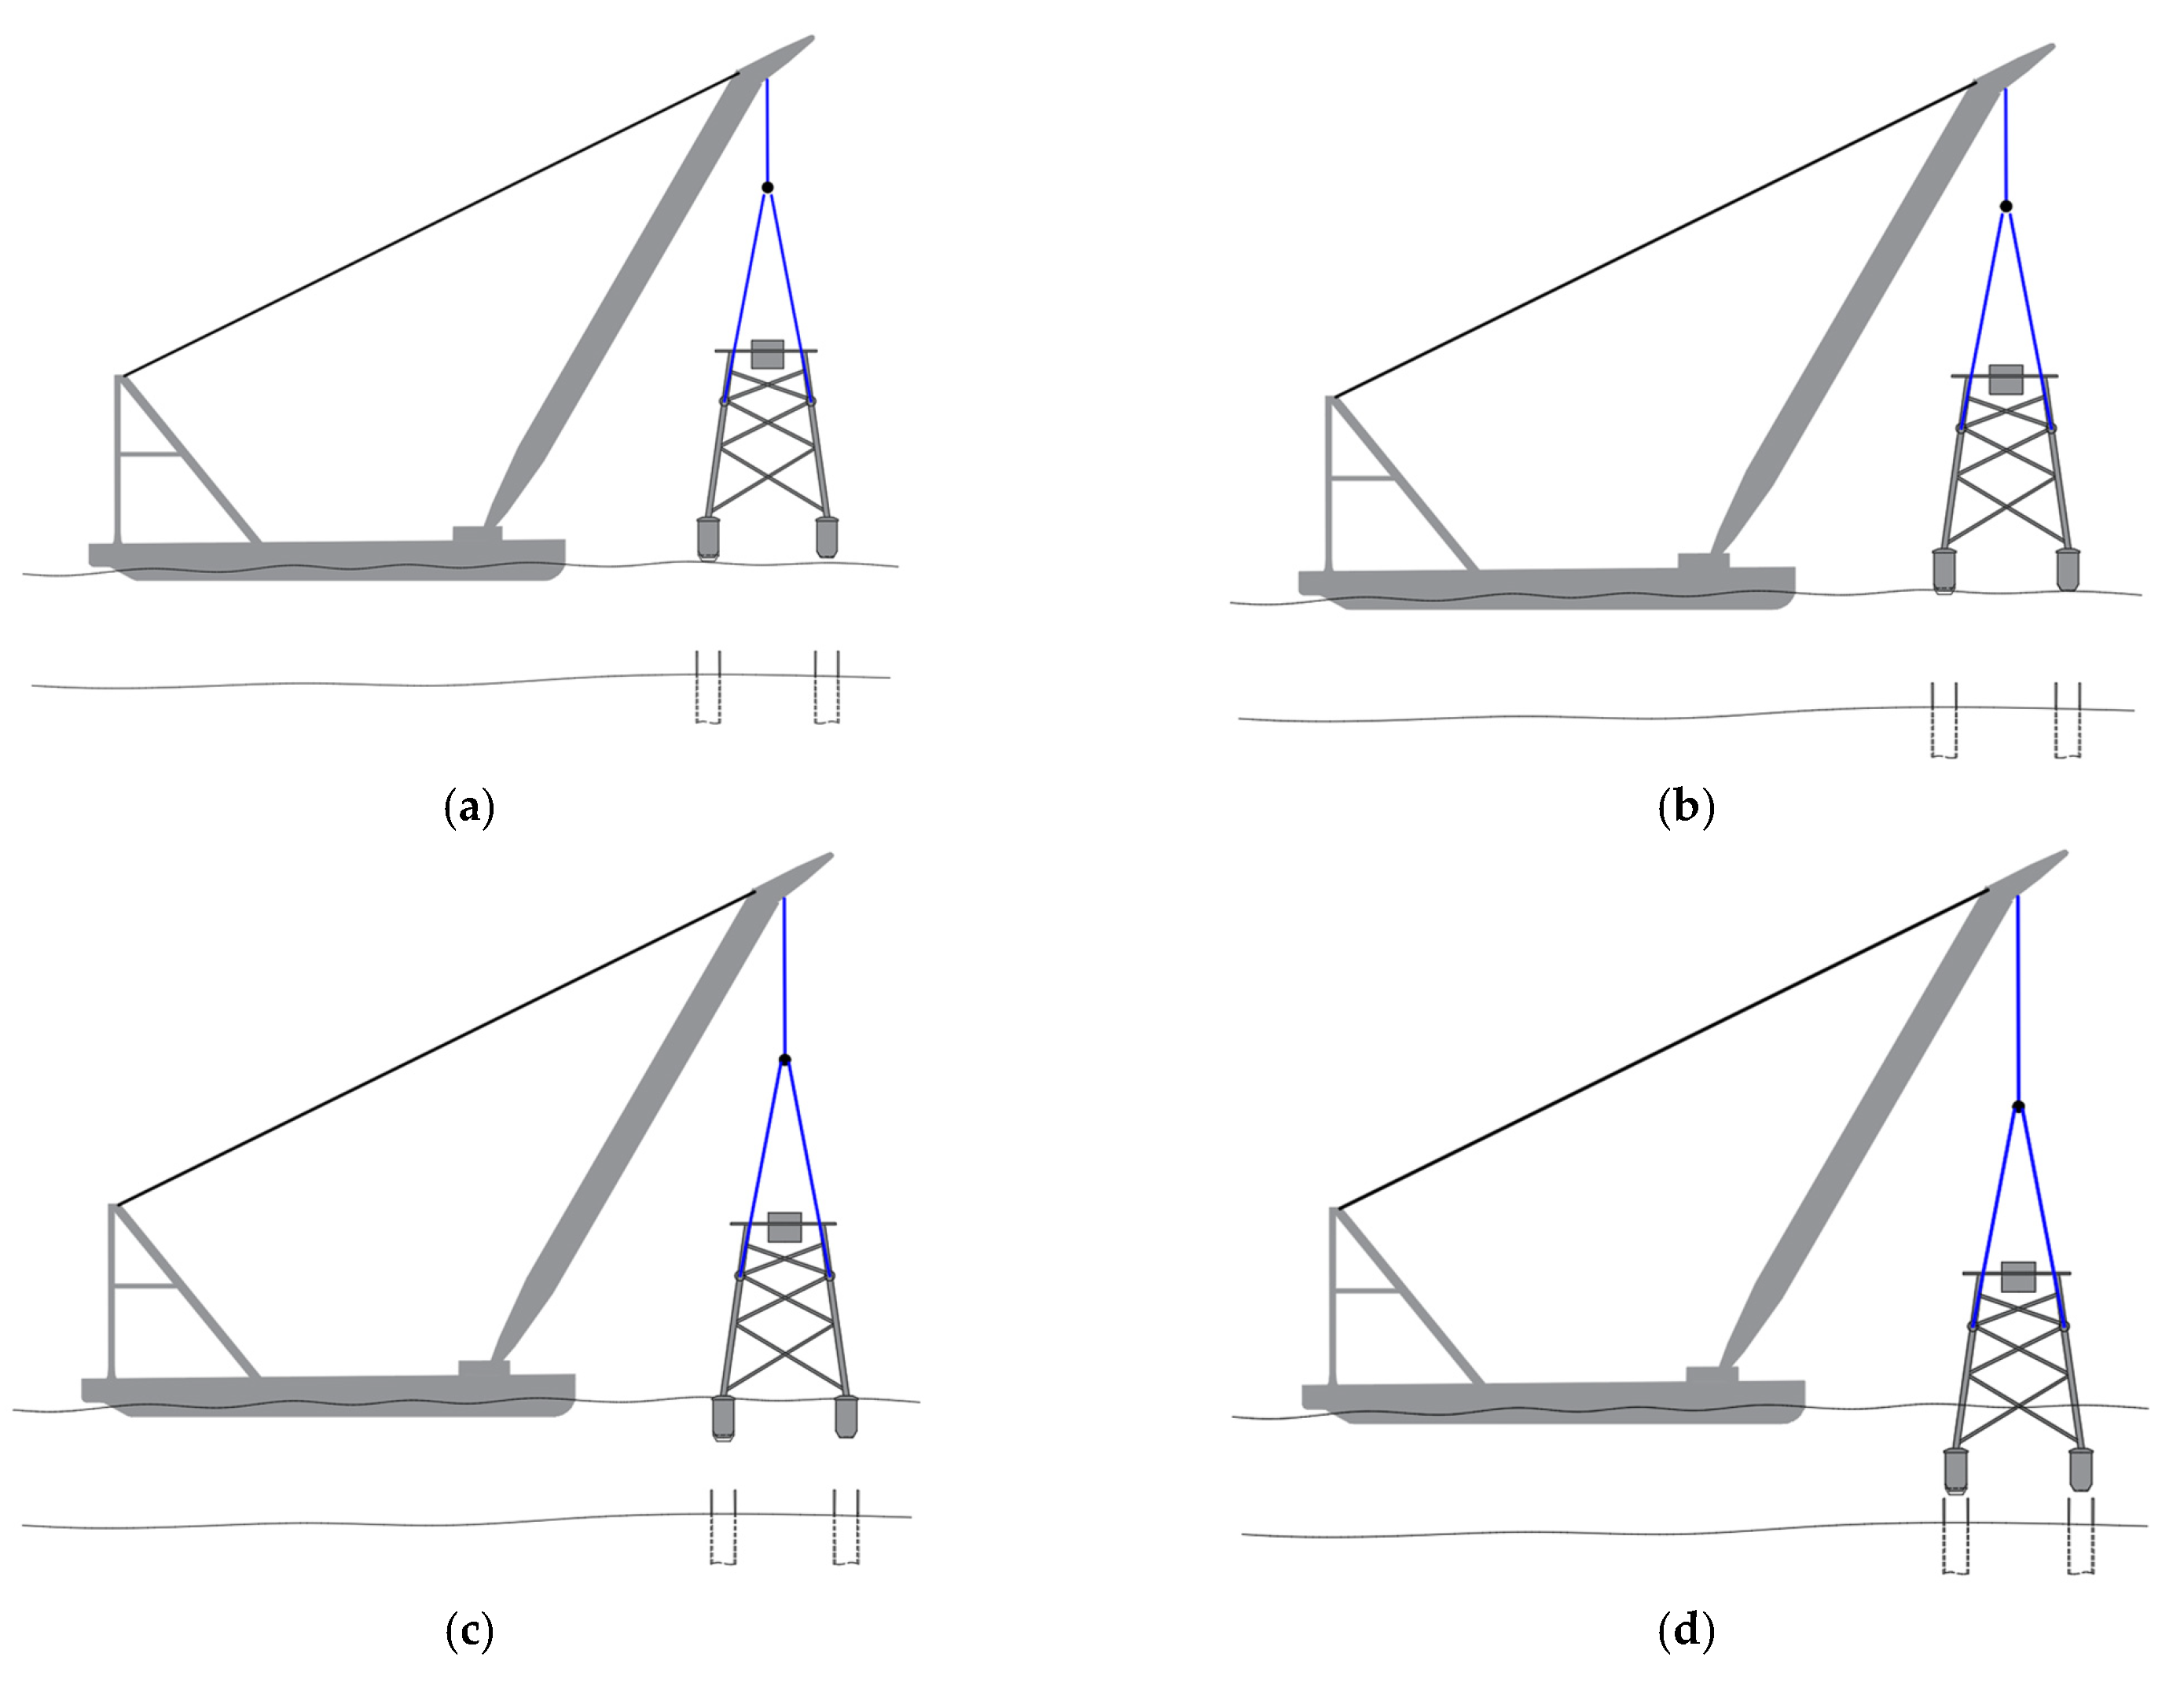
Although the simulation of the whole lowering operation of the jacket was quite time-consuming, it was necessary to conduct a nonstationary simulation of the whole lowering operation at first. The cable winches were set at the crane tips. Figure 9 shows the time series during the whole lowering process of the jacket in a sea state that is Hs = 1.5 m, Tp = 7 s, Dir = 45 deg. Sling1 and wire1 were selected for analysis due to the tension of sling1 being larger, and the tension of the two wires being similar. The preliminary positions were selected for subsequent analysis based on the maximum tension and dynamic tension amplitude of sling1 and wire1 form the time series shown in Figure 10; the four vertical positions of the jacket are marked. Since leg1 was the longest and near to the vessel, the bottom of leg1 was chosen as the reference point to define the vertical position of the jacket, and the abbreviation JL1-Z was used to indicate the vertical position of jacket.
The JL1-Z1 and JL1-Z2 positions were selected with the maximum tension, and the JL1-Z3 position was selected with the dynamic tension amplitude. According to the vertical position of the jacket, JL1-Z1 corresponds to jacket leg1 contacting the water surface. JL1-Z2 corresponds to the position where all four legs touch the water surface. JL1-Z3 is the position where the diagonal brace of the jacket enters the water. In addition, JL1-Z4 corresponds to the position where jacket leg1 is about 1 m away from the top of the pre-installed pile, and the lowering operation has been finished at this time. The four vertical positions of the jacket are shown in detail in Figure 10. This paper mainly studies the lowering operation; therefore, three jacket positions, JL1-Z1, JL1-Z2, and JL1-Z3, were finally selected as preliminary critical vertical positions for subsequent steady-state dynamic analysis.

5.3. Determination of Wave Seeds

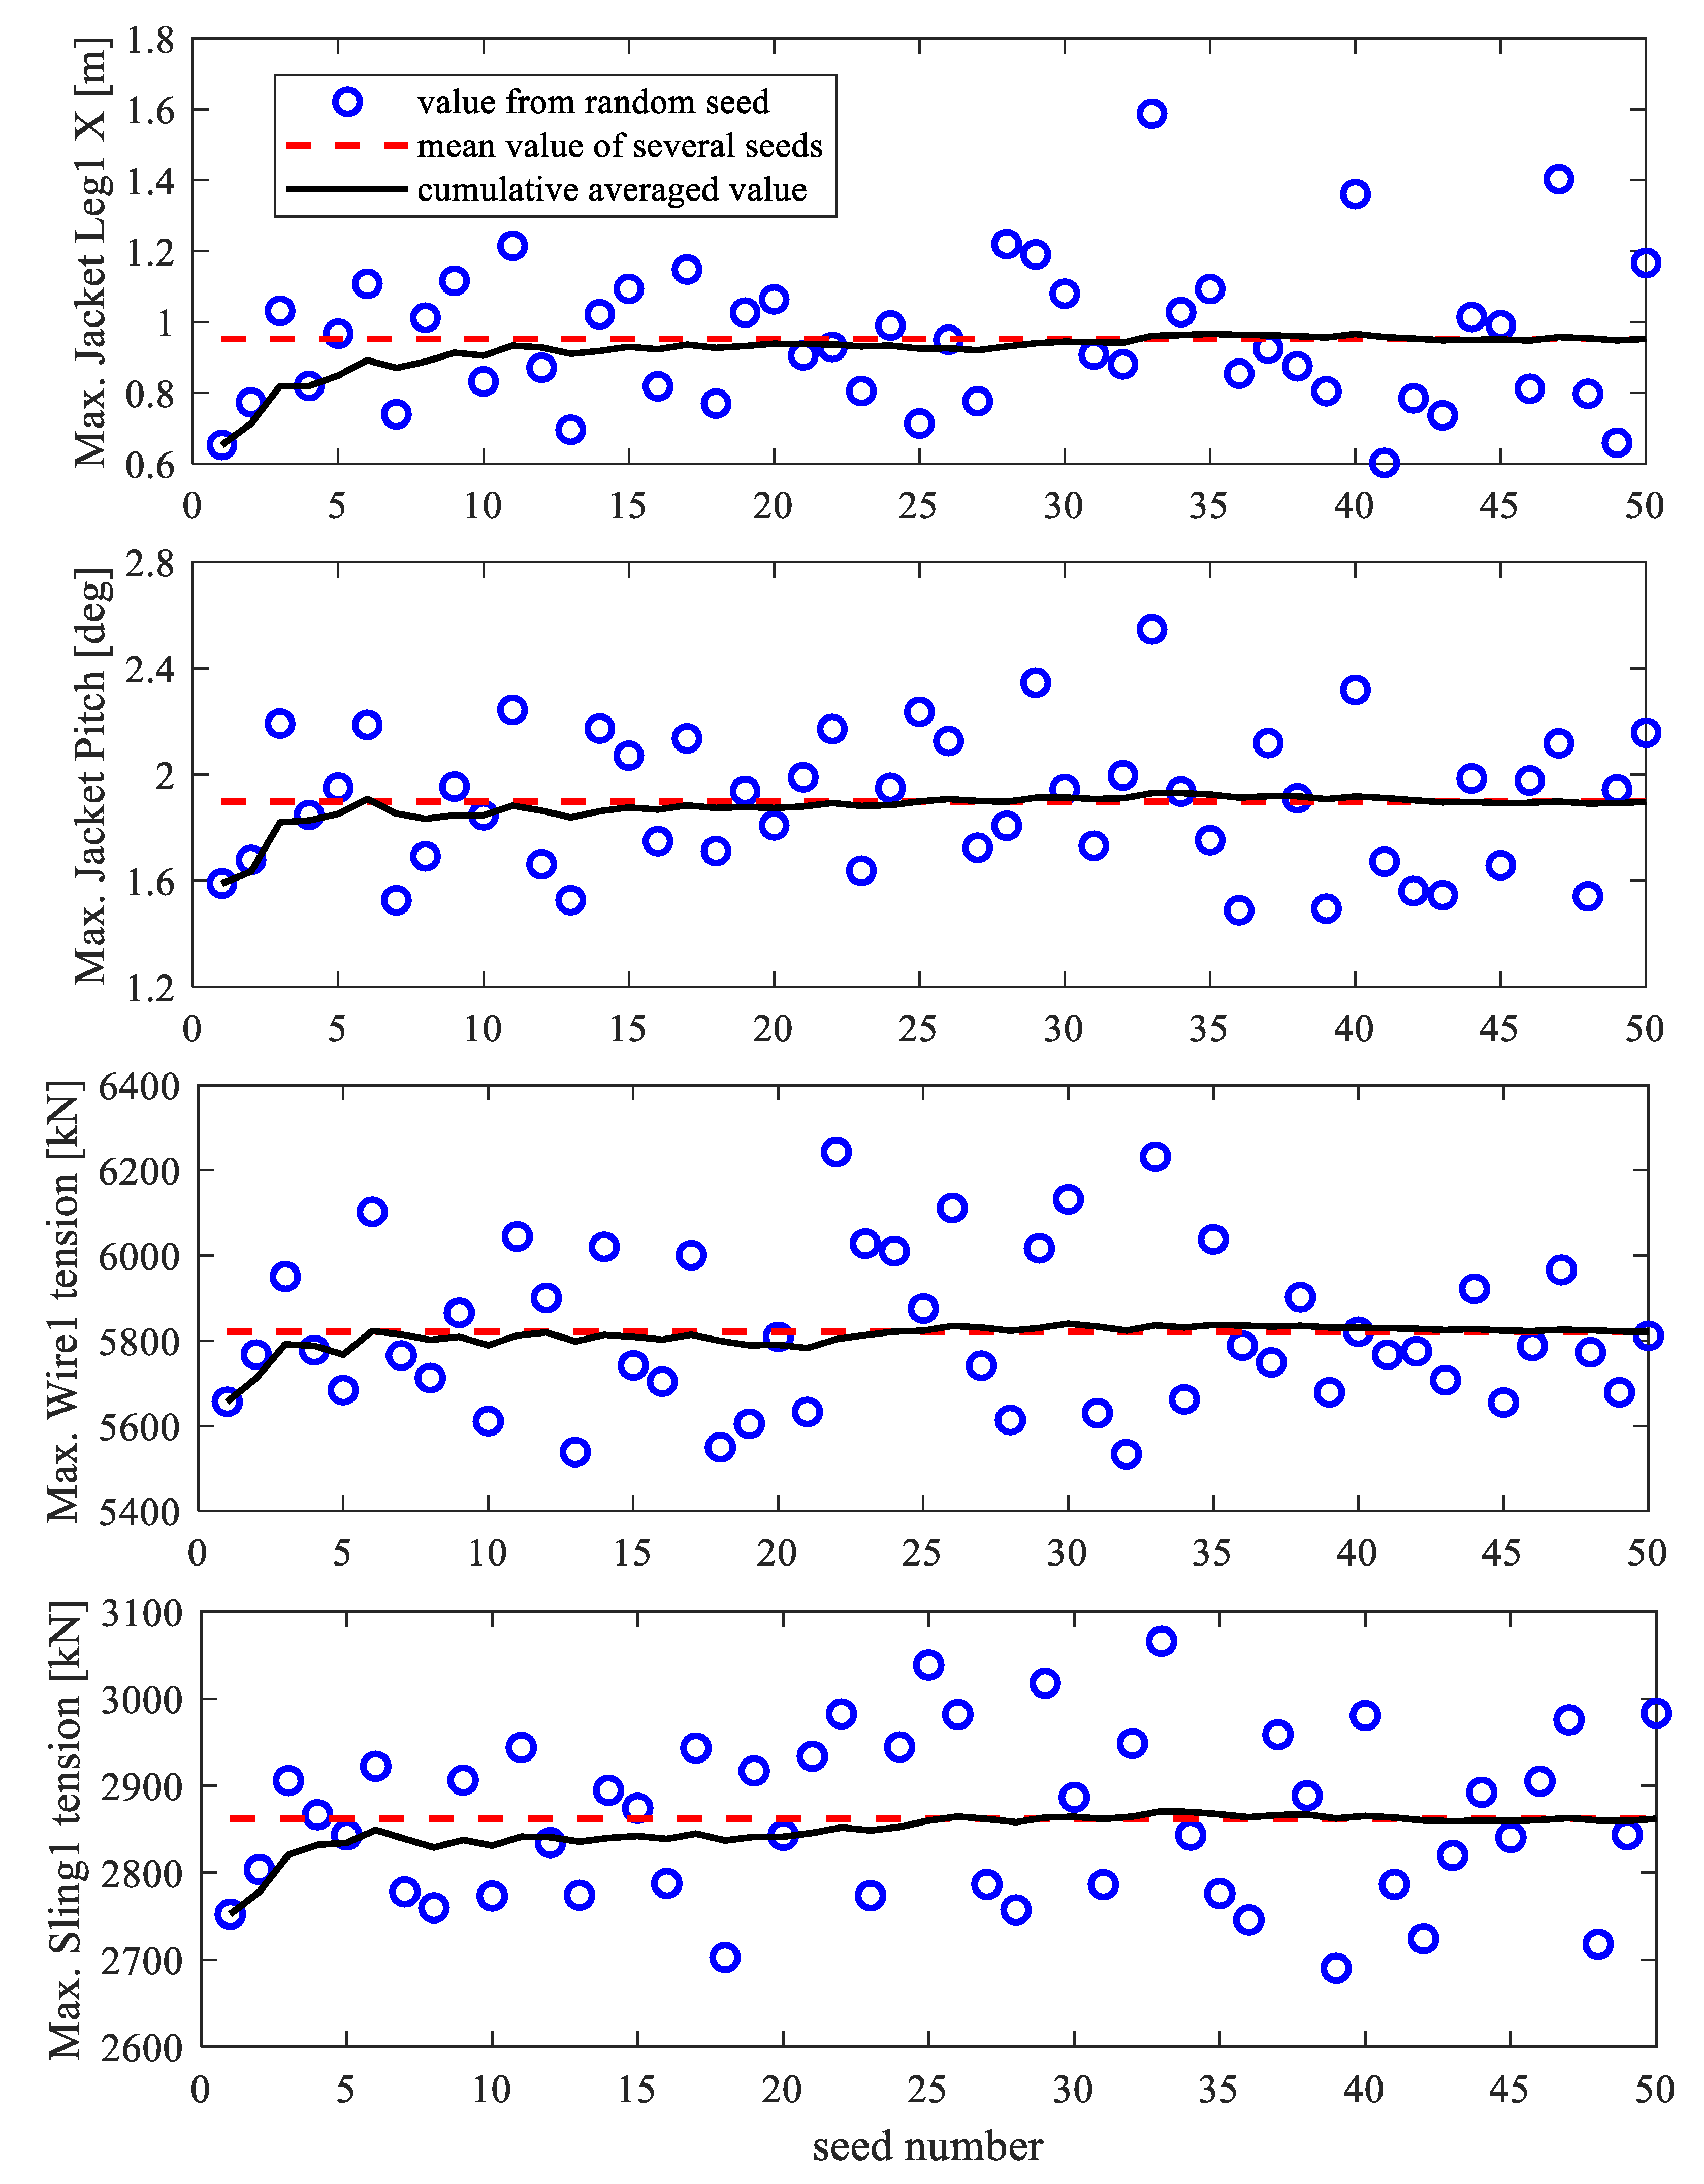
The randomness of irregular waves causes uncertainty in the calculation results. Therefore, it is necessary to determine the number and length of simulations, so as to consider the randomness of waves and provide reliable statistics. Li et al. [5,32,35] selected 20, 25, 30, and 50 wave seeds for the simulation of the lowering process of a monopile foundation, the over-boarding operation of a subsea template, and the lowering operation of a submarine spool. To obtain the number of wave seeds suitable for the lowering system studied in this study, the method proposed by Li et al. [5] is used to obtain the reliable number of wave seeds. For the lowering operation of the jacket, the motions and responses from each seed can be compared with the mean values of all the samples. Besides, a cumulative averaged value for seed number i (the mean value from seed 1 to i) can be calculated, indicating the speed of convergence.
The x-direction motion and pitch motion of the jacket were significant compared with other degrees of freedom due to the arrangement of the system as shown in Figure 8. Therefore, the x-direction motion of the bottom of the jacket leg1 (Jacket Leg1 X) and the pitch motion of the jacket (Jacket Pitch) were analyzed. The main responses considered in the convergence study were the pitch motion of the jacket, the x-direction motion of the jacket leg1, the sling1 tension (S1), and the wire1 tension (W1). Figure 11 shows the convergence results using 50 wave seeds at JL1-Z3, where the bottom of the jacket leg1 is 10 m below the water surface as shown in Figure 10c. As can be seen from the results, 50 seeds were enough to obtain convergent results for the extreme responses concerned. In the present study, 50 seeds (400 s for each seed) were used for the lowering operation. The duration of the simulation was over three hours.

5.4. Evaluation of Extreme Responses

The extreme values of critical responses are often used to forecast the allowable sea state. In this study, the tension of the sling and wire, and the motion of the jacket, are defined as the critical responses. The Gumbel extreme value distribution model mentioned in Section 2.3 is used to evaluate the extreme responses.
First of all, the maximum and minimum values of responses corresponding to each seed were obtained from the time series as the data sample. The empirical distribution of the sample data was calculated. After that, the linear regression estimation was applied to evaluate the parameters of the Gumbel distribution, and the sample was plotted into a Gumbel probability paper. Finally, the extreme values could be calculated from the fitted Gumbel distribution for a given target probability of non-exceedance.
Figure 12 shows four examples of statistical models, including the tension of sling1 and wire1, jacket leg1 motion in the x direction, and jacket pitch motion in the position of JL1-Z3. The target probability of non-exceedance of 0.95 is highlighted. Even though there is some uncertainty at the tail, this fitting shows that this example is consistent with the Gumbel distribution. The extreme values of critical responses are evaluated by this model for subsequent dynamic analysis.
The extreme responses of three preliminary positions are compared in Table 6. The motion of the jacket is relative to the equilibrium position. Because static tension and dynamic tension are different in different positions, and it is necessary to compare the DAF (the ratio of maximum tension to static tension). As can be seen from Table 6, JL1-Z3 is the most dangerous position with the largest dynamic response; therefore, JL1-Z3 was selected as the most critical position for subsequent analysis.

6. Dynamic Characteristics Analysis

6.1. Eigenvalue Analysis

To obtain the dominant natural periods of the motions for every DOF and to analyze the dynamic characteristics from the response spectrum, the eigenvalue analysis [32] of the multi-body coupled system at JL1-Z3 was performed by Stability Analysis in AQWA [23].
Eigenvalues and natural periods of the vessel, the vessel-spreader bar, and the jacket-vessel-spreader bar system are, respectively, provided in Table 7, Table 8 and Table 9, where the rotation motions of the spreader bar are excluded. Eigenvalues that dominate rigid body motion are bolded.
The natural periods of the surge, sway, and yaw of the vessel were above 25 s, which is not the wave period for offshore operation. Modes 4–6 were dominated by the heave, roll, and pitch of the vessel, respectively, and the corresponding natural period was in the range of 7 to 10 s, which can be critical for the wave conditions and should be avoided in construction. From Table 8, it can be seen that the existence of the spreader bar had little influence on the characteristic period and mode of the crane vessel. Modes 1–3 and 6–8 were dominated by the motion of the vessel. The spreader bar has three pendulum motion modes. Mode 4 and mode 5 were dominated by the surge and sway of the spreader bar. Mode 9 was dominated by the heave of the spreader bar.
However, as shown in Table 9, some eigenvalues of the system changed significantly when the jacket was lifted. The system had, in total, 14 natural periods and corresponding natural modes. The modes for which the natural periods were above 25 s are excluded. Modes 1 and 2 were dominated by the surge and sway of the jacket. Modes 3–5 were dominated by the heave, roll, and pitch of the vessel. Modes 6, 7, and 9 correspond to the pitch, roll, and heave motions of the jacket, respectively. The pendulum motion mode of the spreader bar was significantly affected by the jacket.
From the eigenvalues, significant interactions exist between the crane vessel, jacket, and spreader bar. For example, the heave and the pitch of the vessel interacted with the heave and the pitch of the jacket. There was also coupling between the motions of different degrees of freedom of the same structure, such as coupling between the pitch and the heave of the vessel, and coupling between the sway and roll of the jacket. It is expected the jacket sway motions and yaw can be excited in the range of periods above 15 s. The other motions were mainly in relatively short waves. The horizontal plane motion of the crane vessel was mainly excited in long waves, and other motions were excited by the wave conditions considered in this study.

6.2. Response Spectrum Analysis

A time-domain simulation was conducted for the position of the JL1-Z3, and the response of the system was calculated. Figure 13, Figure 14 and Figure 15 show the partial response time series and the corresponding Power Spectral Density (PSD). The motions were those of the COG of the structures. It should be noted that, since the ballast water of the crane vessel was not considered, after the jacket was lifted, the crane vessel would have a certain pitch angle, and the jacket would have a certain deviation in the X direction. The tension of Sling1 changed around 2200 kN, and that of Wire1 changed around 4500 kN.
The power of the vessel motion was concentrated near the peak frequency of the wave spectrum of 0.898 rad/s (the first peak frequency), and the second peak frequency was the natural frequency of the motion. The dominant natural periods for the heave, pitch, and roll of the vessel motion were close together and can be found in Table 9. The coupling effect of these three motions is likely to exist, which can also be obtained from Figure 13. The heave and pitch motions of the jacket were mainly caused by waves and were also affected by vessel motions from Figure 14d,e. On the other hand, the natural frequency of the jacket pitch (1.01 rad/s) was close to the wave frequency, and it resonation happened easily, as shown in Figure 14e. The first peak frequency in Figure 14f corresponds to the natural frequency of vessel and jacket surge, and the surge motion was mainly affected by low frequency waves. As can be seen from Figure 15, wire tension was mainly dominated by the wave and roll motion of the vessel, while sling tension was affected by many aspects, the most important of which were the wave and pitch of the jacket, as well as vessel pitch and jacket roll motion.

7. Preliminary Allowable Sea States

The simulations were carried out for different wave directions for Hs = 1.5 m and Tp = 7 s. The extreme values of responses are summarized in Figure 16. As can be seen from the figure, under the action of beam sea, the x-direction motion of the jacket in leg1 and pitch were the lowest, and the maximum tension in sling1 and wire1 was the largest compared to the other wave directions due to the roll motion of the vessel. In general, it was safer when the maximum tension was small and the minimum tension was large; Figure 16c–f show the same phenomenon, that is, when the maximum tension was large, the minimum tension was small. However, it is worth noting that the minimum tension value of wire1 under beam sea was 0 kN, which is not allowed. Therefore, operation in beam sea was excluded.
Without considering beam sea, the smallest pitch motion of the jacket occured in the head sea, followed by the quarter head sea, the following sea, and the quartering sea, which was mainly caused by the wave-induced motion. The motion of the jacket leg1 x direction was caused by the vessel surge motion and the pitch of the jacket, which, in the quarter head sea, was smallest, followed by the head sea, the quartering sea, and the following sea. Wire tension was smaller under the action of the following sea and the head sea, which is mainly because the wire tension is affected by the vessel roll; therefore, the closer the wave direction was to the beam sea, the greater the wire tension. Sling tension was dominated by several factors, including jacket pitch, jacket roll, and vessel pitch; thus, sling tension is smallest under the quarter head sea, followed by the head sea. On the other hand, the maximum wire tension was larger than the sling tension, which is more dangerous. Therefore, the wire tension was chosen as the most critical response for the subsequent analysis. Considering the results comprehensively, the head sea was selected as the optimal wave direction.
Under the optimal wave direction, three significant wave heights of Hs = 1 m, 1.5 m, and 2 m were selected, and the extreme responses of each significant wave height in different periods were calculated and are shown in Figure 17. As shown in the figure, the responses increased with the increase in the significant wave height, and, especially, the motion of the jacket leg1 and pitch were more sensitive to the significant wave height. According to the results of response spectrum analysis, under the considered wave environment, the surge motion and wire tension of the jacket were mainly caused by waves; therefore, the jacket leg1 motion and wire tension increase with the increase in wave period. Sling tension was affected by the motion of the jacket pitch. When the wave spectrum peak period approached the natural period of the jacket pitch (6.2 s), the response became larger, and of course, it was also affected by wave load. Thus, it can be seen from Figure 17b,d that the pitch of the jacket and sling tension will decrease in Tp = 8 s, and then increase with the increase in the period.
The allowable sea states are often determined by comparing the extreme values of the critical responses and the defined operational criteria [35]. This study focuses on the lowering operation of the jacket. The tension in the wire is considered the critical response due to the tension of the wire being larger than that of the sling. DNV-OS-H205 [38] suggests that the dynamic amplification factor should be considered when dynamic load analysis is conducted. DNV-OS-H205 gives the guiding values of DAF according to the static load. In this study, the static tension in the single wire was 4467.04 kN, and the corresponding DAF was 1.20. Because the steady-state time domain simulation results are conservative [39], the extreme value of DAF can be appropriately relaxed. According to the calculation results, it is considered safe when DAF is less than 1.22 in this study.
The DAF was calculated by the ratio of the extreme value of the maximum tension to the static tension. Table 10 summarizes the DAF under different sea states. In the sea states considered in this paper, the extreme sea states were obtained by comparing the calculated DAF with 1.21. The sea states below the extreme sea states are the allowable sea states. The preliminary allowable sea states are marked in a light green background in Table 10.

8. Conclusions

In this study, a method to evaluate the extreme responses and forecast the allowable sea states is used in the installation of the jacket foundation for OWT. A multi-body coupling system with 15-DOF for the lowering operation of the jacket foundation was addressed. Based on ANSYS-AQWA, the hydrodynamic analysis of the floating crane vessel was carried out, and the RAOs of the first-order wave excitation force and the motion of the vessel are calculated. Based on this, the nonstationary and steady-state time-domain simulations were carried out for Hs = 1.5 m, Tp = 7 s, and Dir =45 deg. The Gumbel distribution model was used to evaluate the extreme responses, and the most critical vertical jacket position was obtained. The eigenvalue analysis and spectral analysis were performed to obtain the natural periods and to clarify the dynamic characteristics. The allowable sea states of this operation were preliminarily predicted. The following concluding remarks were drawn:
(1)
From the hydrodynamic analysis, it can be seen that the seakeeping of the crane vessel is good, and the first-order wave excitation force and motion RAO of the vessel are sensitive to wave directions and wave periods;
(2)
When using the method in this study to evaluate the extreme values, the appropriate seed number may be different for different offshore operations. Fifty seeds are suitable for this system to obtain reliable results. In addition, it is the most dangerous when the brace of the jacket enters the water (JL1-Z3) during the lowering operation;
(3)
The results show that there is a strong coupling between the structures in the lowering system, and the coupling between the vessel and the jacket in heave and pitch has a great influence on the lowering operation. Additionally, the floating crane vessel and the jacket will have low-frequency resonance in surge motion. The vessel and the jacket resonate easily in the motions of pitch, heave, and roll. As this will cause a great response, it should be avoided as far as possible;
(4)
The optimal wave direction of the system is the head sea. With the wire tension as the critical response, the preliminary extreme sea states are obtained: Hs = 1 m, Tp = 10 s; Hs = 1.5 m, Tp = 8 s; Hs = 2 m, Tp = 6 m. Construction in allowable sea states (lower than extreme sea states) is considered to be safe.
It should be noted that only the preliminary allowable sea states of the lowering operation of the jacket foundation were obtained in this study, and more sea states need to be considered. The method used in this paper can also be used in other marine structures and offshore operations, such as a novel integrated mating operation of the OWT [40] and floating wind turbines considering aerodynamic loads [41], and it is a later goal of the authors to obtain the operation probability [19,39] by combining the statistical data of the marine environment. The limitation of the distribution modes is that it does not analyze the reliability of different distributions as in [33]. Moreover, since the steady-state simulation of the critical position was performed, the results obtained may be a little conservative. The present time-domain simulations are based on the use of AQWA, which directly solves the convolution integrals using the Cummins equation and, thus, is time-consuming. Future studies are recommended to establish a more efficient time-domain model based on the use of a state-space model, namely the constant parameter time-domain model [42,43]. In this way, extensive dynamic analyses can be efficiently conducted to identify the most reliable allowable sea-states for offshore lift operations of the OWT jacket foundation.

Author Contributions

Supervision, writing—review and editing, and funding acquisition, writing—original draft, M.C.; methodology, software, investigation, data curation, writing—original draft, G.Y.; writing—review and editing, C.B.L.; model, writing—review, X.Z.; methodology, writing—review and editing, L.L. All authors have read and agreed to the published version of the manuscript.

Funding

This research was funded by the National Natural Science Foundation of China, grant numbers 52171275 and 51809205, and the Natural Science Foundation of Hainan Province, PR China, grant number 520MS072.

Institutional Review Board Statement

Not applicable.

Informed Consent Statement

Not applicable.

Data Availability Statement

Not applicable.

Conflicts of Interest

The authors declare no conflict of interest.

References

  1. Premalatha, M.; Abbasi, T.; Abbasi, S.A. Wind energy: Increasing deployment, rising environmental concerns. Renew. Sustain. Energy Rev. 2014, 31, 270–288. [Google Scholar] [CrossRef]
  2. Council, G.W.E. GWEC Global Wind Report 2021; Global Wind Energy Council: Brussels, Belgium, 2021. [Google Scholar]
  3. WFO. Global Offshore Wind Report 2021; World Forum Offshore Wind: Hamburg, Germany, 2022. [Google Scholar]
  4. Stehly, T.; Beiter, P.; Duffy, P. 2019 Cost of Wind Energy Review; National Renewable Energy Lab (NREL): Golden, CO, USA, 2020. [Google Scholar]
  5. Li, L.; Gao, Z.; Moan, T. Numerical simulations for installation of offshore wind turbine monopiles using floating vessels. In Proceedings of the 32th International Conference on Offshore Mechanics and Arctic Engineering, Nantes, France, 9–14 June 2013; p. V008T09A076. [Google Scholar] [CrossRef] [Green Version]
  6. Oh, K.-Y.; Nam, W.; Ryu, M.S.; Kim, J.-Y.; Epureanu, B.I. A review of foundations of offshore wind energy convertors: Current status and future perspectives. Renew. Sustain. Energy Rev. 2018, 88, 16–36. [Google Scholar] [CrossRef]
  7. Wu, X.; Hu, Y.; Li, Y.; Yang, J.; Duan, L.; Wang, T.; Adcock, T.; Jiang, Z.; Gao, Z.; Lin, Z. Foundations of offshore wind turbines: A review. Renew. Sustain. Energy Rev. 2019, 104, 379–393. [Google Scholar] [CrossRef] [Green Version]
  8. Zhu, H.; Du, Z.; Wu, J.; Sun, Z. Innovation environment and opportunities of offshore wind turbine foundations: Insights from a new patent analysis approach. World Pat. Inf. 2022, 68, 102092. [Google Scholar] [CrossRef]
  9. Aliyar, S.; Meyer, J.; Sriram, V.; Hildebrandt, A. Experimental investigation of offshore crane load during installation of a wind turbine jacket substructure in regular waves. Ocean Eng. 2021, 241, 109979. [Google Scholar] [CrossRef]
  10. Gong, W. Lattice Tower Design of Offshore Wind Turbine Support Structures. Master’s Thesis, Norwegian University of Science and Technology, Trondheim, Norway, 2011. [Google Scholar]
  11. Chen, I.-W.; Wong, B.-L.; Lin, Y.-H.; Chau, S.-W.; Huang, H.-H. Design and analysis of jacket substructures for offshore wind turbines. Energies 2016, 9, 264. [Google Scholar] [CrossRef] [Green Version]
  12. Li, L.; Gao, Z.; Moan, T. Comparative study of lifting operations of offshore wind turbine monopile and jacket substructures considering vessel shielding effects. In Proceedings of the Twenty-fifth International Ocean and Polar Engineering Conference, Kona, HI, USA, 21 June 2015; p. ISOPE-I-15-084. [Google Scholar]
  13. Zhu, H.; Li, L.; Ong, M. Study of lifting operation of a tripod foundation for offshore wind turbine. In Proceedings of the IOP conference series: Materials science and engineering, Proceeding of the First Conference of Computational Methods in Offshore Technology (COTech2017), Stavanger, Norway, 30 November–1 December 2017; Volume 276, p. 012012. [Google Scholar] [CrossRef] [Green Version]
  14. Zhang, P.; Zhang, S.; Wei, Y.; Le, C.; Ding, H. Hydrodynamic characteristics of the crane vessel-three-bucket jacket foundation coupling hoisting system during the process of lowering. Ocean Eng. 2022, 250, 111034. [Google Scholar] [CrossRef]
  15. Zhang, P.; Ding, H.; Le, C. Response analysis of a lowering operation for a three-bucket jacket foundation for offshore wind turbines. Renew. Energy 2022, 185, 564–584. [Google Scholar] [CrossRef]
  16. Van Doorn, N.T. Environmental Limitations in Suction Bucket Based Jacket Foundation Installation, Using Vertical Lift-Off from a Jack-Up Vessel. Master’s Thesis, Delf University of Technology, Delf, The Netherlands, 2016. [Google Scholar]
  17. Acero, W.G.; Li, L.; Gao, Z.; Moan, T. Methodology for assessment of the operational limits and operability of marine operations. Ocean Eng. 2016, 125, 308–327. [Google Scholar] [CrossRef]
  18. Zhao, Y.; Cheng, Z.; Sandvik, P.C.; Gao, Z.; Moan, T. An integrated dynamic analysis method for simulating installation of single blades for wind turbines. Ocean Eng. 2018, 152, 72–88. [Google Scholar] [CrossRef]
  19. Li, B.; Qiao, D.; Zhao, W.; Hu, Z.; Li, S. Operability analysis of SWATH as a service vessel for offshore wind turbine in the southeastern coast of China. Ocean Eng. 2022, 251, 111017. [Google Scholar] [CrossRef]
  20. Li, L.; Acero, W.G.; Gao, Z.; Moan, T. Assessment of allowable sea states during installation of offshore wind turbine monopiles with shallow penetration in the seabed. J. Offshore Mech. Arct. Eng. 2016, 138, 4. [Google Scholar] [CrossRef]
  21. Acero, W.G.; Gao, Z.; Moan, T. Assessment of the dynamic responses and allowable sea states for a novel offshore wind turbine installation concept based on the inverted pendulum principle. Energy Procedia 2016, 94, 61–71. [Google Scholar] [CrossRef] [Green Version]
  22. Ansys, A. AQWA Theory Manual; AQWA: Canonsburg, PA, USA, 2020. [Google Scholar]
  23. Ansys, A. AQWA User’s Manual; AQWA: Canonsburg, PA, USA, 2020. [Google Scholar]
  24. Li, L.; Gao, Z.; Moan, T. Response analysis of a nonstationary lowering operation for an offshore wind turbine monopile substructure. J. Offshore Mech. Arct. Eng. 2015, 137, 5. [Google Scholar] [CrossRef]
  25. Han, X.; Sævik, S.; Leira, B.J. A sensitivity study of vessel hydrodynamic model parameters. In Proceedings of the 39th International Conference on Offshore Mechanics and Arctic Engineering, Virtual, Online, 3–7 August 2020; p. V001T01A039. [Google Scholar] [CrossRef]
  26. Zou, M.; Chen, M.; Zhu, L.; Li, L.; Zhao, W. A constant parameter time domain model for dynamic modelling of multi-body system with strong hydrodynamic interactions. Ocean. Eng. 2023, 268, 113376. [Google Scholar] [CrossRef]
  27. Cummins, W. The impulse response function and ship motions. Schiffstechnik 1962, 9, 101–109. [Google Scholar]
  28. Chen, M.; Guo, H.; Wang, R.; Tao, R.; Cheng, N. Effects of gap resonance on the hydrodynamics and dynamics of a multi-module floating system with narrow gaps. J. Mar. Sci. Eng. 2021, 9, 1256. [Google Scholar] [CrossRef]
  29. Ogilvie, T.F. Recent Progress toward the Understanding and Prediction of Ship Motions. In Proceedings of the 5th Symposium on Naval Hydrodynamics, Bergen, Norway, 10–12 September 1964; Available online: https://ci.nii.ac.jp/naid/20000327176/ (accessed on 3 May 2022).
  30. Li, C.B.; Choung, J. Effects on strain-and strain rate-dependent nonlinear mooring line stiffness on floating platform motion. Ocean Eng. 2021, 241, 110011. [Google Scholar] [CrossRef]
  31. Li, C.B.; Chen, M.; Choung, J. The quasi-static response of moored floating structures based on minimization of mechanical energy. J. Mar. Sci. Eng. 2021, 9, 960. [Google Scholar] [CrossRef]
  32. Li, L.; Amer, A.M.; Zhu, X. Numerical analysis of an over-boarding operation for a subsea template. J. Ocean Eng. Sci. 2021, 6, 146–159. [Google Scholar] [CrossRef]
  33. Nassiraei, H.; Rezadoost, P. Development of a probability distribution model for the SCFs in tubular X-connections retrofitted with FRP. Structures 2022, 36, 233–247. [Google Scholar] [CrossRef]
  34. Gintautas, T.; Sørensen, J.D.; Vatne, S.R. Towards a risk-based decision support for offshore wind turbine installation and operation & maintenance. Energy Procedia 2016, 94, 207–217. [Google Scholar]
  35. Li, L.; Parra, C.; Zhu, X.; Ong, M.C. Splash zone lowering analysis of a large subsea spool piece. Mar. Struct. 2020, 70, 102664. [Google Scholar] [CrossRef]
  36. Zhang, Z.; Lu, H.; Yuan, G.; Chen, M. Analysis of the hydrodynamic interaction characteristics and dynamic responses of multi vessels during lifting of the pile stabilizing construction platform of offshore wind turbine. Ocean. Eng. 2022, 3, 40. (In Chinese) [Google Scholar] [CrossRef]
  37. Chen, M.; Xiao, P.; Zhang, Z.; Sun, L.; Li, F. Effects of the end-stop mechanism on the nonlinear dynamics and power generation of a point absorber in regular waves. Ocean Eng. 2021, 242, 110123. [Google Scholar] [CrossRef]
  38. DNV. Offshore Standard DNV-OS-H205; Lifting Operations: Berum, Wiken, Norway, 2014. [Google Scholar]
  39. Li, L.; Gao, Z.; Moan, T. Operability analysis of monopile lowering operation using different numerical approaches. Int. J. Offshore Polar Eng. 2016, 26, 88–99. [Google Scholar] [CrossRef] [Green Version]
  40. Chen, M.; Wang, F.; Zhu, L.; Pedersen, P.T. Dynamic analysis of offshore wind turbine installation based on a novel integrated mating method. In Proceedings of the 30th International Ocean and Polar Engineering Conference, Virtual, 11 October 2020. ISOPE-I-20-1192. [Google Scholar]
  41. Shi, W.; Zhang, L.; Karimirad, M.; Michailides, C.; Jiang, Z.; Li, X. Combined effects of aerodynamic and second-order hydrodynamic loads for floating wind turbines at different water depths. Appl. Ocean Res. 2023, 130, 103416. [Google Scholar] [CrossRef]
  42. Zhu, L.; Zou, M.; Chen, M.; Li, L. Nonlinear dynamic analysis of float-over deck installation for a GBS platform based on a constant parameter time domain model. Ocean Eng. 2021, 235, 109443. [Google Scholar] [CrossRef]
  43. Chen, M.; Eatock Taylor, R.; Choo, Y.S. Investigation of the complex dynamics of float-over deck installation based on a coupled heave-roll-pitch impact model. Ocean Eng. 2017, 137, 262–275. [Google Scholar] [CrossRef]
Figure 1. Simulation of wire in AQWA.
Jmse 10 02023 g001
Figure 2. General sketch of the lowering system in an arbitrary location.
Jmse 10 02023 g002
Figure 3. Numerical model of the lowering system of the jacket in AQWA (top view).
Jmse 10 02023 g003
Figure 4. Top view of the hydrodynamic model and the incidence angle of waves.
Jmse 10 02023 g004
Figure 5. First-order wave excitation force RAOs. (a) Surge; (b) Heave; (c) Roll; (d) Pitch.
Jmse 10 02023 g005
Figure 6. Motion RAOs. (a) Surge; (b) Heave; (c) Roll; (d) Pitch.
Jmse 10 02023 g006
Figure 7. Comparison of the time-domain motions and the RAO-based responses. (a) Comparison of the heave motions; (b) Comparison of the pitch motions.
Jmse 10 02023 g007
Figure 8. Time-domain simulation model and lifting system arrangement.
Jmse 10 02023 g008
Figure 9. Response time series of the entire lowering process. (Hs = 1.5 m, Tp = 7 s, Dir = 45 deg, Nonstationary).
Jmse 10 02023 g009
Figure 10. Vertical positions of the jacket. (a) JL1-Z1; (b) JL1-Z2; (c) JL1-Z3; (d) JL1-Z4.
Jmse 10 02023 g010
Figure 11. Convergence test results. (Hs = 1.5 m, Tp = 7 s, Dir = 45 deg, JL1-Z3).
Jmse 10 02023 g011
Figure 12. Fitted Gumbel distributions of extreme responses using 50 seeds. (Hs=1.5 m, Tp=7 s, Dir=45 deg, JL1-Z3). (a) Jacket leg1 X motion; (b) Jacket pitch motion; (c) Wire1 tension; (d) Sling1 tension.
Jmse 10 02023 g012
Figure 13. Response time series and PSD of vessel motion (Hs = 1.5 m, Tp = 7 s, Dir = 45 deg, JL1-Z3). (a) Time series of vessel heave; (b) Time series of vessel pitch; (c) Time series of vessel roll; (d) PSD of vessel heave; (e) PSD of vessel pitch; (f) PSD of vessel roll.
Jmse 10 02023 g013
Figure 14. Response time series and PSD of jacket motion (Hs=1.5 m, Tp=7 s, Dir=45 deg, JL1-Z3). (a) Time series of jacket heave; (b) Time series of jacket pitch; (c) Time series of jacket surge; (d) PSD of jacket heave; (e) PSD of jacket pitch; (f) PSD of jacket surge.
Jmse 10 02023 g014
Figure 15. Response time series and PSD of tension of the Sling1 and Wire1 (Hs = 1.5 m, Tp = 7 s, Dir = 45 deg, JL1-Z3). (a) Time series of wire1 tension; (b) Time series of sling1 tension; (c) PSD of wire1 tension; (d) PSD of sling1 tension.
Jmse 10 02023 g015
Figure 16. Extreme responses of several wave directions. (Hs = 1.5 m, Tp = 7 s, JL1-Z3). (a) Max motion of jacket leg1 X; (b) Max motion of jacket pitch; (c) Max tension of wire1; (d) Min tension of wire1; (e) Max tension of sling1; (f) Min tension of sling1.
Jmse 10 02023 g016
Figure 17. Extreme responses for several sea states (Dir = 180 deg, JL1-Z3). (a) Max motion of jacket leg1 X; (b) Max motion of jacket pitch; (c) Max tension of wire1; (d) Max tension of sling1.
Jmse 10 02023 g017
Table 1. Main parameters of the jacket platform.
Module CharacteristicValue
Total mass [tons]1050
Height of main body [m]42
Length of footprint [m]28
Height of Leg [m]8 (Leg1), 7 (Leg2), 6 (Leg3,4)
Outer diameter of Leg [m]3.5
COG X [m]101
COG Y [m]0
COG Z [m]30.436
Ixx [kg.m2]5.60 × 10 8
Iyy [kg.m2]5.60 × 10 8
Izz [kg.m2]2.82 × 10 8
Table 2. Main features of the floating crane vessel.
Module CharacteristicValue
Length overall [m]110
Breadth [m]48
Depth [m]8.4
Design draft [m]4.8
Operational draft [m]4.5
Displacement [tons]17,371.9
Maximum lifting capacity [tons]3200
Number of main hooks 4
COG X [m]0.638
COG Y [m]0
COG Z [m]11.309
Ixx [kg.m2]6.12 × 10 8
Iyy [kg.m2]1.74 × 10 8
Izz [kg.m2]1.88 × 10 8
Table 3. Main parameters of the mooring lines of the vessel.
ParameterType
ChainWire Rope
Section length [m]330470
Mass of unit length [kg/m]67.8111.39
Equivalent diameter [m]0.060.056
Stiffness [kN]582,450492,601.7
Breaking force [kN]27701980
Table 4. Main parameters of the wire and the sling.
ModelStiffness (kN/m)Type for Simulation
Wire460,000Linear cable
Sling303,624Steel wire
Table 5. Environmental conditions for time-domain simulations.
ItemValue
Wave spectrumJONSWAP spectrum
Wave direction0 deg, 45 deg, 90 deg, 135 deg, 180 deg
Peak period Tp4 s, 6 s, 7 s, 8 s, 10 s, 12 s
Significant wave height Hs1 m, 1.5 m, 2 m
Table 6. Extreme responses for three preliminary critical vertical positions.
ItemJL1-Z1JL1-Z2JL1-Z3
Motion of Jacket Leg1 X [m]1.111.211.37
Motion of Jacket Pitch [deg]1.521.692.46
DAF of Wire1 tension1.221.221.43
DAF of Sling1 tension1.271.281.39
Table 7. Eigenvalues and natural periods of rigid body motions of vessel.
BodyMode123456
VesselSurge [m]1.000.170.02−0.000.000.12
Sway [m]−0.131.000.110.00−0.040.00
Heave [m]0.00−0.000.001.000.000.01
Roll [deg]0.00−0.03−0.01−0.001.000.00
Pitch [deg]−0.000.000.00−0.05−0.001.00
Yaw [deg]0.13−0.461.00−0.000.01−0.00
Dominant Natural Period [s]63.2655.9429.29.068.87.68
Table 8. Eigenvalues and natural periods of rigid body motions of coupled vessel-spreader bar system.
BodyMode123456789
VesselSurge [m]−0.96−0.210.010.000.00−0.030.00−0.070.00
Sway [m]0.121.00−0.050.000.000.00−0.02−0.000.00
Heave [m]0.00−0.000.000.000.000.690.000.040.00
Roll [deg]−0.00−0.03−0.01−0.000.04−0.000.50−0.000.00
Pitch [deg]−0.000.000.000.00−0.000.20−0.000.58−0.01
Yaw [deg]−0.12−0.46−0.45−0.00−0.00−0.000.020.000.00
BarSurge [m]−1.00−0.220.011.00−0.00−0.390.000.660.00
Sway [m]−0.100.26−1.000.001.00−0.011.00−0.01−0.00
Heave [m]0.01−0.00−0.00−0.010.001.000.001.001.00
Dominant Natural Period [s]63.3455.9129.7713.2311.839.088.587.860.25
Table 9. Eigenvalues and natural periods of rigid body motions of fully coupled lowering system.
BodyMode1234567891011
VesselSurge [m]−0.000.00−0.050.000.090.010.000.000.000.000.00
Sway [m]0.00−0.070.00−0.030.00−0.000.020.00-0.00-0.000.00
Heave [m]0.000.000.160.00−0.45−0.000.000.000.010.000.00
Roll [deg]0.00−0.200.00−0.78−0.00−0.00−0.070.020.000.000.00
Pitch [deg]0.000.00−0.44−0.00−0.49−0.02−0.00−0.00−0.09−0.00−0.00
Yaw [deg]−0.00−0.450.000.11−0.000.00−0.02−0.010.000.000.00
JacketSurge [m]0.210.00−0.14−0.000.150.18−0.000.00−0.010.060.00
Sway [m]−0.071.00−0.00−0.330.00−0.00−0.020.02−0.00−0.000.00
Heave [m]−0.00−0.001.000.000.540.04−0.00−0.001.00−0.010.02
Roll [deg]0.00−0.840.001.00−0.000.001.00−0.020.00−0.000.00
Pitch [deg]−0.140.00−0.730.001.001.00−0.000.00−0.040.230.00
Yaw [deg]1.000.460.01−0.050.01−0.01−0.020.000.00−0.000.14
BarSurge [m]0.070.00−0.660.00−0.84−0.71−0.00−0.000.191.00−0.00
Sway [m]−0.000.18−0.000.840.000.00−0.191.000.020.00−0.00
Heave [m]−0.00−0.000.960.000.530.030.000.000.21−0.001.00
Dominant Natural Period [s]24.2016.779.479.008.786.205.322.481.621.560.21
Table 10. DAF of different sea states. (Allowable sea states are marked in light green background).
Tp [s] 4.06.07.08.010.012.0
Hs [m]
1.01.051.101.111.141.211.25
1.51.081.151.171.211.321.37
2.01.101.211.231.271.421.50
Publisher’s Note: MDPI stays neutral with regard to jurisdictional claims in published maps and institutional affiliations.