Article

Numerical Simulation of Wave–Current Force Characteristics of Horizontal Floating Cylinder in Heave Motion

School of Naval Architecture and Ocean Engineering, Jiangsu University of Science and Technology, Zhenjiang 212100, China
*
Author to whom correspondence should be addressed.
J. Mar. Sci. Eng. 2022, 10(12), 1884; https://doi.org/10.3390/jmse10121884
Submission received: 4 November 2022 / Revised: 22 November 2022 / Accepted: 28 November 2022 / Published: 4 December 2022
(This article belongs to the Section Ocean Engineering)

Abstract

:
This paper presents the characteristics of the heave motion responses and hydrodynamic forces of a horizontal floating circular cylinder during a wave–current interaction. A two-dimensional numerical model based on the CFD (Computational Fluid Dynamics) method for modeling wave flow is validated and verified. The hydrodynamic characteristics of the horizontal floating cylinder during heave motion were calculated and analyzed under the conditions of different k values (stiffness of spring), wave amplitudes, submerged depths, and flow rates. The results show that, with the increase in the k value, the vibration amplitude of the cylinder first increases and then decreases. The vibration amplitude peak is achieved, the vibration frequency is consistent with the wave frequency, and a resonant motion takes place. When the wave amplitude and flow rate are fixed, the maximum vibration amplitude decreases as the wave period increases. When the cylinder is half-submerged, the effect of the current on motion is significant; the vibration amplitude is less than the wave amplitude. When a quarter is submerged, the vibration amplitude is larger than that of the half-submerged cylinder at each k. The maximum amplitude is greater than the wave amplitude, and the vibration amplitude reaches the minimum at the moderate flow rate for each k.

1. Introduction

Research on the effect of waves on structures has important practical significance for structure design and production safety. A circular cylindrical body is one of the most widely used structures in offshore engineering. In particular, a horizontal circular cylinder is commonly used for the floating structure design. Its heave motion is one of the most important factors and has received extensive attention in hydrodynamic research. A series of studies were conducted on convection in cylinders, which is the influencing factor of the immersion depth of the cylinder caused by a steady flow. Sheridan et al. [1] found that a cylinder flowing under a free surface produces a basic near-wake structure, which is significantly different from the wake of a completely submerged cylinder. One of the central features is the vorticity layer generated by the free surface, which is caused by the local separation in the form of small-scale fragmentation of free surface waves or completely separated from the free surface. This vorticity layer is adjacent to the vorticity layer on the surface of the cylinder to form the jet. Lin et al. [2] combined an eddy current method and boundary integral method to study scenarios of different Froude numbers and submerged depths. The results show that the boundary integral method is the main method used to simulate the moving boundary issue because only the grid points on the boundary of the fluid domain are needed. Liang et al. [3] used mesh-free viscous discrete vorticity to study the hydrodynamic parameters and vortex-shedding methods of a two-dimensional cylinder under rigid walls and free surfaces. The results show that, when the cylinder is close to the rigid wall and the free surface, the center line of wake vorticity moves downward, and diffusion occurs at a low clearance ratio. Chung et al. [4] used the adaptive Cartesian cutting element/level set method to numerically study the 2-DOF vortex-induced vibration of a low-mass zero-damped cylinder, horizontally placed near a free surface for Re = 100 (based on the cylinder diameter D). The results show that the vortex-induced vibration at both low and high Froude numbers is enhanced and suppressed, respectively, when approaching the free surface. Capell et al. [5] studied the horizontal cylinder from a semi-submerged to a just completely submerged state. The results show that when the cylinder rises from the completely submerged condition, the oscillation amplitude of the cylinder decreases and the lock-in region decreases in this range, shifting to a higher deceleration rate. Díaz-Ojeda et al. [6] presented the effect of immersion depth on the dynamics of the simplified fluid–structure coupling model. The submerging characteristics of structures at different depths and their relationships with the Cauchy number, Reynolds number, and Froude number are studied. The deformation and resistance acting on the structure are analyzed in detail to understand the effect of the free surface on this issue. The results show that the amplitude of the split plate tip increases with the increases in Reynolds number, Froude number, and Cauchy number. However, as the depth increases and the structure moves away from the interface, all measurements tend to saturate. Ma et al. [7] used the proper orthogonal decomposition (POD) method to characterize temporal variation characteristics and define the mode dominance factor and traveling wave index according to the results of the analysis of two POD parameters. It was found that cross-flow VIV response is more wave-dominated when traveling in a sheared flow than in a uniform flow.
However, relative to separated flow effects, there are few studies on the forces of wave and current in horizontal cylinders. Based on the Reynolds-averaged Navier–Stokes equation, Li et al. [8] established a two-dimensional numerical tank model to simulate the wave force and deduced the drag coefficient and inertia coefficient using the least square method. By comparing the induction coefficients of wave and wave current, the results show that current has a significant effect on the drag coefficient of the submerged cylinder. Xiao et al. [9] studied the force of the cylinder under the action of waves and found that the wave force of the cylinder was greater than the simple summation of the wave force and the fluid force. Ning et al. [10] established a two-dimensional fully nonlinear numerical wave flume based on the time-domain high-order boundary element method, and the four-point method is used to decompose the high-order and free harmonics propagating upstream and downstream along the obstacle. The results show that the peak value of the non-dimensional second free harmonic amplitude is shifted upstream for the opposing current relative to the value of zero current with the variation of current-free incident wave amplitude, and it is vice versa for the following current. Hu et al. [11] studied the hydrodynamic characteristics under the action of waves and currents and concluded that increases in velocity and immersion depth can simultaneously increase the additional water mass coefficient and drag coefficient. Bai et al. [12] studied the influence of wave currents and horizontal cylinders under different submerged depths and found that wave reflection and blocking jointly affected the wave–current force on the horizontal cylinder. Bai et al. [13] compared the modified Morison equation with experimental values and found that when the cylinder is partially submerged, the measured force value is larger than the theoretical value. On the contrary, when the cylinder is completely submerged, the measured force value is relatively low. Ghadirian et al. [14] studied the effect of the wave–current interaction on wave loads on vertical surface perforators in the North Sea. The results show that the force coefficients for the cases with current are consistently smaller than the cases without current, and the force distribution of opposing currents was concentrated closer to the free surface compared to the case with no currents and following currents. Wang et al. [15] conducted an experiment on the internal solitary wave with the oblique interaction of a horizontal finite-length cylinder in a gravity-stratified fluid tank. The results show that the vertical force depends on the ratio of the reduced gravity or vortex shedding lift or its resultant force on vertical disturbance pressure for different submerged depths. Saincher et al. [16] conducted an experimental study on the combined hydrodynamic loads caused by nonlinear waves and uniform flow on a cylinder. The experiments showed that the wave and local acting current loads on the structure can be linearly superimposed, independent of wave properties and drag velocity. Zhao et al. [17] established numerical models, including one non-netting configuration and three netting configurations in different regular waves, which were generated for nonlinear wave problems based on flow function theory. The time series of horizontal wave forces are calculated and analyzed in the four models. The numerical results show that the netting frame can significantly increase the positive amplitude of the horizontal wave force, and the wave force of the leeward side netting trestle is almost smaller than that of the wave side netting frame. Liu et al. [18] numerically simulated the wave rise on a fixed surface punctured cylinder in a regular wave and on a series cylinder at different distances using an in-house naoe-FOAM and SJTU solver. The results show that, in short wave cases, the cylinder has more influence on waves, and in long waves with small wave steepness cases, the cylinder shows minor effects on waves. At the location of a strong nonlinear interaction, the secondary crests can be observed for steeper waves.
In both domestic and international research, there are relatively few studies on the hydrodynamic forces of the horizontal circular cylinder in heave motion when taking wave and current interaction into account, and further in-depth research is needed. In this paper, a numerical wave tank model is established by STAR-CCM+ [19] software, in which Reynolds-averaged Navier–Stokes (RANS) equations and the volume of fluid (VOF) method are used to solve the flow. Fenton’s fifth-order wave theory [20] is used to make waves under velocity boundary conditions. In the following sections, the hydrodynamic force of half-submerged horizontal cylinders is first numerically verified to verify the accuracy of the model on the force of the structure. Then, the model is applied to the numerical calculation of the wave–current force of the horizontal cylinder with a heave motion under different working conditions; the wave–current force of the horizontal cylinder under the action of wave amplitude, submersion depth and flow velocity; and the wave reflection when the wave flow interacts with the cylinder.

2. Numerical Model

2.1. Governing Equation

The numerical wave tank model was developed based on the Reynolds-averaged Navier–Stokes (RANS) equations using a commercial CFD (Computational Fluid Dynamics) software package, as a reference for STAR–CCM+. The averaged continuity and momentum equations for incompressible Newtonian fluid may be given in tensor notation and Cartesian coordinates, as shown in the following two equations.
( ρ u ¯ i ) x i = 0
( ρ u ¯ i ) t + ( ρ u ¯ i u ¯ j + ρ u i u j ¯ ) x j = p ¯ x i + μ x j ( u ¯ i x j + u ¯ j x i )
where u ¯ i is the averaged velocity vector; p ¯ is the averaged pressure; ρ is the fluid density, μ is the dynamic viscosity; and ρ u i u j ¯ is the Reynolds stress, modeled as a function of turbulent viscosity and the mean velocity gradients by solving the shear–stress transport (SST) kw equations.

2.2. Free Surface Treatment Method

The classic volume of fluid (VOF) method, in which a scalar marking function is used to define the volume fraction of two fluids, is adopted to capture the free surface of the numerical model. In the method, the volume fraction of the fluids is driven by a velocity u satisfying the following transport equation given in conservative form:
α t + ( u α ) = 0
where α represents the volume fraction of the fluids.
α = { 0 air 0 ~ 1 free surface 1 water
The density and viscosity coefficient of the mixed fluid can then be obtained using the following formula:
ρ = α ρ w + ( 1 α ) ρ a
μ = α μ w + ( 1 α ) μ a
where the subscript w represents the water phase, and a represents the air phase.

2.3. Fifth-Order Stokes Model

According to Skjelbreia et al. [21], wave generation is achieved by increasing the velocity of the fluid at the boundary of the constructed wave in the x and z directions and the instantaneous increase in the wave surface. For Stokes fifth-order waves, the velocity and instantaneous increase in the wave surface at the wave-making boundary meet the following conditions.
Velocity in the x direction:
u x = c n = 1 j n λ n cosh [ n k ( z + d ) ] × cos [ n ( k x ω t ) ]
Velocity in the z direction:
u z = c n = 1 j n λ n sinh [ n k ( z + d ) ] × sin [ n ( k x ω t ) ]
Instantaneous increase in wave surface:
η = 1 k n = 1 5 λ n cos [ n ( k x ω t ) ]
The coefficients are as follows:
λ 1 = λ λ 2 = λ 2 B 22 + λ 4 B 24 λ 3 = λ 3 B 33 + λ 5 B 35 λ 4 = λ 4 B 44 λ 5 = λ 5 B 55
where, w, d and k are the angular frequency, water depth, and wave number, respectively.

3. Numerical Verifications

3.1. Wave Numerical Flume Verification

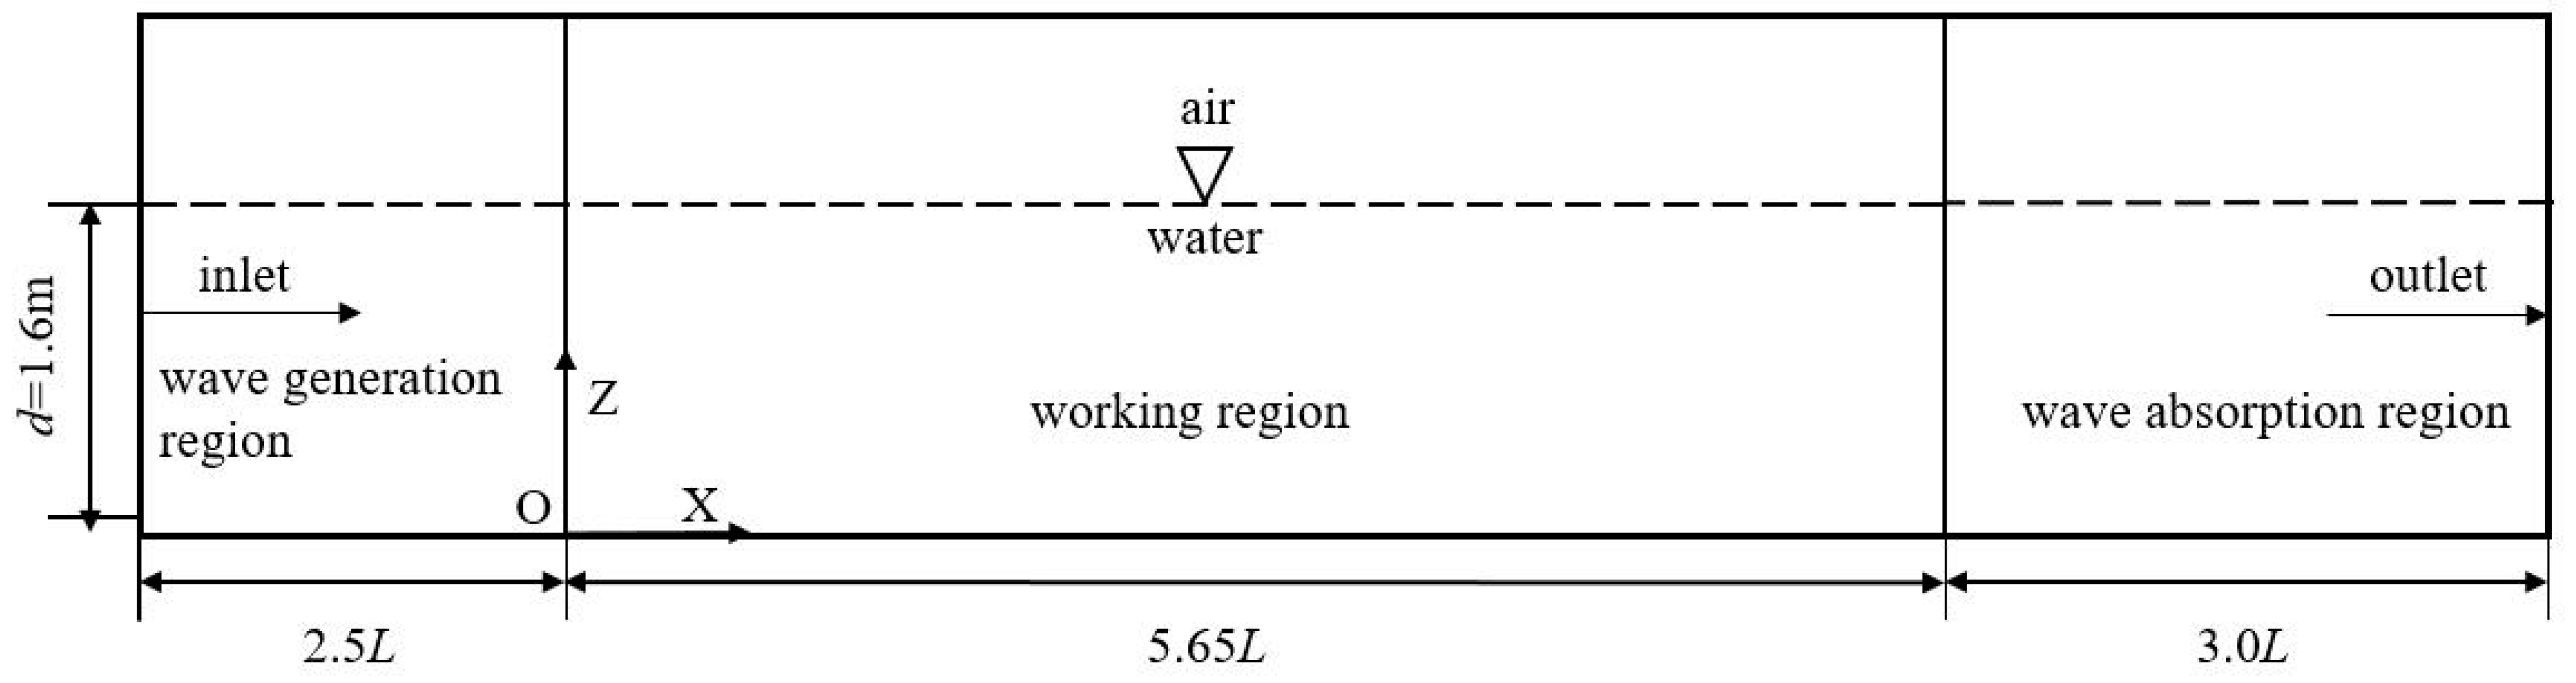
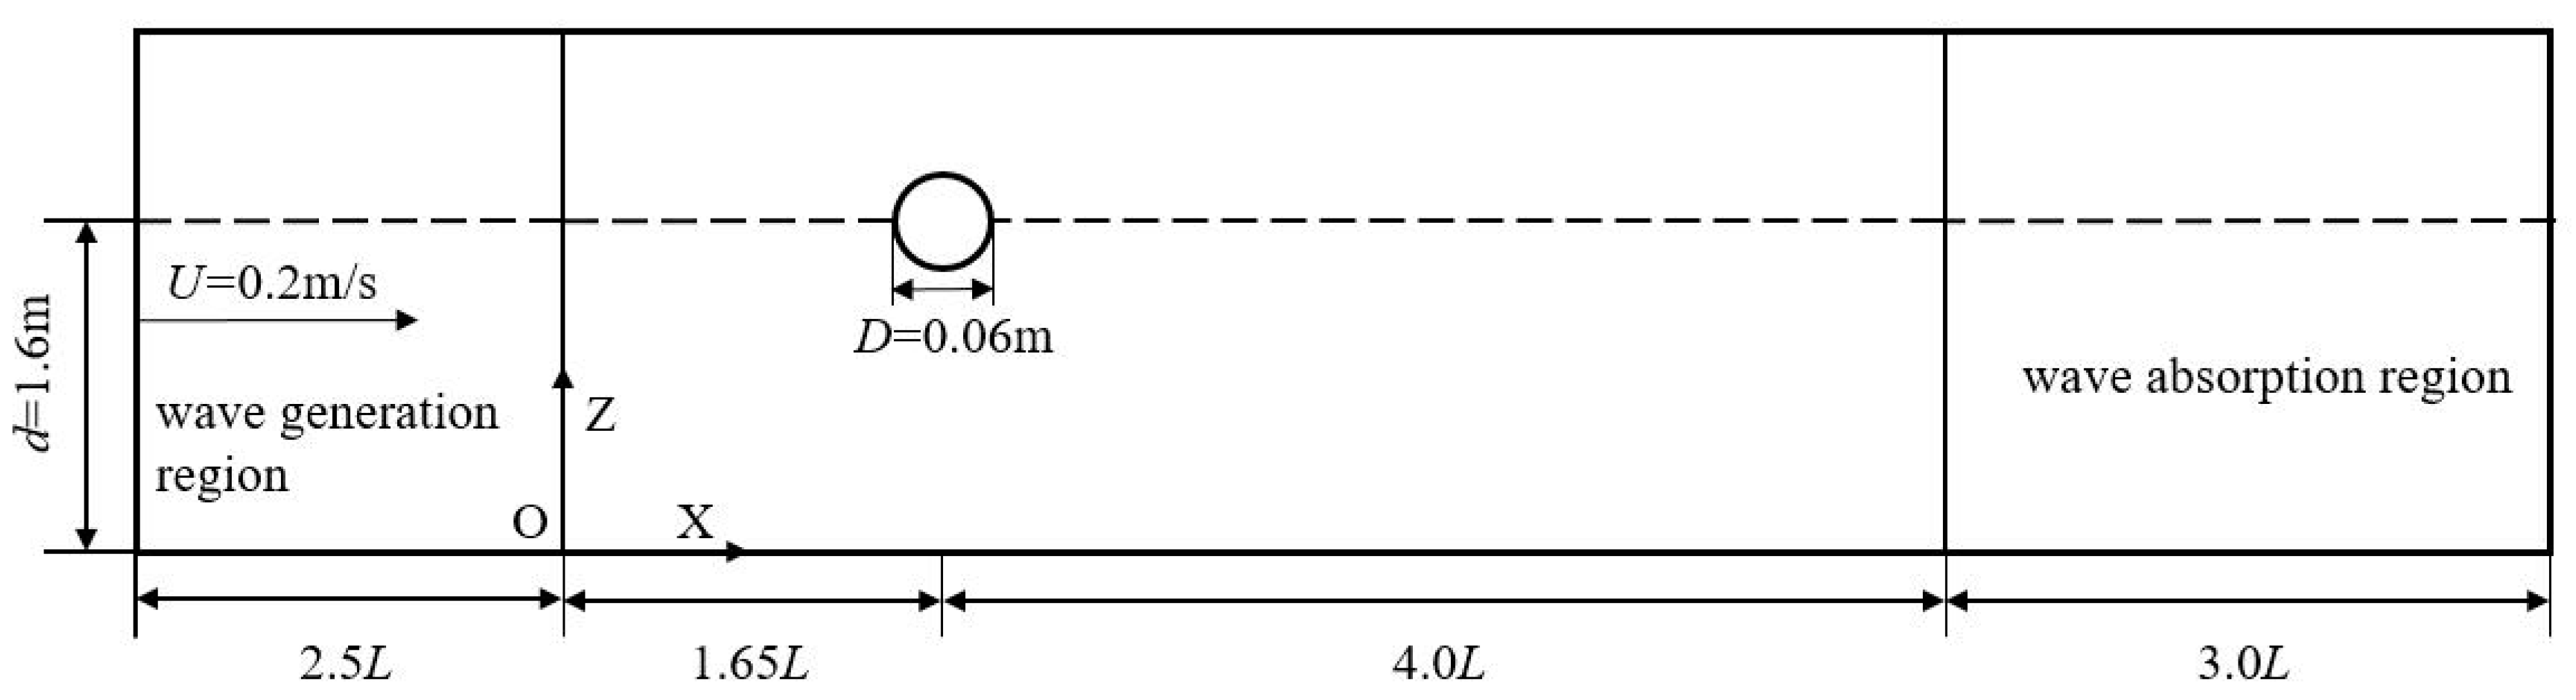
3.1.1. Wave Numerical Flume Model

The size of the computational domain has a significant impact on the results of numerical calculations; therefore, it is very important to select a suitable computational domain. According to Dixon’s physical model experiment [22], the calculation domain is set up as shown in Figure 1. The total length of the tank is 11.15L (L is the wavelength), in which the wave generation region is 2.5L, the working area is 5.65L, and the wave absorption region is 3L. The water depth d is 1.6 m.
The wave model (fifth-order Stokes wave) is established first, and the static water surface position, wave period and amplitude are given. This paper set the atmosphere as the reference pressure and the direction of gravitational acceleration (−Z). The inlet boundary (Inlet) is set to velocity entry, and the velocity of the inlet boundary is set as the velocity of the wave model. The outlet boundary uses the pressure outlet, and the pressure of the outlet boundary is set as the hydrostatic pressure of the wave model. The volume fractions of the air and water at the outlet and inlet boundaries are based on the wave model. The bottom of the computational domain is set as a non-slip wall. The top of the computational domain is set as an open pressure boundary, and the volume fractions of water and air are 0 and 1, respectively. In this paper, the kw SST turbulence model is used for numerical calculations, and the time step is set to 0.002 s.

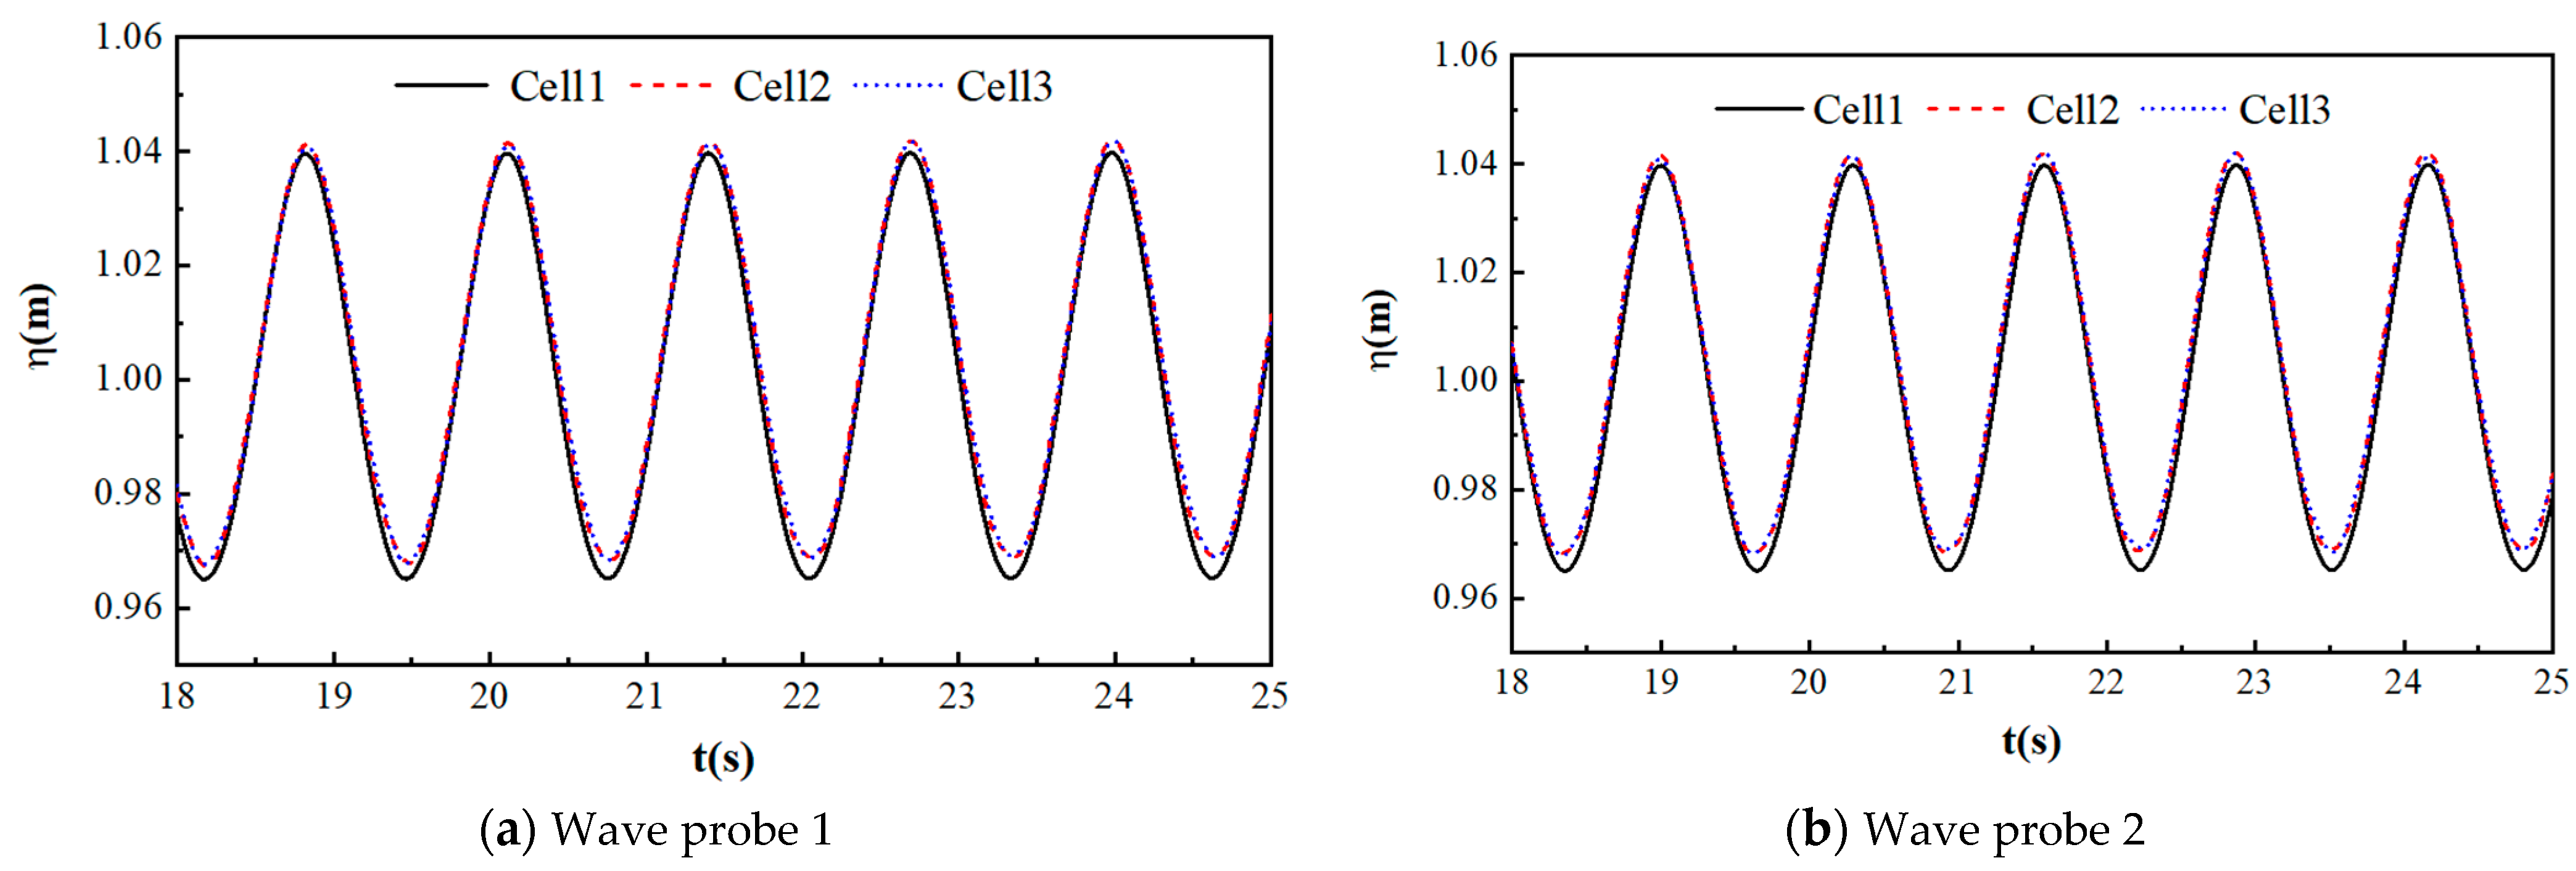
3.1.2. Mesh Convergence Analysis

The cell size affects the accuracy of numerical calculations, especially the cell size in the wavelength and wave height directions. In order to reduce the number of cells and computational cost on the premise of ensuring calculation accuracy, the convergence of the cells is verified. Due to the complex variation of the free surface flow field, a finer cell is required to capture the changes in the flow field. Therefore, the cell should be properly refined around the free surface, as shown in Figure 2.
The cell scales in the wavelength direction and wave height direction are shown in Table 1. The wave probe settings are as follows: wave probe 1 is at 1.65L in the working area, and wave probe 2 is at 1.85L.
Figure 3 compares the wave elevation at two different wave probes for the three cells. The general trends from the three cells are similar. The elevations computed by cells 2 and 3 are nearly overlapping. Therefore, cell 2 was used in other simulations because of its relatively high accuracy and lower computational cost.

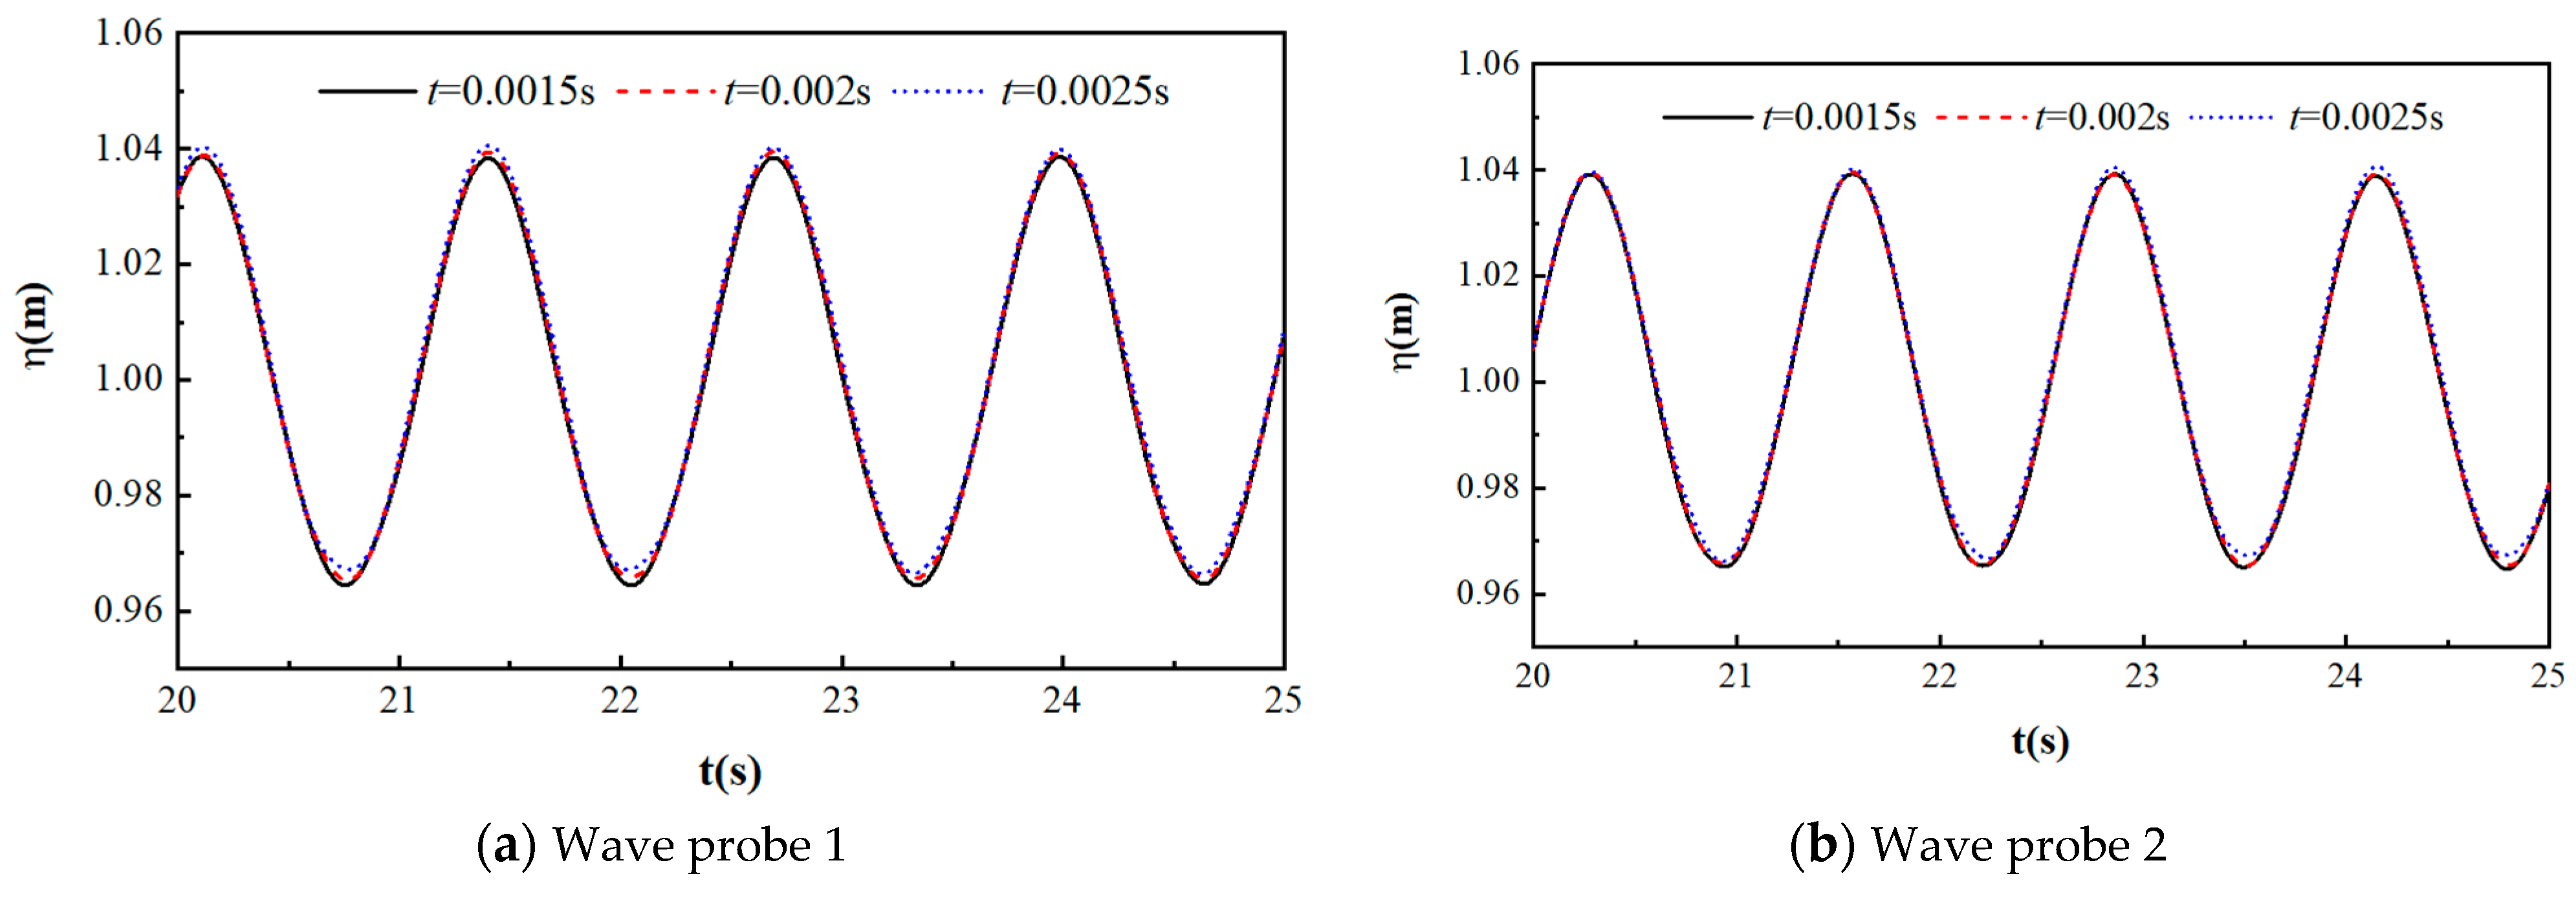
3.1.3. Time Step Convergence Analysis

The time step also has a great impact on the calculation accuracy, so it is necessary to verify the convergence of the time step. Based on the grid convergence verification, cell 2 is selected in this section for time step convergence verification. In this paper, the time step is set to 0.0015 s, 0.002 s, and 0.0025 s, and other settings remain unchanged. Wave duration curves under different time steps are obtained, as shown in Figure 4.
As can be seen from Figure 4, the results of the time step of 0.0015 s and 0.002 s are essentially the same, while the results of the time step of 0.002 and 0.0025 s are somewhat different. Therefore, it can be judged that the time step of 0.0015 s and 0.002 s meets the requirements of convergence. Therefore, considering the calculation accuracy and calculation cost, the final time step is 0.002 s.

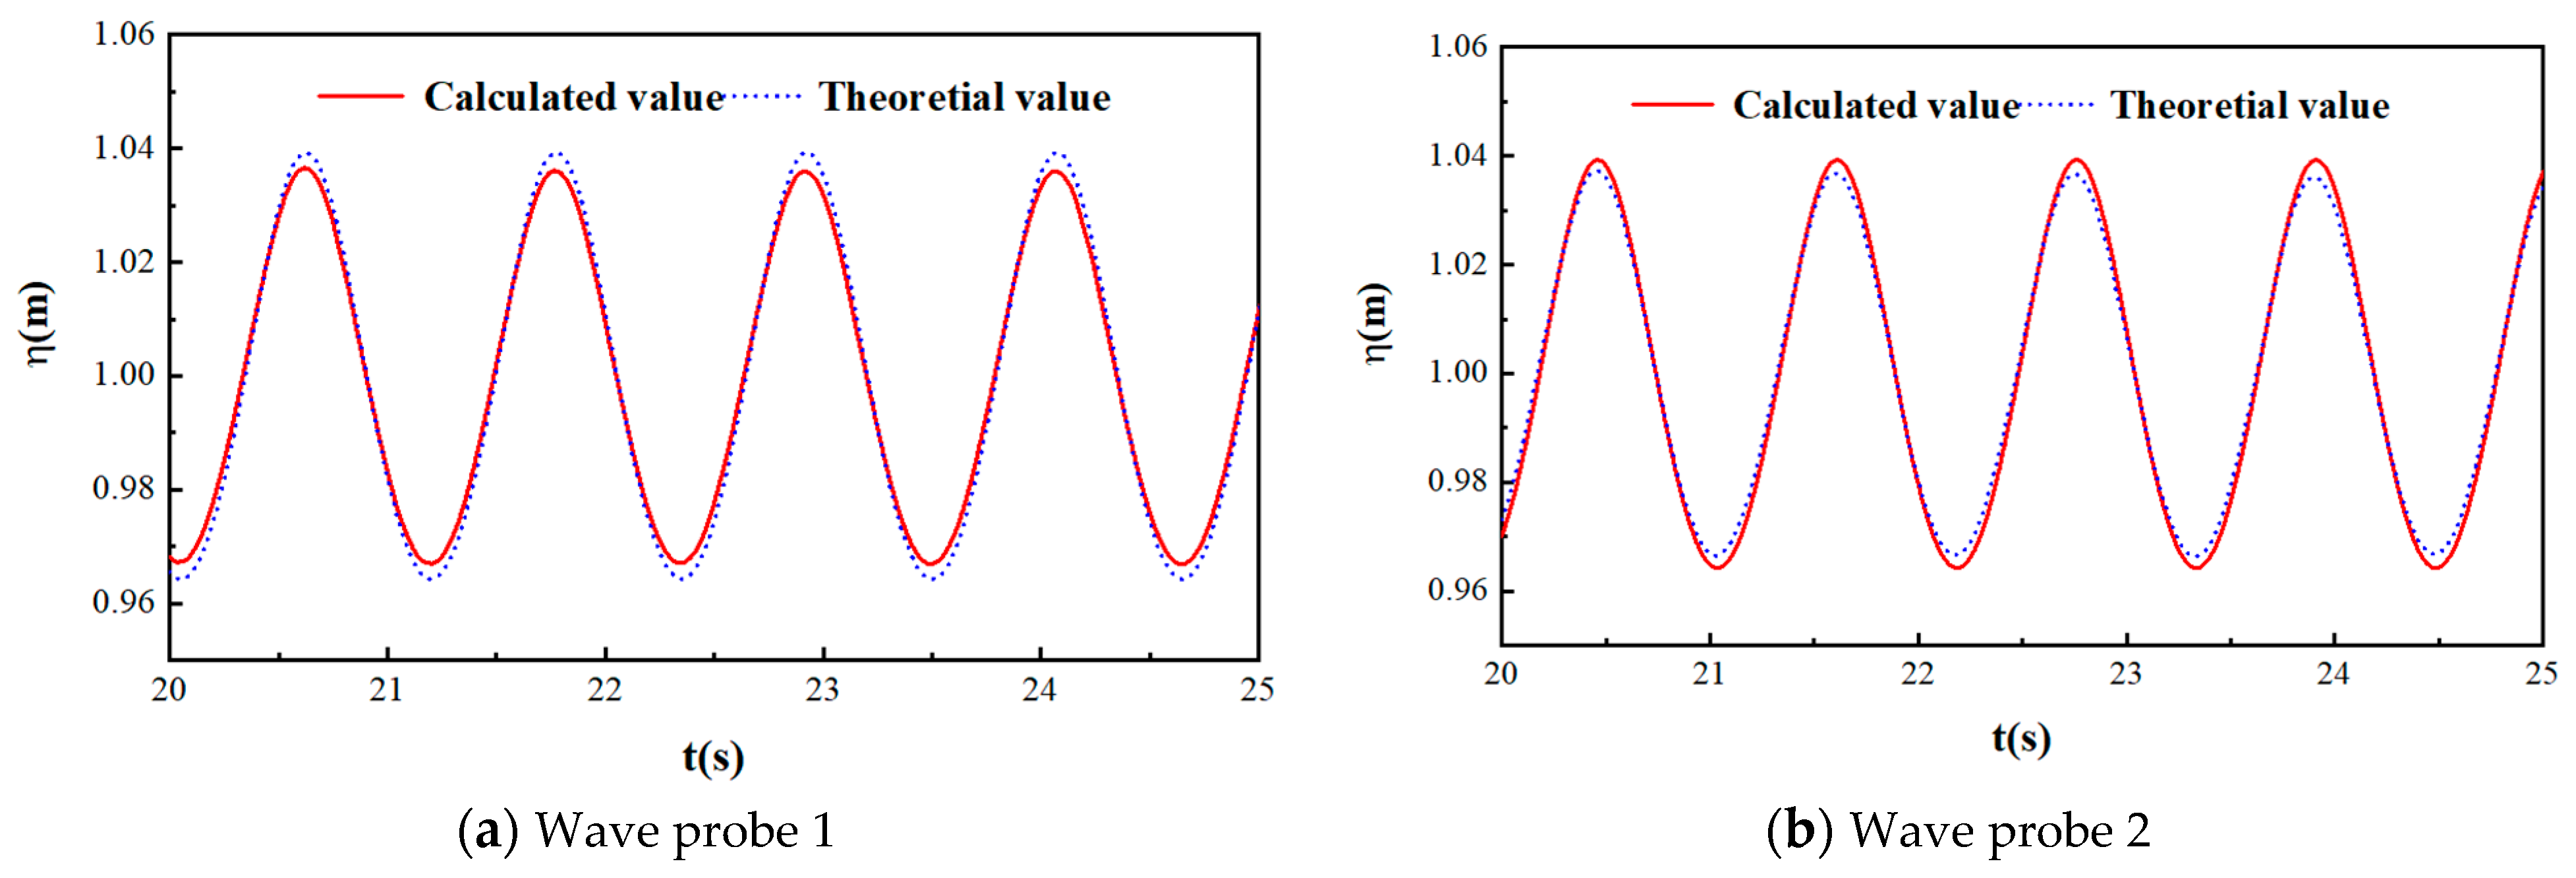
3.1.4. Comparison of Calculated Wave Value and Theoretical Value

On the basis of grid convergence, a fifth-order Stokes wave algorithm (the wave height H is 0.1 m, and the wave period T is 1.29 s) is set at the inlet for the numerical simulation. Comparisons between numerical and theoretical values at different wave probes are made in Figure 5. It can be seen that the wave period by the simulation is equal to the theoretical value, but the wave crest and trough gradually attenuate. This is because as the waves propagate, the viscosity and gravity of the fluid cause a loss of wave energy, resulting in the attenuation of wave height. However, the maximum error is about 9%, which meets the basic requirements of calculation accuracy.

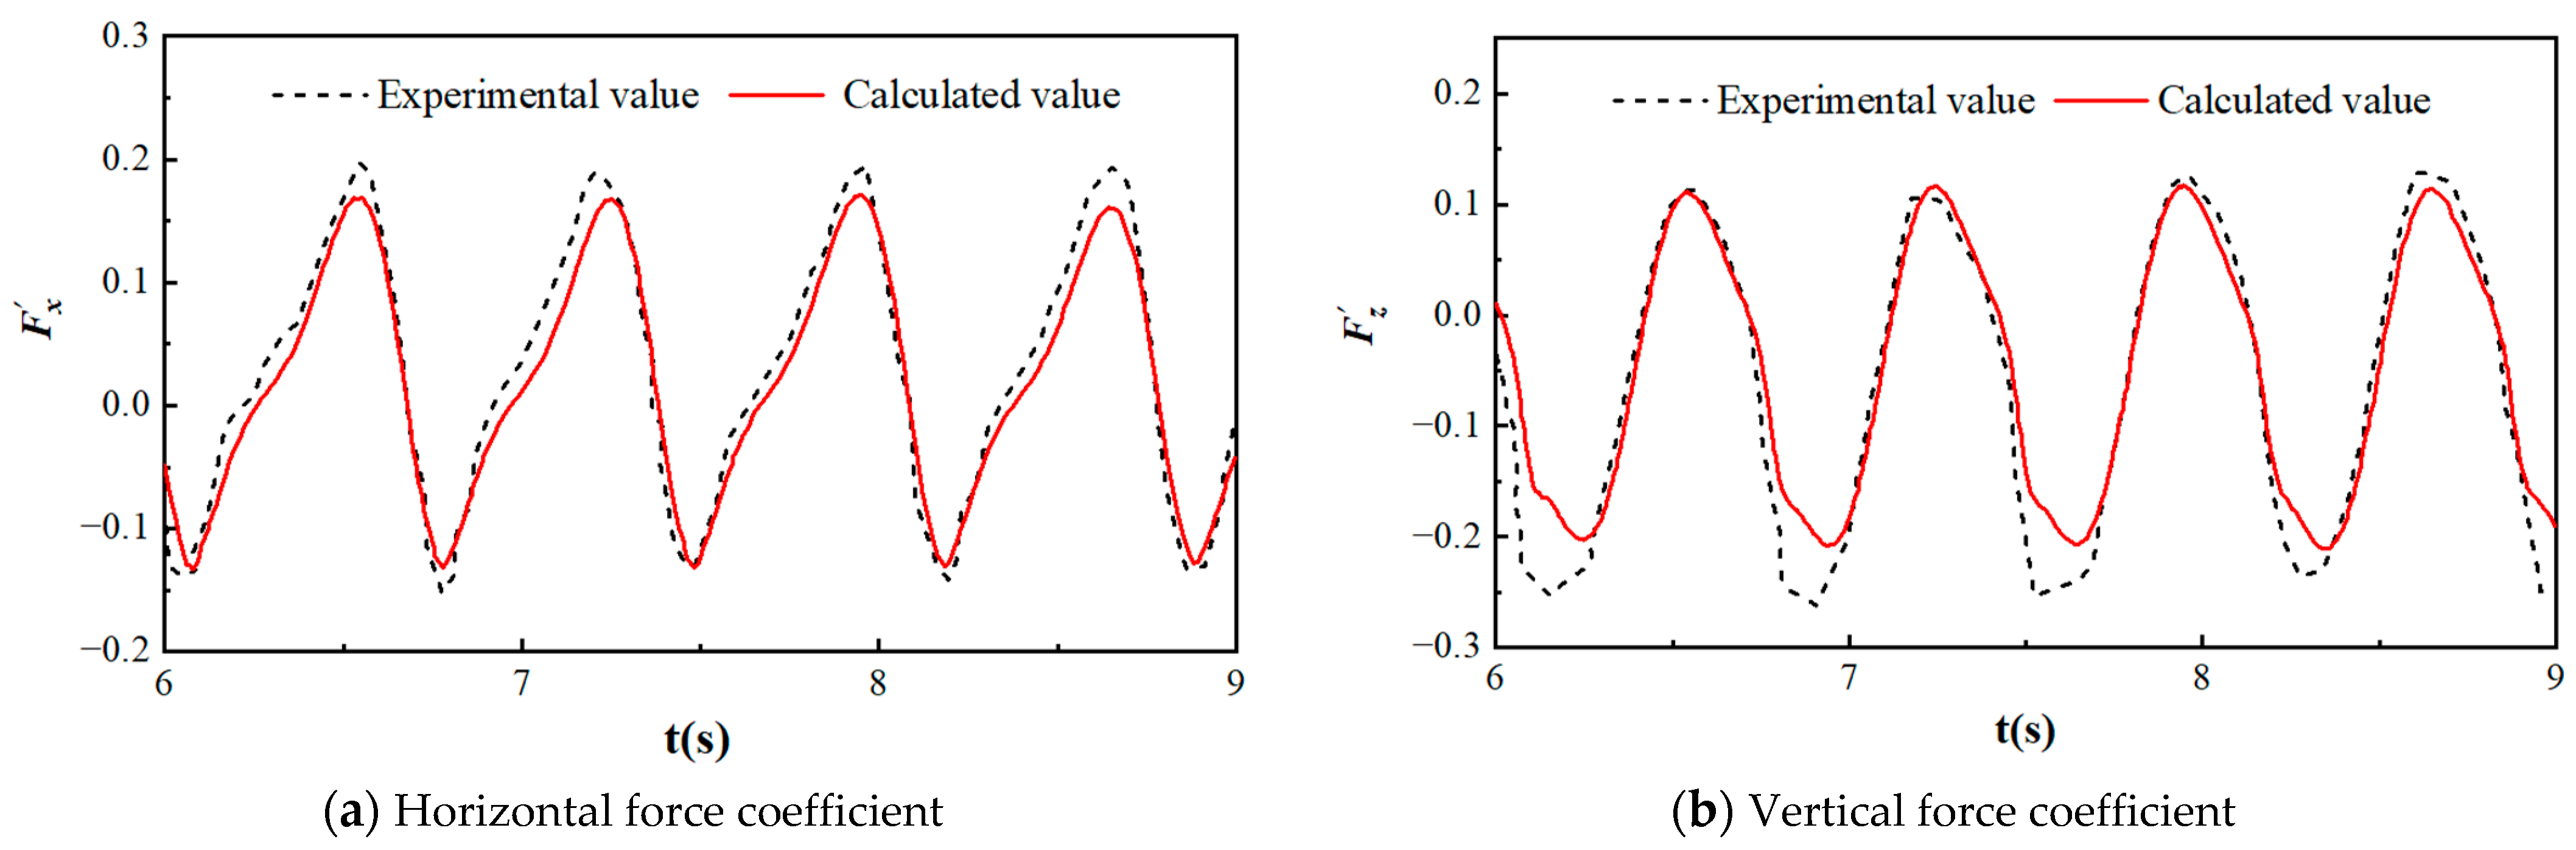
3.2. Validity Verification of Hydrodynamic Loads under Wave–Current

In the light of experiment values found by Bai et al. [12], hydrodynamic loads on the semi-submerged horizontal cylinder are verified. Computation settings are shown in Figure 6. The horizontal cylinder is half-submerged in water, the cylinder diameter D is 0.06 m, the water depth d is 1.6 m, the incoming flow velocity U is 0.2 m/s, the period of the fifth-order Stokes wave T is 0.7 s, and the wave height H is 0.03 m. The grid is set to 100 grids for a wavelength, and 20 grids for a wave height. The height of the first layer grid on the surface of the cylinder is 0.001D, the stretching ratio is 1.1, and the cell number in the boundary layer is 10. The surface of the cylinder is set as non-slip wall. The damping cancelation method [23] is used in the wave absorption region, which is used to weaken or eliminate fluctuations in the region by adding a damping term to the momentum equation in the wave absorption region.
For the convenience of subsequent analyses, the fluid loads are all dimensionless and treated using buoyancy when the cylinder is completely submerged. The dimensionless parameters are in the following formula:
F x = F x ρ g π D 2 l 4
F z = F z ρ g π D 2 l 4
U r = U T n D
where F x and F z are the horizontal and vertical force coefficients, respectively; F x is the hydrodynamic load of the cylinder in the X direction; F z is the hydrodynamic load of the cylinder in the Z direction; U r is the dimensionless coefficient of the incoming flow velocity; l is the length of the cylinder; and Tn represents the proper period of the body.
Comparison curves between the computed and experimental values of the hydrodynamic loads on the cylinder are shown in Figure 7. The experimental data in Figure 7 are shown in [13]. As shown in Figure 7, the negative vertical force coefficient error rate is about 12%, which is caused by wave attenuation. In other cases, the calculated values agree with the experimental results.

4. Analysis of Calculation Results

The cylinder diameter D considered in this study is 0.1 m, the density of the cylinder is 1.2 times the fluid density, and the water depth d is 1 m. The cylinder is half-submerged in water. A spring damping system (as shown in Figure 8) is used to control the heave movement of the cylinder, and the equation of its movement can be expressed as:
m z ¨ + c z ˙ + k z = F z
where z is the movement displacement of the object perpendicular to the direction of the incoming flow; and m, c, and k are the mass, damping, and spring stiffness coefficients of the cylinder per unit length, respectively. Fz is the hydrodynamic force in the Z direction.
The computation conditions are shown in Table 2.

4.1. Cylinder Vibration Responses Analysis

4.1.1. Vibration Responses under Different Wave Periods

Figure 9 shows the variation curves of cylinder vibration response against k values under different wave periods when S/D = 0 (S/D is the ratio of submerged depth to cylinder diameter, and S is the distance from the center of the circle to the free surface which is positive along the z-axis, as shown in Figure 10); Ur = 3.36 and AW = 0.0375 m (AW is wave amplitude). As shown in the figure, vibration amplitude increases first and then decreases with the increase in the k value in different wave periods. When the wave period T = 1.15 s, the cylinder vibration amplitude reaches the maximum when k = 0.02 N/m. When T = 1.29 s and k = 0.015 N/m, the cylinder vibration amplitude reaches the maximum. When T = 1.45 s, the cylinder vibration amplitude reaches the maximum when k = 0.015 N/m. The peak of the vibration amplitude increases with the decrease in the wave period T. The reason why the vibration amplitude of the cylinder reaches the maximum value is that the wave frequency is close to the natural frequency of the cylinder, which triggers the resonance phenomenon. It is noted that the value of k associated with the peak of the vibration amplitude decreases with an increase in the wave period T. This is consistent with the decrease in the resonant frequency and increase in the wave period T. When k is greater than the value for the resonant frequency, the vibration amplitude monotonously decreases with k.

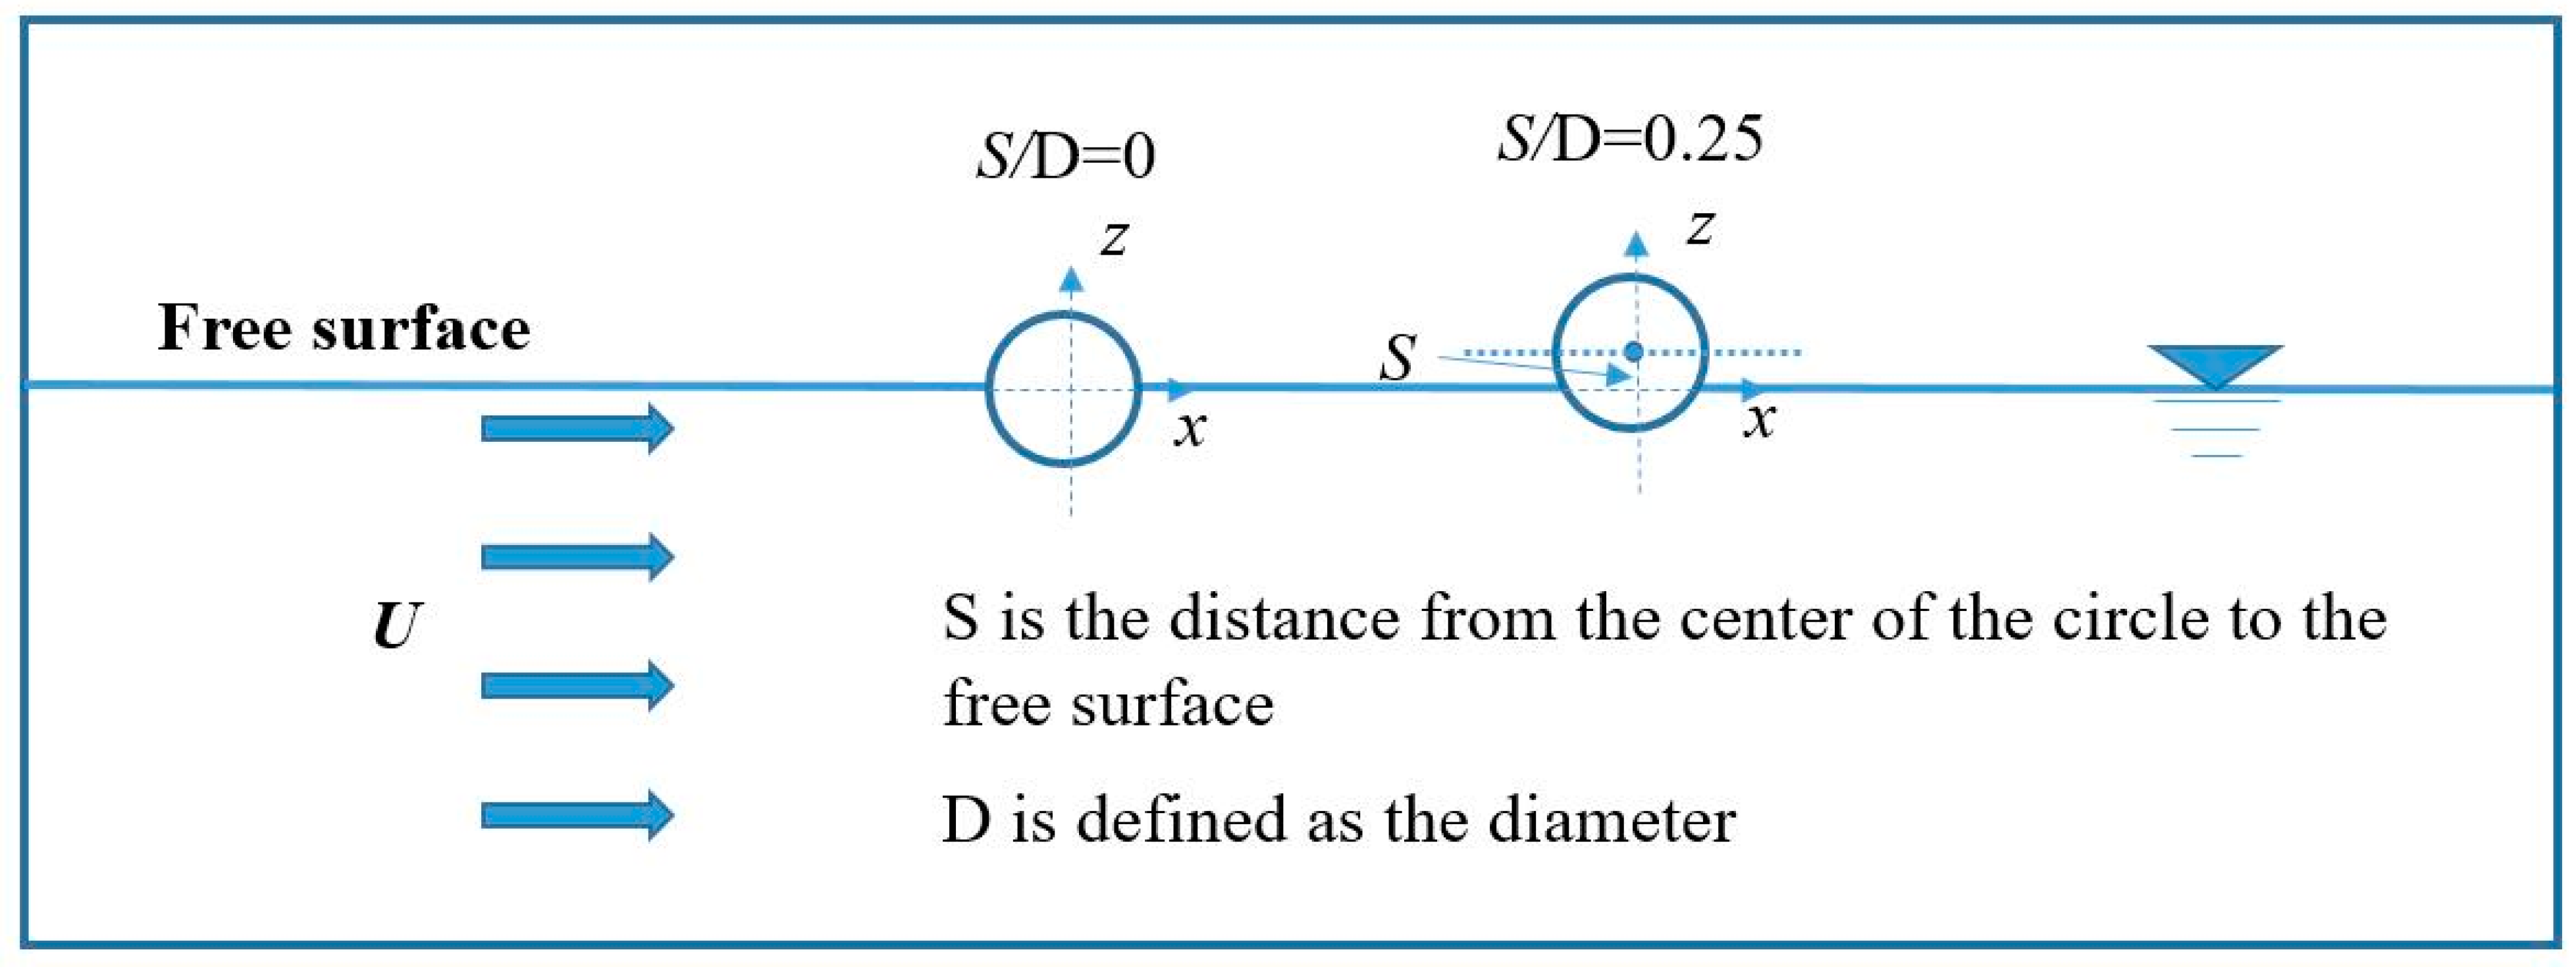
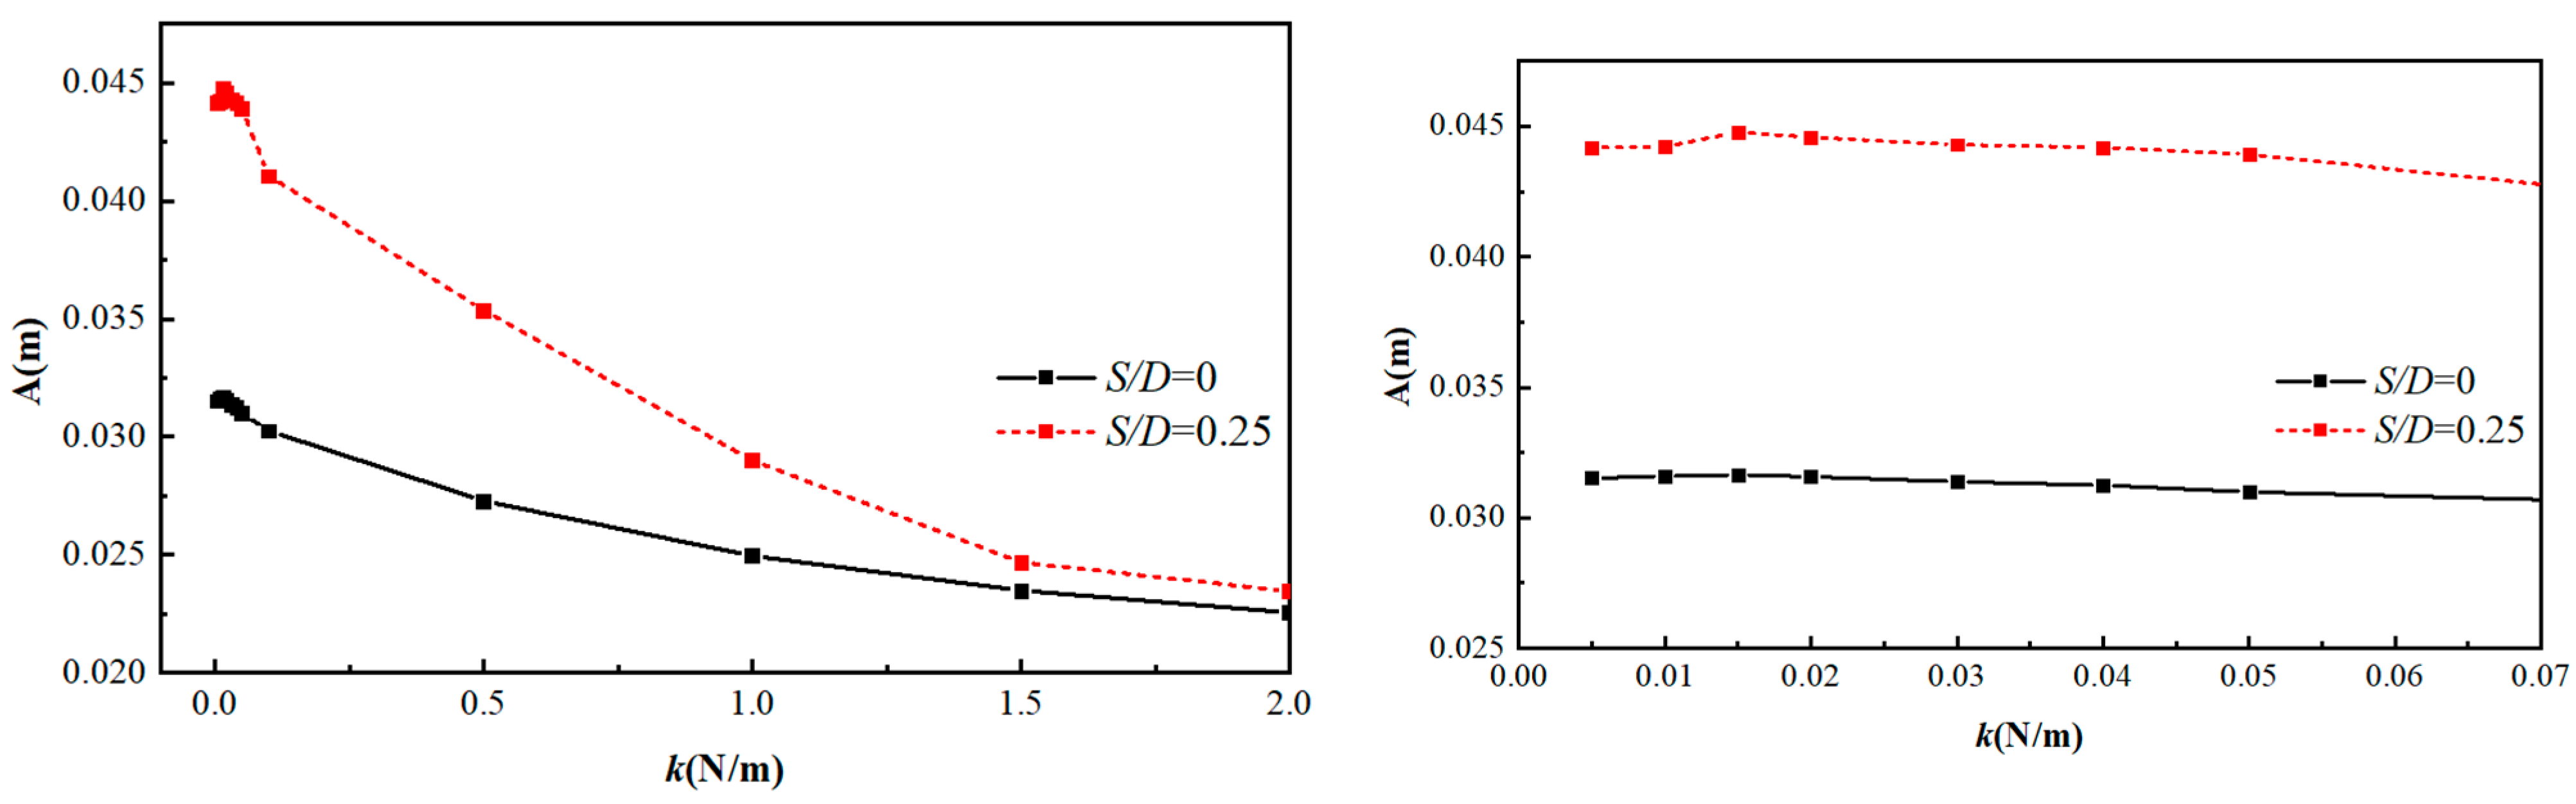
4.1.2. Vibration Responses under Different Submerged Depth

Figure 11 shows the variation curves of cylinder vibration response against k values under different submerged depths when T = 1.29 s, Ur = 3.36, and AW = 0.0375 m. As can be seen from Figure 11, the vibration amplitude decreases with the increase in submergence depth. When a quarter of the cylinder is submerged (S/D = 0.25), the motion is mildly affected by the current due to a small volume of displacement, and the motion is dominated by the wave. In contrast, the vibration amplitude is much larger than that of the half-submerged depth when k is small. In particular, the vibration amplitude is even larger than the wave period when k <= 0.1. With the increase in k value, the vibration amplitude increases first and then decreases for the two submerged depths. In Figure 11, it is noted that the resonance occurs at the same k for the two submerged depths. Both the peaks of the vibration amplitude appear at k = 0.015 N/m.

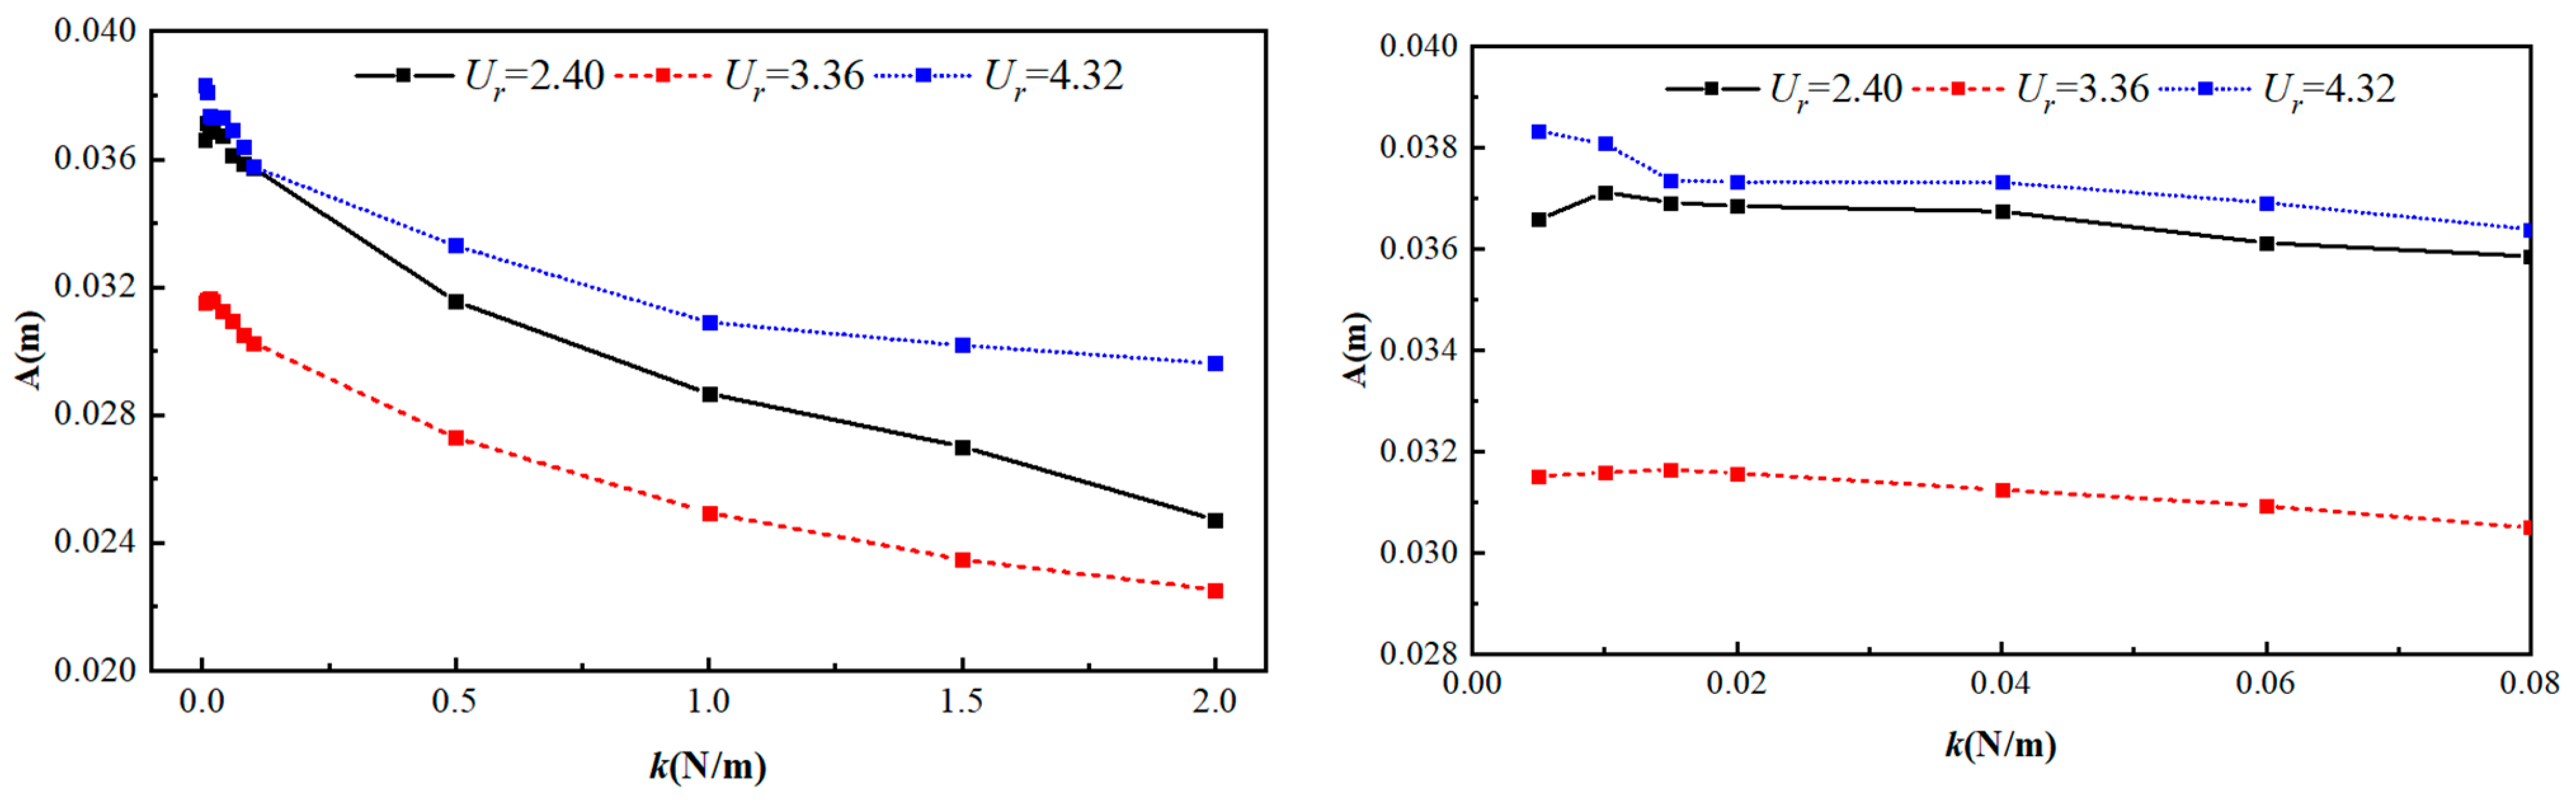
4.1.3. Vibration Responses under Different Flow Rates
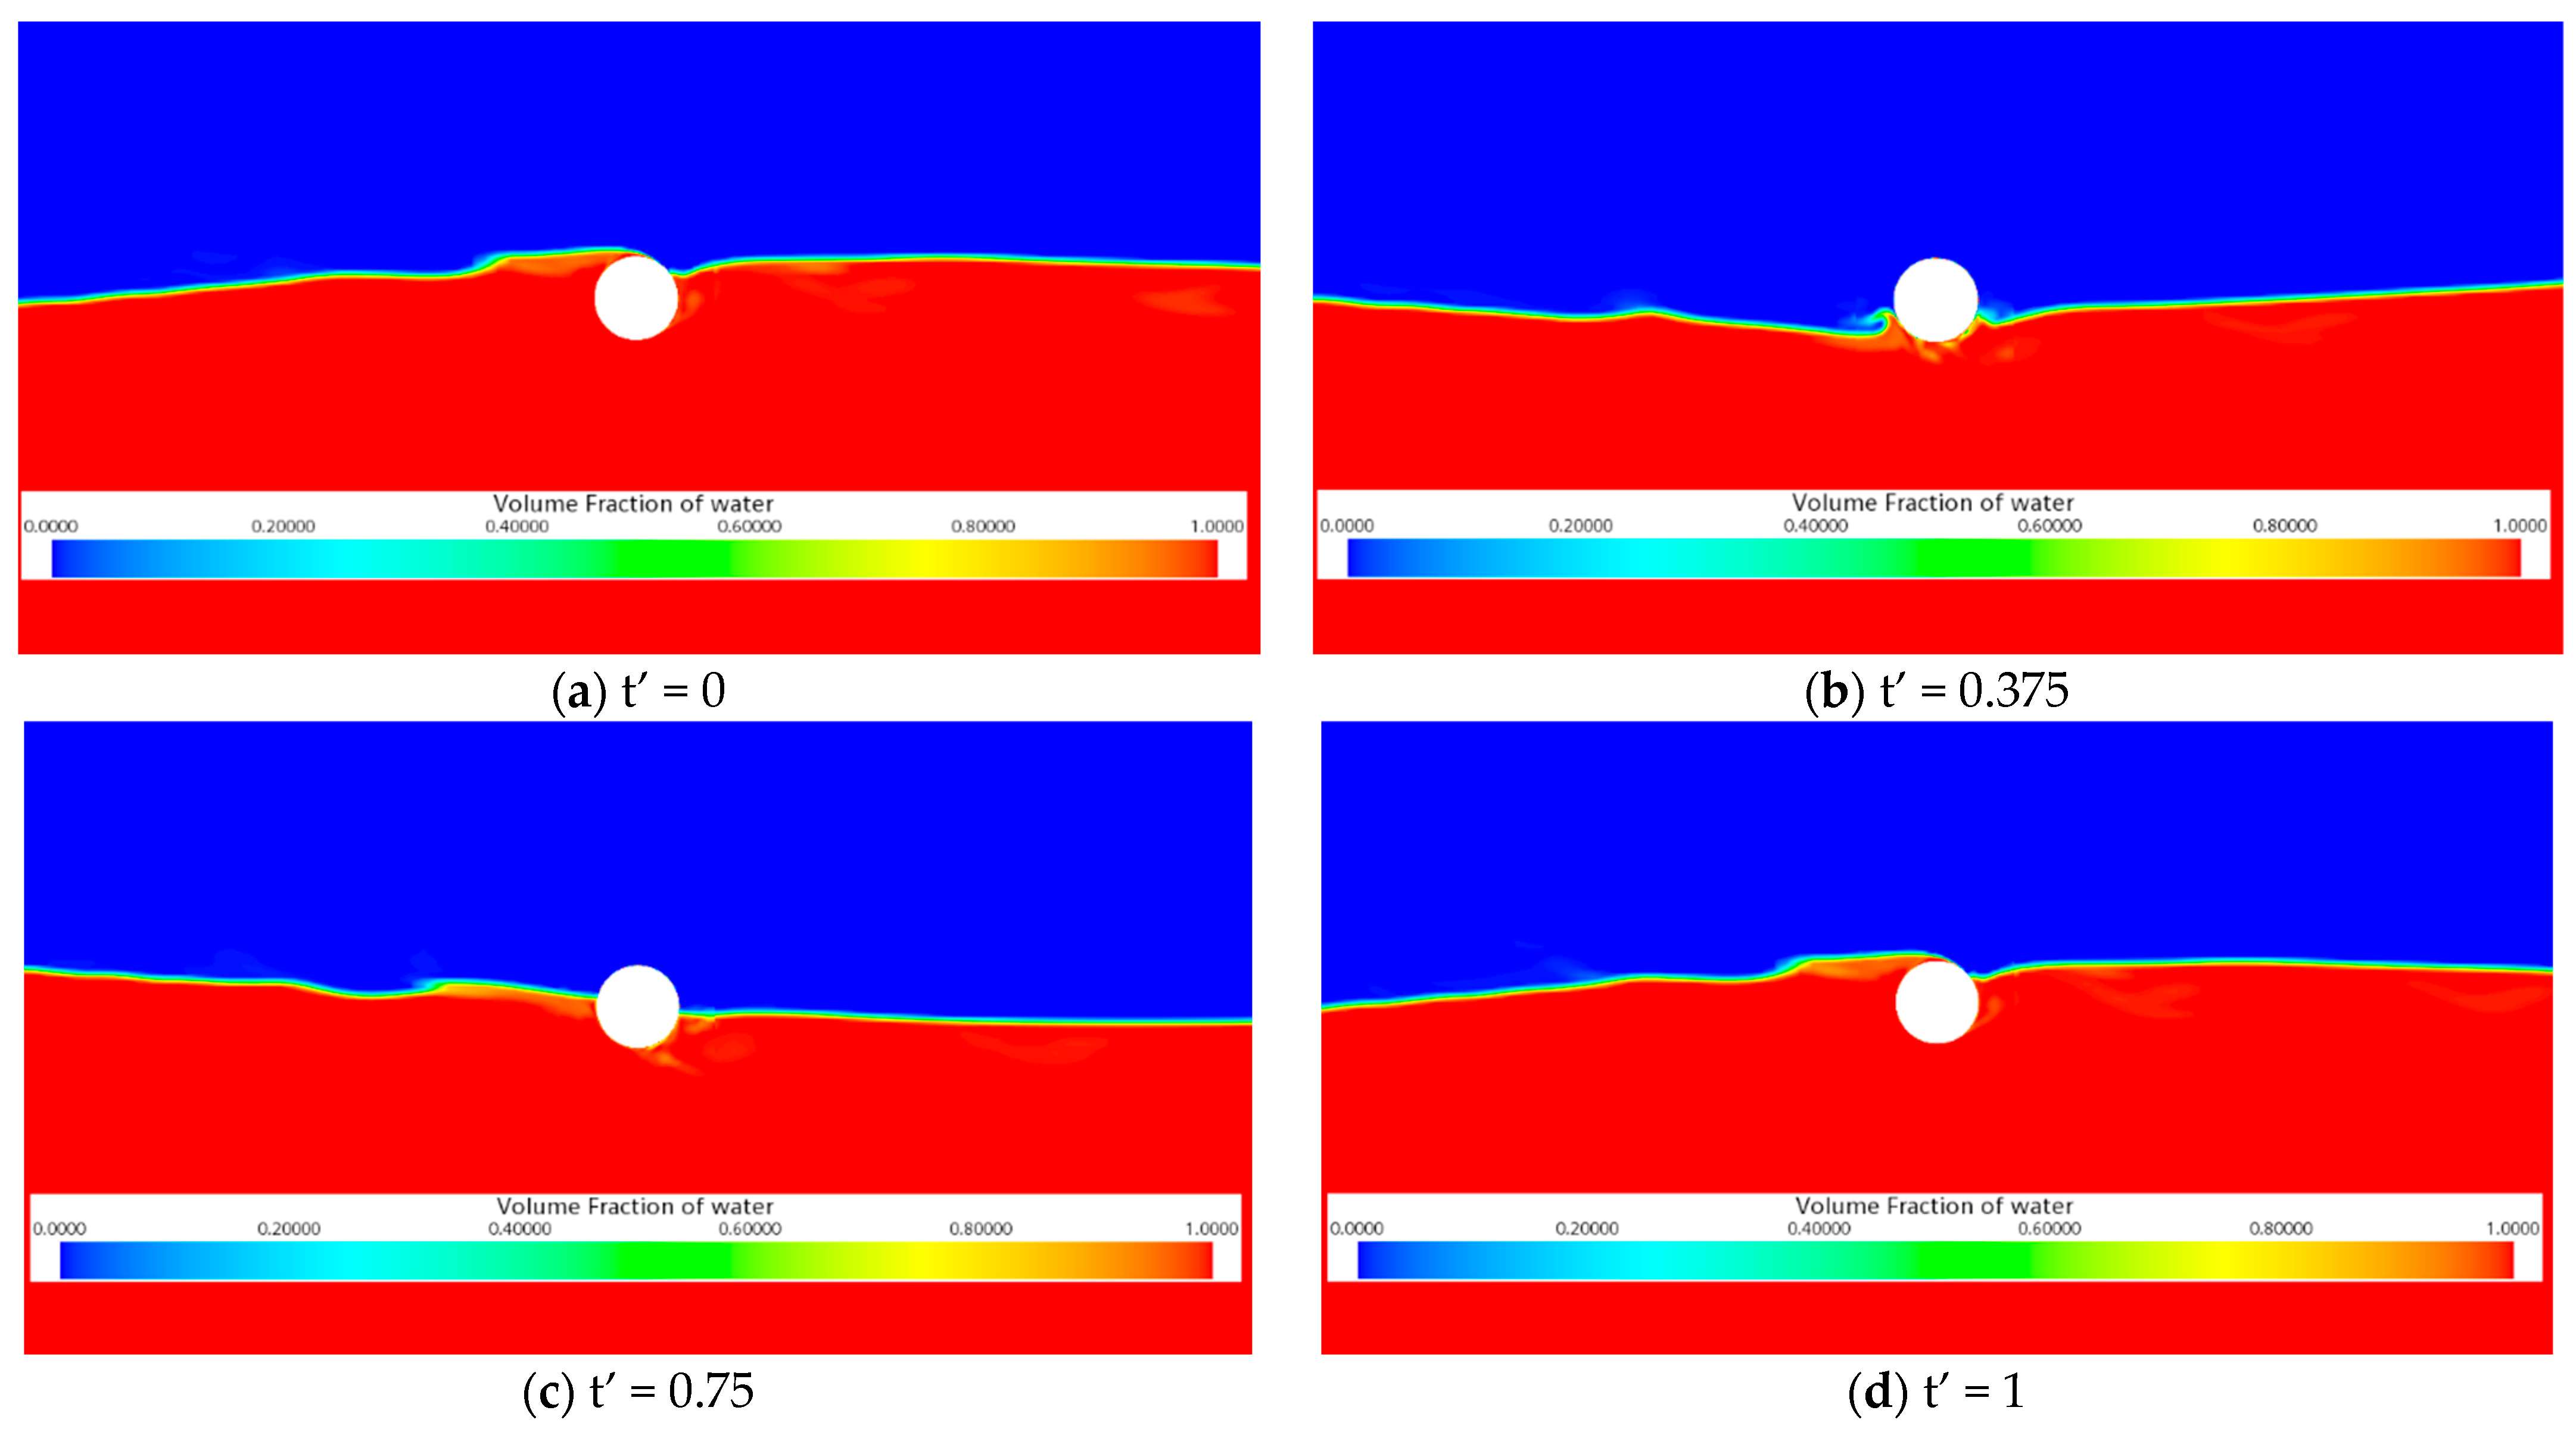
Figure 12 shows the variation curves of cylinder vibration response and k value under different reduction speeds when S/D = 0, T = 1.29 s, and AW = 0.0375 m. As can be seen from Figure 12, with the increase in reduction speed, its vibration amplitude first decreases and then increases. For Ur = 2.40 and 3.36, the peaks of the vibration amplitude appear at different k, indicating that the resonance occurs at different k for these two flow rates. When Ur = 2.40, the resonance occurs at k = 0.01 N/m. When Ur = 3.36, the resonance takes place at k = 0.015 N/m. For Ur = 4.32, it is noted that the maximum of the vibration amplitude appears at the minimal k considered in the present study, which suggests that the resonance does not yet occur in the current range of k.

4.2. Flow Pattern

Figure 13 shows the volume fraction of water over one wave period with S/D = 0. It can be seen from Figure 13 that the submerged depth of the cylinder increases when the crest passes through the cylinder and decreases when the trough passes through the cylinder. From Figure 13c, obvious wave reflection can be seen.

4.3. Hydrodynamic Load Analysis

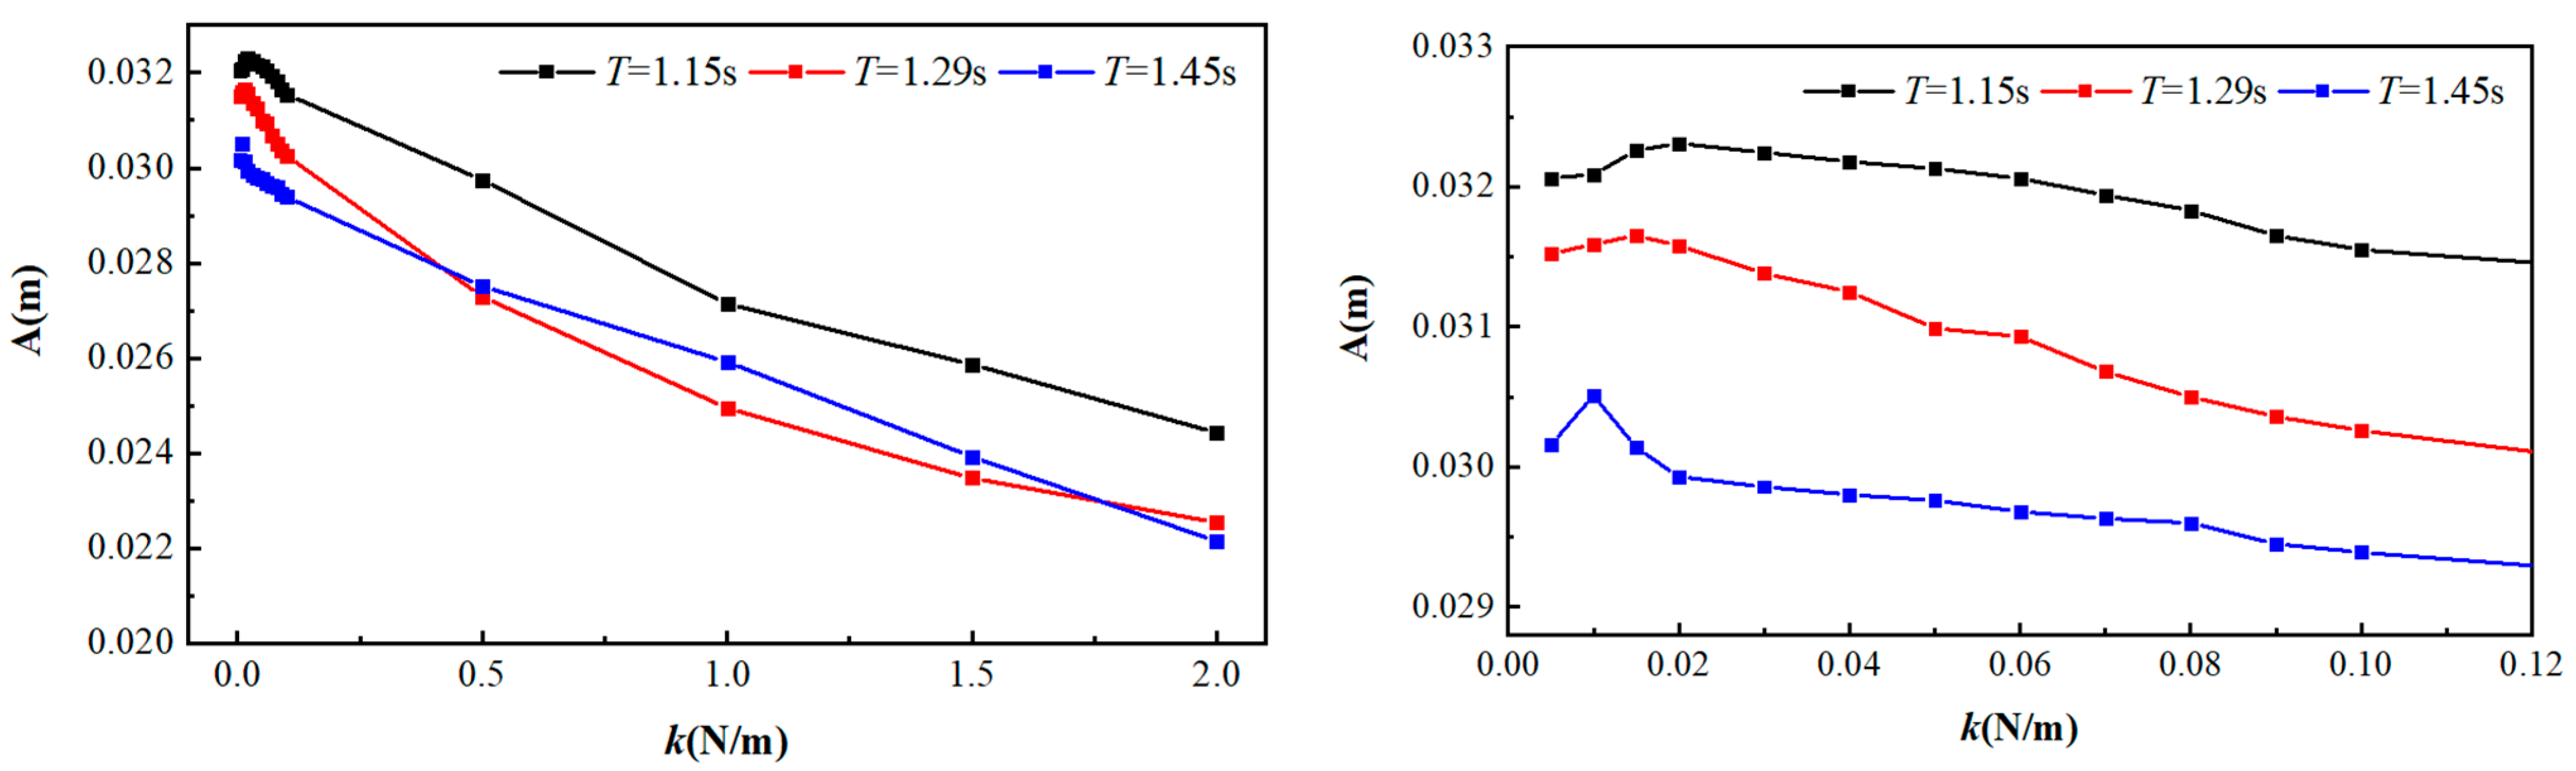
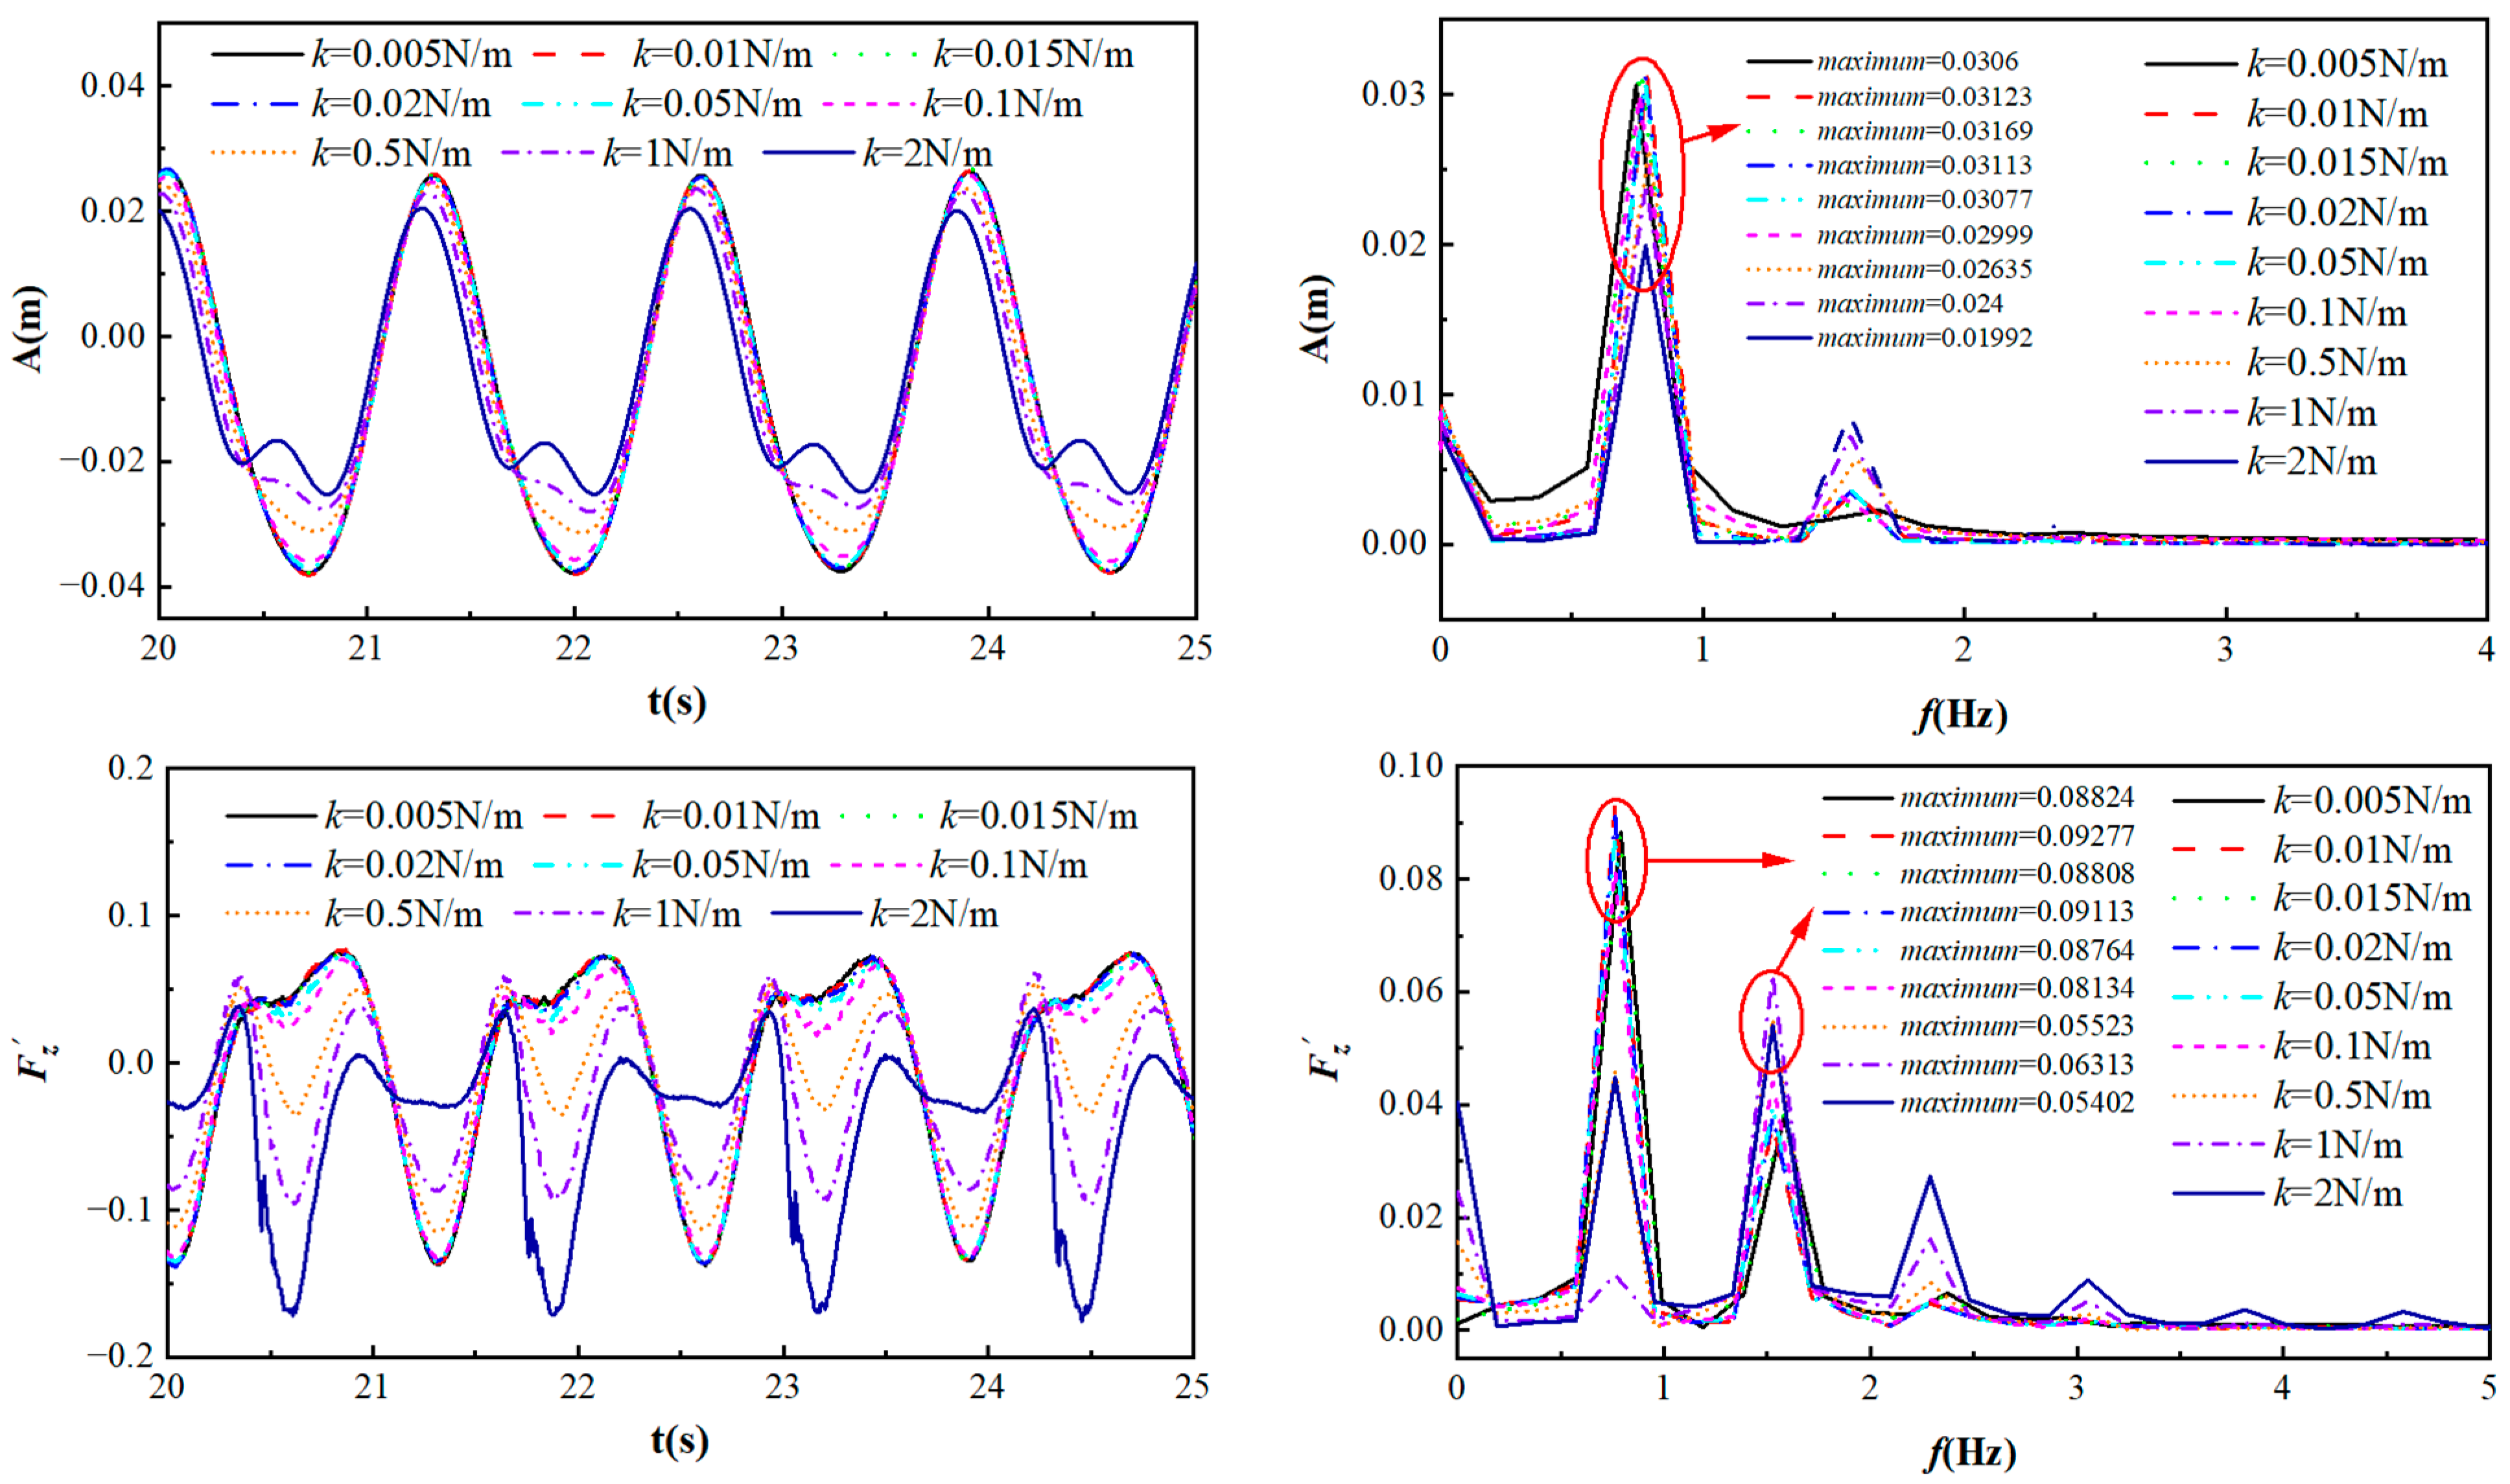
4.3.1. Analysis of Fluid Load under Different k Values

Figure 14 shows the time histories and power spectra of the vertical motion and flow force at different k values when S/D = 0, Ur = 3.36, AW = 0.0375 m, and T = 1.29 s. It can be seen from the motion and power spectrum curves that when k = 0.015~2 N/m, the dominant frequencies of the motion and fluid forces are consistent with the wave frequency. This indicates that the resonant motion takes place in these situations. With the increase in k, since the increase in spring stiffness restricts the movement of the cylinder, the motion amplitude gradually decreases, and the fluid force amplitude increases. In addition, the component at the minor frequency becomes significant when k increases. When k = 0.005~0.015 N/m, the restriction from the spring stiffness becomes weak with k decreasing. However, according to Figure 6, when k decreases from 0.015 N/m to 0.005 N/m, the vibration amplitude decreases. This is because the dominant frequency of the motion becomes smaller than the wave frequency, implying that the resonant motion becomes weak.

4.3.2. Analysis of Fluid Load under Different Periods

Figure 15 shows time histories of the vertical motions and fluid force at different wave periods when S/D = 0, Ur = 3.36, AW = 0.0375 m, and k = 2 N/m. It can be seen from the motion and spectrum curves that with the increase in the wave period, the motion amplitude gradually decreases, and the dominant frequency decreases, which is consistent with the variation in the wave frequency. Meanwhile, the dominant frequencies of the motion are close to the wave frequencies, indicating that the motions are at resonance. From the vertical force curves, it is noted that the force amplitude decreases with the increasing wave period increasing. In addition, the dominant frequency of the fluid force is consistent with that of the motion when T = 1.45 s. However, it becomes twice the dominant frequency of motion when T = 1.15 and 1.29 s.

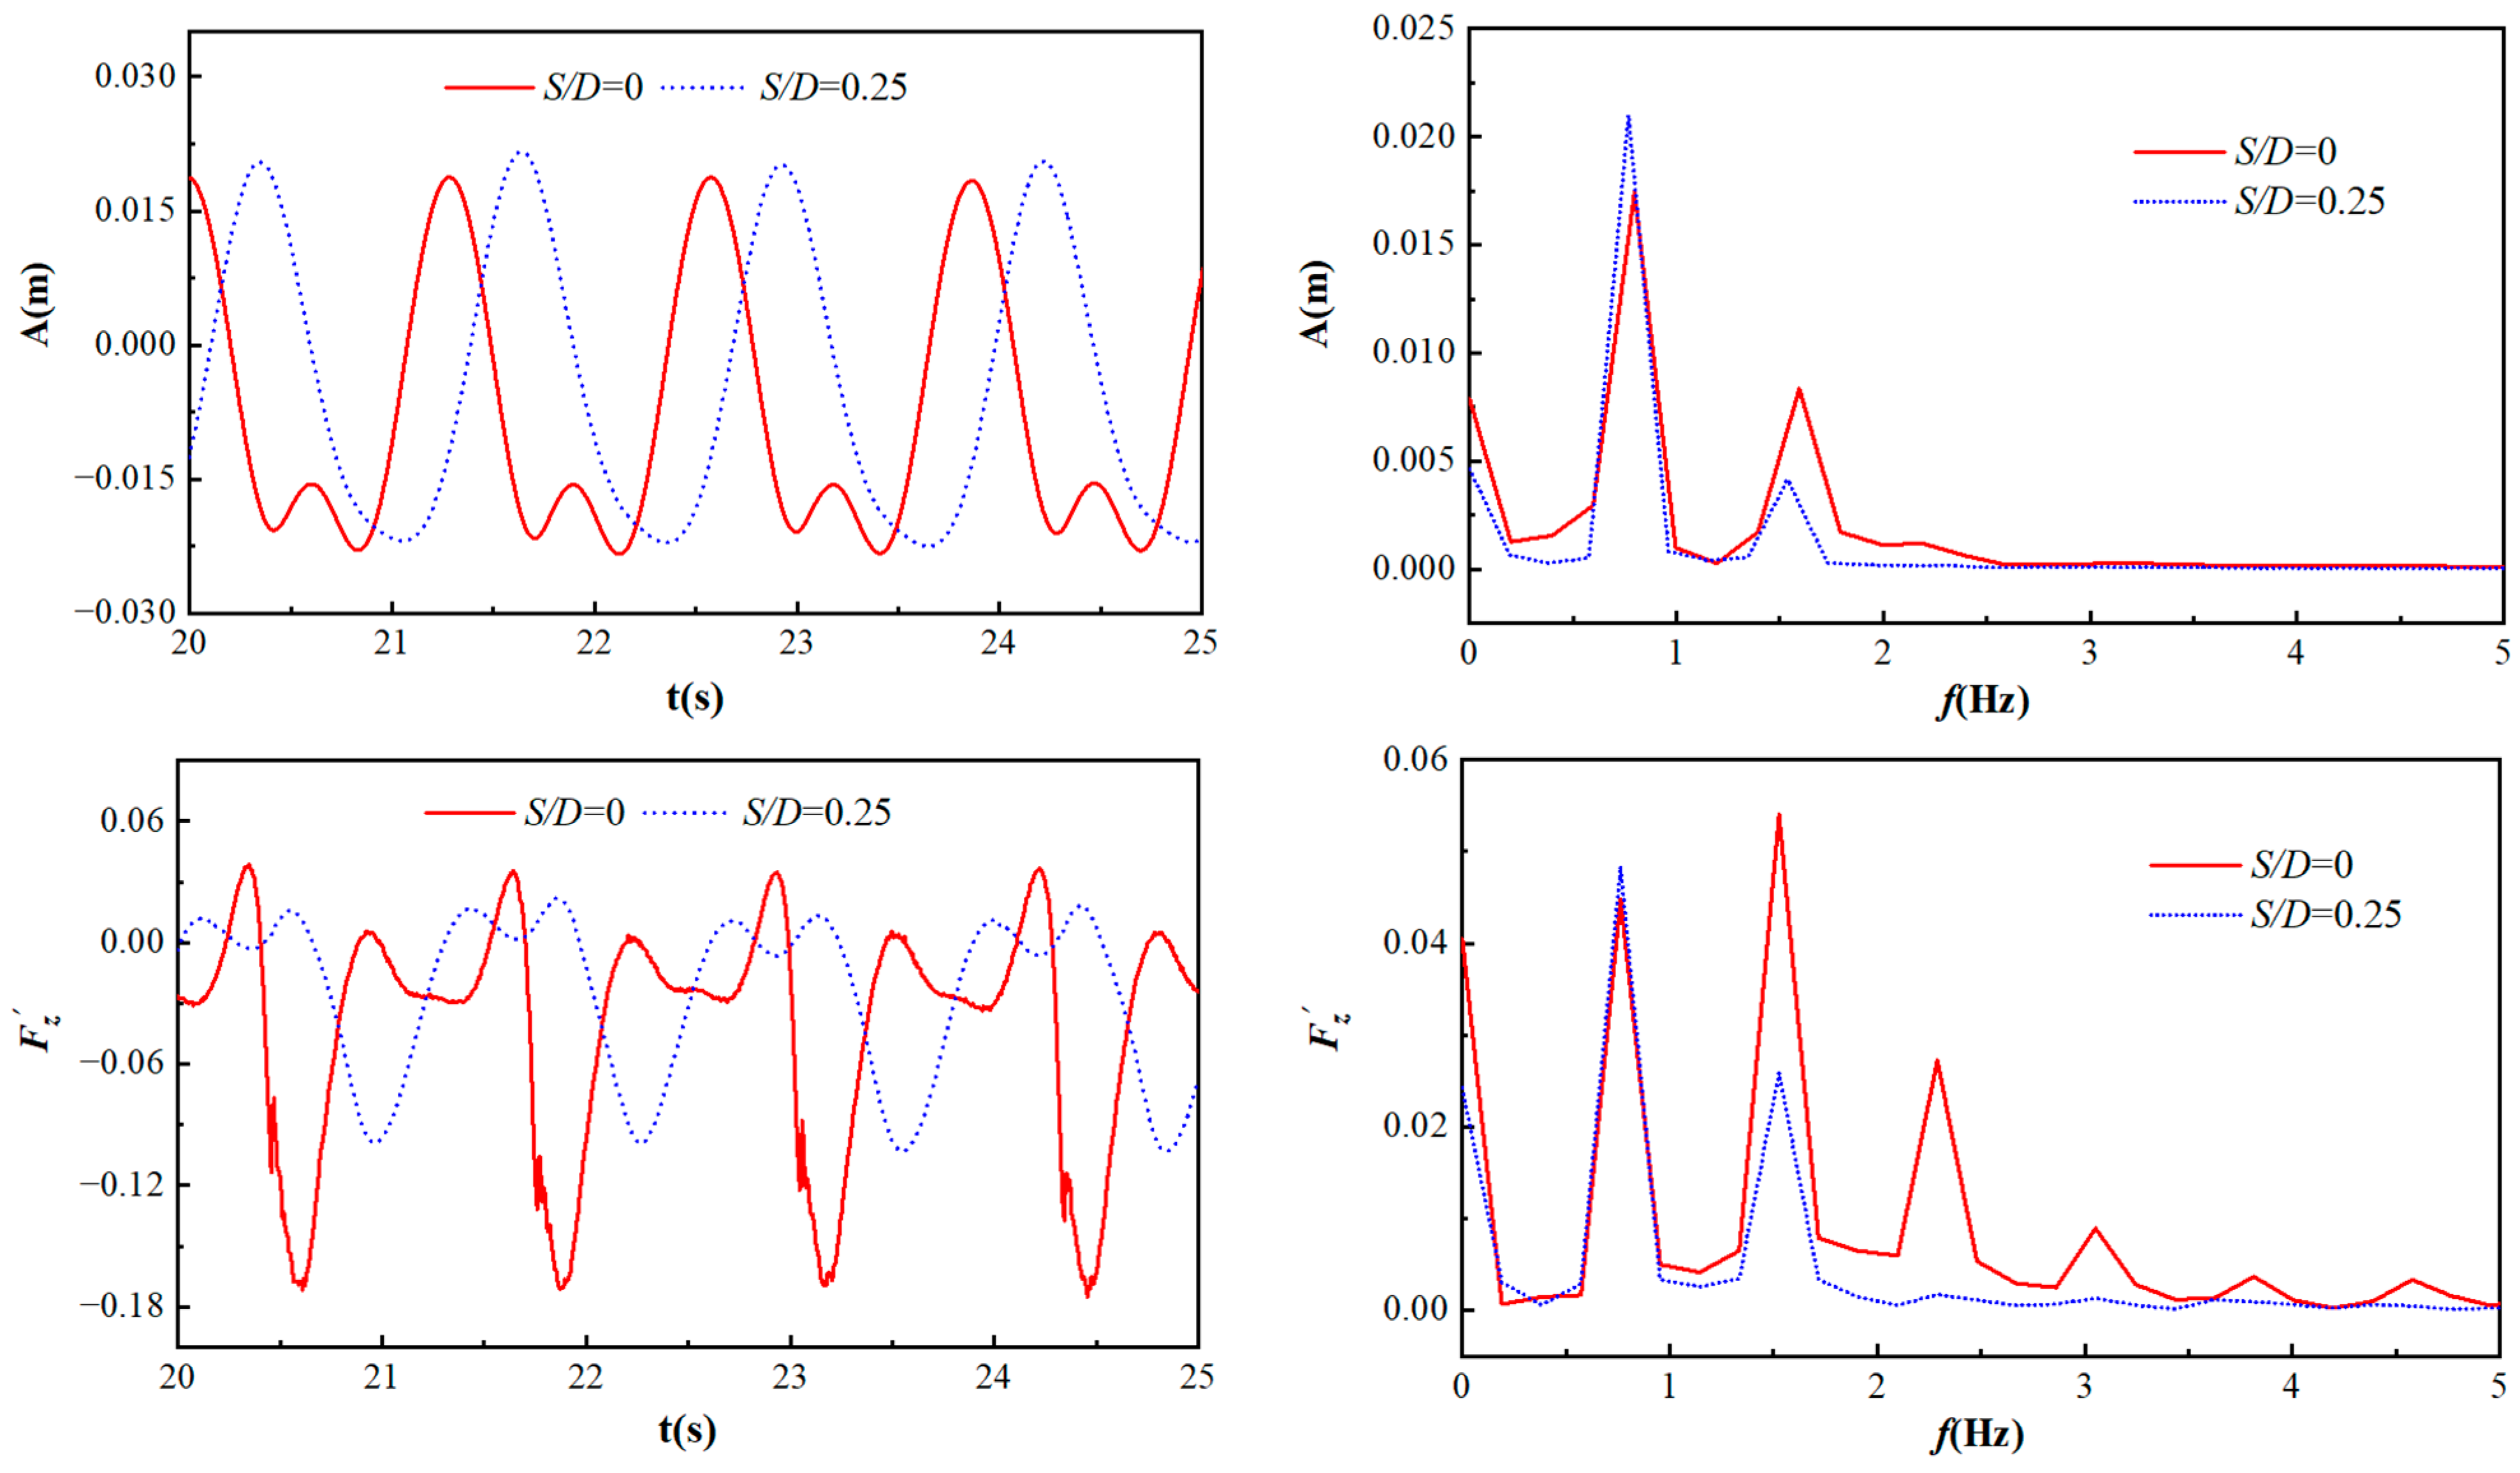
4.3.3. Analysis of Fluid Load under Different Submerged Depths

Figure 16 shows the time histories of the vertical motion and fluid force at different submerged depths: T = 1.29 s, Ur = 3.36, AW = 0.0375 m, and k = 2 N/m. It can be seen from the motion and power spectrum curves that, with the increase in the submerged depth, the motion amplitude decreases, and the dominant frequency slightly increases. When the submerged depth increases, the power at the minor frequency becomes significant. It can be seen from the vertical force and power spectrum curves that with the increase in submerged depth, the vertical force coefficient increases. When S/D = 0.25, due to the decrease in the wet area, it is much more affected by waves and less affected by flow, and the high-frequency characteristics are not evident. When S/D = 0, it is half-submerged in water, which is affected by the comprehensive influence of waves and currents, and the high-frequency characteristics are significant.

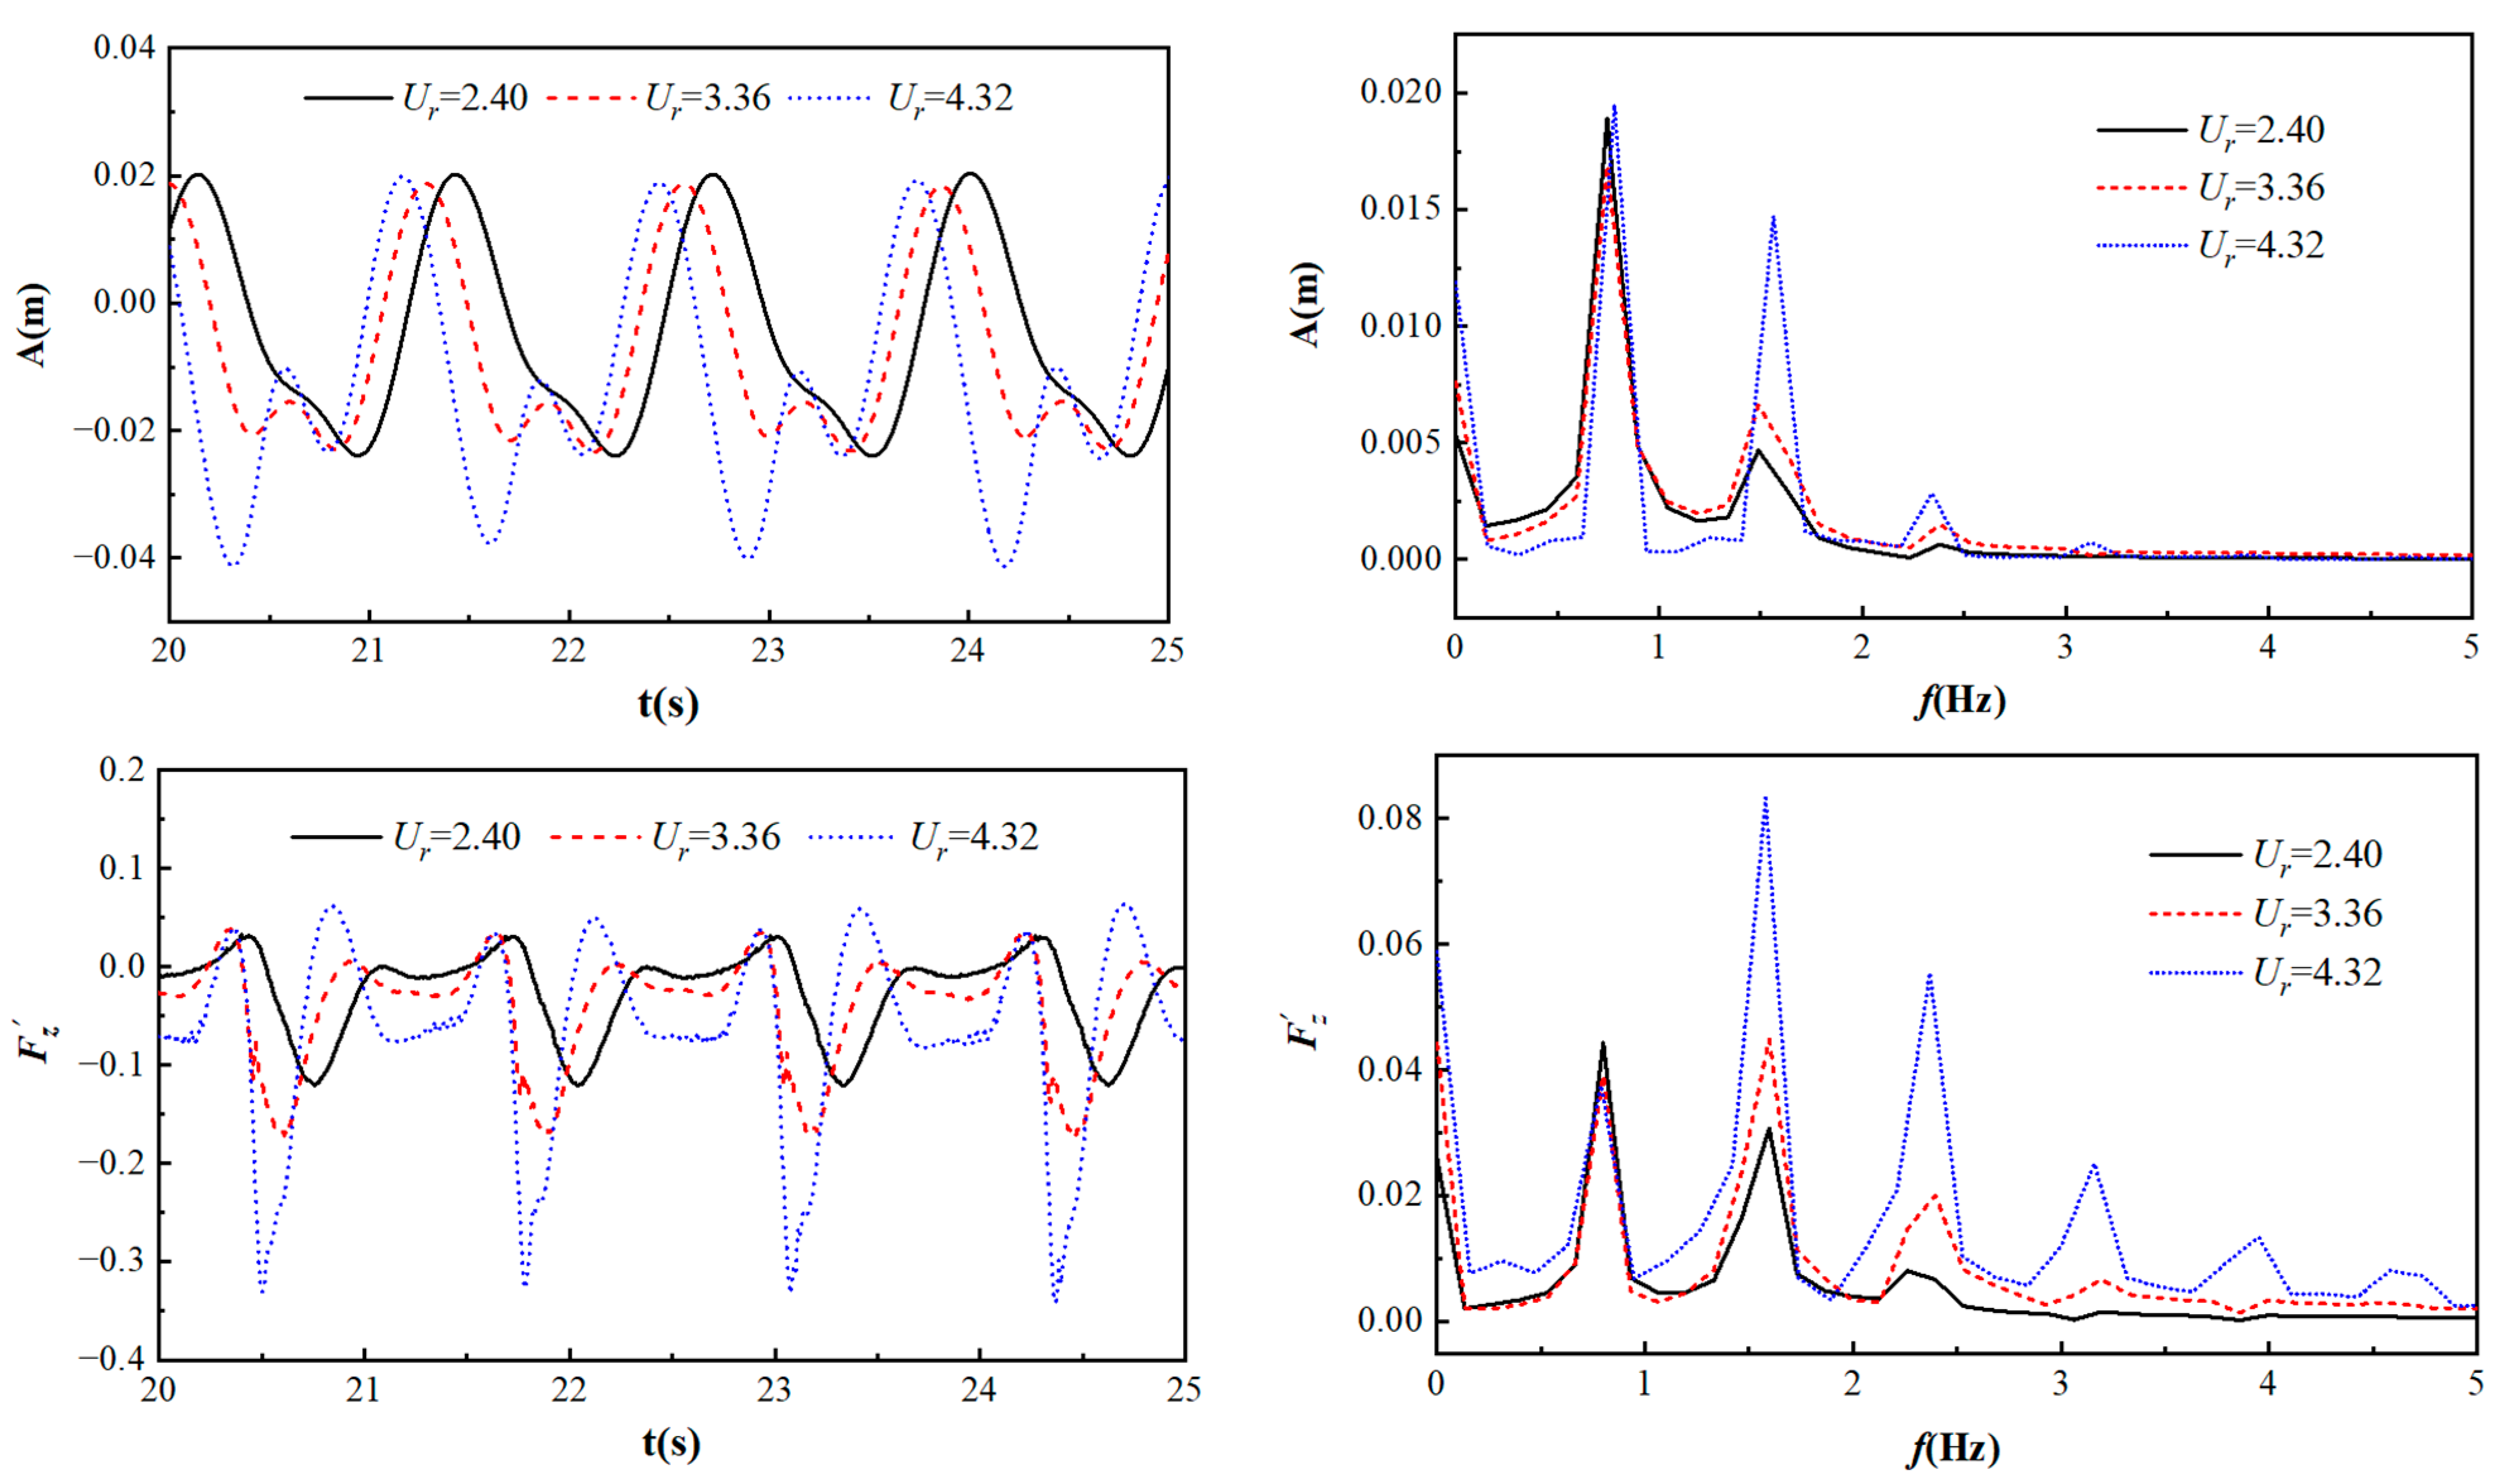
4.3.4. Analysis of Fluid Load at Different Flow Rates

Figure 17 shows time histories of the vertical motion and fluid force at S/D = 0, k = 2 N/m, AW = 0.0375 m, and T = 1.29 s at different flow rates. It can be seen from the motion and power spectrum curves that with the increase in the flow rate, the motion amplitude gradually increases, and the dominant frequencies are almost consistent with each other. When the flow rate increases, it is noted that the power of the motion at the minor frequency becomes very significant. This is because the interaction between the flow and wave strengthens as the flow rate increases. From the vertical force coefficient and power spectrum curves, it can be seen that, with the increase in the flow velocity, the vertical force coefficient clearly increases, and the increase in the flow velocity accelerates the vortex shedding rate, which makes the multi-frequency characteristics of the Fourier transform of the vertical force coefficient become evident. With the increase in the flow velocity, the blocking effect of the cylinder is evident, and the flow above the cylinder increases, resulting in the vertical force downward of the cylinder. As shown in Figure 16, the sensitivity of the negative vertical force to the flow velocity is higher than that of the positive vertical force.

5. Conclusions

In this study, the motion and fluid force on a horizontal cylinder under wave–current interaction were simulated by means of CFD. Firstly, the effectiveness of the mathematical model was verified by comparing numerical results with experimental data. Secondly, the motion response and wave–flow force under different working conditions were analyzed. The conclusions are summarized as follows:
(1)
When the vibration frequency is consistent with the wave frequency and the motion is at resonance, the vibration amplitude of the floating cylinder first increases with the decrease in k due to declining restrictions by spring stiffness. When k decreases to the values with which the vibration frequency departs from the wave frequency, the vibration amplitude decreases with the decrease in k.
(2)
The maximum vibration amplitude decreases with the increase in wave period when the wave amplitude and the flow rate are fixed.
(3)
When the cylinder is half-submerged, the effect of the current on the motion is significant, each of the vibration amplitudes is less than the wave amplitude. When a quarter is submerged, the cylinder motion is mainly affected by the wave, the vibration amplitude is larger than that of the half-submerged cylinder at each k. The maximum amplitude is greater than the wave amplitude.
(4)
When the wave parameters are fixed, the vibration response of the cylinder does not monotonously vary with the flow rate. The vibration amplitude reaches the minimum at a moderate flow rate for each k.

Author Contributions

Writing—original draft, X.Z.; Software, Q.J.; Investigation, Y.W.; Writing—review & editing, L.C.; Methodology, S.W.; Formal analysis, K.W.; Funding acquisition, K.W. All authors have read and agreed to the published version of the manuscript.

Funding

National Natural Science Foundation of China (52071348 and 51979129).

Institutional Review Board Statement

Not applicable.

Informed Consent Statement

Not applicable.

Data Availability Statement

The data presented in this study are available on request from the corresponding author.

Conflicts of Interest

The authors declare no conflict of interest.

References

  1. Sheridan, J.; Lin, J.-C.; Rockwell, D. Flow past a cylinder close to a free surface. J. Fluid Mech. 1997, 330, 1–30. [Google Scholar] [CrossRef] [Green Version]
  2. Lin, M.Y.; Huang, L.H. Free-surface flow past a submerged cylinder. J. Hydrodyn. Ser. B 2010, 22 (Suppl. S1), 209–214. [Google Scholar] [CrossRef]
  3. Liang, H.; Zong, Z.; Zou, L.; Zhou, L.; Sun, L. Vortex shedding from a two-dimensional cylinder beneath a rigid wall and a free surface according to the discrete vortex method. Eur. J. Mech. 2014, 43, 110–119. [Google Scholar] [CrossRef]
  4. Chung, M.-H. Two-degree-of-freedom vortex induced vibration of low-mass horizontal circular cylinder near a free surface at low Reynolds number. Int. J. Heat Fluid Flow 2016, 57, 58–78. [Google Scholar] [CrossRef]
  5. Capell, N.A.; Carlson, D.W.; Modarres-Sadeghi, Y. Vortex-induced vibration of a single degree-of-freedom flexibly-mounted horizontal cylinder near the free surface. J. Sound Vib. 2019, 444, 161–175. [Google Scholar] [CrossRef]
  6. Díaz-Ojeda, H.R.; González, L.M.; Huera-Huarte, F.J. On the influence of the free surface on a stationary circular cylinder with a flexible splitter plate in laminar regime. J. Fluids Struct. 2019, 87, 102–123. [Google Scholar] [CrossRef]
  7. Ma, L.; Resvanis, T.L.; Vandiver, J.K. The influence of mode dominance and traveling waves on flexible cylinder flow-induced vibration. Ocean Eng. 2022, 264, 111750. [Google Scholar] [CrossRef]
  8. Li, Y.; Lin, M. Hydrodynamic coefficients induced by waves and currents for submerged circular cylinder. Procedia Eng. 2010, 4, 253–261. [Google Scholar] [CrossRef] [Green Version]
  9. Xiao, H.; Huang, W.; Tao, J.; Liu, C. Numerical modeling of wave–current forces acting on horizontal cylinder of marine structures by VOF method. Ocean Eng. 2013, 67, 58–67. [Google Scholar] [CrossRef]
  10. Ning, D.Z.; Lin, H.X.; Teng, B.; Zou, Q.P. Higher harmonics induced by waves propagating over a submerged obstacle in the presence of uniform current. China Ocean Eng. 2014, 28, 725–738. [Google Scholar] [CrossRef]
  11. Hu, K.; Fu, S.X.; Xu, Y.W.; Ma, L.X. Experimental research about hydrodynamic characteristics of horizontal cylinder under different draft. J. Ship Mech. 2017, 21, 1190–1198. [Google Scholar]
  12. Bai, J.; Ma, N.; Gu, X. Wave-current loads on the horizontal cylinder with varying submergence depths. J. Shanghai Jiao Tong Univ. 2018, 52, 938–945. [Google Scholar]
  13. Bai, J.; Ma, N.; Gu, X. Study of interaction between wave-current and the horizontal cylinder located near the free surface. Appl. Ocean Res. 2017, 67, 44–58. [Google Scholar] [CrossRef]
  14. Ghadirian, A.; Vested, M.H.; Carstensen, S.; Christiensen, E.D.; Bredmose, H. Wave-current interaction effects on waves and their loads on a vertical cylinder. Coast. Eng. 2021, 165, 103832. [Google Scholar] [CrossRef]
  15. Wang, S.D.; Wei, G.; Du, H.; Wang, X.L.; Xu, J.N. Experimental investigation on the three-dimensional oblique interaction of an internal solitary wave with a horizontal finite-length cylinder. Ocean Eng. 2022, 111, 58–67. [Google Scholar] [CrossRef]
  16. Saincher, S.; Sriram, V. Experimental investigation of hydrodynamic loading induced by regular, steep non-breaking and breaking focused waves on a fixed and moving cylinder. Ocean Eng. 2022, 111, 212–235. [Google Scholar] [CrossRef]
  17. Zhao, Y.P.; Chen, Q.P.; Bi, C.W. Numerical investigation of nonlinear wave loads on a trestle-netting enclosure aquaculture facility. Ocean Eng. 2022, 257, 52–65. [Google Scholar] [CrossRef]
  18. Liu, Z.; Zhao, W.; Wan, D. CFD study of wave interaction with single and two tandem circular cylinders. Ocean Eng. 2021, 239, 109855. [Google Scholar] [CrossRef]
  19. CD-Adapco. STAR-CCM+ User Guide, Version 12.06; CD-Adapco: Melville, NY, USA, 2017.
  20. Fenton, J.D. A fifth-order Stokes theory for steady waves. J. Waterw. Port Coast. Ocean Eng. 1985, 111, 216–234. [Google Scholar] [CrossRef] [Green Version]
  21. Skjelbreia, L.; Hendrickson, J. Fifth order gravity wave theory. In Proceedings of the 7th Conference of Coastal Engineer, The Hague, The Netherlands, 1960; pp. 184–196. [Google Scholar]
  22. Dixon, A.G.; Greated, C.A.; Salter, S.H. Wave forces on partially submerged cylinders. J. Waterw. Port Coast. Ocean Div. 1979, 105, 421–438. [Google Scholar] [CrossRef]
  23. Li, B.H.; Zheng, X.Y.; Li, W.; Rong, W.D. Numerical generation of Stokes fifth order waves in wave flume. J. Wuhan Univ. Technol. (Transp. Sci. Eng.) 2016, 40, 238–244. [Google Scholar]
Figure 1. Sketch of numerical wave flume.
Jmse 10 01884 g001
Figure 2. Mesh sketch.
Jmse 10 01884 g002
Figure 3. Comparison of the wave elevation of different cells.
Jmse 10 01884 g003
Figure 4. Comparison of the wave elevation of different time steps.
Jmse 10 01884 g004
Figure 5. Comparison of calculated and theoretical values.
Jmse 10 01884 g005
Figure 6. Computational domain of water channel.
Jmse 10 01884 g006
Figure 7. Comparison between calculated and experimental values.
Jmse 10 01884 g007
Figure 8. Spring damping system.
Jmse 10 01884 g008
Figure 9. Vibration responses under different wave periods (Ur = 3.36, S/D = 0, AW = 0.0375 m).
Jmse 10 01884 g009
Figure 10. S/D diagram.
Jmse 10 01884 g010
Figure 11. Vibration responses under different submerged depths (Ur = 3.36, T = 1.29 s, AW = 0.0375 m).
Jmse 10 01884 g011
Figure 12. Vibration responses under different flow rates (S/D = 0, T = 1.29 s, AW = 0.0375 m).
Jmse 10 01884 g012
Figure 13. The volume fraction of water over one wave period (S/D = 0).
Jmse 10 01884 g013
Figure 14. Time histories and power spectrum of wave–current force on cylinder at different k.
Jmse 10 01884 g014
Figure 15. Time series curve and spectrum of wave–current force on cylinder under different periods.
Jmse 10 01884 g015
Figure 16. Time series curve and spectrum of wave–current force on cylinder under different submerged depths.
Jmse 10 01884 g016
Figure 17. Time series and spectrum of wave–current force under different Ur.
Jmse 10 01884 g017
Table 1. Mesh parameters.
CellNumber of Cells in the Wavelength RangeNumber of Cells in the Wave Height RangeTotal Number of Cells in 2D
180101.31 × 105
2100201.9 × 105
3120252.1 × 105
Table 2. Relevant parameters of the working condition.
TUrUkS/D
1.153.360.3520
1.292.400.2520
3.360.350~20
0.25
4.320.4520
1.453.360.3520
Publisher’s Note: MDPI stays neutral with regard to jurisdictional claims in published maps and institutional affiliations.

