Article

High Throughput Sequencing Reveals Distinct Bacterial Communities and Functional Diversity in Two Typical Coastal Bays

1
School of Materials and Environmental Engineering, Shenzhen Polytechnic, Shenzhen 518055, China
2
Shenzhen Key Laboratory of Marine Bioresource & Eco-Environmental Sciences, College of Life Sciences and Oceanography, Shenzhen University, Shenzhen 518071, China
*
Author to whom correspondence should be addressed.
J. Mar. Sci. Eng. 2022, 10(12), 1878; https://doi.org/10.3390/jmse10121878
Submission received: 28 October 2022 / Revised: 13 November 2022 / Accepted: 17 November 2022 / Published: 3 December 2022
(This article belongs to the Section Marine Biology)

Abstract

:
The marine waters in semi-enclosed bays are highly dynamic and strongly influenced by different levels of anthropogenic activity. This study explored the bacterial community composition and diversity in two typical urbanized coastal bay areas (Shenzhen Bay (S) and Dapeng Bay (D)) in Shenzhen, China, based on Illumina NovaSeq sequencing. Seawater analysis showed that coastal area S experienced a higher level of pollution, with higher nutrient concentrations observed. Alpha diversity analysis showed a higher bacterial diversity and richness in coastal area S than D. Taxonomic analysis revealed that the phylum Proteobacteria showed the highest abundance in all samples. Other dominant phyla were Firmicutes, Cyanobacteria, Tenericutes, and Actinobacteria. The bacterial community compositions were significantly different between the two coastal areas. A significant community difference was also found between the sampling sites of coastal area S. However, the difference between sampling sites in coastal area D was not significant. Physicochemical factors showed a more significant effect on bacterial community composition than nutrients. Pearson correlation tests and Network analysis further confirmed that salinity/conductivity, pH, and nitrate were the key factors driving the community difference. PICRUSt analysis revealed a higher degree of functional pathways in coastal area S relating to carbohydrate metabolism, membrane transport, and xenobiotics biodegradation. Our results provide in-depth insights into the bacterial community compositions in typical polluted coastal bays. They may provide information on underlying factors of the assembly process in microbial communities in the coastal zone.

1. Introduction

Coastal bays are the connection between marine and terrestrial interlaced zones and are sensitive to anthropogenic coastal occupation. Coastal bays adjacent to rapidly developing cities have both economic and natural values, as they are essential resources for human survival and social development [1]. Rapid urbanization has caused widespread eutrophication along coastal zones, posing severe ecological problems. Occurrences of hypoxia, algae blooms, and biodiversity loss were reported worldwide [2,3,4].
Marine bacteria are an integral component of primary production. They are both producers and consumers in the marine environment and play critical roles in coastal ecosystems’ biogeochemical cycles, energy flow, and function [5]. They form complex and highly dynamic assemblages, with bacterial diversity variations spatially and temporally linked to changes in genetic, metabolic, and functional diversity [6,7]. With an increased understanding of bacterial importance in energy and organic matter cycling, knowledge of the structure and diversity of bacterial communities has become essential for understanding the relationship between ecosystem functions and the environment. Our understanding of marine bacterial diversity is limited due to the inadequacy of culture-dependent methods. Next-generation sequencing techniques have enabled the analysis of bacterial diversity on a large scale. However, understanding the interactions of microbes with the environment and ecosystem functioning based on the sequencing data is still a challenge [8]. Investigating the seawater bacterial community compositions from the different coastal bay areas helps to understand the ecology of microbial populations and their coastal ecosystem function [9].
High throughput sequencing methods targeting the 16S rRNA gene have been widely used to explore bacterial communities in the marine environment. Previous studies have identified the dominant roles of Proteobacteria, Cyanobacteria, and Firmicutes phyla in various coastal zones [10,11]. Factors such as temperature, salinity, dissolved oxygen levels, and nutrient availability significantly influence the composition and diversity of bacterial communities in the marine environment [12]. It is reported that the composition and distribution of bacterial communities in coastal zones depend on environmental and spatial factors. The microbial taxa exhibit distinct biogeographical distribution patterns in the coastal waters, correlated with varying environmental parameters [13,14]. Microorganisms are sensitive to the environment’s fluctuations in coastal areas [15]. The anthropogenic addition of pollutants into the coastal areas could affect the richness and diversity of microorganisms and their physiological activities [16]. Numerous studies have documented the influence of pollutants on the abundance and diversity of the microbial community.
As one of the most studied coastal ecosystems over the last decades, semi-enclosed bays were confirmed to be significantly influenced by anthropogenic factors [10,17,18]. Shenzhen is a coastal mega-city in south China. During the rapid economic development of the past four decades, pollutants from industry, tourism, aquaculture, and nutrient discharge from wastewater put enormous pressure on coastal waters. Many studies of these areas have focused on primary pollutants such as nutrient enrichment [19], heavy metal and petroleum hydrocarbon pollution [20], or antibiotic resistance genes [21]. However, few studies regarding bacterial communities in the coastal bay areas of Shenzhen were conducted [21,22]. The microbial functions of coastal ecosystems still need to be better understood. Shenzhen Bay and Dapeng Bay are typical semi-enclosed bays in western and eastern Shenzhen, respectively. The population density and economic development degree in the west of Shenzhen is much higher than in the east [23], so they experienced different levels of pollutions. In the present study, seawater samples were collected from different sites in two typical coastal bay areas in Shenzhen, China. The microbial community compositions were analyzed using Illumina NovaSeq sequencing. The interactions of microbial communities with environmental factors and functional diversity were analyzed. The results of this study will lay a solid theoretical foundation for controlling coastal pollution and restoring coastal ecology.

2. Materials and Methods

2.1. Study Sites and Sample Collection

Seawater samples were collected from two coastal bay areas in Shenzhen, China. Shenzhen Bay is a semi-closed gulf located in western Shenzhen, between Shenzhen and Hong Kong. The basin covers a 607 km2 land area, while the bay itself is a 15 km long and 5.5 km wide semi-closed bay of 83 km2, with an mean depth of 3 m and annual mean temperature of 22.4 °C [20]. It is located close to the inner city and is subject to freshwater inputs from the Shenzhen River. Because of rapid population growth and urbanization, the coastal zone has experienced a series of ecological problems [24]. Samples were collected from the six sites along the bay area (S1–S6, 22.482824–22.508452 N, 113.91925–114.033594 E) on the 19 July 2022. These sites were differently affected by natural or anthropic disturbances, and the distance between the shore and sampling site was 0.5 m (Table 1, Figure S1). Dapeng Bay is another natural semi-enclosed inner bay between Shenzhen and Hong Kong. It is located in eastern Shenzhen and covers about 390 km2 with a water depth of less than 16 m. The bay was about 14 km2, and the water temperature was between 16.9 and 30.9 °C. This area has the largest container throughput of China’s single port area (Yantian Port) [25]. However, recent increases in aquaculture activities, permanent human populations, and tourism have also brought profound ecological pressure on Dapeng Bay [21]. Samples were collected mainly from six different sites in the tourism area along the bay between Yantian port and Dapeng Cove (D1–D6, 22.592954–22.5944 N, 114.309762–114.311489 E) on the 12 July 2022, the distance between the shore and sampling site was 0.5 m (Table 1, Figure S1). The population density, as well as the economic development degree, in the west of Shenzhen is much higher than in the east [23]. In the present study, seawater samples were collected from different sites of two typical coastal bay areas in Shenzhen, China. The microbial community compositions were analyzed using Illumina NovaSeq sequencing.
At each sampling site, ~1 L of surface seawater sample at about 0.5 m depth was collected and transferred to a pre-rinsed sterile plastic bottle. Water collection was conducted at three different sampling points for each site. The temperature, pH, conductivity, and dissolved oxygen concentration (DO) were measured in situ using Multiparameter Probes (Orion Star A329, Thermo Scientific, Waltham, MA, USA). Salinity was measured using a salinity meter (PAL-104, Qiwei Technology, Hangzhou, China). Samples were then transported back to the laboratory within 3 h. Samples were filtered through 0.22 µm glass fiber filters (Merck KGaA, Darmstadt, Germany) using a peristaltic pump. The 0.22 µm membranes were then stored at −80 °C for subsequent DNA extraction, and the filtered water samples were stored at 4 °C for chemical analyses. The concentrations of ammonium, nitrite, and nitrate were measured using salicylic acid-hypochlorous acid, N-(1-naphthalene)-diaminoethane dihydrochloride, and sulfamic acid spectrophotometric methods, respectively [26]. Phosphate concentration was detected using ammonium molybdate spectrophotometric method [26].

2.2. DNA Extraction and Sequencing

The preserved 0.22 µm membranes were sent to Health Time Gene Institute (Shenzhen, China) for DNA extraction, PCR amplification, and sequencing. DNA extraction was conducted using an E.Z.N.A. Soil DNA Kit (OMEGA Bio-Tek, Norcross, GA, USA) based on the manufacturer’s instructions. The quality of extracted DNA was checked using a NanoDrop ND-2000 spectrophotometer (Thermo Fisher Scientific). The bacterial 16S rRNA gene (V3-V4 region) was then amplified using primers 341F (CCTAYGGGRBGCASCAG) and 806R (GGACTACNNGGGTATCTAAT). PCR amplification was conducted as follows: 98 °C for 1 min, 30 cycles of 98 °C for 10 s, 50 °C for 30 s, and 72 °C for 30 s, and then extension at 72 °C for 5 min. Amplicons of the samples were then mixed with equi-density ratios and purified using a GeneJET Gel Extraction Kit (Thermo Fisher Scientific). An Illumina TruSeq DNA PCR-Free Library Preparation Kit (Illumina, USA) was used to generate sequencing libraries following the manufacturer’s instructions. Amplicons were sequenced on an Illumina NovaSeq platform (2 × 250) (Illumina, San Diego, CA, USA). The raw sequence data were submitted to the NCBI SAR database (Accession: PRJNA894299).

2.3. Bioinformatic Analyses

Raw sequences were processed in QIIME (v1.17) [27]. Briefly, raw reads were de-multiplexed, trimmed, and filtered to remove low-quality reads. Then, paired-end reads were merged to obtain the final sequences. Chimeric sequences were detected using the VSEARCH and Silva database and removed to get the effective tags. The VSEARCH (v2.4.4) package was used to cluster the effective tags into operational taxonomic units (OTUs) [28] at 97% identity. Each OTU was then assigned taxonomy used a closed-reference strategy based on the SILVA database (v132) [29]. OTUs were processed by removing chloroplast sequences, chondriosome sequences, and unclassified sequences using VSEARCH (v2.4.4). The obtained OTU table was used for subsequent analysis. Rarefaction curves were generated to assess the completeness of sampling. The alpha diversity indices of the samples, i.e., Chao 1, phylogenetic distance (PD whole), Shannon, and Simpson, were generated in QIIME (v1.17) [27] using the alpha_diversity.py script.

2.4. Statistical Analysis

Subsequent statistical analysis was performed in R software (v3.5.2). One-way analysis of variance (ANOVA), followed by Tukey’s honestly significant difference (HSD) test, was conducted to test if the environmental factors between sampling sites/coastal areas were significantly different, using the ‘aov()’ function. Pearson correlation test was used to assess the potential correlations between environmental factors and community richness, diversity, and relative abundance of phylum/genus. Beta-diversity analyses of the community were conducted under the ‘vegan’ package [30]. Principal coordinate analysis (PCoA) and UPGMA (Unweighted Pair-group Method with Arithmetic Mean) were conducted to assess the distribution of microbial communities between samples based on their Bray-Curtis distance matrices [31]. Analysis of similarities (ANOSIM) was performed to test whether the differences in bacterial community composition between groups were significant (p < 0.05). Metastats analysis was performed to find genera that exhibited significant differences between groups, based on Fisher’s exact test and false discovery rate (FDR) calibration [32]. The effects of environmental factors on the bacterial community compositions were assessed by the Mantel test (with 999 permutations). Variance partitioning analysis (VPA) was further performed to assess the relative contributions of physicochemical factors (pH, conductivity, DO, and temperature) and nutrients (ammonium, nitrite, nitrate, and phosphate) on the variability of bacterial communities.
The Pearson correlation coefficients were calculated using the ‘cor()’ function in R to explore the correlations between the top 35 genera and environmental factors. Furthermore, the Maximum Information Coefficient (MIC) was calculated based on the Maximal Information-based Nonparametric Exploration (MINE) algorithm [33] under the ‘mine()’ function in R. The p-value was corrected for the false discovery rate (FDR) using the Benjamini–Hochberg method. The significant correlations (with MIC > 0.5 and FDR < 0.05) were filtered, and networks were visualized using Cytoscape V3.3.9 software [34].

2.5. Functional Prediction

Phylogenetic Investigation of Communities by Reconstruction of Unobserved States (PICRUSt) was used to identify differences between the functional potentials of the bacterial communities. The microbial metabolic function was predicted by importing the normalizing bacterial OTUs table into PICRUSt (v1.1.1) according to the KEGG database [35]. Function prediction was performed by removing the influence of the 16S marker gene copy numbers in the species genomes and obtaining KEGG Orthology (KO) information and KO abundance corresponding to OTU. In addition, based on the KEGG database, three levels of information on metabolic pathways and EC numbers were included. The significances in the KEGG pathways between different groups were tested by t-test.

3. Results

3.1. Sample Characteristics

The characteristics of the sampling sites are summarized in Table 1. The average temperatures at coastal areas D and S were 32.46 ± 0.11 and 24.99 ± 0.20, respectively. The average pH value in coastal area D was 7.18 ± 0.01, significantly lower than in coastal area S (8.31 ± 0.76, Table 1 and S1). Dissolved oxygen (DO) concentrations varied from 5.38 to 9.63 mg/L, significantly higher in coastal area D than in coastal area S (Table 1 and S1). The average conductivity and salinity at coastal area D were 31.74 ± 0.38 and 23.56 ± 0.29, significantly higher than in coastal area S. The ammonium and nitrate concentrations were 0.008–1.563 mg/L and 0.228–3.403 mg/L, respectively. The dissolved inorganic nitrogen (DIN, the sum of NO3-N, NO2-N, and NH4+-N) at coastal area S (2.19 ± 0.19 mg/L) was significantly higher than in coastal area D (1.26 ± 0.10 mg/L). Phosphate concentrations were 0.018–0.717 mg/L across the sampling sites but without significant differences between the coastal areas (ANOVA, p = 0.13). For coastal area D, except for salinity, ammonium, and phosphate, the variations of other environmental factors between sites were insignificant (Table S1). However, the environmental factors for coastal area S showed significant differences between the sites, except for temperature and phosphate. Overall, coastal area S was more affected by anthropogenic activities, with significantly higher concentrations of nutrients when compared with coastal area D.

3.2. Alpha Diversity of the Microbial Community

Sequencing of the 36 samples resulted in 35,193–40,152 effective bacterial sequences, which were assigned to 580–1650 OTUs (Table S2). Rarefaction curves showed that the bacterial communities in the samples were well represented in this study (Figure S2). In coastal area D, the Shannon and Chao1 richness estimators ranged from 2.55 to 2.93 and 592.28 to 1169.59, respectively. The observed species and phylogenetic diversity (PD whole tree) indices were 461–995 and 43.38–68.47, respectively (Table S2). There were no significant differences for these indices between the six sampling sites in coastal area D (Table S1). In coastal area S, the highest Shannon index (7.75) and Chao 1 index (1804.41) were found in site S5 (S5.2), whereas the most frequently observed species (1438) and PD whole tree (104.46) were found in site S4 (S4.1). The lowest values of these indices were observed in site S1 (S1.1, Table S2). There were no significant differences for the Shannon and Chao 1 indices between the six sampling sites in coastal area D (Table S1). Significant differences were found for the observed species and PD whole tree (Table S1). The highest indices were in S4, while the lowest was in S1. The richness and diversity of the two coastal areas were further compared by assigning the samples to each coastal bay. Alpha diversity analysis showed significantly higher values of Chao 1, observed species, Shannon index, and PD whole tree indices of coastal area S (Figure 1), indicating a higher bacterial richness and diversity in coastal area S than D.

3.3. Distribution Characteristics of the Bacterial Communities

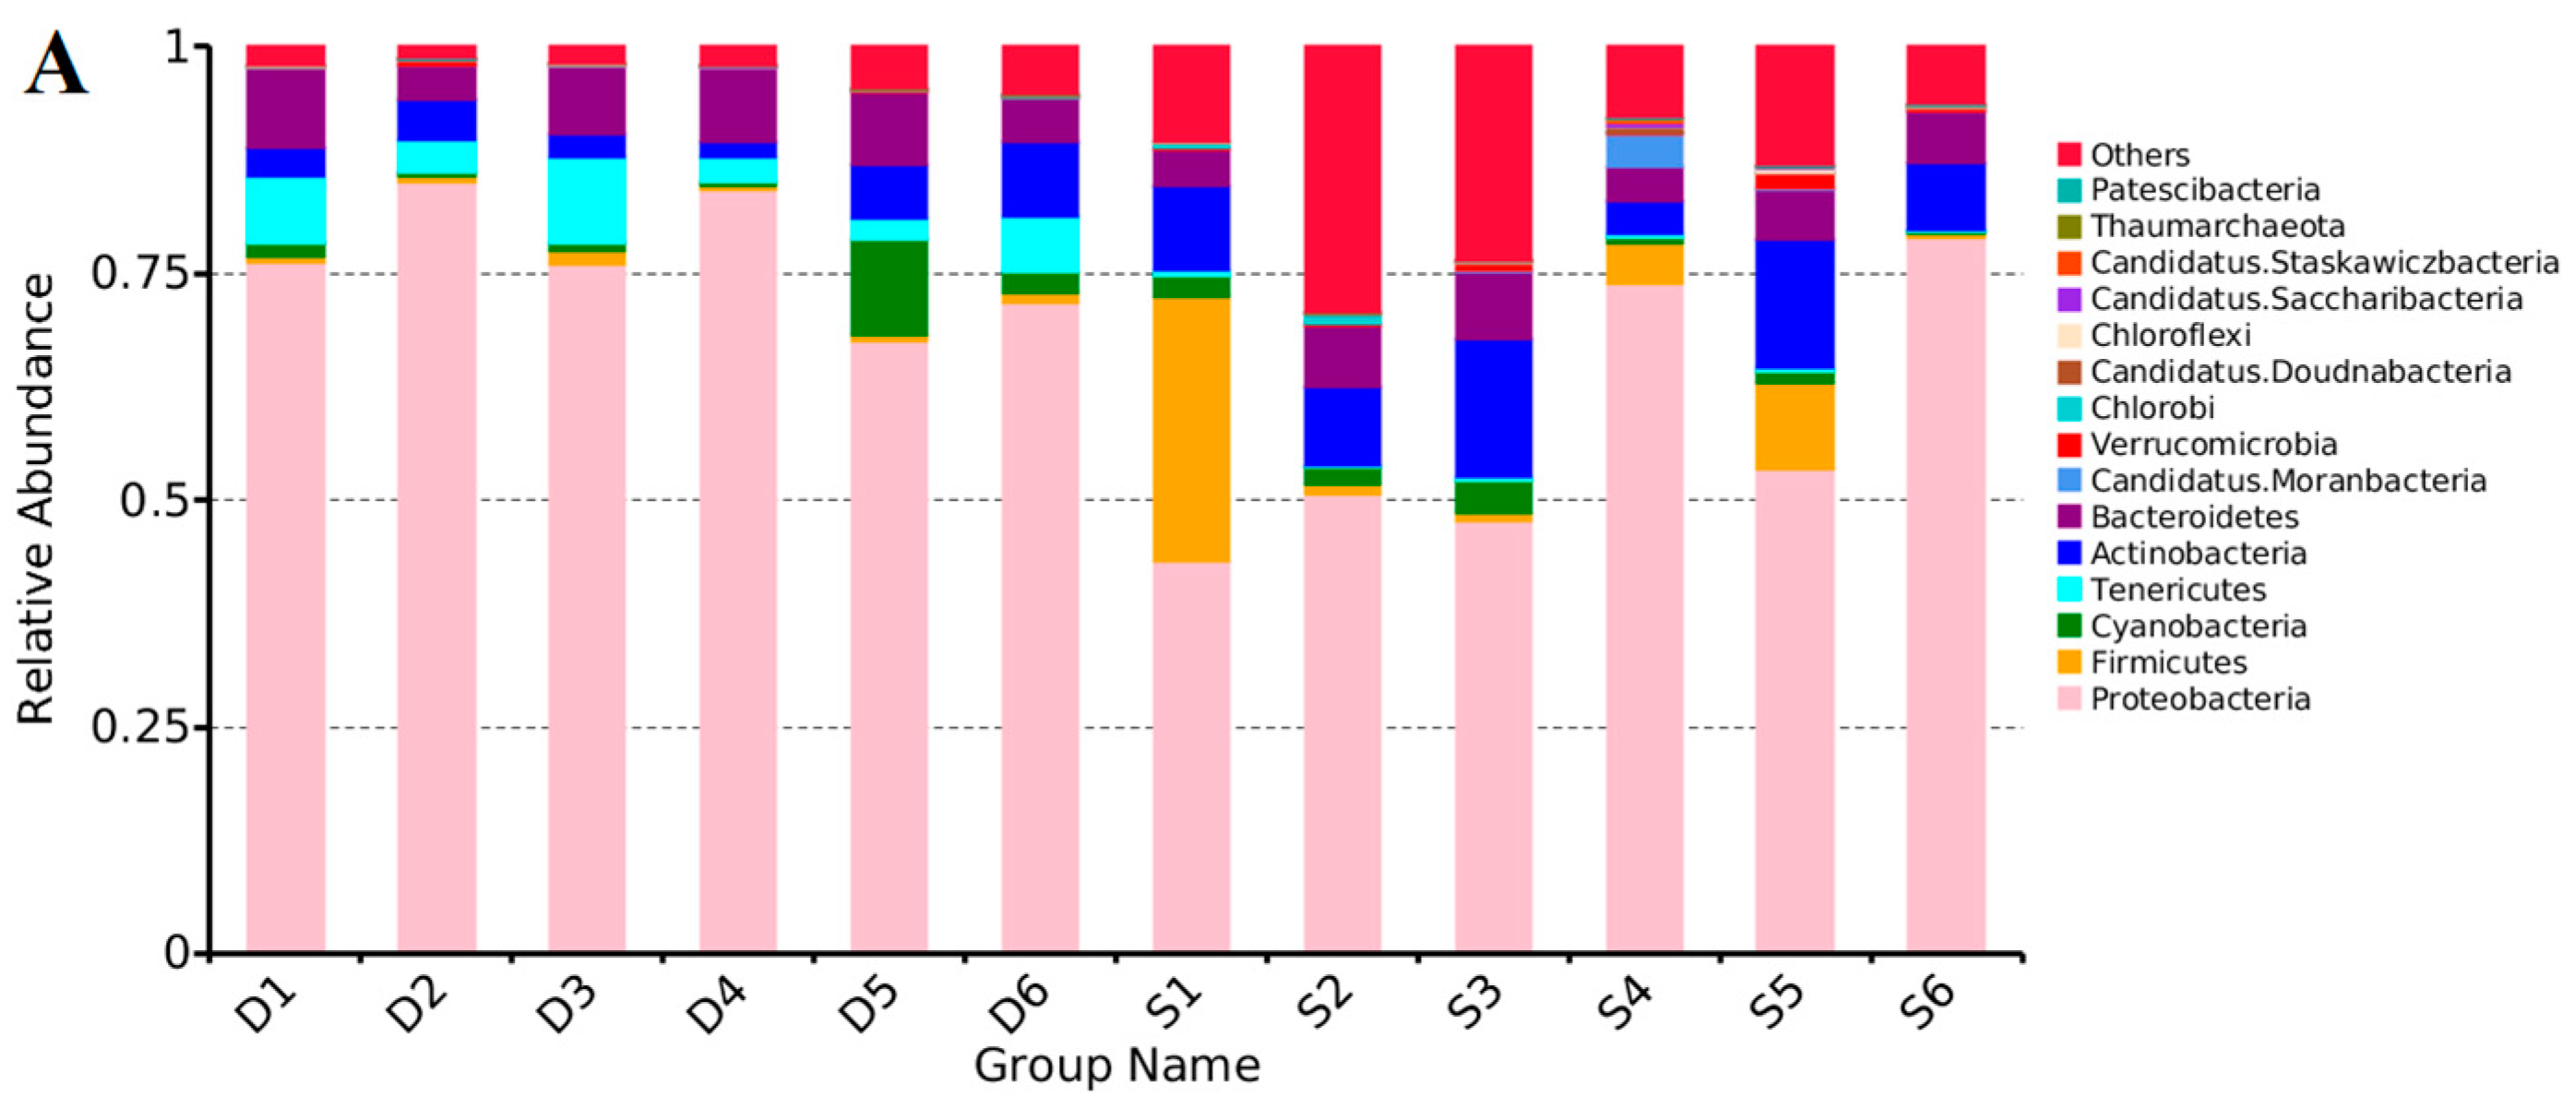
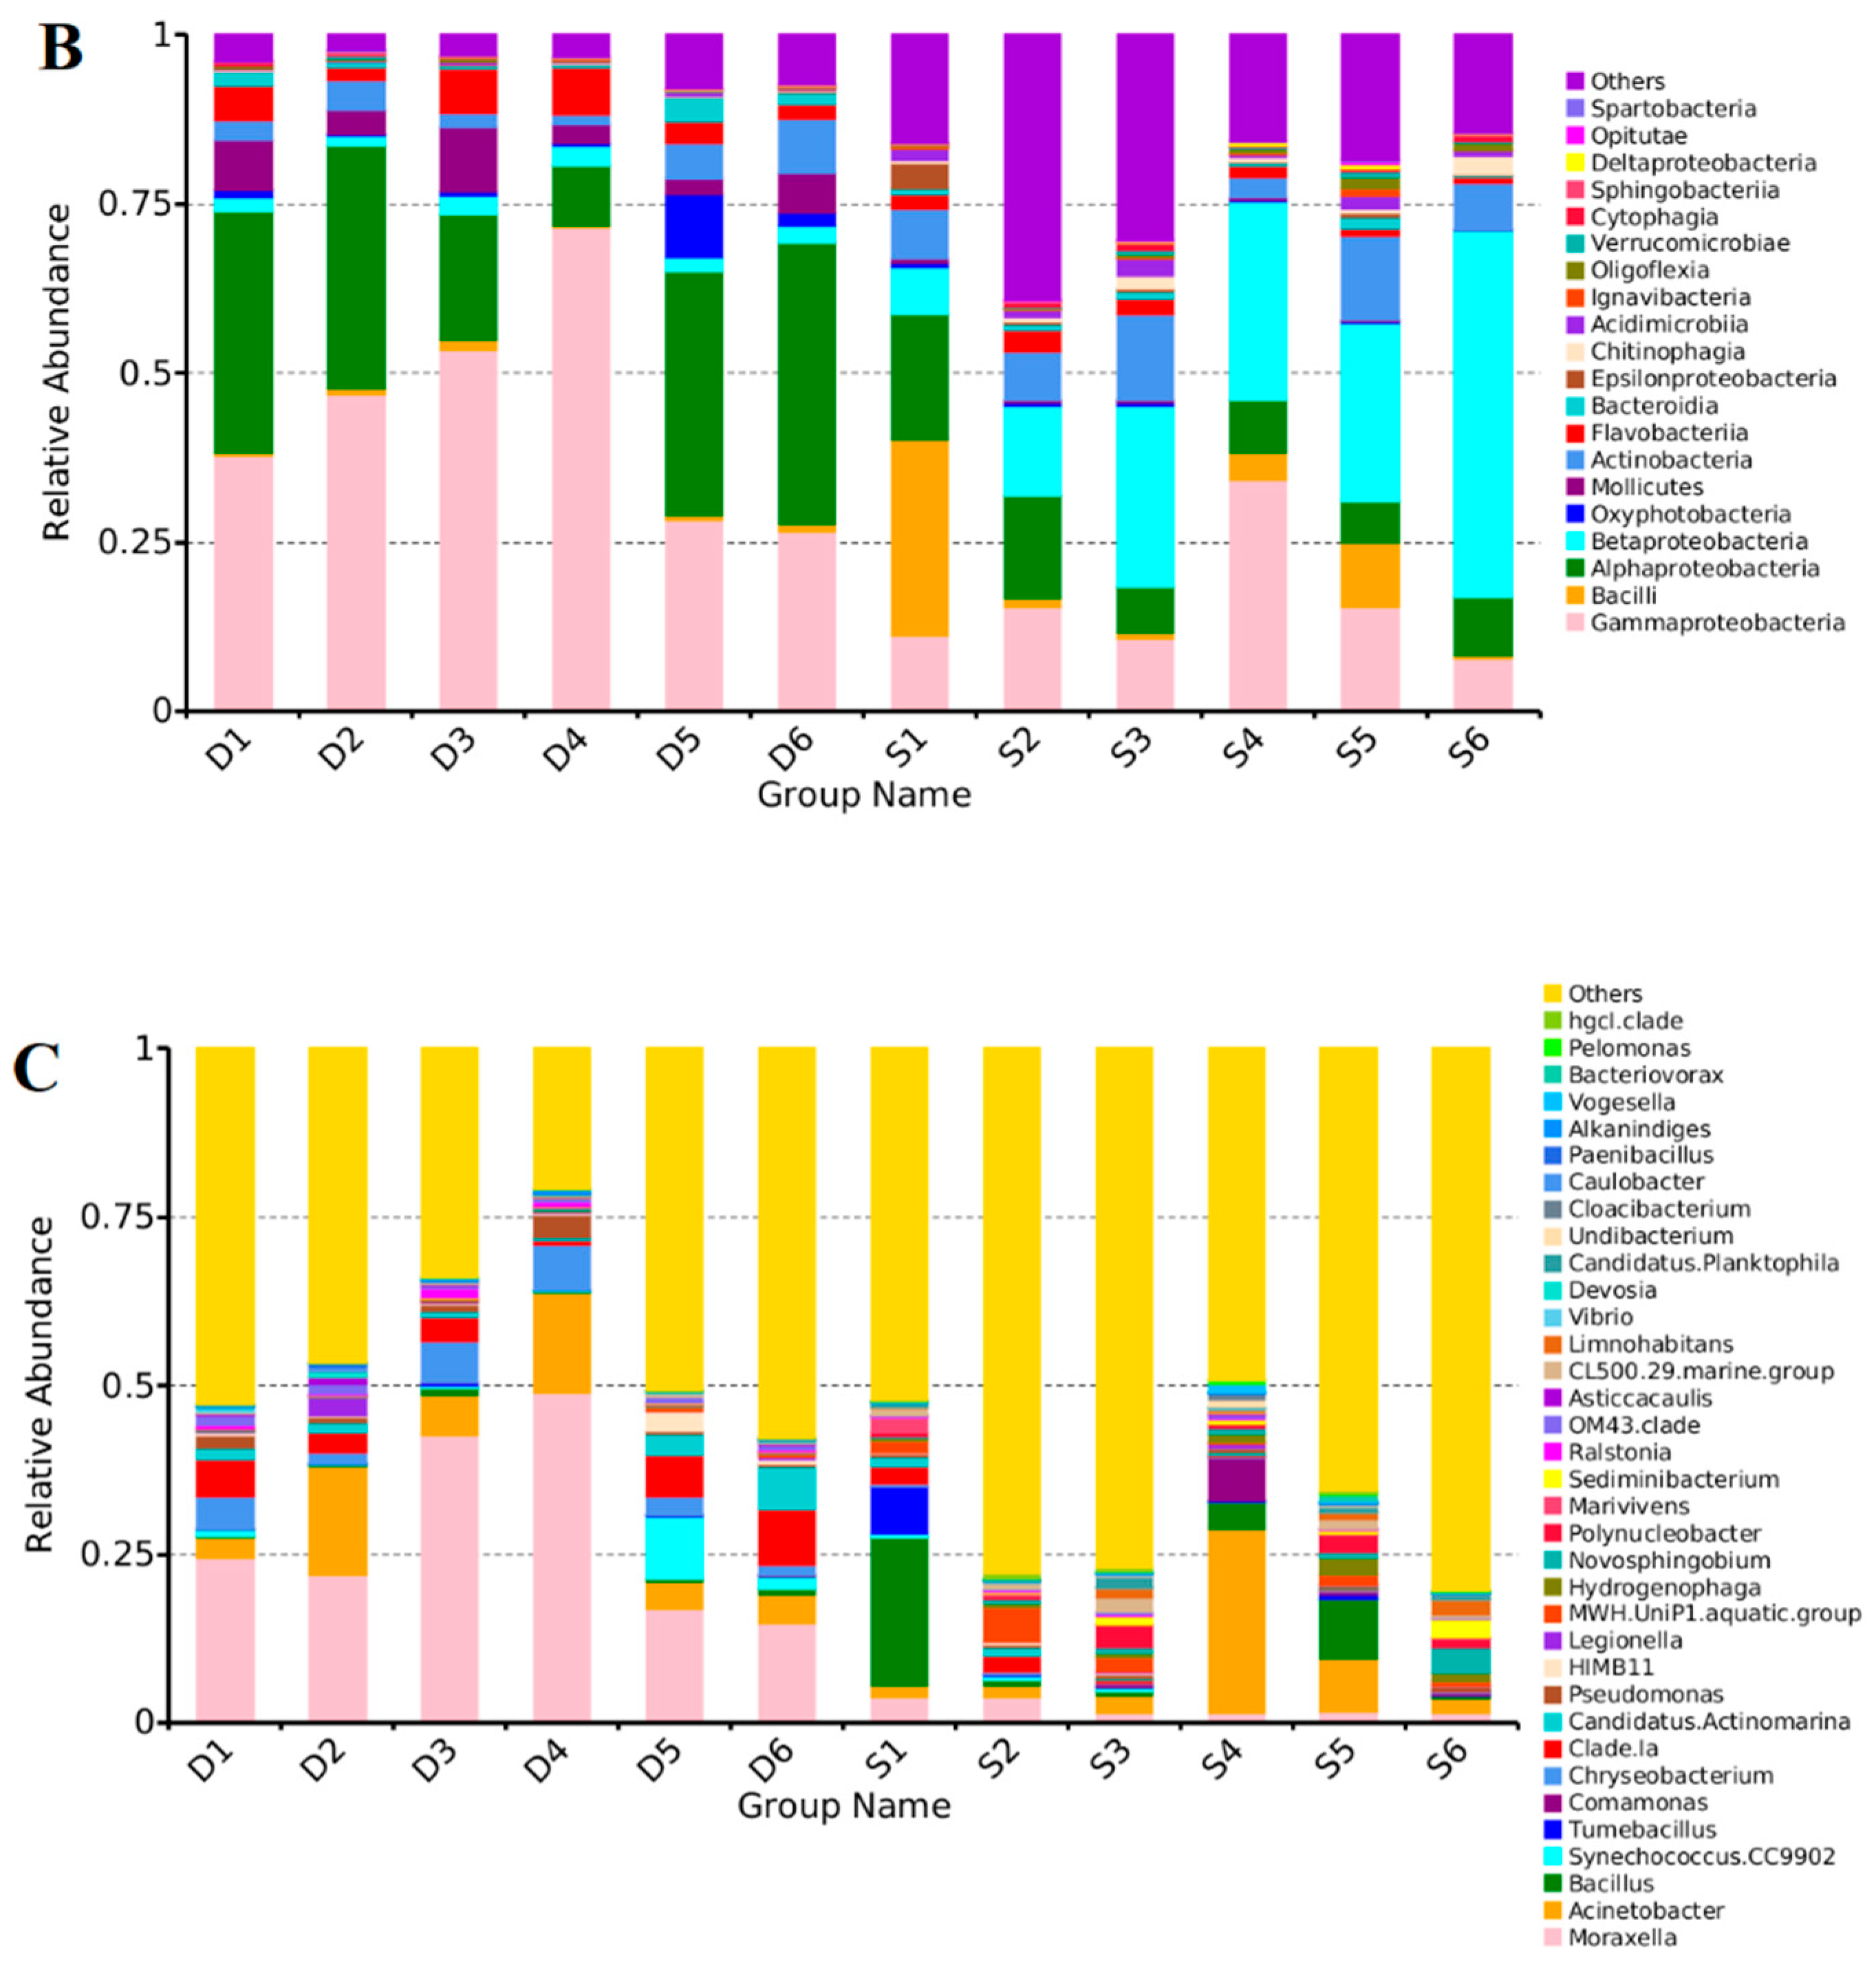
A total of 69 phyla were identified in the samples. Proteobacteria was the most abundant in all samples, accounting for 43.3–84.0% of the total bacterial community (Figure 2). Other dominant phyla were Firmicutes (0.2–29.1%), Cyanobacteria (0.3–10.4%), Tenericutes (0.1–9.5%), and Actinobacteria (1.7–15.3%). Specifically, the highest relative abundance of Firmicutes and Cyanobacteria were found in Site S1 and D5, respectively. The relative abundance of Proteobacteria and Tenericutes was significantly higher in coastal area D than in S (Metastats test, p = 0.002 and p < 0.001, respectively). However, the relative proportions of Firmicutes and Actinobacteria in coastal area D were significantly lower than S (Metastats test, p = 0.005 and p < 0.001, respectively). The proportions of Cyanobacteria in both coastal areas showed no significant difference (Metastats test, p = 0.90). These suggest that the variation in the dominant phyla was more significant across sites rather than coastal areas.
At the class level, Gammaproteobacteria (7.9–71.6%), Alphaproteobacteria (6.1–41.6%), Betaproteobacteria (1.5–54.2%), and Bacilli (0.2–29.0%) were dominant clades (Figure 2). More pronounced fluctuations in bacterial community composition were observed at the class level. The most abundant class in coastal areas D and S were Gammaproteobacteria and Betaproteobacteria, respectively. In particular, the relative abundance of Gammaproteobacteria and Alphaproteobacteria in coastal area D was significantly higher than in coastal area S (Metastats test, p = 0.001 and p = 0.002, respectively). In comparison, the relative abundance of Betaproteobacteria and Bacilli were higher in coastal area S (Metastats test, p = 0.001 and p = 0.008, respectively).
At the genus level, the top 5 genera were Moraxella, Acinetobacter, Bacillus, Synechococcus CC9902, and Tumebacillus (Figure 2). The relative abundances of most genera were significantly different between coastal areas. In contrast, few variations were observed between sampling sites. For Coastal area D, Moraxella was the most abundant genus in all the six sites (14.8–49.1%). Specifically, site D5 showed the highest relative abundance of Synechococcus.CC9902 (9.3%). For coastal area S, the dominant genera differed greatly across the sites. The most abundant genera at site S1 and site S4 were Bacillus (22.0%) and Acinetobacter (27.2%), respectively. Seventeen genera showed a significant difference between coastal areas D and S (Table S3). The relative abundances of Moraxella, Synechococcus CC9902, and Chryseobacterium in coastal area D were significantly higher than in coastal area S, while coastal area S had a higher abundance of Bacillus and Comamonas (Table S3).
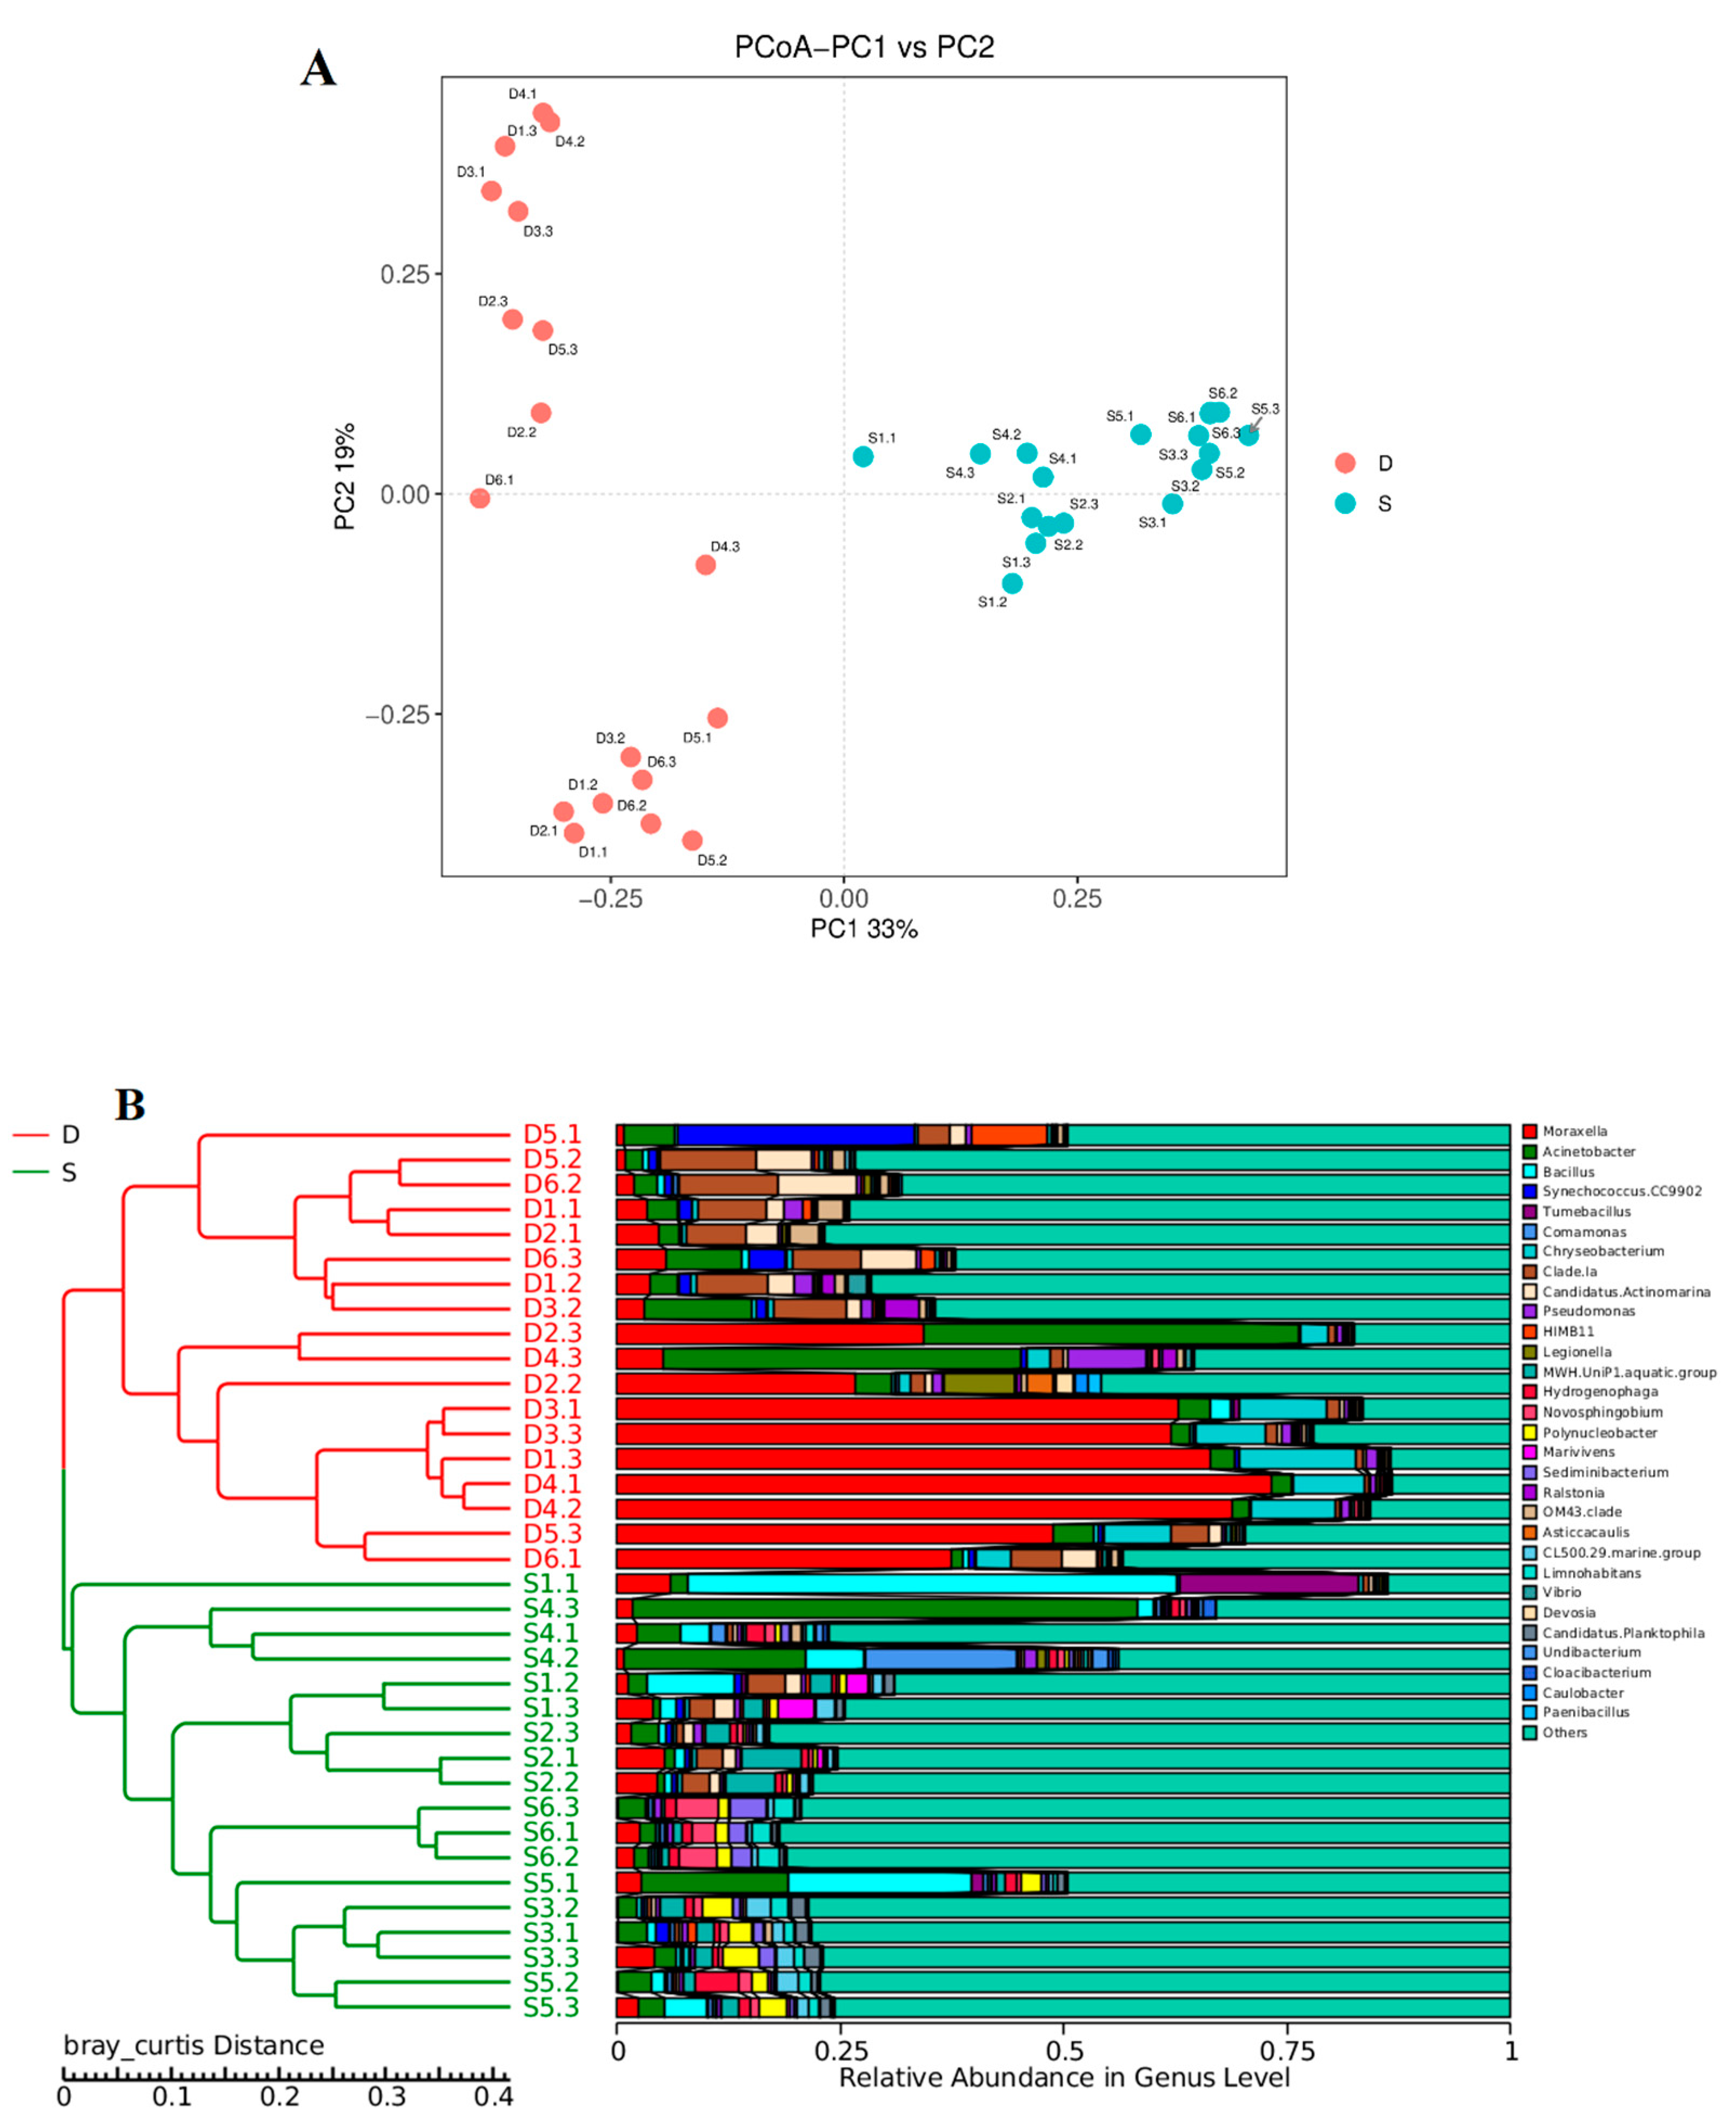
Principal coordinates analysis (PCoA) (Figure 3) shows that the samples from coastal area S were clustered together but separated from samples of coastal area D, indicating a significant difference between the community compositions of the two coastal areas. This was further confirmed by the ANOSIM analysis (Table 2). Furthermore, ANOISM analysis showed that for coastal area D, the variation of the community compositions between sites was not significant (Table 2). However, the PCoA plot clearly showed the difference within the sites. For example, sample D4.3 was separated from samples D4.1 and D4.2, suggesting a high variability of community composition within site D4. The relative abundance of Moraxella may be one factor behind this separation (Figure 3). The community difference within the sites might be caused by the tidal effect when sampling. For coastal area S, a significant difference was found in the community compositions between the sites (Table 2). In addition, the UPGMA clustering dendrogram supported the result of the PCoA analysis by revealing the distinctiveness of bacterial communities in coastal areas D and S. In the UPGMA tree, samples from different coastal areas clustered separately. Most samples from coastal area S were separated by sites. However, those collected from coastal area D also clustered together (Figure 3).

3.4. Correlations between the Microbial Communities and Water Quality

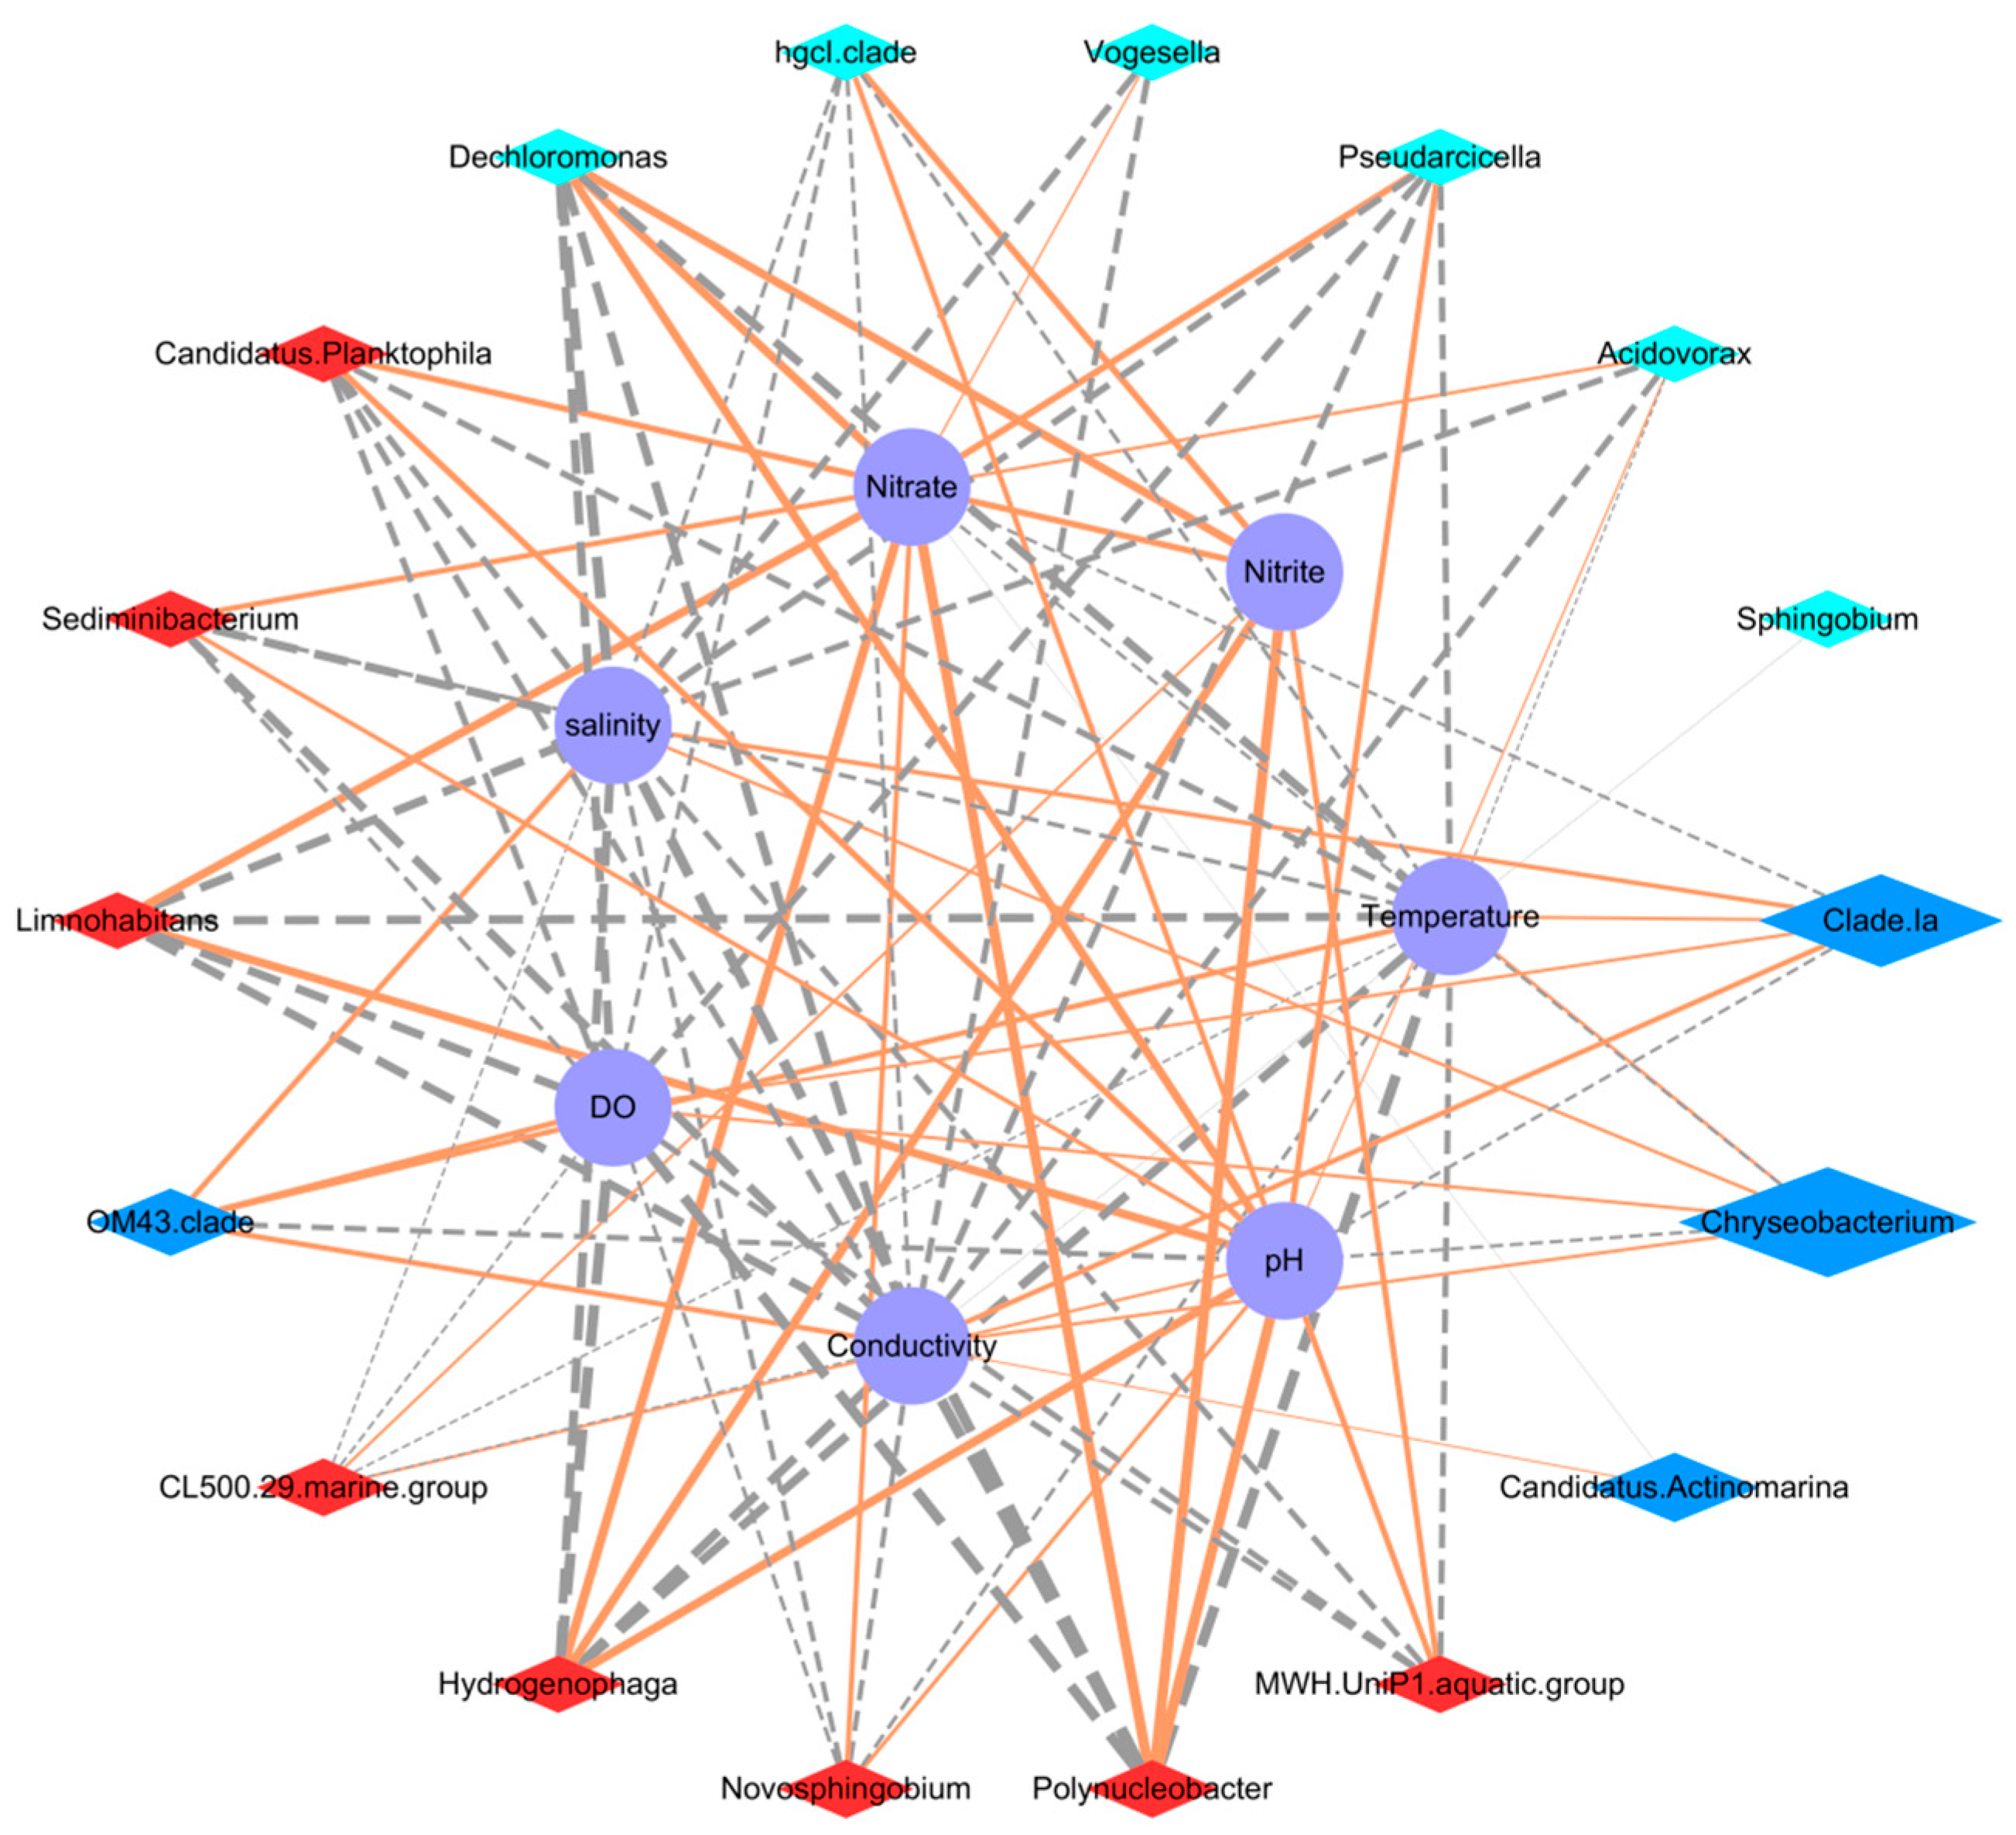
Results of the mantel test showed that most of these environmental factors significantly influenced the community composition (Table 3). Furthermore, both physicochemical factors (pH, conductivity, DO, temperature, and salinity) and nutrients (ammonium, nitrite, nitrate, and phosphate) significantly influenced the community composition (Table 3). VPA analyses suggested that physicochemical factors explained 6.2% of microbial community differences, while nutrients explained 0.4%. They combined explained 32.8% of the difference (Figure S3). The correlations between the alpha diversity index/relative abundances of specific phyla and environmental factors were further examined using the Pearson correlation test. Pearson correlation tests showed that all the alpha diversity indices (Shannon, chao1, observes species, and PD whole tree) showed positive correlations with pH, nitrite, and nitrate concentration, while negative correlations with temperature, conductivity, DO, and salinity (Table S4). In coastal area S, negative correlations between salinity/conductivity and chao1, observes species, and PD whole tree were also observed (Pearson correlation test, p = 0.01, p < 0.01 and p < 0.01, respectively). In contrast, a positive correlation between nitrate and observes species and PD whole tree was found (Pearson correlation test, p = 0.04 and p < 0.01, respectively). In coastal area D, significant negative correlations were found between conductivity and Shannon and observed species (Pearson correlation test, p = 0.01 and p = 0.01, respectively). At the phylum level, the relative abundance of Proteobacteria and Tenericutes was positively correlated with temperature, conductivity, DO, and salinity, while negatively correlated with pH (Table S4). The correlations between Actinobacteria and these environmental factors were also significant, while it showed the opposite pattern with Proteobacteria and Tenericutes (Table S4). In coastal area S, significant correlations between Proteobacteria and pH, salinity/conductivity, and nitrate were also found (Pearson correlation test, p < 0.01, p = 0.02 and p < 0.01, respectively), while a positive correlation between pH and Actinobacteria was found (Pearson correlation test, p < 0.01). In coastal area D, the relative abundance of Proteobacteria and Cyanobacteria were significantly correlated with conductivity and nitrite (Pearson correlation test, p = 0.01 and p = 0.01, respectively). Tenericutes showed a negative correlation with nitrate concentration (Pearson correlation test, p = 0.01 and p = 0.01, respectively). Network analysis was conducted between the top 35 genera and environmental variables to further confirm how strongly environmental variable variation affected microbial community variation (Figure 4). Network analysis identified 119 links between genus and environmental variables. The most well-connected variables were salinity, conductivity, temperature, and pH (20 genera) (Table 4). Overall, these results suggest that salinity/conductivity, pH, and nitrate concentration were the key factors that contributed to the difference in bacterial community compositions.

3.5. Functional Predictions of Bacterial Communities

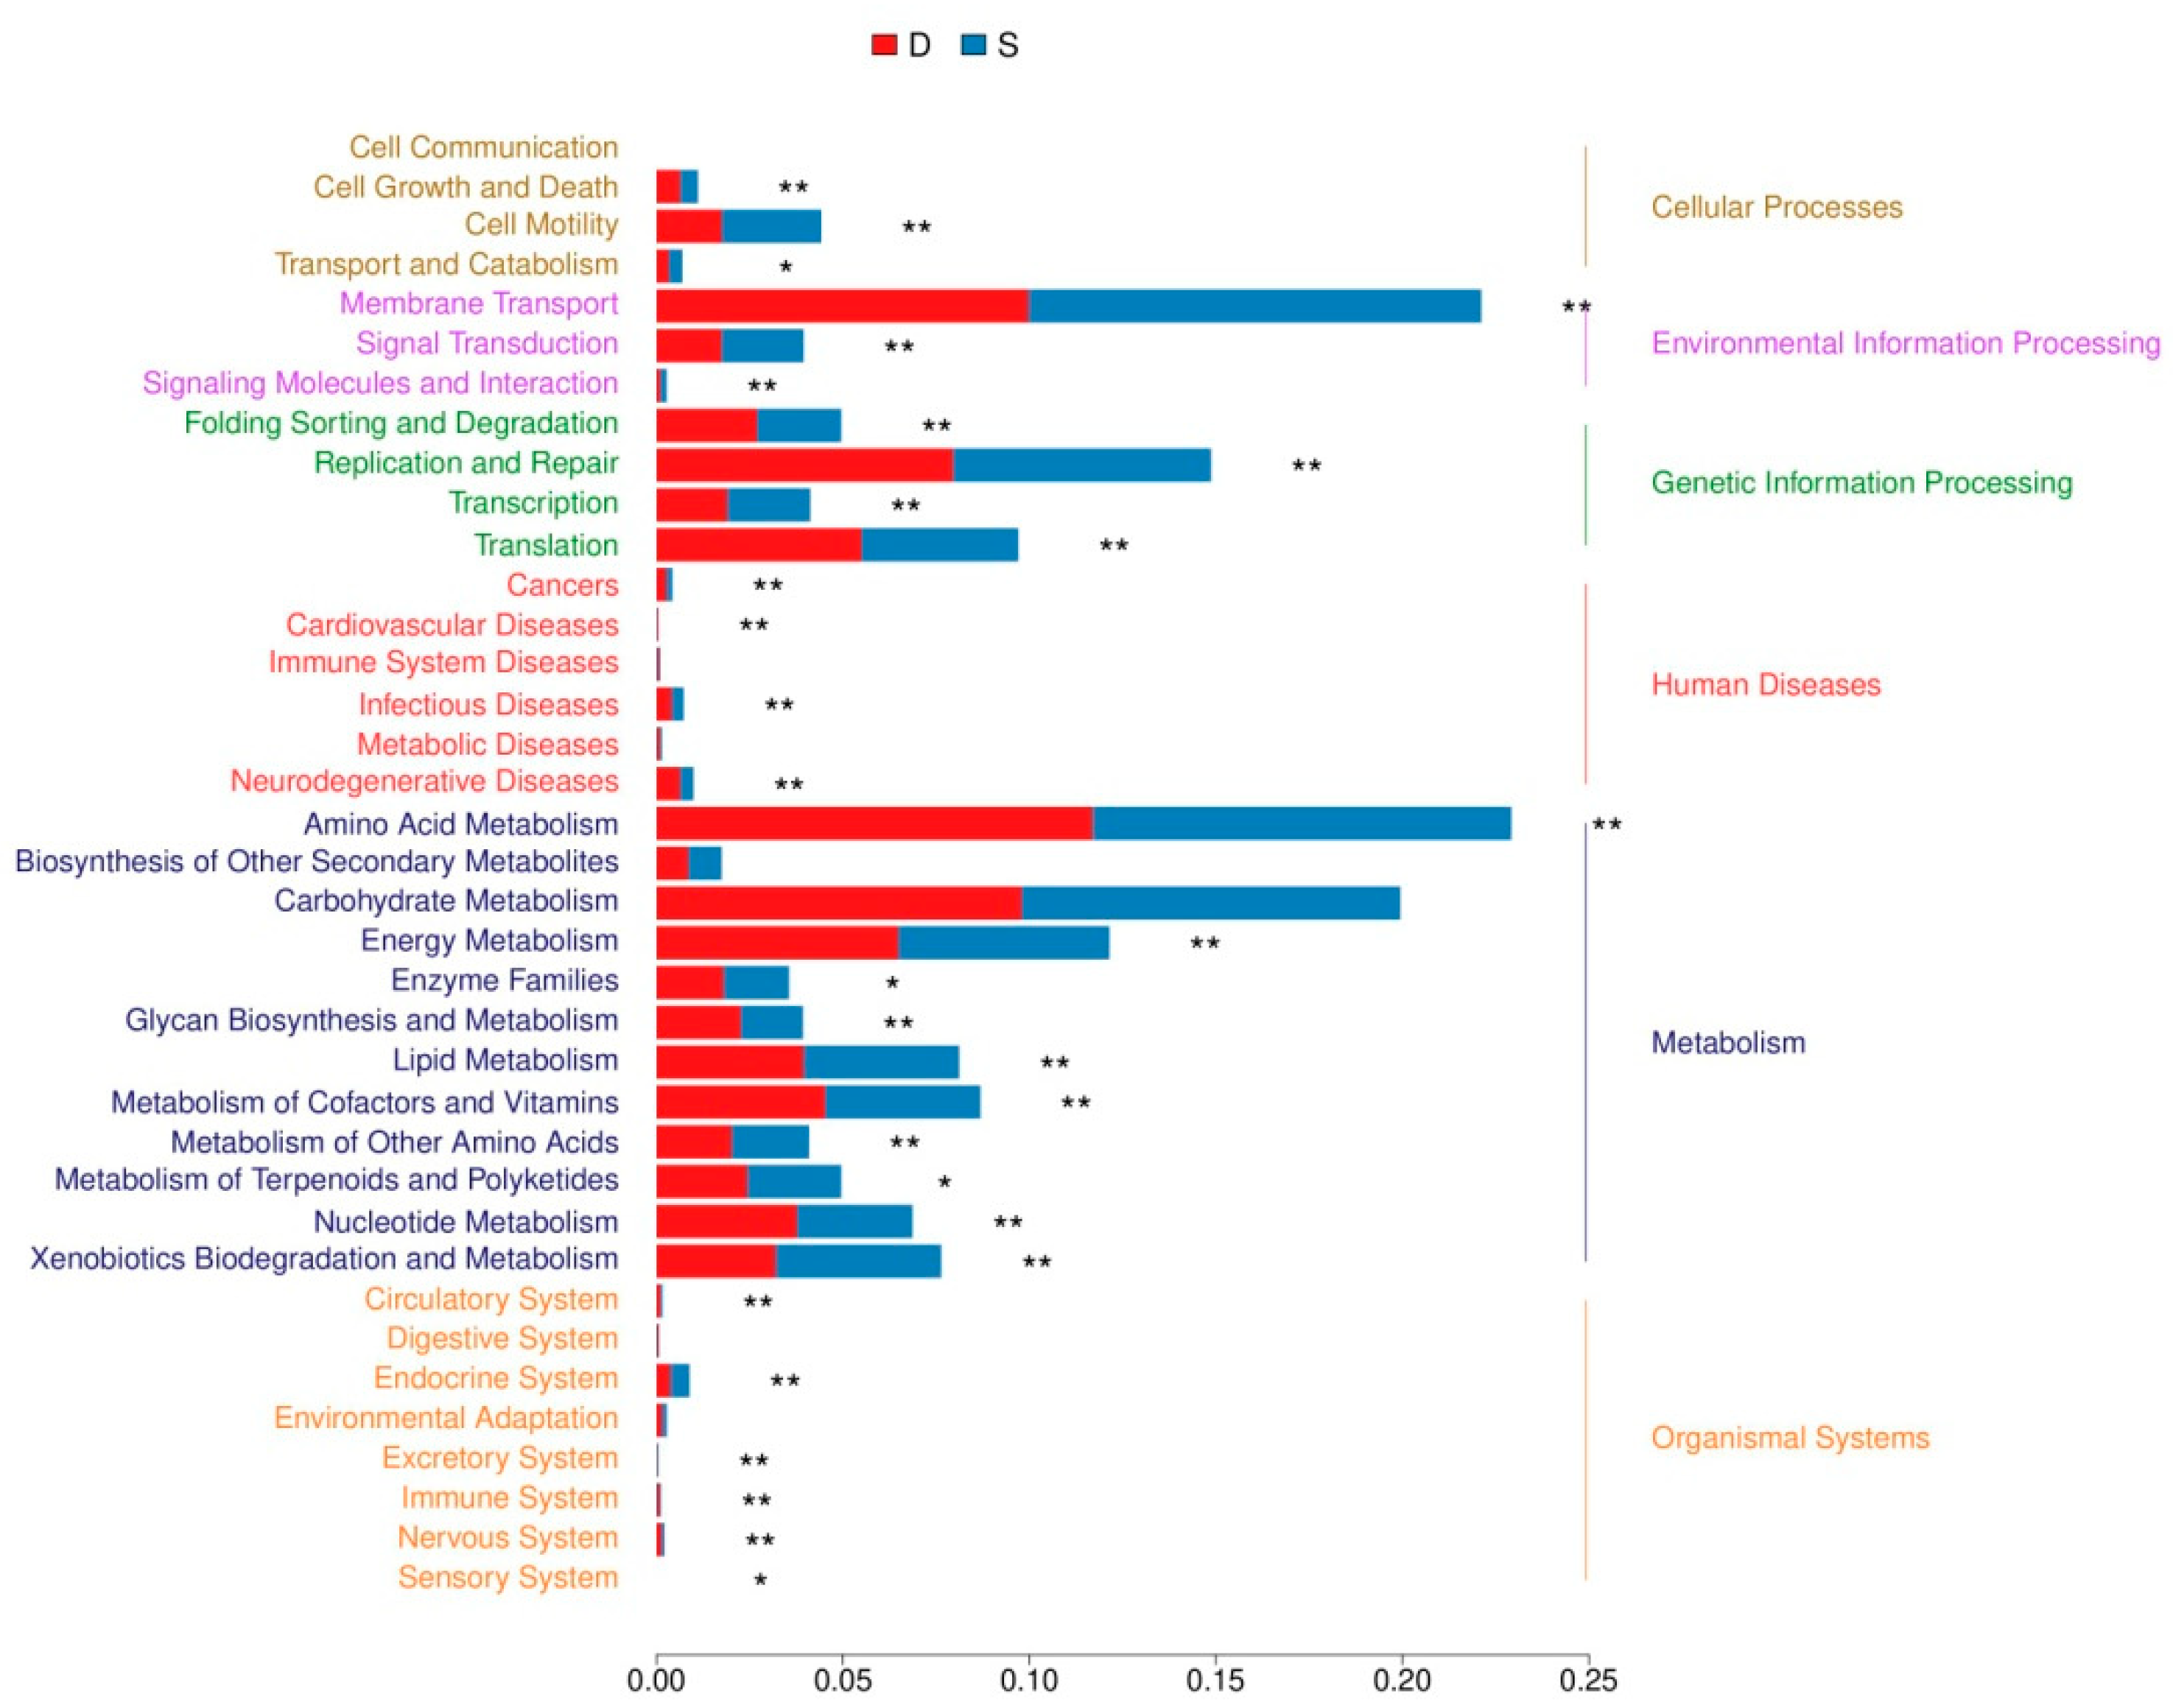
PICRUSt was carried out to predict the functional pathways of the samples. 41 KEGG pathways were found at level 2, of which 328 functional pathways were included at level 3. Figure 5 shows the relative abundance of the KEGG pathway function. The pathways with relatively high abundance include amino acid metabolism, membrane transport, carbohydrate metabolism, replication and repair, and energy metabolism. The proportions of predicted carbohydrate metabolism, membrane transport, and xenobiotics biodegradation/metabolism pathways were significantly higher in coastal area S. In contrast, coastal area D owns higher proportions of pathways related to energy metabolism, replication and repair, and cell growth and death (Figure 5 and Table S5). At level 3, KEGG pathways related to transporters have the highest relative abundance in both coastal areas, representing 4.6% and 5.9% in coastal areas D and S, respectively (Figure S3). Pathways related to carbon fixation pathways in prokaryotes and methane metabolism were 1.2% and 1.1%, 0.95 and 0.94% in coastal areas D and S, respectively.

4. Discussion

The average pH value in coastal area D was 7.18 ± 0.01, significantly lower than in coastal area S (8.31 ± 0.76, Table 1 and S1). Most frequently, the pH of the open surface ocean remains stable between 8.0 and 8.5. The decrease in pH is likely caused by anthropogenic influence [36]. Compared with coastal area S, coastal area D had significantly higher conductivity, salinity, and DO concentration (Table S1). The relatively lower salinity in coastal area S is subject to freshwater inputs from the Shenzhen River. The average concentrations of DIN (1.26 ± 0.10 and 2.19 ± 0.19 mg/L) and PO43−_P (0.147 ± 0.059 and 0.055 ± 0.006 mg/L) in both coastal areas exceeded the Chinese Sea Water Quality Standards (GB 3097-1997) of category IV (i.e., DIN and P should be less than 0.5 and 0.045 mg/L, respectively), thus were regarded as severely contaminated areas. The high nutrient concentrations observed in coastal area S suggested the effects of anthropogenic activities. These findings are consistent with the former studies of Shenzhen Bay, which has been regarded as a highly eutrophic area [19,37]. The previous report also suggests more severe water eutrophication and pollution on the west coast than on the eastern coast [22]. The western coast is highly urbanized and is developing rapidly, so it is more likely to be influenced by human activities [22]. However, recent increases in aquaculture activities, permanent human populations, and tourism have also brought profound ecological pressure on Dapeng Bay [21].
The bacterial community richness and diversity in coastal area S were significantly higher than in coastal area D (Figure 1), indicating a more complex community composition in coastal area S. Proteobacteria showed the highest relative abundance in all the samples. This observation is in concurrence with various reports from coastal waters [8,11,22]. The relative abundance of Proteobacteria and Tenericutes was significantly higher in coastal area D than in S (p = 0.002 and p < 0.001, respectively). However, the relative proportions of Firmicutes and Actinobacteria in coastal area D were significantly lower than in coastal area S. Proteobacteria, Firmicutes, and Cyanobacteria are essential players in nitrogen fixation in the surface ocean [38]. Actinobacteria have been found to play important roles in biological phosphorus removal systems [39]. Firmicutes degrade various environmental substrates and are involved in denitrification [39]. The higher nutrient concentration (DIN and phosphate) in coastal area S thus supports the growths of Actinobacteria and Firmicutes. Tenericutes may potentially emerge as pathogens, and the presence of Tenericutes in marine samples may be spreading through sewage [40,41]. The high abundance of Tenericutes in coastal area D suggests the potential pathogenicity of the samples, which may pose threats to human health.
Under the phylum of Proteobacteria, the relative abundance of Gammaproteobacteria and Alphaproteobacteria in coastal area D was significantly higher than in coastal area S (p = 0.001 and p = 0.002, respectively). In contrast, the relative abundance of Betaproteobacteria and Bacilli were higher at coastal area S (p = 0.001 and p = 0.008, respectively). Alphaproteobacteria and Gammaproteobacteria are usually reported as the dominant classes in ocean waters, and they can degrade different organic compounds [8]. In anthropogenically disturbed regions, a higher abundance of Gammaproteobacteria could be detected [42]. It is reported that nitrate enrichment could inhibit the growth of Gammaproteobacteria [17,38]. However, the Betaproteobacteria exhibited a negative correlation with salinity and a positive correlation with nitrite [38,43]. The low salinity and high DIN concentration at coastal area S might be favorable for the growth of Betaproteobacteria. The relative abundance of Bacilli belonging to Firmicutes phylum was also higher in coastal area S. Bacilli was reported to dominate in many seriously polluted areas, and it can resist adverse impacts by producing a dormancy body in harsh environments [44,45]. These results further suggest a higher degree of pollution in coastal area S. Aquatic environments with varying environmental characteristics support different bacterial communities and diversity.
The dominant genera in coastal areas D and S were Moraxella and Acinetobacter, respectively. They belong to the Moraxellaceae family, a wastewater-related microorganism [46]. Acinetobacter was also found to dominate in the seawater near the industrial area of Qingdao [47]. Moraxella was tolerant to salinity as a halotolerant and halophilic bacteria [48]. The high salinity in coastal area D thus supports the growth of Moraxella. As the samples of coastal area D were collected in the tourism area, the domestic and sanitary sewages may be the main sources of Moraxella. The relative abundances of Moraxella, Synechococcus.CC9902 and Chryseobacterium in coastal area D were significantly higher than in coastal area S, while coastal area S had a higher abundance of Bacillus and Comamonas (Table S3). Synechococcus is one of the most abundant primary producers on earth and contributes to phytoplankton carbon fixation; it exhibited a significantly strong negative correlation with nutrients [42,49]. The previous study also showed a higher relative abundance of Synechococcus on the eastern coast of Shenzhen than the western coast [23]. Bacillus can carry out denitrification and is usually found dominating in WWTPs [50,51]. A higher abundance of Bacillus in coastal area S suggests that these sites were heavily affected by the surrounding municipal and industrial wastewater [11].
The Mantel test and VPA showed that physicochemical factors had a more significant effect on bacterial composition than nutrients (Table 3, Figure S2). The Pearson correlation test confirmed that bacterial richness and diversity were significantly correlated with salinity, conductivity and nitrate concentration (Table S4). Furthermore, the relative abundance of Proteobacteria and Tenericutes was positively correlated with conductivity and salinity, while negatively correlated with pH (Table S4). In contrast, Actinobacteria showed the opposite pattern (Table S4). Network analyses between the top 35 genera and environmental variables also confirmed that the most well-connected variables were salinity, conductivity, pH, and nitrate. This finding was consistent with other studies showing that the physicochemical index contributed more significantly to the variation of bacterial communities in coastal waters [11]. Previous studies have identified the important role of these factors in shaping the microbial community in marine waters [42]. It has been reported that temperature, salinity, and nutrient concentrations are environmental factors responsible for bacterial community composition changes in coastal areas [11,52]. Overall, our results suggest that salinity/conductivity, pH, and nitrate concentration were the key factors that drove the bacterial community compositions in the studied area. However, the temporal effects may also contribute to part of the differences between the bays. Based on 16S rRNA sequencing, the current study analyzed the bacterial community compositions, predicted functional pathways of two typical coastal bay areas with different pollution levels, and found the key environmental factors that drive the community difference. However, it has limitations as some environmental factors were not considered. Meanwhile, functional pathway prediction based on 16S rRNA sequencing was not deep enough to fully explore the bacterial community functions. Future work could be conducted on metagenomic sequencing of the total DNA of these coastal areas, covering more sampling sites with different times or seasons. Furthermore, more environmental factors should be considered when analyzing the response of microbial communities to environmental changes.

5. Conclusions

In conclusion, we investigated the bacterial community composition and diversity in two typical urbanized coastal bay areas that experienced different pollution levels. Coastal area S experienced a higher level of nutrient pollution, with significantly higher bacterial community richness and diversity observed. The bacterial community compositions of coastal areas S and D differed significantly. A significant community difference was also found between the sampling sites in coastal area S. However, the difference between sampling sites in coastal area D was not significant. Salinity/conductivity, pH, and nitrate concentration were the major environmental drivers of the bacterial community compositions in the studied area. The proportions of predicted carbohydrate metabolism, membrane transport, and xenobiotics biodegradation/metabolism pathways were significantly higher in coastal area S. The results of this study will help us understand the relationship between bacteria composition and their surroundings, and provide valuable baseline information for environmental monitoring in these habitats. Moreover, to better understand these coastal bay areas, future studies could be conducted based on metagenomic sequencing covering more samples spatially and temporally.

Supplementary Materials

The following supporting information can be downloaded at: https://www.mdpi.com/article/10.3390/jmse10121878/s1.

Author Contributions

Conceptualization, L.O. and S.L.; Formal analysis, L.O. and X.C.; Funding acquisition, S.L. (Shuangfei Li) and S.L. (Shaofeng Li); Investigation, X.C., W.Z. and C.Y.; Methodology, X.C. and W.Z.; Supervision, S.L.; Writing—original draft, L.O.; Writing—review and editing, Q.H. and Y.Z. All authors have read and agreed to the published version of the manuscript.

Funding

This work was supported by the Scientific Research Startup Fund for Shenzhen High-Caliber Personnel of SZPT (No. 6022310040K), Post-doctoral Later-stage Foundation Project of Shenzhen Polytechnic (6021271015K1), Shenzhen Sustainable Development Science and Technology Project (KCXFZ20201221173203010 and KCXFZ20201221173404012), Characteristic innovation project of Guangdong Universities (2020KTSCX296), and the Young Talents Innovation Project from Education Department of Guangdong Province (2019GKQNCX124).

Institutional Review Board Statement

Not applicable.

Informed Consent Statement

Not applicable.

Data Availability Statement

The raw sequences were submitted to NCBI SAR database (Accession: PRJNA894299). Other data are available from the corresponding author on reasonable request.

Conflicts of Interest

The authors declare no conflict of interest. The funders had no role in the design of the study, in the collection, analyses, or interpretation of data, in the writing of the manuscript, or in the decision to publish the results.

References

  1. Zhang, Q.Y.; Ren, F.T.; Xiong, X.Y.; Gao, H.J.; Wang, Y.D.; Sun, W.J.; Leng, P.F.; Li, Z.; Bai, Y.W. Spatial distribution and contamination assessment of heavy metal pollution of sediments in coastal reclamation areas: A case study in Shenzhen Bay, China. Environ. Sci. Eur. 2021, 33, 90. [Google Scholar] [CrossRef]
  2. Howarth, R.; Chan, F.; Conley, D.J.; Garnier, J.; Doney, S.C.; Marino, R.; Billen, G. Coupled biogeochemical cycles: Eutrophication and hypoxia in temperate estuaries and coastal marine ecosystems. Front. Ecol. Environ. 2011, 9, 18–26. [Google Scholar] [CrossRef] [Green Version]
  3. Galloway, J.N.; Townsend, A.R.; Erisman, J.W.; Bekunda, M.; Cai, Z.; Freney, J.R.; Martinelli, L.A.; Seitzinger, S.P.; Sutton, M.A. Transformation of the nitrogen cycle: Recent trends, questions, and potential solutions. Science 2008, 320, 889–892. [Google Scholar] [CrossRef] [PubMed] [Green Version]
  4. Genitsaris, S.; Stefanidou, N.; Sommer, U.; Moustaka-Gouni, M. Phytoplankton Blooms, Red Tides and Mucilaginous Aggregates in the Urban Thessaloniki Bay, Eastern Mediterranean. Divers. Basel 2019, 11, 136. [Google Scholar] [CrossRef] [Green Version]
  5. Madsen, E.L. Microorganisms and their roles in fundamental biogeochemical cycles. Curr. Opin. Biotechnol. 2011, 22, 456–464. [Google Scholar] [CrossRef] [PubMed]
  6. Panayotova, M. Use of zeolite for cadmium removal from wastewater. J. Environ. Sci. Health Part A-Toxic/Hazard. Subst. Environ. Eng. 2000, 35, 1591–1601. [Google Scholar] [CrossRef]
  7. Lemonnier, C.; Perennou, M.; Eveillard, D.; Fernandez-Guerra, A.; Leynaert, A.; Marie, L.; Morrison, H.G.; Memery, L.; Paillard, C.; Maignien, L. Linking Spatial and Temporal Dynamic of Bacterioplankton Communities With Ecological Strategies Across a Coastal Frontal Area. Fron. Mar. Sci. 2020, 7, 376. [Google Scholar] [CrossRef]
  8. Jasna, V.; Nathan, V.K.; Parvathi, A. Comparison of bacterial community structure in coastal and offshore waters of the Bay of Bengal, India. Reg. Stud. Mar. Sci. 2020, 39, 101414. [Google Scholar] [CrossRef]
  9. Sodha, V.; Shahabuddin, S.; Gaur, R.; Ahmad, I.; Bandyopadhyay, R.; Sridewi, N. Comprehensive Review on Zeolite-Based Nanocomposites for Treatment of Effluents from Wastewater. Nanomaterials 2022, 12, 3199. [Google Scholar] [CrossRef]
  10. Zhao, W.; Wang, J.J.; Xu, S.; Lei, Y.; Yang, R.; Shi, L.Y.; Wang, X.B.; Huang, Z.Y. Bacterioplankton community variation in Bohai Bay (China) is explained by joint effects of environmental and spatial factors. Microbiologyopen 2020, 9, e997. [Google Scholar] [CrossRef]
  11. Wang, Y.; Liu, Y.T.; Wang, J.N.; Luo, T.W.; Zhang, R.; Sun, J.; Zheng, Q.; Jiao, N.Z. Seasonal dynamics of bacterial communities in the surface seawater around subtropical Xiamen Island, China, as determined by 16S rRNA gene profiling. Mar. Pollut. Bull. 2019, 142, 135–144. [Google Scholar] [CrossRef] [PubMed]
  12. Almutairi, A. Spatial-temporal variations and diversity of the bacterioplankton communities in the coastal waters of Kuwait. Mar. Pollut. Bull. 2015, 100, 699–709. [Google Scholar] [CrossRef] [PubMed]
  13. Tang, H.; Xu, X.Y.; Wang, B.; Lv, C.P.; Shi, D.Z. Removal of Ammonium from Swine Wastewater Using Synthesized Zeolite from Fly Ash. Sustainability 2020, 12, 3423. [Google Scholar] [CrossRef] [Green Version]
  14. Sreesai, S.; Sthiannopkao, S. Utilization of zeolite industrial wastewater for removal of copper and zinc from copper-brass pipe industrial wastewater. Can. J. Civ. Eng. 2009, 36, 709–719. [Google Scholar] [CrossRef]
  15. Sun, F.L.; Wang, Y.S.; Wu, M.L.; Sun, C.C.; Cheng, H. Spatial and vertical distribution of bacterial community in the northern South China Sea. Ecotoxicology 2015, 24, 1478–1485. [Google Scholar] [CrossRef]
  16. Caruso, G.; Giacobbe, M.G.; Azzaro, F.; Decembrini, F.; Leonardi, M.; Miserocchi, S.; Cao, X.Y.; Song, C.L.; Zhou, Y.Y. All-In-One: Microbial Response to Natural and Anthropogenic Forcings in a Coastal Mediterranean Ecosystem, the Syracuse Bay (Ionian Sea, Italy). J. Mar. Sci. Eng. 2022, 10, 19. [Google Scholar] [CrossRef]
  17. Ren, Z.; Qu, X.D.; Zhang, M.; Yu, Y.; Peng, W.Q. Distinct Bacterial Communities in Wet and Dry Seasons During a Seasonal Water Level Fluctuation in the Largest Freshwater Lake (Poyang Lake) in China. Front Microbiol 2019, 10, 782456. [Google Scholar] [CrossRef]
  18. Seidel, L.; Broman, E.; Stahle, M.; Nilsson, E.; Turner, S.; Hendrycks, W.; Sachpazidou, V.; Forsman, A.; Hylander, S.; Dopson, M. Long-Term Warming of Baltic Sea Coastal Waters Affects Bacterial Communities in Bottom Water and Sediments Differently. Front Microbiol 2022, 13, 873281. [Google Scholar] [CrossRef]
  19. Huang, J.J.; Wang, D.F.; Gong, F.; Bai, Y.; He, X.Q. Changes in Nutrient Concentrations in Shenzhen Bay Detected Using Landsat Imagery between 1988 and 2020. Remote Sens. 2021, 13, 3469. [Google Scholar] [CrossRef]
  20. Xu, H.L.; Zhang, Y.; Zhu, X.Z.; Zheng, M.F. Effects of rainfall-runoff pollution on eutrophication in coastal zone: A case study in Shenzhen Bay, southern China. Hydrol. Res. 2019, 50, 1062–1075. [Google Scholar] [CrossRef]
  21. Li, W.J.; Su, H.C.; Cao, Y.C.; Wang, L.L.; Hu, X.J.; Xu, W.J.; Xu, Y.; Li, Z.J.; Wen, G.L. Antibiotic resistance genes and bacterial community dynamics in the seawater environment of Dapeng Cove, South China. Sci. Total Environ. 2020, 723, 138027. [Google Scholar] [CrossRef]
  22. Zhang, R.; Liu, W.C.; Liu, Y.; Zhang, H.L.; Zhao, Z.H.; Zou, L.Y. Impact of water quality variations on the microbial metagenome across coastal waters in Shenzhen, south China. Ocean Coast. Manage. 2021, 208, 105612. [Google Scholar] [CrossRef]
  23. Zhang, R.; Liu, Y.; Zhao, X.F.; Zhao, Z.H.; Zhang, H.L.; Huang, X.P.; Xu, W.Q.; Shen, Y.C.; Lan, W.S. High-throughput sequencing reveals the spatial distribution variability of microbial community in coastal waters in Shenzhen. Ecotoxicology 2021, 30, 1429–1436. [Google Scholar] [CrossRef] [PubMed]
  24. Xu, H.L.; Liu, K.; Ning, T.Z.; Huang, G.; Zhang, Q.M.; Li, Y.L.; Wang, M.Q.; Fan, Y.M.; An, W.L.; Ji, L.B.; et al. Environmental remediation promotes the restoration of biodiversity in the Shenzhen Bay Estuary, South China. Ecosyst. Health Sustain. 2022, 8, 2026250. [Google Scholar] [CrossRef]
  25. Xu, L.; Wang, L.G.; Wang, X.H.; Van Damme, K.; Ning, J.J.; Li, Y.F.; Huang, D.L.; Liu, S.S.; Li, H.; Du, F.Y. Spatial and temporal variabilities of coastal nekton community structure and phylogenetic diversity in Daya and Dapeng Bay, southern China. Ecol. Indic. 2021, 131, 108226. [Google Scholar] [CrossRef]
  26. APHA. Standard Methods for the Examination of Water and Wastewater, 21st ed.; American Public Health Association: Washington, DC, USA, 2005. [Google Scholar]
  27. Caporaso, J.G.; Kuczynski, J.; Stombaugh, J.; Bittinger, K.; Bushman, F.D.; Costello, E.K.; Fierer, N.; Peña, A.G.; Goodrich, J.K.; Gordon, J.I. QIIME allows analysis of high-throughput community sequencing data. Nat. Methods 2010, 7, 335–336. [Google Scholar] [CrossRef] [PubMed] [Green Version]
  28. Rognes, T.; Flouri, T.; Nichols, B.; Quince, C.; Mahé, F. VSEARCH: A versatile open source tool for metagenomics. PeerJ 2016, 4, e2584. [Google Scholar] [CrossRef] [Green Version]
  29. Li, D.P.; Kang, X.; Chu, L.L.; Wang, Y.F.; Song, X.S.; Zhao, X.X.; Cao, X. Algicidal mechanism of Raoultella ornithinolytica against Microcystis aeruginosa: Antioxidant response, photosynthetic system damage and microcystin degradation. Environ. Pollut. 2021, 287, 117644. [Google Scholar] [CrossRef]
  30. Oksanen, J.; Blanchet, F.G.; Friendly, M.; Kindt, R.; Legendre, P.; McGlinn, D.; Minchin, P.R. Vegan: Community Ecology Package. R Package Version 2.4-3. 2017. Available online: https://CRAN.R-project.org/package=vegan (accessed on 7 April 2017).
  31. Lozupone, C.; Knight, R. UniFrac: A new phylogenetic method for comparing microbial communities. Appl. Environ. Microbiol. 2005, 71, 8228–8235. [Google Scholar] [CrossRef] [Green Version]
  32. White, J.R.; Nagarajan, N.; Pop, M. Statistical methods for detecting differentially abundant features in clinical metagenomic samples. PLoS Comp. Biol. 2009, 5, e1000352. [Google Scholar] [CrossRef]
  33. Reshef, D.N.; Reshef, Y.A.; Finucane, H.K.; Grossman, S.R.; McVean, G.; Turnbaugh, P.J.; Lander, E.S.; Mitzenmacher, M.; Sabeti, P.C. Detecting Novel Associations in Large Data Sets. Science 2011, 334, 1518–1524. [Google Scholar] [CrossRef] [Green Version]
  34. Shannon, P.; Markiel, A.; Ozier, O.; Baliga, N.S.; Wang, J.T.; Ramage, D.; Amin, N.; Schwikowski, B.; Ideker, T. Cytoscape: A software environment for integrated models of biomolecular interaction networks. Genome Res. 2003, 13, 2498–2504. [Google Scholar] [CrossRef] [PubMed]
  35. Langille, M.G.; Zaneveld, J.; Caporaso, J.G.; McDonald, D.; Knights, D.; Reyes, J.A.; Clemente, J.C.; Burkepile, D.E.; Thurber, R.L.V.; Knight, R. Predictive functional profiling of microbial communities using 16S rRNA marker gene sequences. Nat. Biotechnol. 2013, 31, 814–821. [Google Scholar] [CrossRef] [PubMed]
  36. Wu, H.C.; Dissard, D.; Douville, E.; Blamart, D.; Bordier, L.; Tribollet, A.; Le Cornec, F.; Pons-Branchu, E.; Dapoigny, A.; Lazareth, C.E. Surface ocean pH variations since 1689 CE and recent ocean acidification in the tropical South Pacific. Nat. Commun. 2018, 9, 2543. [Google Scholar] [CrossRef] [Green Version]
  37. Yan, Q.; Cheng, T.T.; Song, J.T.; Zhou, J.; Hung, C.C.; Cai, Z.H. Internal nutrient loading is a potential source of eutrophication in Shenzhen Bay, China. Ecol. Indic. 2021, 127, 107736. [Google Scholar] [CrossRef]
  38. Lu, Z.Y.; Liu, Z.B.; Zhang, C.J.; Wei, Q.Y.; Zhang, S.Y.; Li, M. Spatial and seasonal variations of sediment bacterial communities in a river-bay system in South China. Appl. Microbiol. Biotechnol. 2021, 105, 1979–1989. [Google Scholar] [CrossRef] [PubMed]
  39. Luo, Y.; Yao, J.; Wang, X.; Zheng, M.; Guo, D.; Chen, Y. Efficient municipal wastewater treatment by oxidation ditch process at low temperature: Bacterial community structure in activated sludge. Sci. Total Environ. 2020, 703, 135031. [Google Scholar] [CrossRef] [PubMed]
  40. Wang, Y.; Huang, J.M.; Zhou, Y.L.; Almeida, A.; Finn, R.D.; Danchin, A.; He, L.S. Phylogenomics of expanding uncultured environmental Tenericutes provides insights into their pathogenicity and evolutionary relationship with Bacilli. BMC Genom. 2020, 21, 408. [Google Scholar] [CrossRef] [PubMed]
  41. Cleary, D.F.R.; Huang, Y.S.M. A comparison of the prokaryotic communities associated with seven seaweed species, sediment, and seawater from the Penghu archipelago, Taiwan. Mar. Biol. Res. 2020, 16, 744–761. [Google Scholar] [CrossRef]
  42. Ismail, N.; Almutairi, A. Bacterioplankton Community Profiling of the Surface Waters of Kuwait. Fron. Mar. Sci. 2022, 9, 838101. [Google Scholar] [CrossRef]
  43. Laas, P.; Ugarelli, K.; Travieso, R.; Stumpf, S.; Gaiser, E.E.; Kominoski, J.S.; Stingl, U. Water Column Microbial Communities Vary along Salinity Gradients in the Florida Coastal Everglades Wetlands. Microorganisms 2022, 10, 215. [Google Scholar] [CrossRef] [PubMed]
  44. Su, Z.G.; Dai, T.J.; Tang, Y.S.; Tao, Y.L.; Huang, B.; Mu, Q.L.; Wen, D.H. Sediment bacterial community structures and their predicted functions implied the impacts from natural processes and anthropogenic activities in coastal area. Mar. Pollut. Bull. 2018, 131, 481–495. [Google Scholar] [CrossRef] [PubMed]
  45. Zhang, W.; Ki, J.-S.; Qian, P.-Y. Microbial diversity in polluted harbor sediments I: Bacterial community assessment based on four clone libraries of 16S rDNA. Estuar. Coast. Shelf Sci. 2008, 76, 668–681. [Google Scholar] [CrossRef]
  46. Orel, N.; Fadeev, E.; Klun, K.; Licer, M.; Tinta, T.; Turk, V. Bacterial Indicators Are Ubiquitous Members of Pelagic Microbiome in Anthropogenically Impacted Coastal Ecosystem. Front Microbiol 2022, 12, 765091. [Google Scholar] [CrossRef] [PubMed]
  47. Li, X.H.; You, C.; Qu, L.; Zhou, B.; Tang, X.X.; Xiao, H. Bacterial communities fluctuate in abundance and diversity under simulated oil-contaminated seawater conditions. J. Oceanol. Limnol. 2019, 37, 615–627. [Google Scholar] [CrossRef]
  48. Li, Y.B.; Huang, D.Y.; Sun, W.M.; Sun, X.X.; Yan, G.; Gao, W.L.; Lin, H.Z. Characterizing sediment bacterial community and identifying the biological indicators in a seawater-freshwater transition zone during the wet and dry seasons. Environ. Sci Pollut R 2022, 29, 41219–41230. [Google Scholar] [CrossRef]
  49. Chen, Y.; Li, J.; Lyu, Y.J.; Zou, Y.Y.; Li, Q.Q.; Yang, Q.S.; Tang, X.Y.; Yuan, X.C.; Jiang, Z.J.; Zhang, S. Interaction and Assembly of Bacterial Communities in High-Latitude Coral Habitat Associated Seawater. Microorganisms 2022, 10, 558. [Google Scholar] [CrossRef]
  50. Li, Z.; Yu, E.; Zhang, K.; Gong, W.; Xia, Y.; Tian, J.; Wang, G.; Xie, J. Water Treatment Effect, Microbial Community Structure, and Metabolic Characteristics in a Field-Scale Aquaculture Wastewater Treatment System. Front Microbiol 2020, 11, 930. [Google Scholar] [CrossRef]
  51. Behnami, A.; Farajzadeh, D.; Isazadeh, S.; Benis, K.Z.; Shakerkhatibi, M.; Shiri, Z.; Ghorghanlu, S.; Yadeghari, A. Diversity of bacteria in a full-scale petrochemical wastewater treatment plant experiencing stable hydrocarbon removal. J. Water Process Eng. 2018, 23, 285–291. [Google Scholar] [CrossRef]
  52. Sakami, T.; Watanabe, T.; Kakehi, S.; Taniuchi, Y.; Kuwata, A. Spatial variation of bacterial community composition at the expiry of spring phytoplankton bloom in Sendai Bay, Japan. Gene 2016, 576, 610–617. [Google Scholar] [CrossRef]
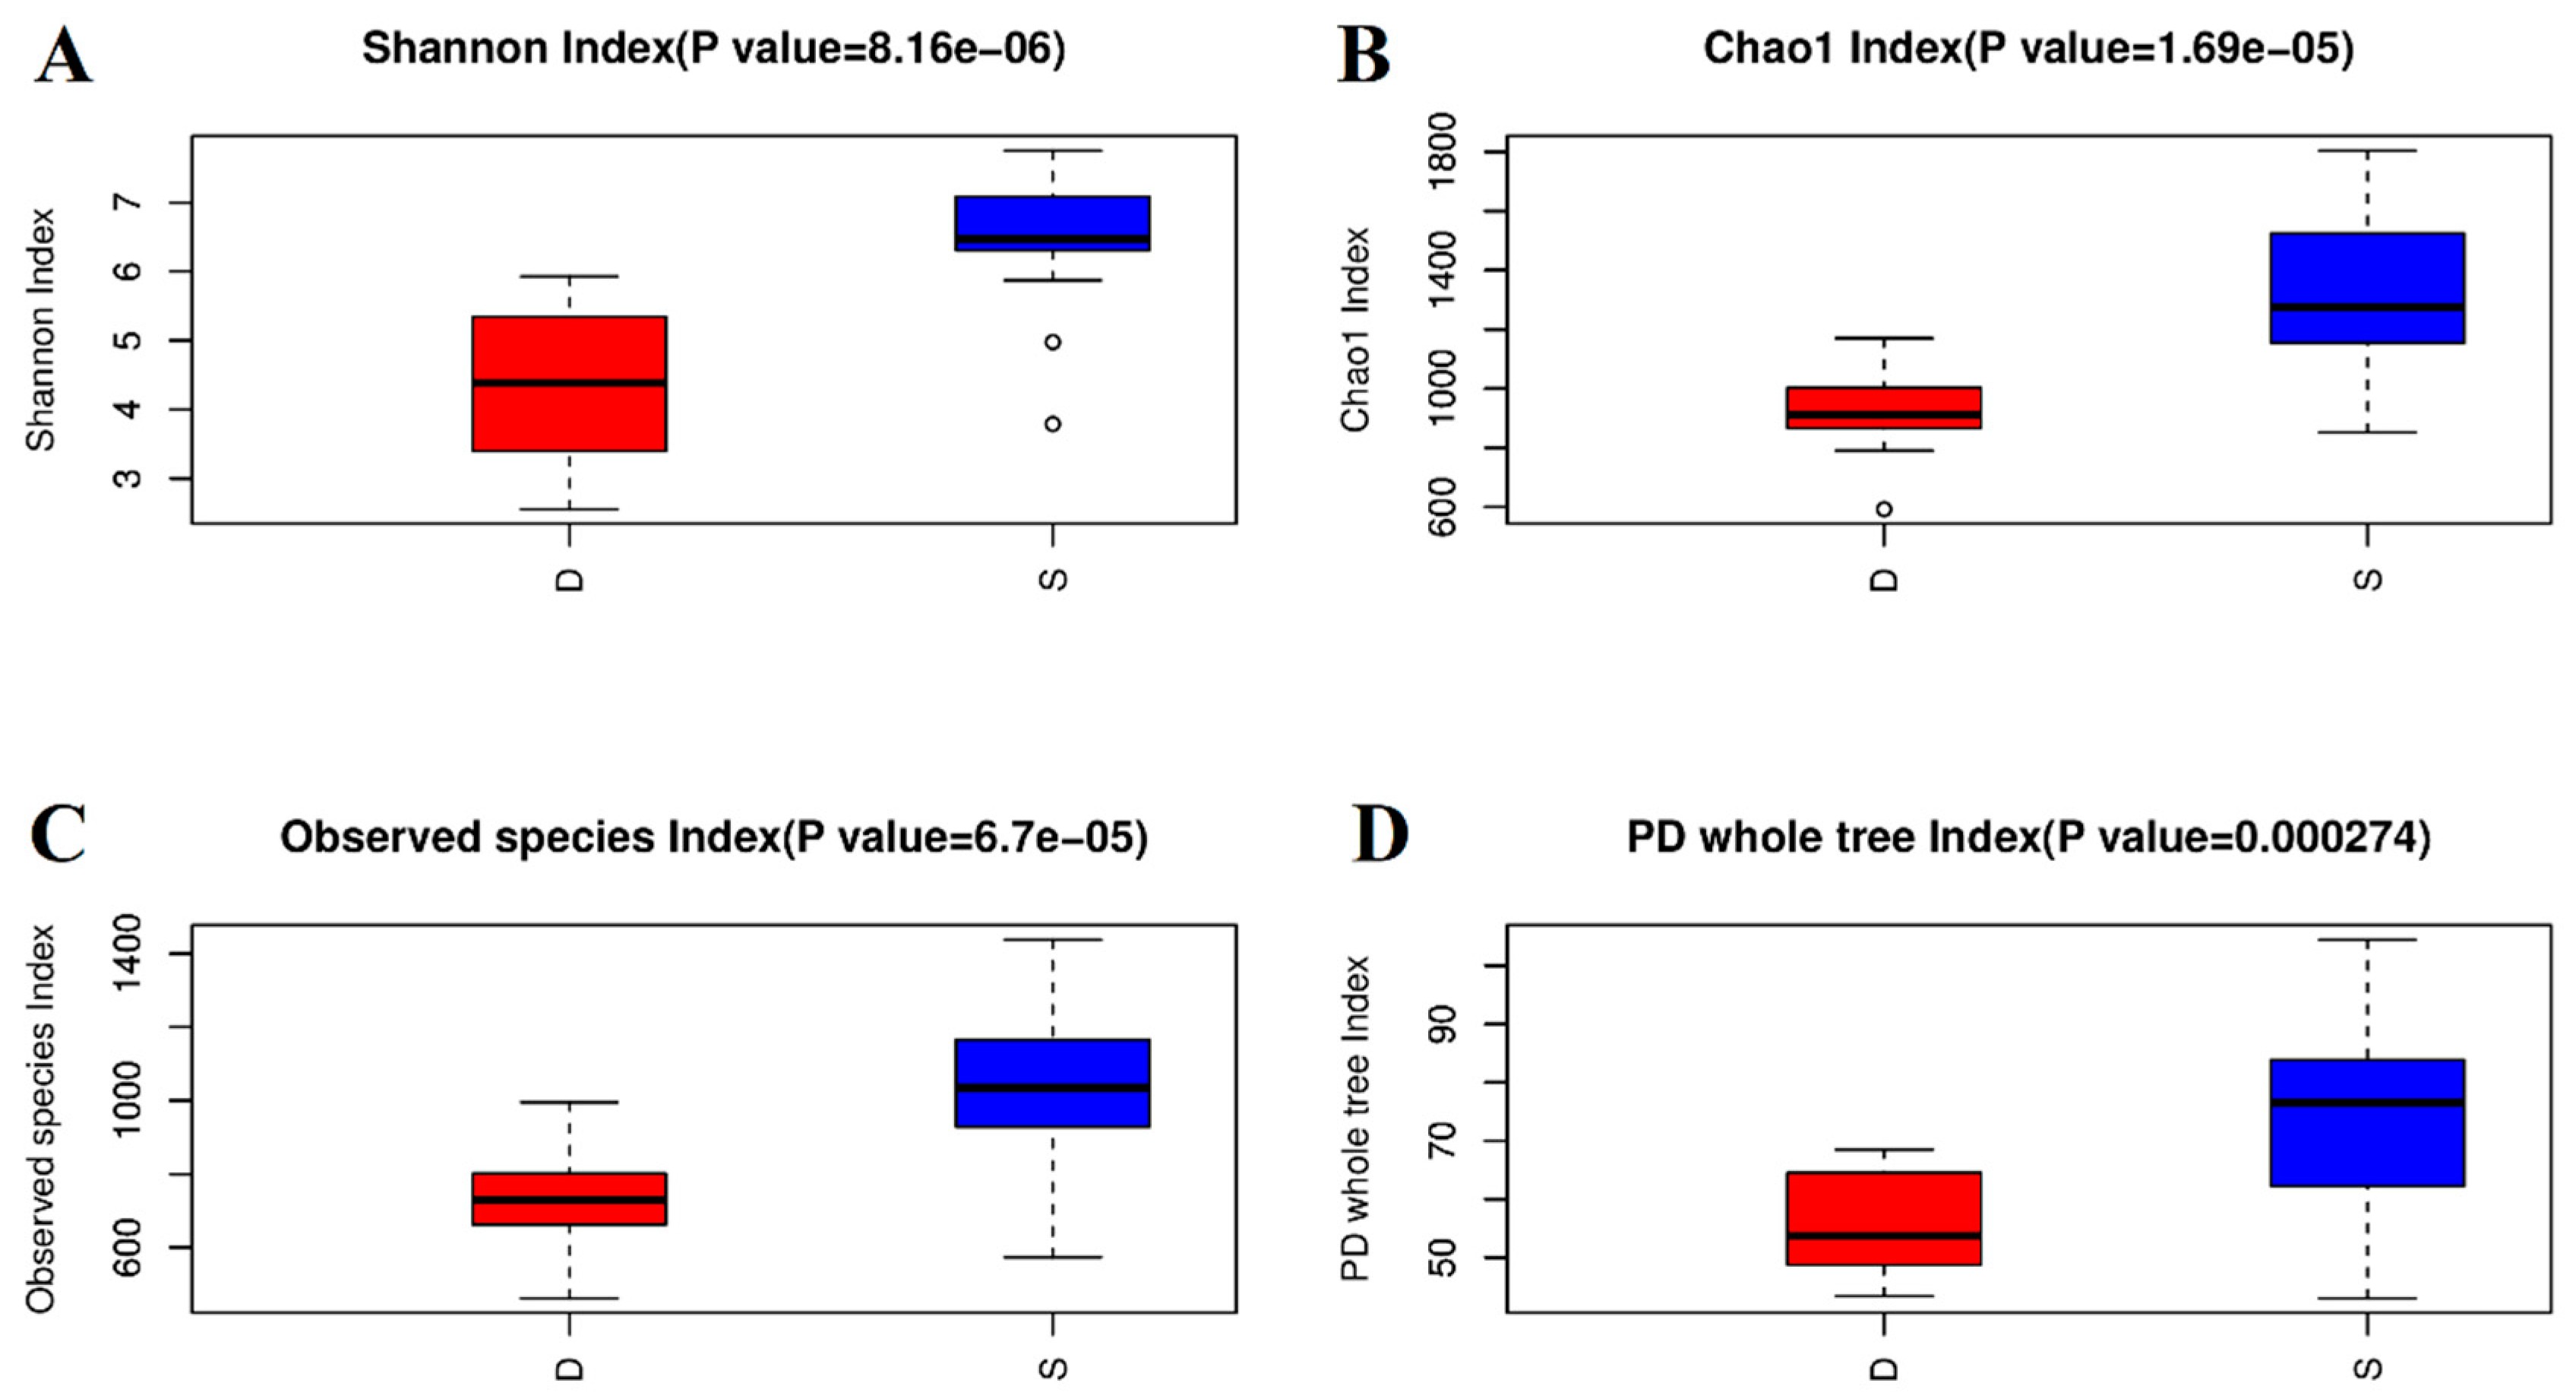
Figure 1. Alpha diversity of bacterial communities in two coastal areas S and D (AD). Column height and error bar represent the mean value and standard deviation, respectively. PD, phylogenetic diversity.
Jmse 10 01878 g001
Figure 2. Bacterial community compositions of all samples at phylum (A), class (B), and genus (C) levels (based on relative abundance). Top 15 phyla, top 20 classes, and top 35 genera are presented in the figures, and others represent the sum of the rest phyla, classes and genera, respectively. Three samples at the same site are shown on average.
Jmse 10 01878 g002aJmse 10 01878 g002b
Figure 3. (A) Principal coordinates analysis (PCoA) of the bacterial communities in the samples. PC 1 and 2 accounted for 33% and 19% of the variance, respectively. (B) Dendrogram from the cluster analysis of the relationship between bacterial communities in coastal area S and D.
Jmse 10 01878 g003
Figure 4. Network analysis of relationship between taxon abundance (at genus level) and environmental variables. Note: The circle represents the environmental factor, and the diamond represents the genus. The size of the diamond was proportional to the relative abundance of the given genus. The different colors of the diamond indicate the difference of the genus between coastal area D and S: blue indicates coastal area S was significantly lower than D, red indicates coastal area S was significantly higher than D, and sky blue indicates no significant difference. Lines represent the correlations between environmental factors and genera: the orange solid line represents a significant positive correlation, and the gray dashed line represents a significant negative correlation. The width of the line represents the strength of the relationship (the maximal information coefficient (MIC) value).
Jmse 10 01878 g004
Figure 5. Relative abundance of KEGG functional pathways at Level 1 and Level 2 in coastal area S and D. Note: The left axis represents different KEGG metabolic pathways at Level 2, and the histogram with different colors represents the difference values of metabolic pathway of different groups. The right side lists six major categories of metabolic pathways at Level 1. * Indicates significant difference within the group (p < 0.05); ** indicates significant difference within the group (p < 0.01).
Jmse 10 01878 g005
Table 1. Sampling sites and characteristics of the seawater samples.
SiteLatitudeLongitudeSampleTemperaturepHConductivitySalinityDOAmmoniumNitriteNitratePhosphate
(℃) (ms/cm)(‰)(mg/L)
D122.59295114.30976D1.131.77.3133.26249.581.1160.0010.5010.087
D1.231.77.1428.31248.431.1350.0050.4050.081
D1.331.77.0833.22238.650.8240.0010.4890.071
D222.59330114.31009D2.132.27.1831.29247.930.6690.0010.4230.039
D2.232.27.1732.8249.630.9800.4710.018
D2.332.27.2133.06248.740.7270.0070.4810.018
D322.59378114.31073D3.132.37.1634.38249.150.41600.3310.039
D3.232.37.1731.04247.770.4740.0050.2280.05
D3.332.47.1733.5258.330.5330.0030.5070.029
D422.5955114.31338D4.132.77.1631.26227.820.9990.0040.4580.675
D4.232.87.232.36248.690.29900.5130.675
D4.332.87.1730.35228.071.13500.4470.717
D522.59499114.31246D5.132.87.1928.98259.191.5240.0070.4750.024
D5.232.97.1732.7258.931.56300.4860.024
D5.332.97.1632.12259.571.34900.3820.034
D622.5944114.31148D6.1337.1930.81228.030.3380.0010.510.024
D6.232.97.2130.63228.290.3770.0040.50.024
D6.332.87.231.27218.910.1440.0030.4890.018
S122.48282113.91925S1.125.48.37.23165.70.1050.1060.6810.055
S1.225.98.317.46157.120.0860.1040.7930.092
S1.325.48.277.41256.540.1050.1131.5720.039
S222.48885113.93895S2.1268.317.82757.20.1240.2250.5890.06
S2.2258.367.83456.240.2410.2291.1960.081
S2.3248.377.85777.380.1440.2461.3090.039
S322.52265113.95183S3.125.48.361.65616.860.2990.1291.4410.05
S3.2268.361.50617.240.2990.1191.1730.05
S3.324.38.381.57216.730.2990.0931.6370.045
S422.52448113.99002S4.123.98.220.570317.370.0080.0112.6040.024
S4.224.58.20.571717.60.0860.0082.5240.092
S4.324.98.180.571617.490.0860.0123.4030.055
S522.52988114.01394S5.125.58.321.42416.951.1740.3641.6440.024
S5.224.18.361.45517.060.8830.3711.4880.087
S5.323.18.381.41170.960.4142.0650.039
S622.50845114.03359S6.125.48.280.561715.380.3380.0981.9360.029
S6.2268.280.565216.360.4940.0751.9950.102
S6.3258.30.559816.220.2990.0932.5730.029
DO, dissolved oxygen.
Table 2. ANOSIM analysis of bacterial compositions in different groups.
GroupR-Valuep-Value
D vs. S0.81550.001
D (between)0.0460.349
S (between)0.7370.001
Table 3. Mantel test of the effects of environmental factors on the bacterial community compositions.
Factorrp
Temperature0.61860.001
pH0.65100.001
Conductivity0.68770.001
DO0.45930.001
salinity0.67130.001
Ammonium0.07710.049
Nitrite0.26130.001
Nitrate0.51200.001
Phosphate0.05350.151
Physicochemical factors0.68070.001
Nutrients0.49680.001
Table 4. Maximal Information-based Nonparametric Exploration (MINE) network of environmental parameters.
Environmental FactorAverage MIC aDegree bPositiveNegative
Nitrate0.82631814104
Nitrite0.790931880
DO0.7712315411
Salinity0.76480820614
Conductivity0.74979120515
Temperature0.71255220614
PH0.70948619145
Phosphate0.312937330
a Average correlation between each environmental parameter with the connected phylogenetic group. The high number indicates the strength of correlation. b The Degree indicates the number of connections between each environmental parameter with the phylogenetic group, while Positive and Negative indicates the positive and negative number of these connections.
Publisher’s Note: MDPI stays neutral with regard to jurisdictional claims in published maps and institutional affiliations.