Article

Morphodynamic Behaviour of a Mediterranean Intermittent Estuary with Opening Phases Primarily Dominated by Offshore Winds

CEFREM, UMR CNRS 5110, Université de Perpignan Via-Domitia, 66100 Perpignan, France
*
Author to whom correspondence should be addressed.
J. Mar. Sci. Eng. 2022, 10(12), 1817; https://doi.org/10.3390/jmse10121817
Submission received: 16 September 2022 / Revised: 10 November 2022 / Accepted: 21 November 2022 / Published: 25 November 2022
(This article belongs to the Section Coastal Engineering)

Abstract

:
This study focuses on the dynamics of an intermittent estuary in a wave-dominated (microtidal) area, with low fluvial discharges and strong dominant offshore wind regimes. The aims are to understand the effect of these particular environmental factors in the dynamics of such estuaries. The results allow us to propose a synthetic morphodynamic model of evolution whereby opening phases are predominantly controlled by offshore winds, which have a significant influence in the northern Mediterranean. Inputs from rainfall/karst discharge and the overtopping of storm waves cause the lagoon to fill. Closing phases are controlled by the slight easterly swell which forms a berm at the inlet entrance. On occasion, major storms can also contribute to barrier opening. Nevertheless, offshore wind remains the main controlling factor allowing the surge of lagoon waters behind the beach barrier and the lowering of the berm by wind deflation. This leads to opening of the barrier due to the overflow of lagoon waters at the beach megacusp horns, thus connecting the sub-aerial beach with the inner bar system that is developed on topographically low sectors of the barrier. To the best of the authors’ knowledge, this type of estuary is not described in the literature.

1. Introduction

Intermittent estuaries (or inlets) are small channels (<100 m wide, a few metres deep) which develop on narrow low-lying barriers, and which allow the connection of brackish coastal water bodies with the ocean. This connection is periodically closed due to the accumulation of marine sediments forming a berm at the inlet entrance [1,2,3,4]. Intermittent estuaries are primarily observed in wave energy-dominated sandy microtidal environments and show a broad spatial distribution worldwide [5,6,7]. For example, on microtidal coasts they account for 15.3% of all estuaries, with a larger proportion in Australia (21% of total), South Africa (16%) and Mexico (16%) [7]. The highly variable connections of these estuaries to the sea can lead to considerable changes in physicochemical variables [8], the disruption of fish habitats and migration [9,10] as well as the degradation of river/lagoon water quality during periods of mouth closure or semi-closure [11,12,13]. The degree of closure also results in an increased vulnerability of coastal areas to risks of flooding [14]. Furthermore, during periods of closure, intermittent estuaries can act as accumulation basins. They are emptied only periodically and may be vulnerable to anthropogenic activities, thus being considered as very sensitive to anthropogenic disturbance [2].
The dynamics of the inlet are primarily controlled by external forcings (sediment transport and hydrodynamic forcings) [15]: fluvial, tidal, and/or gravity waves [4,6,16,17,18] but also infragravity waves [19,20,21,22,23]. These systems are particularly difficult to study because of the concomitant forcings, coupled with the complexity of wave-current interactions [24,25,26]. A seasonality can be observed in the functioning of these systems, with summer being more favorable to closure (low river discharge and less energetic swell). Conversely, winters are more favorable to opening (heavy precipitation and high marine energy), during which the inlets are generally open [4].
Several possible mechanisms have been proposed to explain the opening of intermittent estuaries:
  • Increased fluvial discharge during rain events that lead to barrier breaching [4,12,16,27,28];
  • Liquefaction of barrier sediments by percolation caused by large differences in water level on either side of the barrier [29,30];
  • The influence of high-energy marine conditions where waves cause breaching by overwash and overtopping [3,31,32];
  • More complex mechanisms coupling the impact of storm swell submergence with flooding generated by heavy precipitation (flash floods) [33,34]. These opening phases cause a wide redistribution of sediment in and around the inlet system [35]. The response to an event is not identical over time, and depends on the inherited topographic state [36], itself linked to processes operating on event scales up to several decades [31];
Concerning the closure mechanisms, two main processes can be identified:
  • Marine longshore transport is dominant over fluvial flow, and the migration of the spit leads to displacement of the estuary and its eventual closure. This mechanism is most applicable in the case of straight shorelines subject to oblique swells [4,37,38];
  • Cross-shore transport, when the swell is able to remobilize sediments in the surrounding area or in the nearshore bars, which then nourish the sub-aerial beach and fill the outlet. This shoreline feeding mechanism is commonly evoked in the case of long-period swells with frontal incidence coupled with a low longshore transport rate and low outflow velocities <0.1 m.s−1 [4,12,19,37,39,40,41];
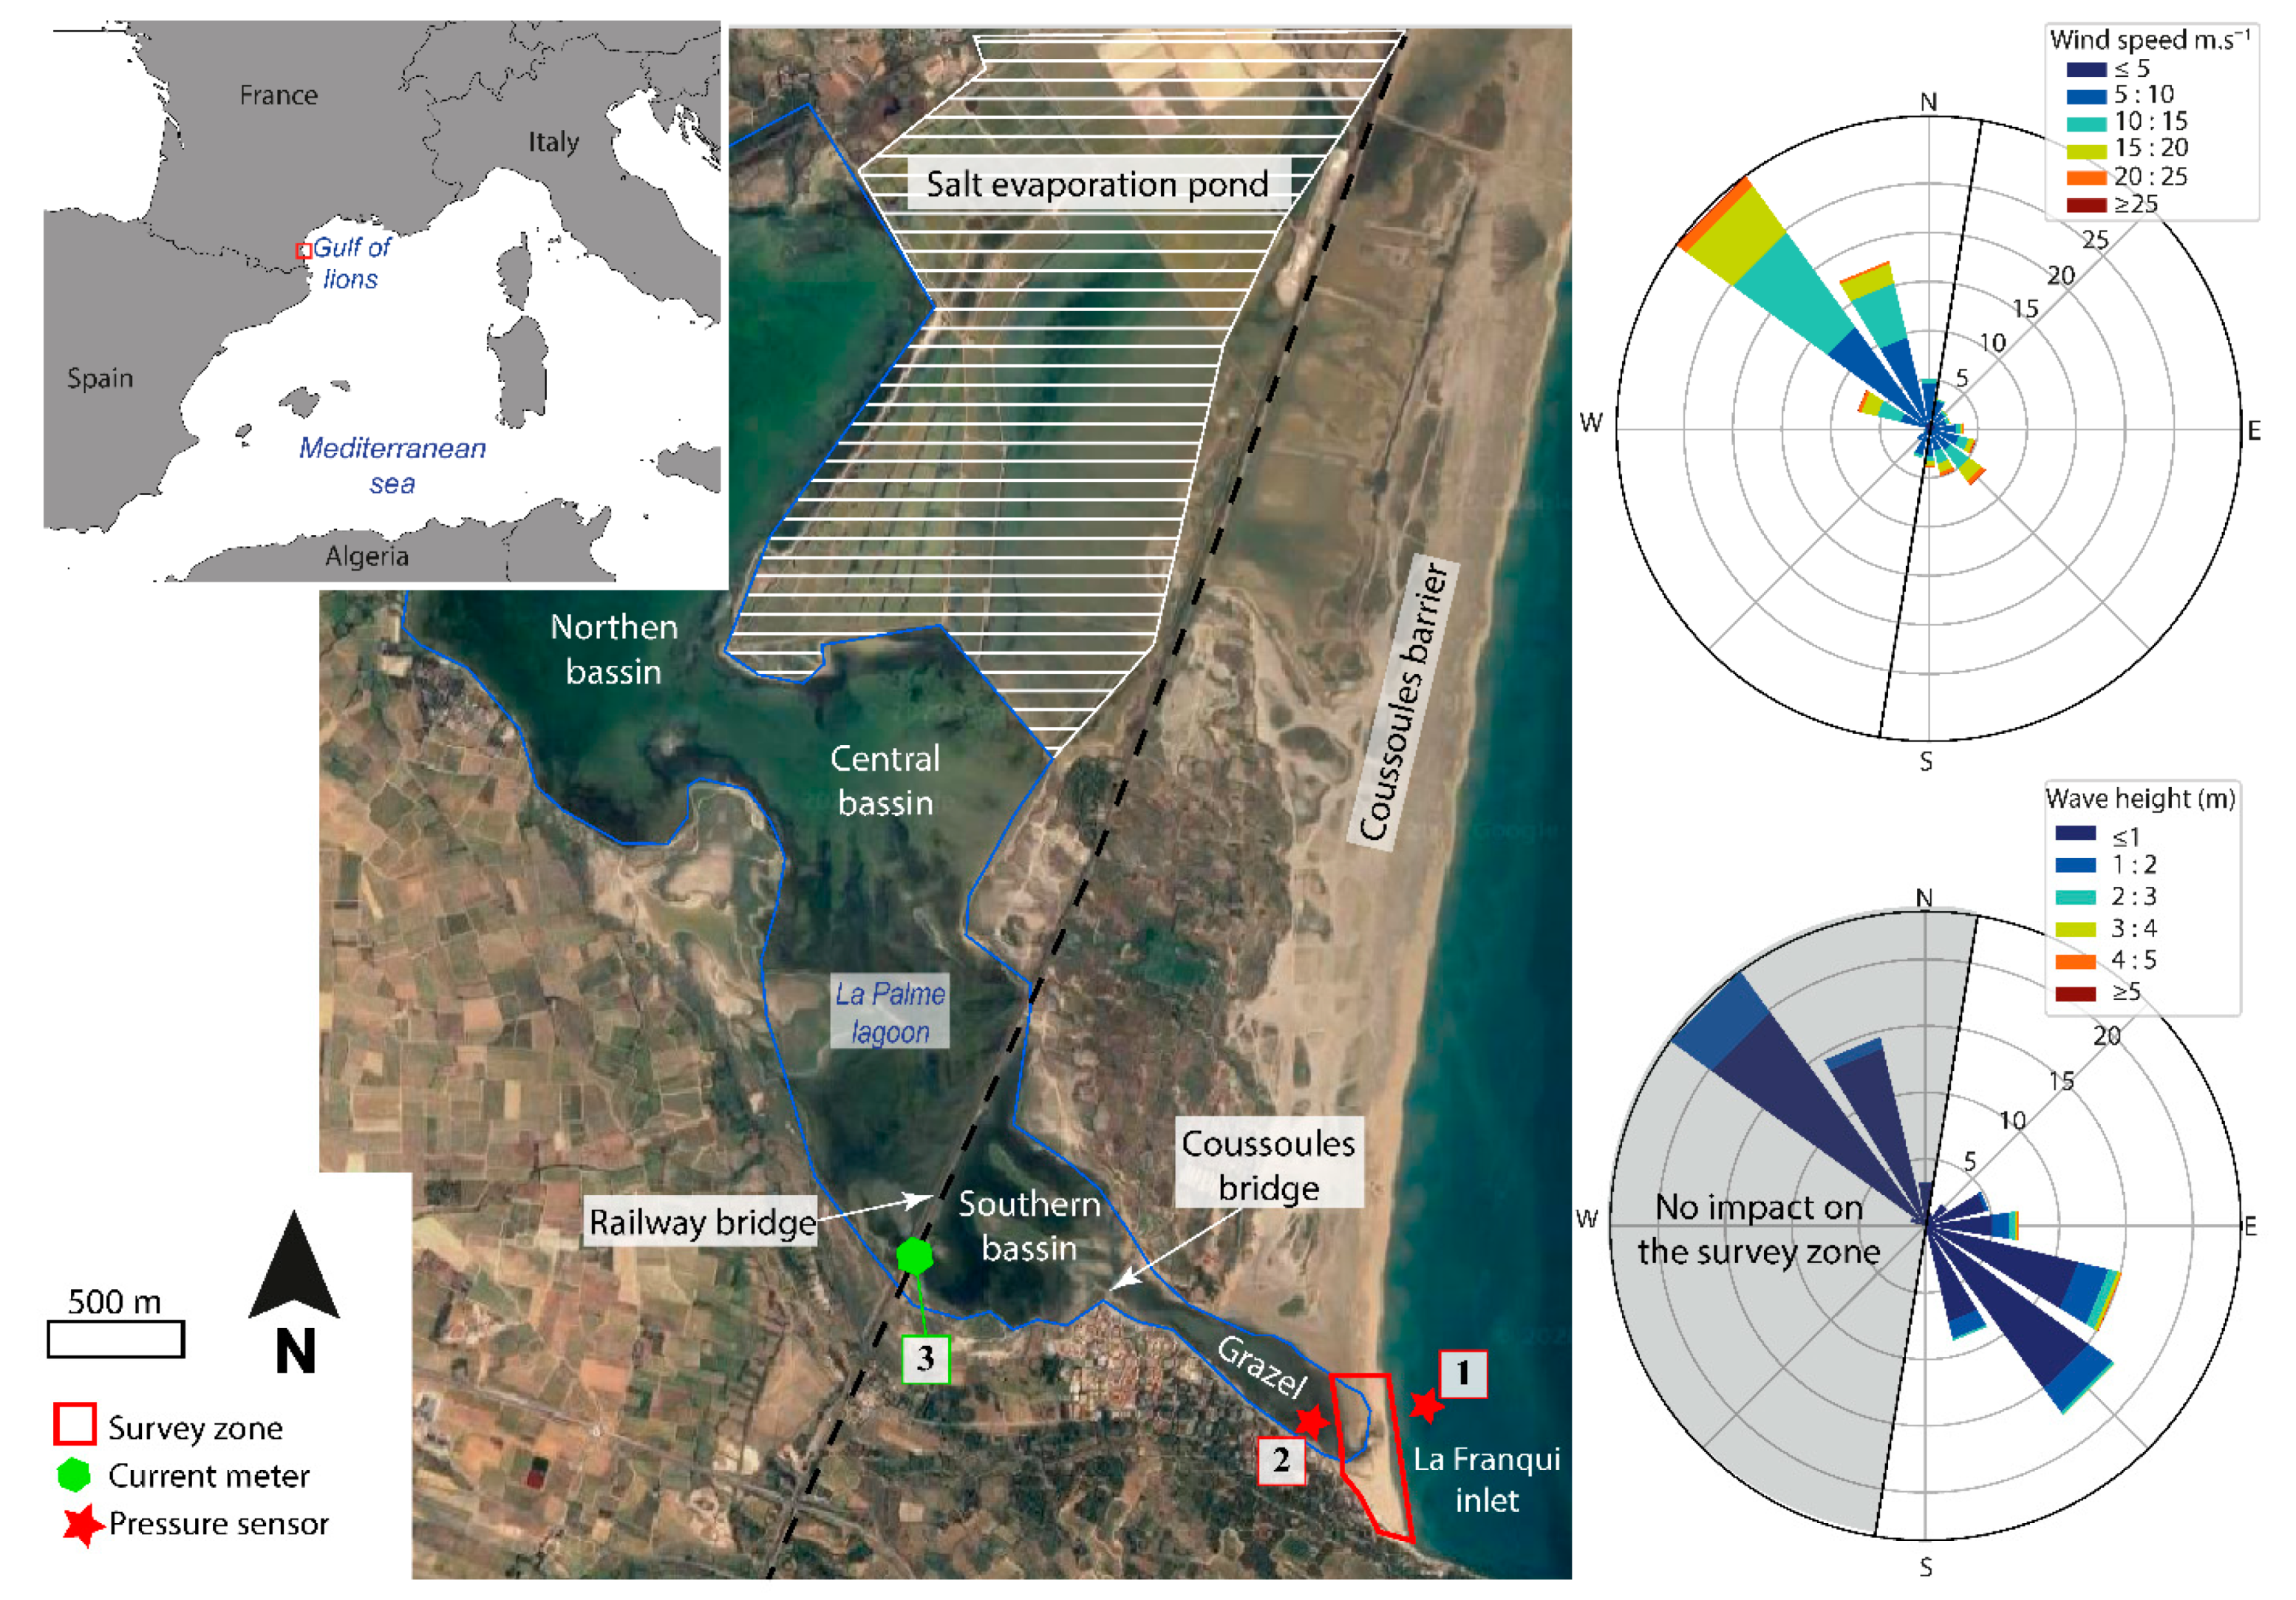
The impact of wind is rarely considered when describing the multiple and complex mechanisms driving the morphodynamics of intermittent estuaries, even though wind can have a considerable influence on the internal lagoon morphology [42,43]. This is especially important in shallow basins where wind forcing can produce surges of significant amplitude [44,45,46,47,48]. These surges can be comparable in magnitude to the effects produced by river discharges and could thus potentially contribute to controlling an intermittent estuary if the surge is directed toward the barrier. However, this aspect deserves further investigation. In addition, wind is at the origin of processes that can give rise to considerable sediment transport on the barriers causing major morphological changes [49,50,51,52]. This is especially important in environments with low tidal ranges (lower part of the microtidal classification). In the absence of a tidal range, the beach exposure time is sufficient to cause morphological changes on the backshore or beachface [53,54,55]. This is despite the fact that the width of the beach is generally reduced in microtidal environments, limiting the fetch area that can accommodate aeolian sediment transport (onshore or offshore). Considering the capacity of the wind to induce currents or even surges in lagoons but also its ability to transport sediment and reshape sub-aerial morphology, the wind is a potential forcing agent that should be taken into account in intermittent estuary dynamics.
This study focuses on the dynamics of an intermittent microtidal inlet in a wave-dominated area with a marked seasonality. This inlet is characterized by very low river discharges and strong offshore wind regimes (typical of the Gulf of Lions and the northern Mediterranean coast). To the best of the authors’ knowledge, this type of inlet has not yet been described in the literature. The methodology is based on topographic monitoring over a period of five years (25 surveys), coupled with two periods of high frequency monitoring of lagoon level (7 February 2019 to 27 March 2019; 16 November 2021 to 3 February 2022), swell and wind conditions. The aim of our study is to understand the mechanisms that control the functioning of intermittent estuaries in this type of environment. In particular, we focus on the effect of offshore wind in the dynamics of estuaries in addition to the more commonly cited controlling factors (atmospheric pressure, precipitation, riverine inputs, and tides). As a result, we present a conceptual morphodynamic model of an intermittent estuary in a microtidal environment, combining a set of controlling factors (mainly offshore wind and onshore waves) that are not usually considered simultaneously. More broadly, the objective is to contribute to the understanding of intermittent estuaries by investigating some possible controlling factors that may be minor at most sites but dominant at others. This leads to a discussion on the integration of these controlling factors into our overall knowledge of the dynamics of intermittent estuaries, particularly in other sectors of the Gulf of Lions but also over a significant part of the northern Mediterranean where estuaries with similar controlling factors may be present.

2. Study Site

The Gulf of Lions (France, from Cape Creus to the south to Cape Couronne to the north) is a wave-dominated microtidal environment with a tidal range of 0.3 m (mean spring tide). Exceptionally, storm surges can reach more than 1 m under the combined effect of storm waves and swell [56]. Weather patterns can be divided into two main sets of conditions as follows:
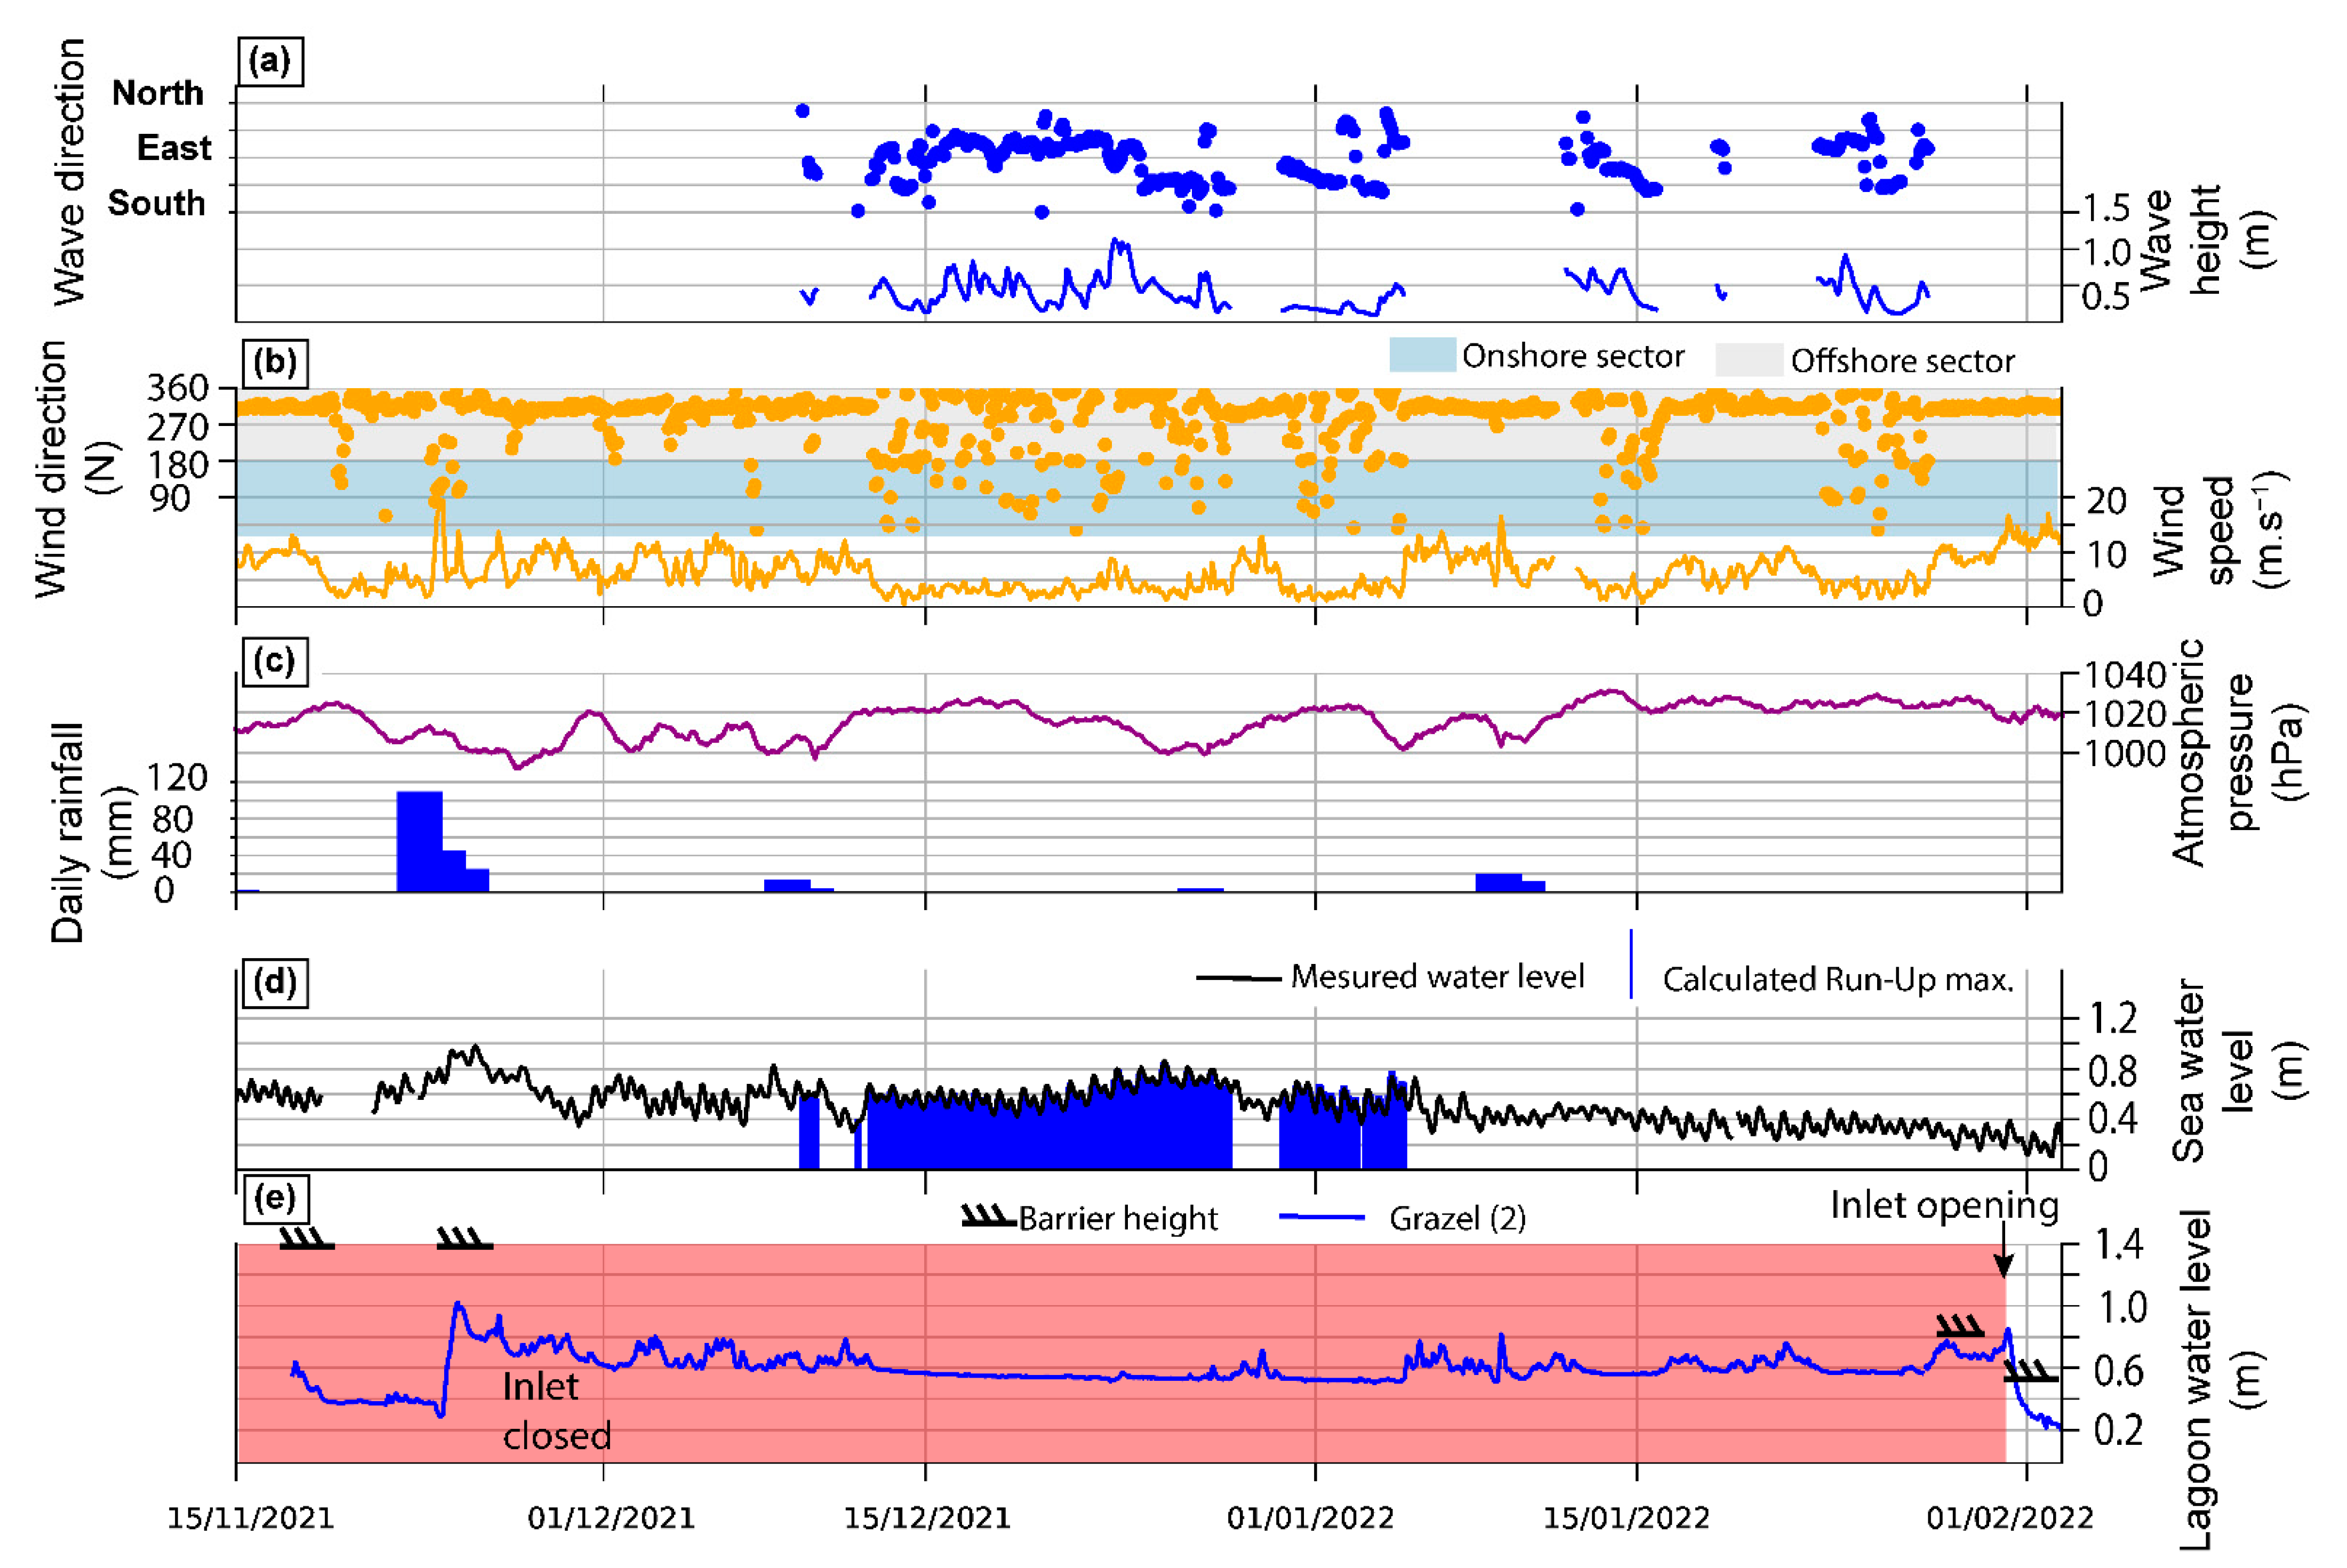
  • Dominant offshore winds (NW) blowing 70% of the time, commonly reaching daily average speeds above 10 m.s−1 and even 30 m.s−1 for a few hours (gusts > 40 m.s−1), with between 10 and 30 days average wind speed above 27 m.s−1 [57]. This violent and cold offshore wind blows from the west along the foothills of the Pyrenees and the southern mountains of the Massif Central. Two meteorological situations classically generate this wind, either an anticyclonic zone between Spain and the SW of France or an N/NW flow often in the form of a cold front bringing cold air to the Mediterranean between a high-pressure area in the west and a low-pressure area in the east located on the Gulf of Genoa or the Tyrrhenian Sea [58]. This offshore wind regime generates seaward-directed waves that have no impact on our study site.
  • Onshore winds are the least frequent (30% of the time) and can be accompanied by swell; these winds are associated with severe winter storm events [59]. The S/SE swell, associated with onshore winds, is characterized by significant wave height (Hs) of 2.5 m for annual storms and up to 6 m for a decadal storm, with a period (Ts) of around 5 to 10 s [56]. Here, a storm is defined as a wave event in which Hs exceeds a threshold value of 2 m [60,61]. A seasonality is observable in the wind regime, with severe offshore wind events from late autumn through to spring interspersed by marine storm events, and with low-intensity sea breezes during the summer [56]. Spring and summer are characterized by low-energy conditions, whereas autumn and winter are more energetic periods [59,62]. Longshore drift is locally directed to the north [56,63].
The study site, the sandy barrier of Coussoules (Figure 1), is located in the central part of the Gulf of Lions north of Cap Leucate, with particular attention focusing on the dynamics of an intermittent estuary, Le Grau de la Franqui. This inlet is a narrow body of water connecting the Mediterranean Sea in the east to the La Palme lagoon in the west. In this study, the inlet is defined as open when there is a clear connection of the lagoon to the sea without any sand bodies blocking the water circulation. It is defined as closed when an emerged berm blocks the inlet or when the barrier is fully formed (no visible channel). The lagoon has an area of 5 km² and an average depth of ≈0.9 m (1.8 m maximum), containing a water volume of 2.6 × 10⁶ m3 [64]. It is divided into three basins (Northern, Central, and Southern) delimited by constrictions or embankments that correspond to the salt ponds, the railway bridge, and the Coussoules bridge. The exchange of waters between the lagoon and the sea takes place through the inlet when it is open, or during episodic overwash due to strong storm surges [65] or by percolation through the barrier beach [66]. Although observable on the seaward side, the tidal signal does not propagate into the lagoon and is attenuated by the passage of the estuary and successive bridges. Thus, tidal variations are not a significant factor in the exchange between the sea and the Northern basin of the lagoon [67]. The lagoon is supplied with fresh water via one or more karst resurgences in the northwestern sector. Measured flow rates range from (3 ± 15) × 103 m3.d−1 in June 2016 to (25 ± 9) × 103 m3.d−1 in November 2016 [68]. Most of the inputs to the lagoon’s annual water budget are provided by karst discharges (27 × 106 m3), 3 × 10⁶ m3 by precipitation (between autumn and spring), and 7 × 10⁶ m3 by marine inflow. At the outflow, 30 × 106 m3 of this water input goes to the sea and 8 × 10⁶ m3 evaporates (potential evapotranspiration of 1700 mm.y−1, with a maximum in summer). The lagoon level is thus at its lowest during the summer before rising again in early autumn [66,69].
The maximum elevation of the beach barrier varies between +1 and +1.5 m NGF. The nearshore zone has a slope of 0.6° and is classified as dissipative [59]. It displays a double crescentic Rhythmic Bar and Beach (RBB) system [60] that influences the morphology of the sub-aerial beach. The positions of the megacusp horns correspond to the points of connection of the inner bar horns with the sub-aerial beach [59,70]. In periods of low energy, the berm of the megacusp horns is poorly marked, creating low points on the coastline. During periods of higher energy, the shoreline retrogrades and gains in altitude. This results in a higher berm with a steep seaward slope [70].

3. Materials and Methods

3.1. Topographic Survey

Morphological monitoring of the beach (Figure 1) was carried out using a DGPS-RTK system (Ashtech Proflex 500/800) following cross-shore transects (10 m apart) and longshore transects on the top of the berm and along the shore. The shoreline is defined as the static position of the water body on both the seaward side and the lagoon side. The DEMs were generated in the Lambert 93-NGF projection (French National Grid and Datum), using the Natural Neighbor interpolation method (accuracy in Z of about ±2.5 cm). Twenty-five DEMs were generated from November 2017 to January 2022 with a near-monthly survey frequency. Weather forecasts allowed us to anticipate morphogenic events for the beach and the inlet in order to carry out surveys before and after them. The state of the inlet was also monitored daily by surfcams and surveys were conducted during morphogenic periods. During the study period, no mechanical operations took place for opening or closing of the estuary. The frequency of surveys was weekly during the hydrodynamic campaign.
During the summer of 2014, a topo-bathymetric LiDAR dataset was acquired using a Hawk Eye III system as part of the Litto3d campaign. The accuracy is ±0.30 m in vertical and ±2.98 m in horizontal [71].

3.2. Hydrodynamic Measurements

Two pressure sensors (RBR Virtuoso) and a current meter (ADV NORTEK Vector) were deployed from 7 February 2019 to 27 March 2019 (positions 1,2, and 3 on Figure 1) to measure water level variations on both sides of the barrier. An additional campaign was carried out from 16 November 2021 to 3 February 2022 with only one pressure sensor at position 2 (Figure 1). Pressure sensors recorded at 2 Hz and the current meter at 1 Hz in 1 min bursts every 10 min. The instruments were calibrated on site before and after each deployment by gradually increasing the water level in a tank, to verify the calculated pressure/water height correlation. Moreover, water height above the instruments was measured to compare with instrumental values. Atmospheric pressure variations were corrected from the raw data using measurements from the nearby weather station. The accuracy is about ±2.5 cm. The position coordinates (X,Y,Z) of the sensors were determined with a centimetric DGPS-RTK system in Lambert 93-NGF projection, all level values being given in the NGF reference system (French National Datum).
Offshore wave conditions were recorded by the CANDHIS network at the Leucate buoy [72] moored 2.1 nautical miles off the study area in a water depth of 40 m.
Sea levels were measured using tide gauges located at Port-Vendres (45 km south of the study site).
To evaluate the extent of the marine influence on the beach, the 2% exceedance value of run-up on the beachface (R2%) was computed using the Stockdon et al. empirical formula [73].
R 2 % = W L + [ 1.1 + ( 0.35 β f ( H 0 L 0 ) 1 / 2 + [ H 0 L 0 ( 0.563 β f 2 + 0.004 ) ] 1 / 2 2 ) ]  
where WL is the water level, H0 is the deep water wave height, L0 the deep water wave-length and βf the beach slope from Aleman et al. (2015).

3.3. Meteorology

Hourly averaged wind data, atmospheric pressure, and daily precipitation were obtained from the Météo France station at Cap Leucate semaphore located about 2.5 km south-east of La Franqui beach, at an elevation of 42 m. It is important to note, however, that the method for sampling hourly average wind speed underestimates the gusts which represent the driving force in aeolian sand transport.

4. Results

4.1. Hydrodynamics and Water-Level Variations according to Prevailing Meteorological Forcings

During the survey period (2017–2022, Figure 2), we observed a seasonal weather pattern consistent with long-term statistics. The summer period is the least energetic, with wave heights around 1 m and rarely up to 2 m. The wind speed is lower than 10 m.s−1 most of the time (Figure 2b). The winter period is characterized by waves often higher than 2 m (≈5% of the time) and reaching more than 6 m during storm episodes (e.g., 5 March 2018, Figure 2a). Two main forcings can be distinguished: dominant offshore conditions with a NW wind (wind direction > 180°, Figure 2b), and less common onshore wind conditions (wind direction < 180°, Figure 2b). Most of the time, strong offshore winds generate offshore-directed swells that have no impact on the study site and are thus not shown here for sake of clarity. Offshore conditions occur throughout the year, but are more energetic in winter, when the wind can reach speeds of around 10 to 15 m.s−1 for several days, e.g., 27 January 2022 to 3 February 2022 or 28 September 2018 to 5 October 2018 (Figure 2b). Atmospheric pressure is usually high (≈1010 hPa) during offshore wind periods, and precipitation is scarce or non-existent due to mainly anticyclonic conditions (Figure 2c). Regarding onshore wind conditions, the most common forcing is represented by low-amplitude waves (Hs < 1 m) accompanied by sea breezes. Storms are common during the winter period, and swells can reach daily average heights close to 6 m with wind speeds > 20 m.s−1 (see 6 March 2018, Figure 2). Atmospheric pressures are low under stormy conditions (around 980 hPa), and the precipitation that accompanies these episodes can be substantial. Water-level measurements show large variations linked to storm surges in winter that can reach +0.2 m to +0.6 m (Figure 2d).
Long periods of inlet closure are observed in summer when swell and wind conditions are less energetic (usually from late July to late October, Figure 2e). Every year, the first episode of opening takes place during the autumn or even at the beginning of the winter season (e.g., 13 November 2017, Figure 2e). Observations tend to show that the first openings (of major extent) are associated with a succession of sustained offshore wind periods (Figure 2e). Then, several rapid opening/closing episodes can occur during the winter (secondary openings) depending on the weather conditions and water level in the lagoon (e.g., winter 2017/2018). The inlet then returns to a closed configuration during the following spring or summer and may remain closed throughout the summer (e.g., summer 2018, 2019, and 2020) until reopening in winter (e.g., 31 January 2022, Figure 2e). Throughout our study period, no mechanical opening or closing of the inlet was performed.
The first hydrodynamic campaign (Figure 3) allows a better characterization of the water level variations at the site when the inlet is closed (28 February 2019 and on 7 March 2019).
Over the period from 28 February 2019 to 2 March 2019 (Figure 3) the offshore wind speed is dominant with values around 18 m.s−1. The water level increases to reach about +0.3 m at station 2 whereas, at the same time, it reaches only +0.2 m at station 3 (e.g., 28 February 2019, Figure 3e). This difference in water level between these two basins of the lagoon indicates the existence of a slope of the lagoon surface. This transfer of water mass under the effect of the offshore wind generates a current at station 3 (Figure 1), oriented towards the SE with an average speed of about 0.8 m.s−1 (Figure 3f). Similar fluctuations are repeated on four occasions, interspersed with periods of lesser rise in water level (Figure 3e). There appears to be a relationship between the four periods of water level fluctuation (Figure 3e) and the intensification of offshore winds (Figure 3b). During each fluctuation, this transfer of water induces peak currents oriented to the SE, whereas they turn NW during the re-equilibration of the water body when the wind decreases (Figure 3f).
This phenomenon reflects the establishment of a surge induced by offshore winds in the lagoon. Figure 4 shows the variation of effective wind speed (Ve) as a function of the slope of the lagoon water surface between stations 2 and 3. Ve is positive for winds in the S/SE sector (onshore forcing) and negative for winds in the N/NW sector (offshore forcing). An increase in N/NW wind speed results in a sharp increase in lagoon slope, with a high point located along the beach barrier. Maximum slopes of almost 12 cm/km are measured for a NW wind forcing of 13 m.s−1.
During SE storms with Hs around 2 m (Hmax ≈ 3.5 m) and a maximum onshore wind of ≈15 m.s−1 (from 5 March 2019 at 12 pm to 6 March 2019, Figure 3), levels reach their minimum at both stations 2 and 3.
The second hydrodynamic campaign shows the evolution of water level in the southern part of the lagoon (station 2) near the barrier between the beginning of the 2021/2022 winter season and the first opening of the inlet (Figure 5). A strong increase in the lagoon level is observed on 20 November 2021 (Figure 5e) in relation to heavy precipitation, nearly 170 mm over 3 days (Figure 5c), coinciding with a strong easterly wind (Figure 5b). This massive inflow of rain runoff water leads to a rapid increase in the lagoon level (up to +0.7 m in 15 h), which then stabilizes at 1 m before decreasing to a stable level at around 0.8 m (Figure 5e). This evolution of water level does not lead to an opening of the inlet, as the barrier height remains around 1.4 m at this time (Figure 5e). During the months of December and January, only three minor episodes of precipitation are recorded (Figure 5c), without inducing any significant change in water level. Up until 15 December 2021, there are some episodes when offshore wind speeds reach 10 to 15 m.s−1. In the second half of December, a few low-intensity wave episodes (<1.5 m) could eventually bring water into the lagoon by slight overtopping (Figure 5d). After 20 January 2022, the offshore wind strengthens and stabilizes above 10 m.s−1, to reach an average of more than 20 m.s−1 (Figure 5b); at the same time, there is no swell (Figure 5a) and the atmospheric pressure is stable around 1015 hPa (Figure 5c). The offshore wind then induces a rise of +0.2 m in the lagoon level, attaining a peak at 0.85 m which also corresponds to the elevation of the barrier. This latter having decreased in altitude of nearly 0.5 m since the month of November 2021 (dropping from 1.4 m to 0.8 m). As a result, this leads to the breaching of the barrier on 31 January 2022 (Figure 5e). After this episode, the lagoon empties rapidly through the inlet into the sea, the level drops by nearly −0.5 m in a few hours and continues to empty during the following days (Figure 5e).

4.2. Morphological Evolution Associated with Prevailing Meteorological Forcings (2017–2022)

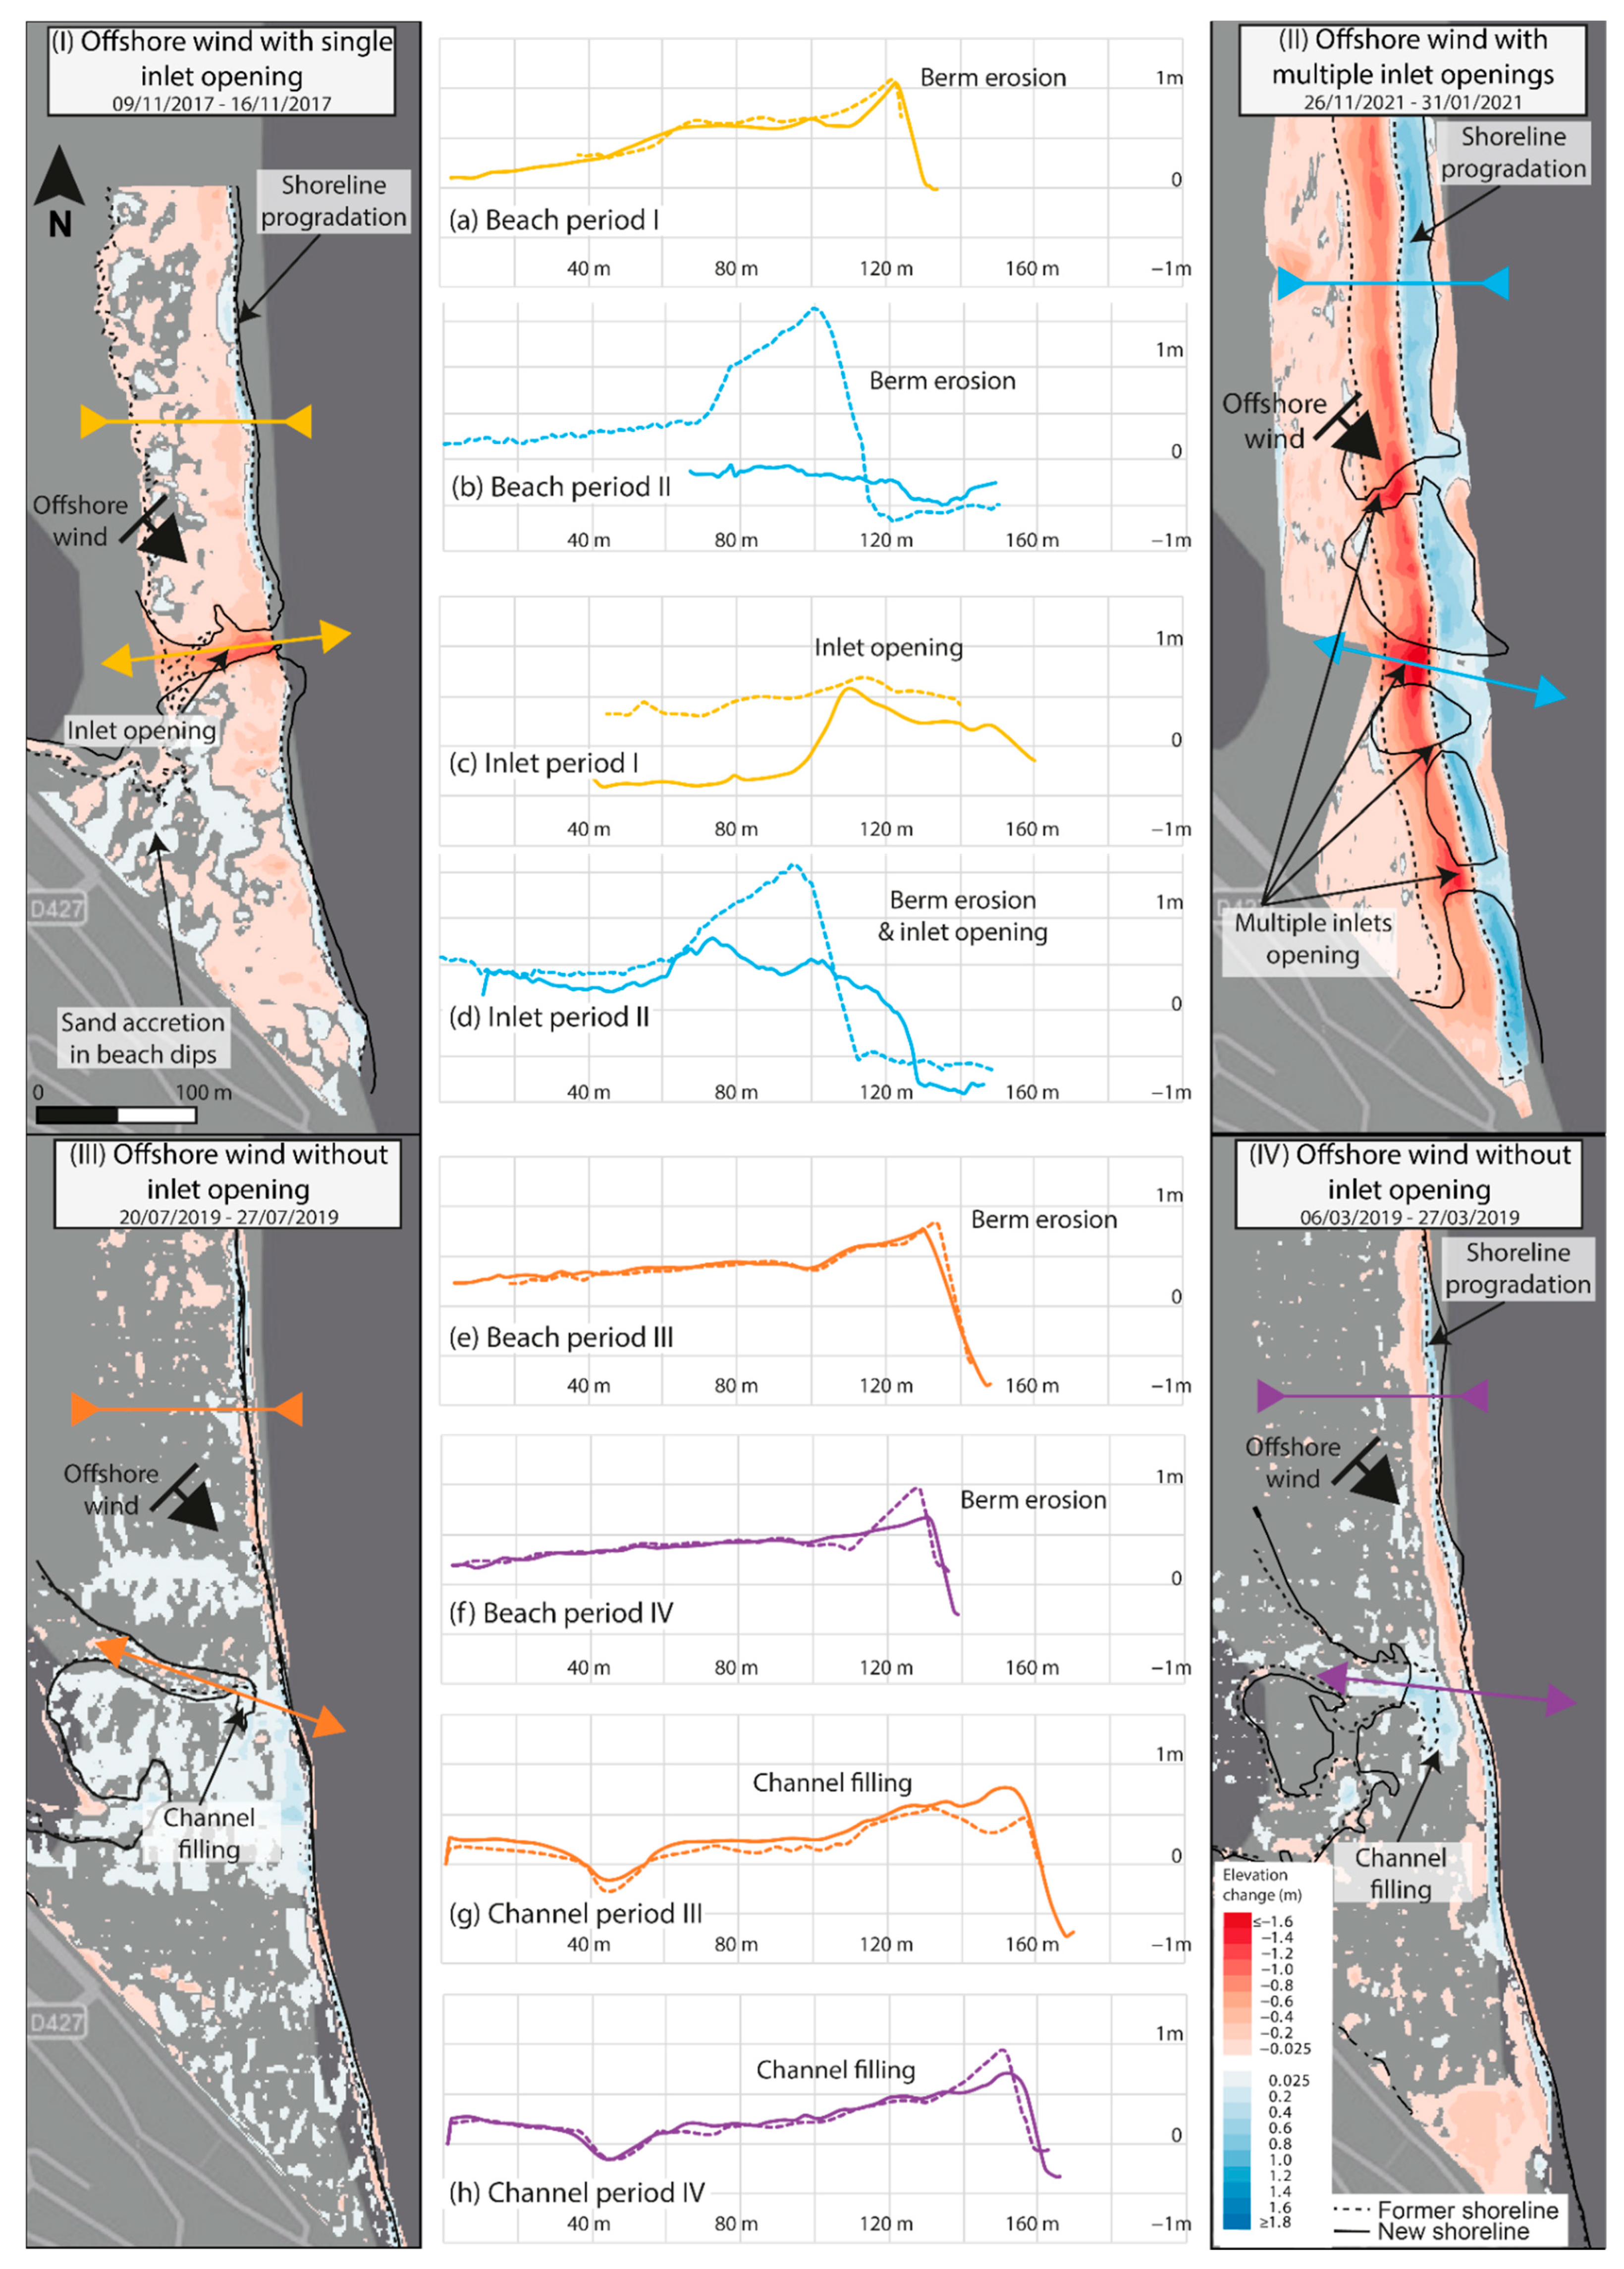
Morphological Evolution during Offshore Wind Forcing

  • The general morphodynamics of the beach under offshore wind conditions
Offshore wind forcing leads to erosion of the beach, particularly the upper and most exposed part of the barrier, which can lose up to 0.2 m in elevation (Figure 6I,II). This erosion is particularly marked on the berm (Figure 6a,e,f), and can reach a maximum of up to 1 m (Figure 6b). The sand is deposited at the shoreline, inducing a seaward progradation of up to several metres in a few days as well as a widening of the beach (e.g., Figure 6I–IV). Some of the windblown sediment can be blocked by anthropogenic development (i.e., along the boardwalk at the southern extremity of the beach, Figure 6I), or are deposited in flooded areas of the lagoon (i.e., in and around the channel, Figure 6III,IV).
During offshore wind episodes, the beach front is rather low-lying, notably around the beach horns which are associated with areas of even lower elevation (−0.2 m), thus inducing a higher vulnerability to breaching events (Figure 7). These low points connect the subaerial beach to the crescentic nearshore bar system.
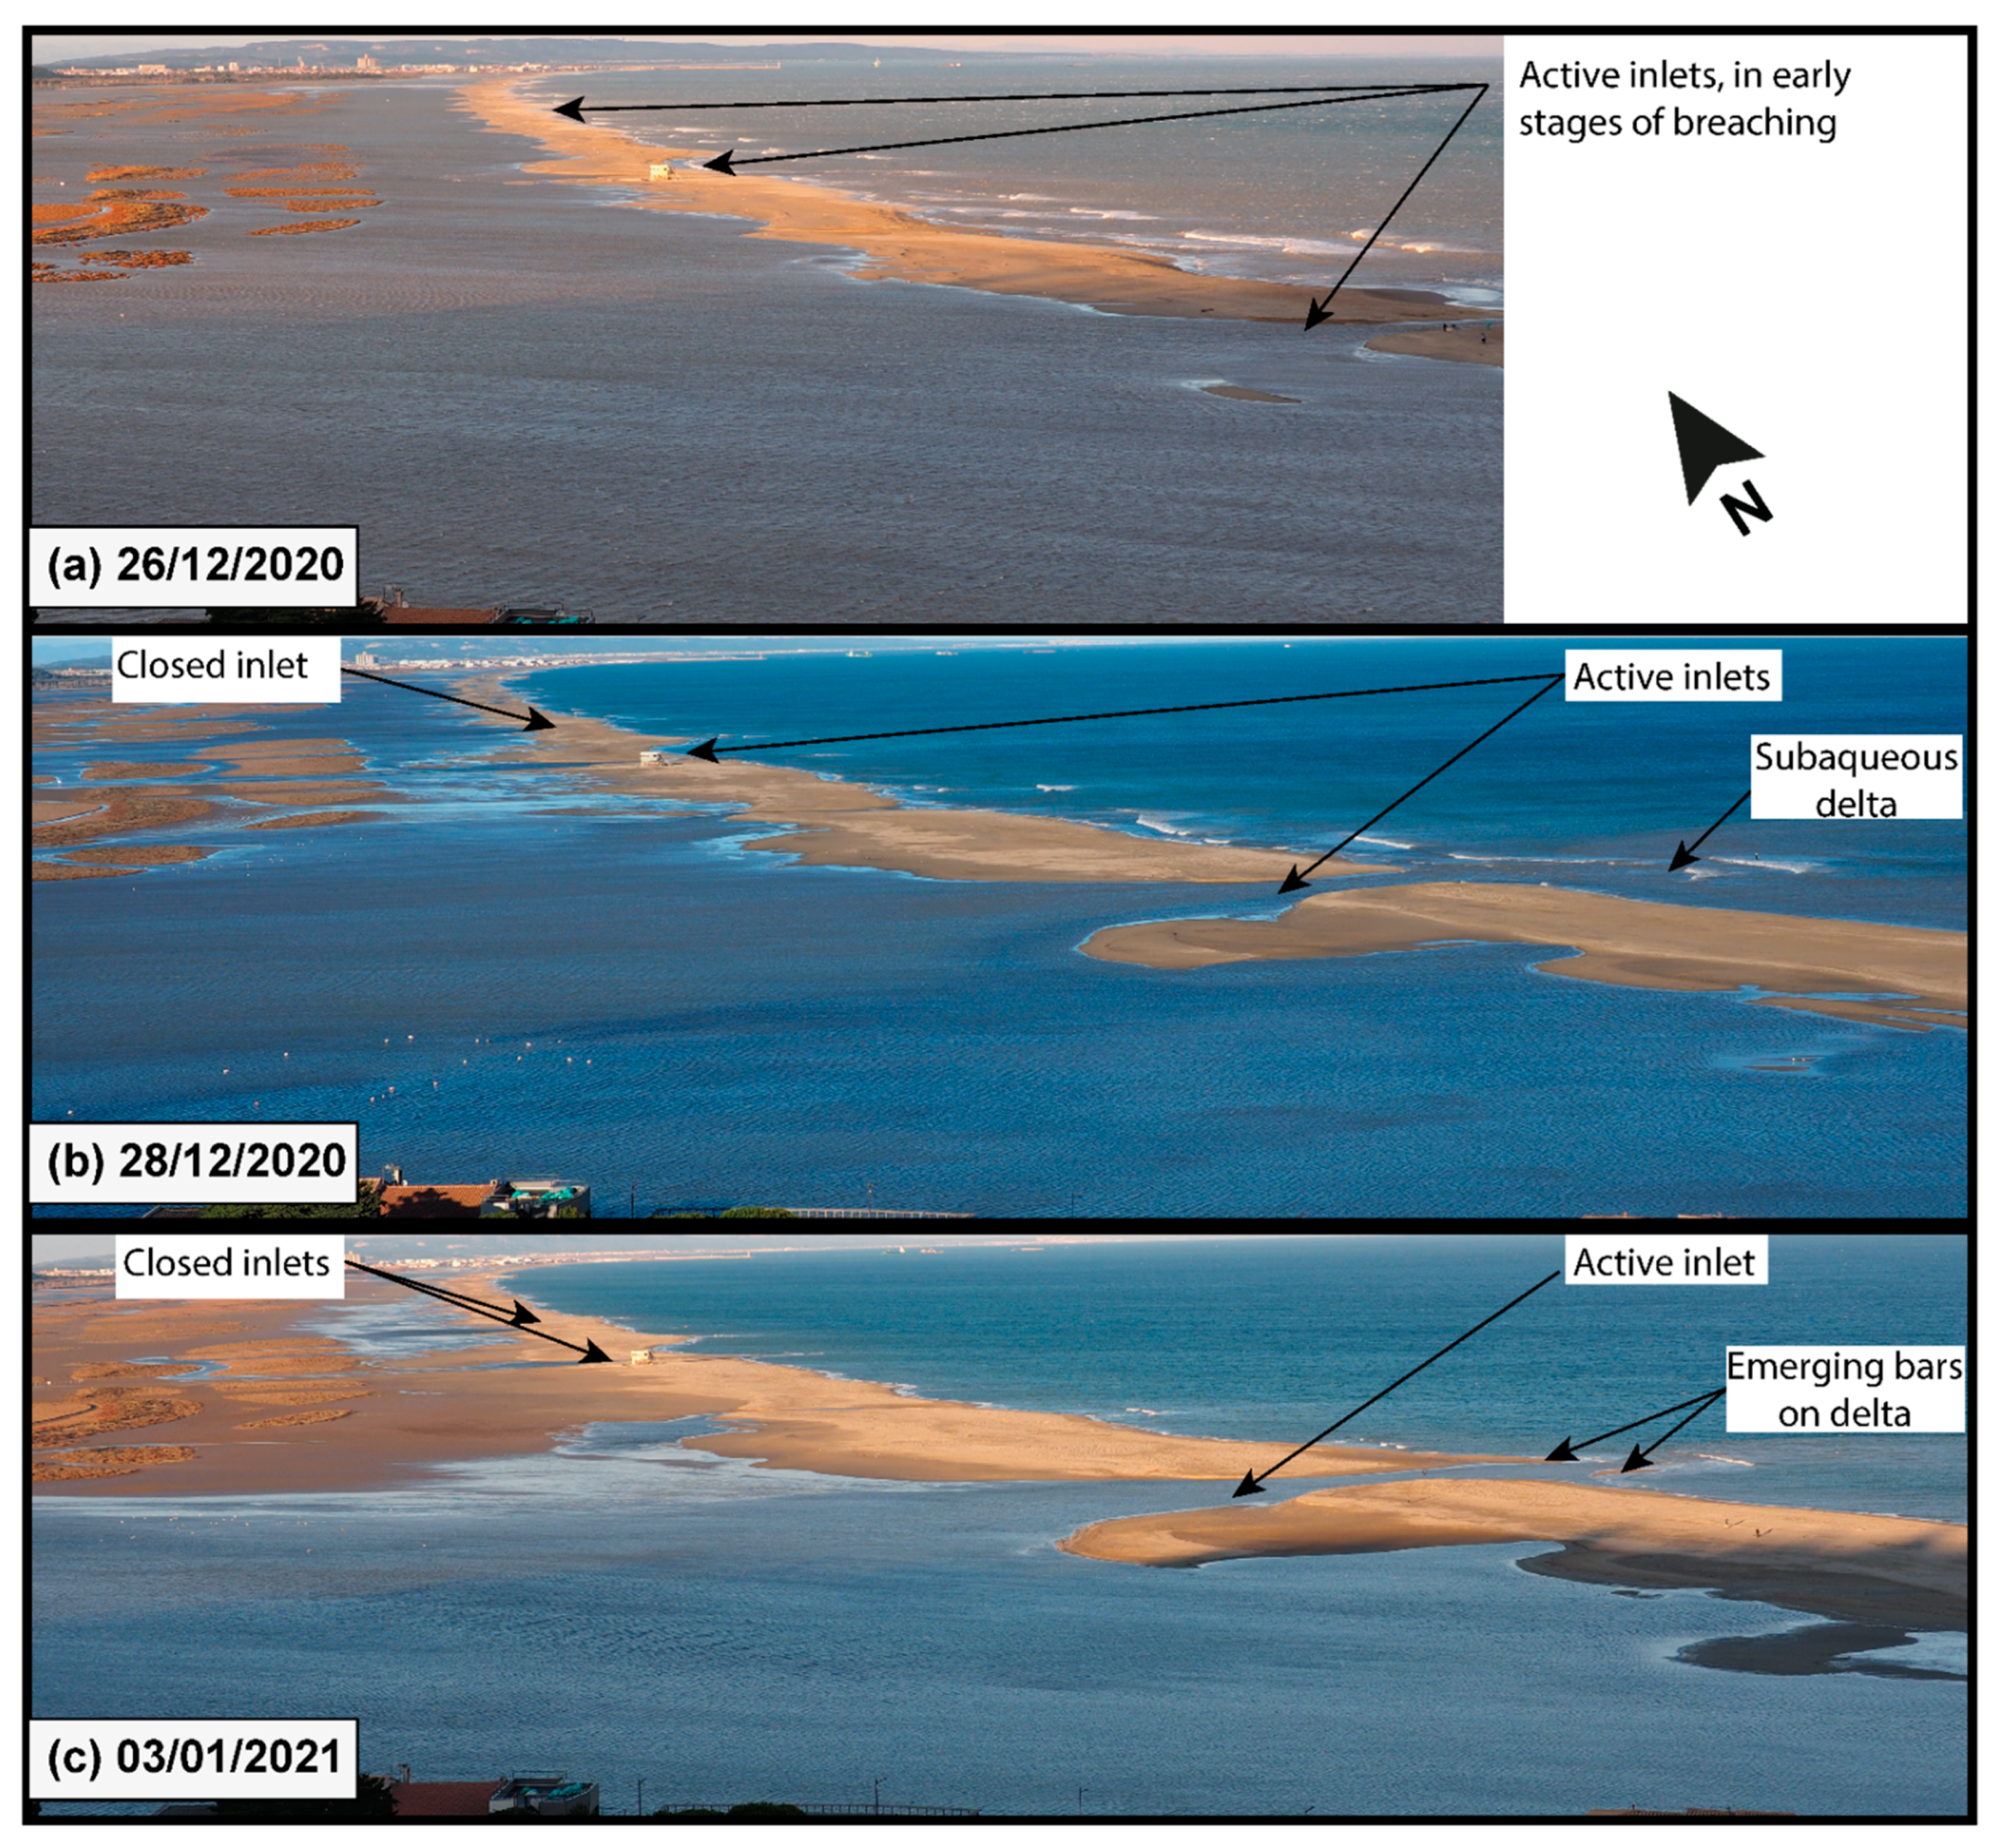
  • Major opening phases
Openings are said to be major when they involve a barrier of large dimensions (Figure 8a,b). Without considering the pre-existing channel morphology (Figure 6I,c,II,b), they take place most often at the end of the summer after long periods of closure (Figure 2). These openings are characterized by the erosion of large amounts of sediment from the backshore and berm (Figure 6I,II) due to the reworking of a massive barrier (Figure 6c,d), but develop in the absence of any pre-existing channel morphology in the lagoon (Figure 6I,c,II,b). Following the opening, the lagoon outflow rapidly results in the incision of a channel (Figure 6I,II) which can reach 0.6/0.8 m in depth (Figure 6b,d). Sediment is deposited offshore near the inlet mouth (e.g., Figure 6II) and, in some cases, a subaqueous delta is formed (Figure 7 and Figure 9b).
During high-intensity offshore wind events associated with high lagoon water level, it is possible to observe the simultaneous opening of multiple active inlets (Figure 6II and Figure 9). This state is transient but can last from a few hours to several days before lowering of the water level dries out the northern inlets (Figure 9a,b). Only the southernmost inlet remains and continues to drain the lagoon (Figure 9c).
  • Secondary opening phases
After the initial major inlet opening, the main channel is well marked (Figure 6I,II and Figure 8b) and the closing phases during the winter only lead to filling of the entrance (Figure 8c,f,h), while leaving a well-marked channel. Openings are said to be secondary when the inlet morphology in the lagoon creates a weak zone in the barrier which conditions subsequent inlet openings by directing the water flow (Figure 8c–d,g–h).
  • Morphological evolution during onshore forcing
Onshore forcing is associated with two distinct types of conditions: low-energy E/SE swell (Hs < 2 m), which is relatively common, and rarer higher-energy but very short-lived storm events (Hs > 2 m).
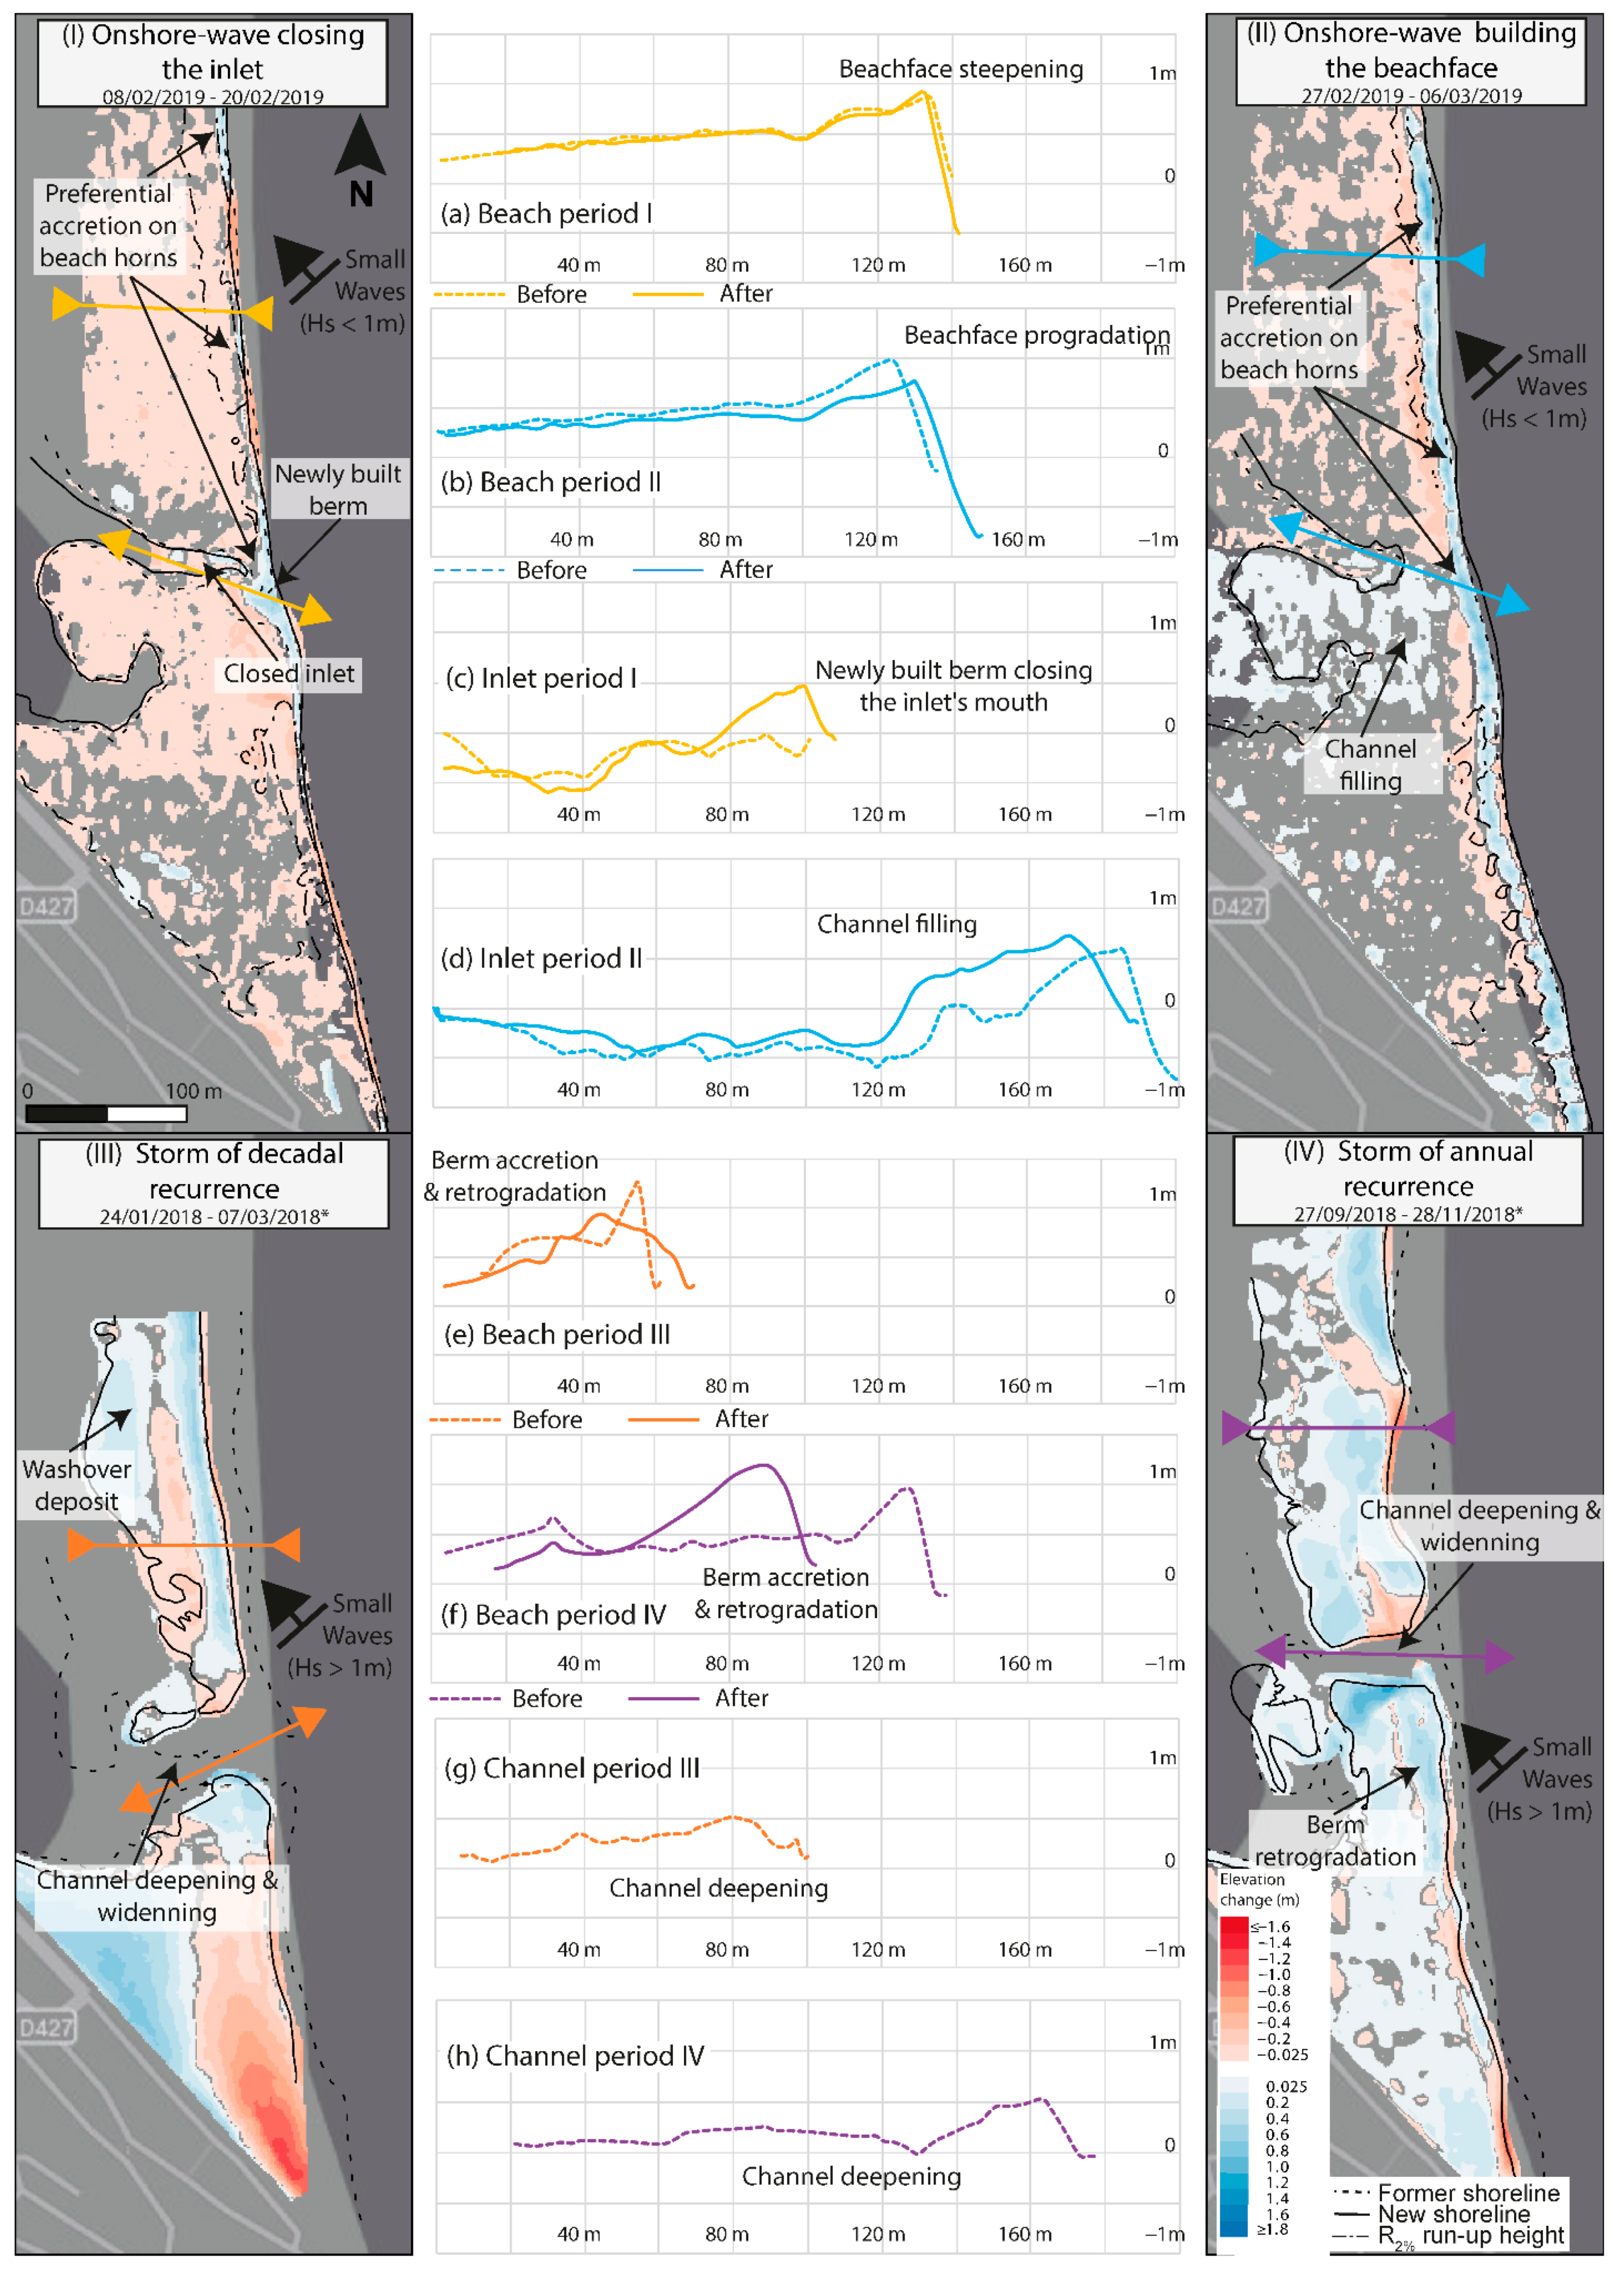
  • Low-energy conditions (Hs < 2 m)
In the case of low-amplitude onshore waves, the maximum run-up usually only reaches the crest of the berm, so that the morphogenic impact is concentrated on the beach-face.
Low-amplitude onshore wave conditions are relatively constructive and create a narrow berm close to the shoreline (Figure 10a,b). Wave action leads to the preferential accumulation of sediment at the horns of the beach megacusps and slight erosion in the embayments (Figure 10I,II). These conditions of constructive forcing over a long period of time result in a sloping shoreface with a relatively high berm, between 0.9 and 1.2 m (Figure 10a,b).
This sediment input on the beachface can lead to closure of the inlet, especially when the inputs are concentrated on the horns where the inlet mouth is located (Figure 10I,c). In some cases, the morphogenic action of low-amplitude waves extends beyond the beachface and comes to rework the sediments of the subaqueous delta until an emergent sandbar is formed (Figure 9c and Figure 11f). This sandbar can also close the inlet by migrating and welding itself to the coastline. In both cases, the inlet is filled at its mouth by the construction of a berm (Figure 10I,c). This mechanism does not lead to filling of the rest of the inlet channel, which remains at first well marked on the lagoon side where it can locally reach a depth of −0.5 m (Figure 10I,II and Figure 8c,f,h). The filling can take place gradually by overtopping of the berm during swell episodes of moderate intensity (Figure 10II,d) or by the input of sand transported during offshore wind periods (Figure 6III,IV,g,h).
  • High-energy conditions (Hs > 2 m)
During easterly storm events, swell conditions are highly energetic (>2 m) and the beach is completely submerged. Figure 10III,IV illustrates the impact of high-intensity storms, from 1 March 2018, (Hs > 5 m and up to 10 m) (Figure 10III) to early October 2018, (Hs > 3 m and up to 7 m) (Figure 10IV). Large amounts of sediment are deposited on the backshore, forming a new well-marked berm which concentrates most of the sediment supply. The berm is raised 0.2 to 0.7 m higher than the original profile and shows a steeper beachface (Figure 10g,h). These very energetic events are also accompanied by a retreat of the coastline that can attain several tens of metres (Figure 10III,IV) associated with the possible deposition of washover fans (Figure 10III).
These conditions lead to deepening and widening of the inlet, provided that it was already open before the storm (Figure 10III,IV), and may even induce the opening of the inlet if it had been initially closed. However, only one such opening was observed during the monitoring.

5. Discussion

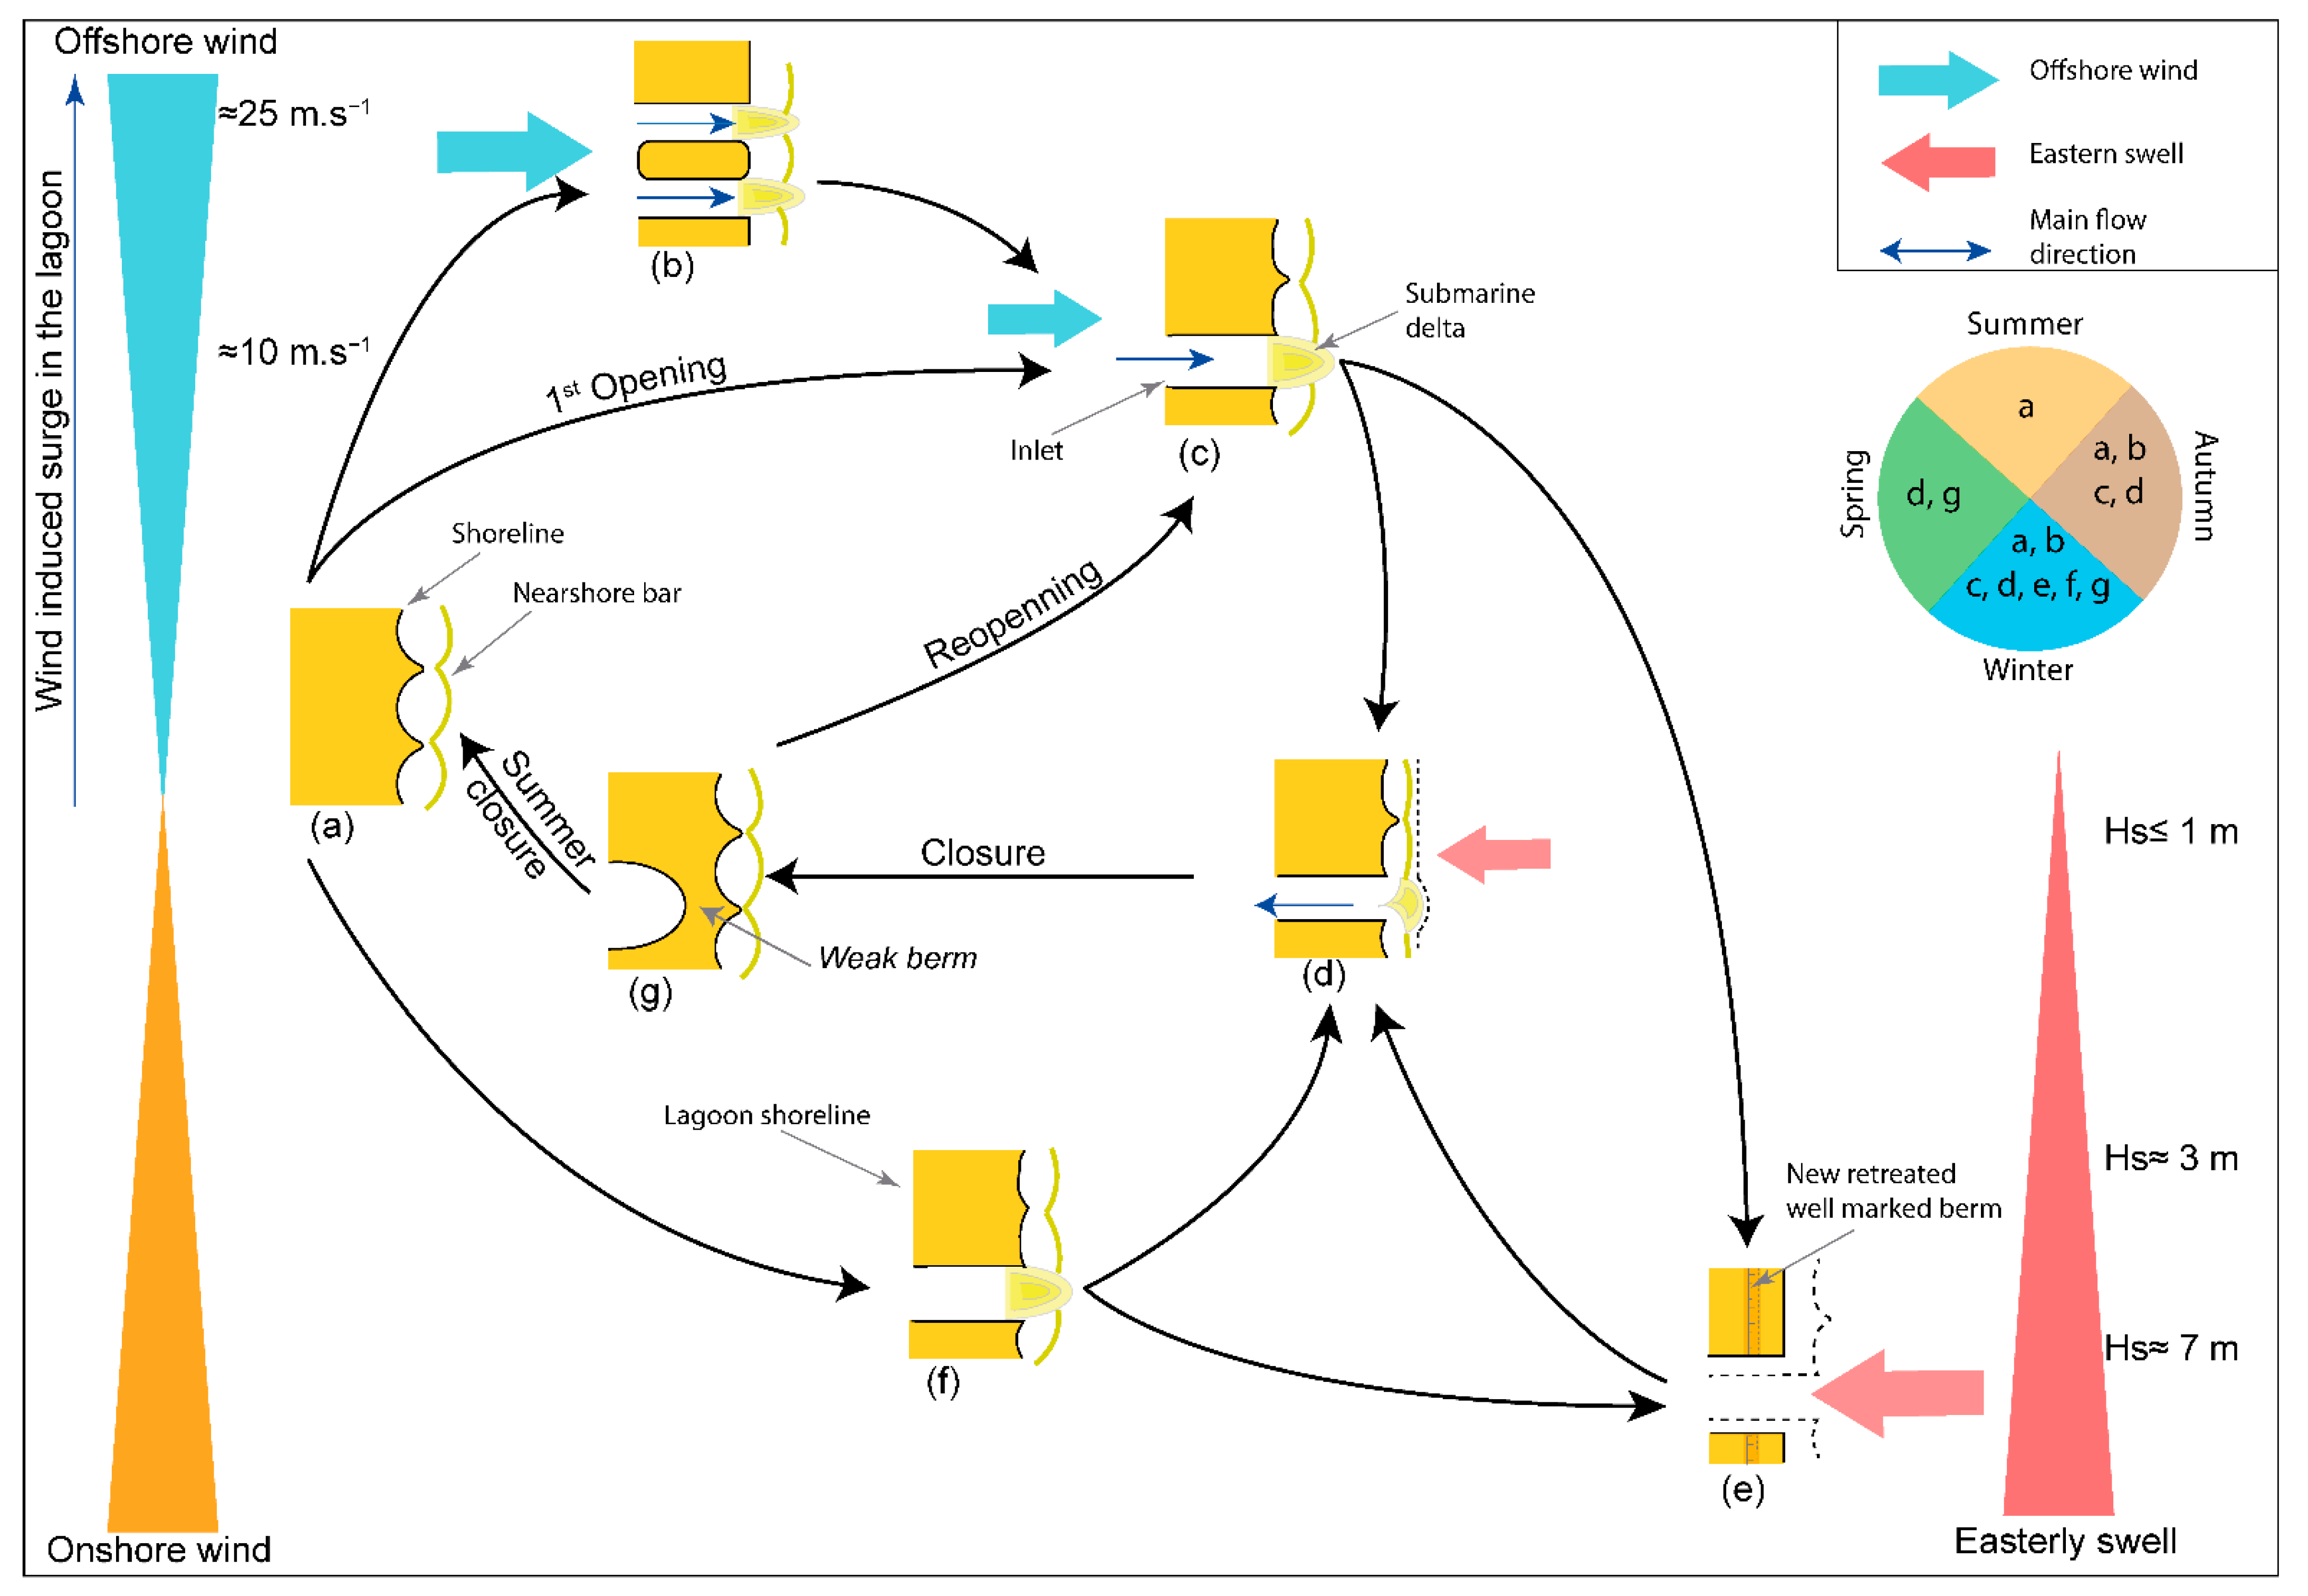
5.1. Morphodynamic Model of an Intermittent Microtidal Inlet

Based on the available data and observations, a morphodynamic model for the evolution of an intermittent inlet in a microtidal environment whose openings are dominated by the action of offshore winds is proposed (Figure 11).

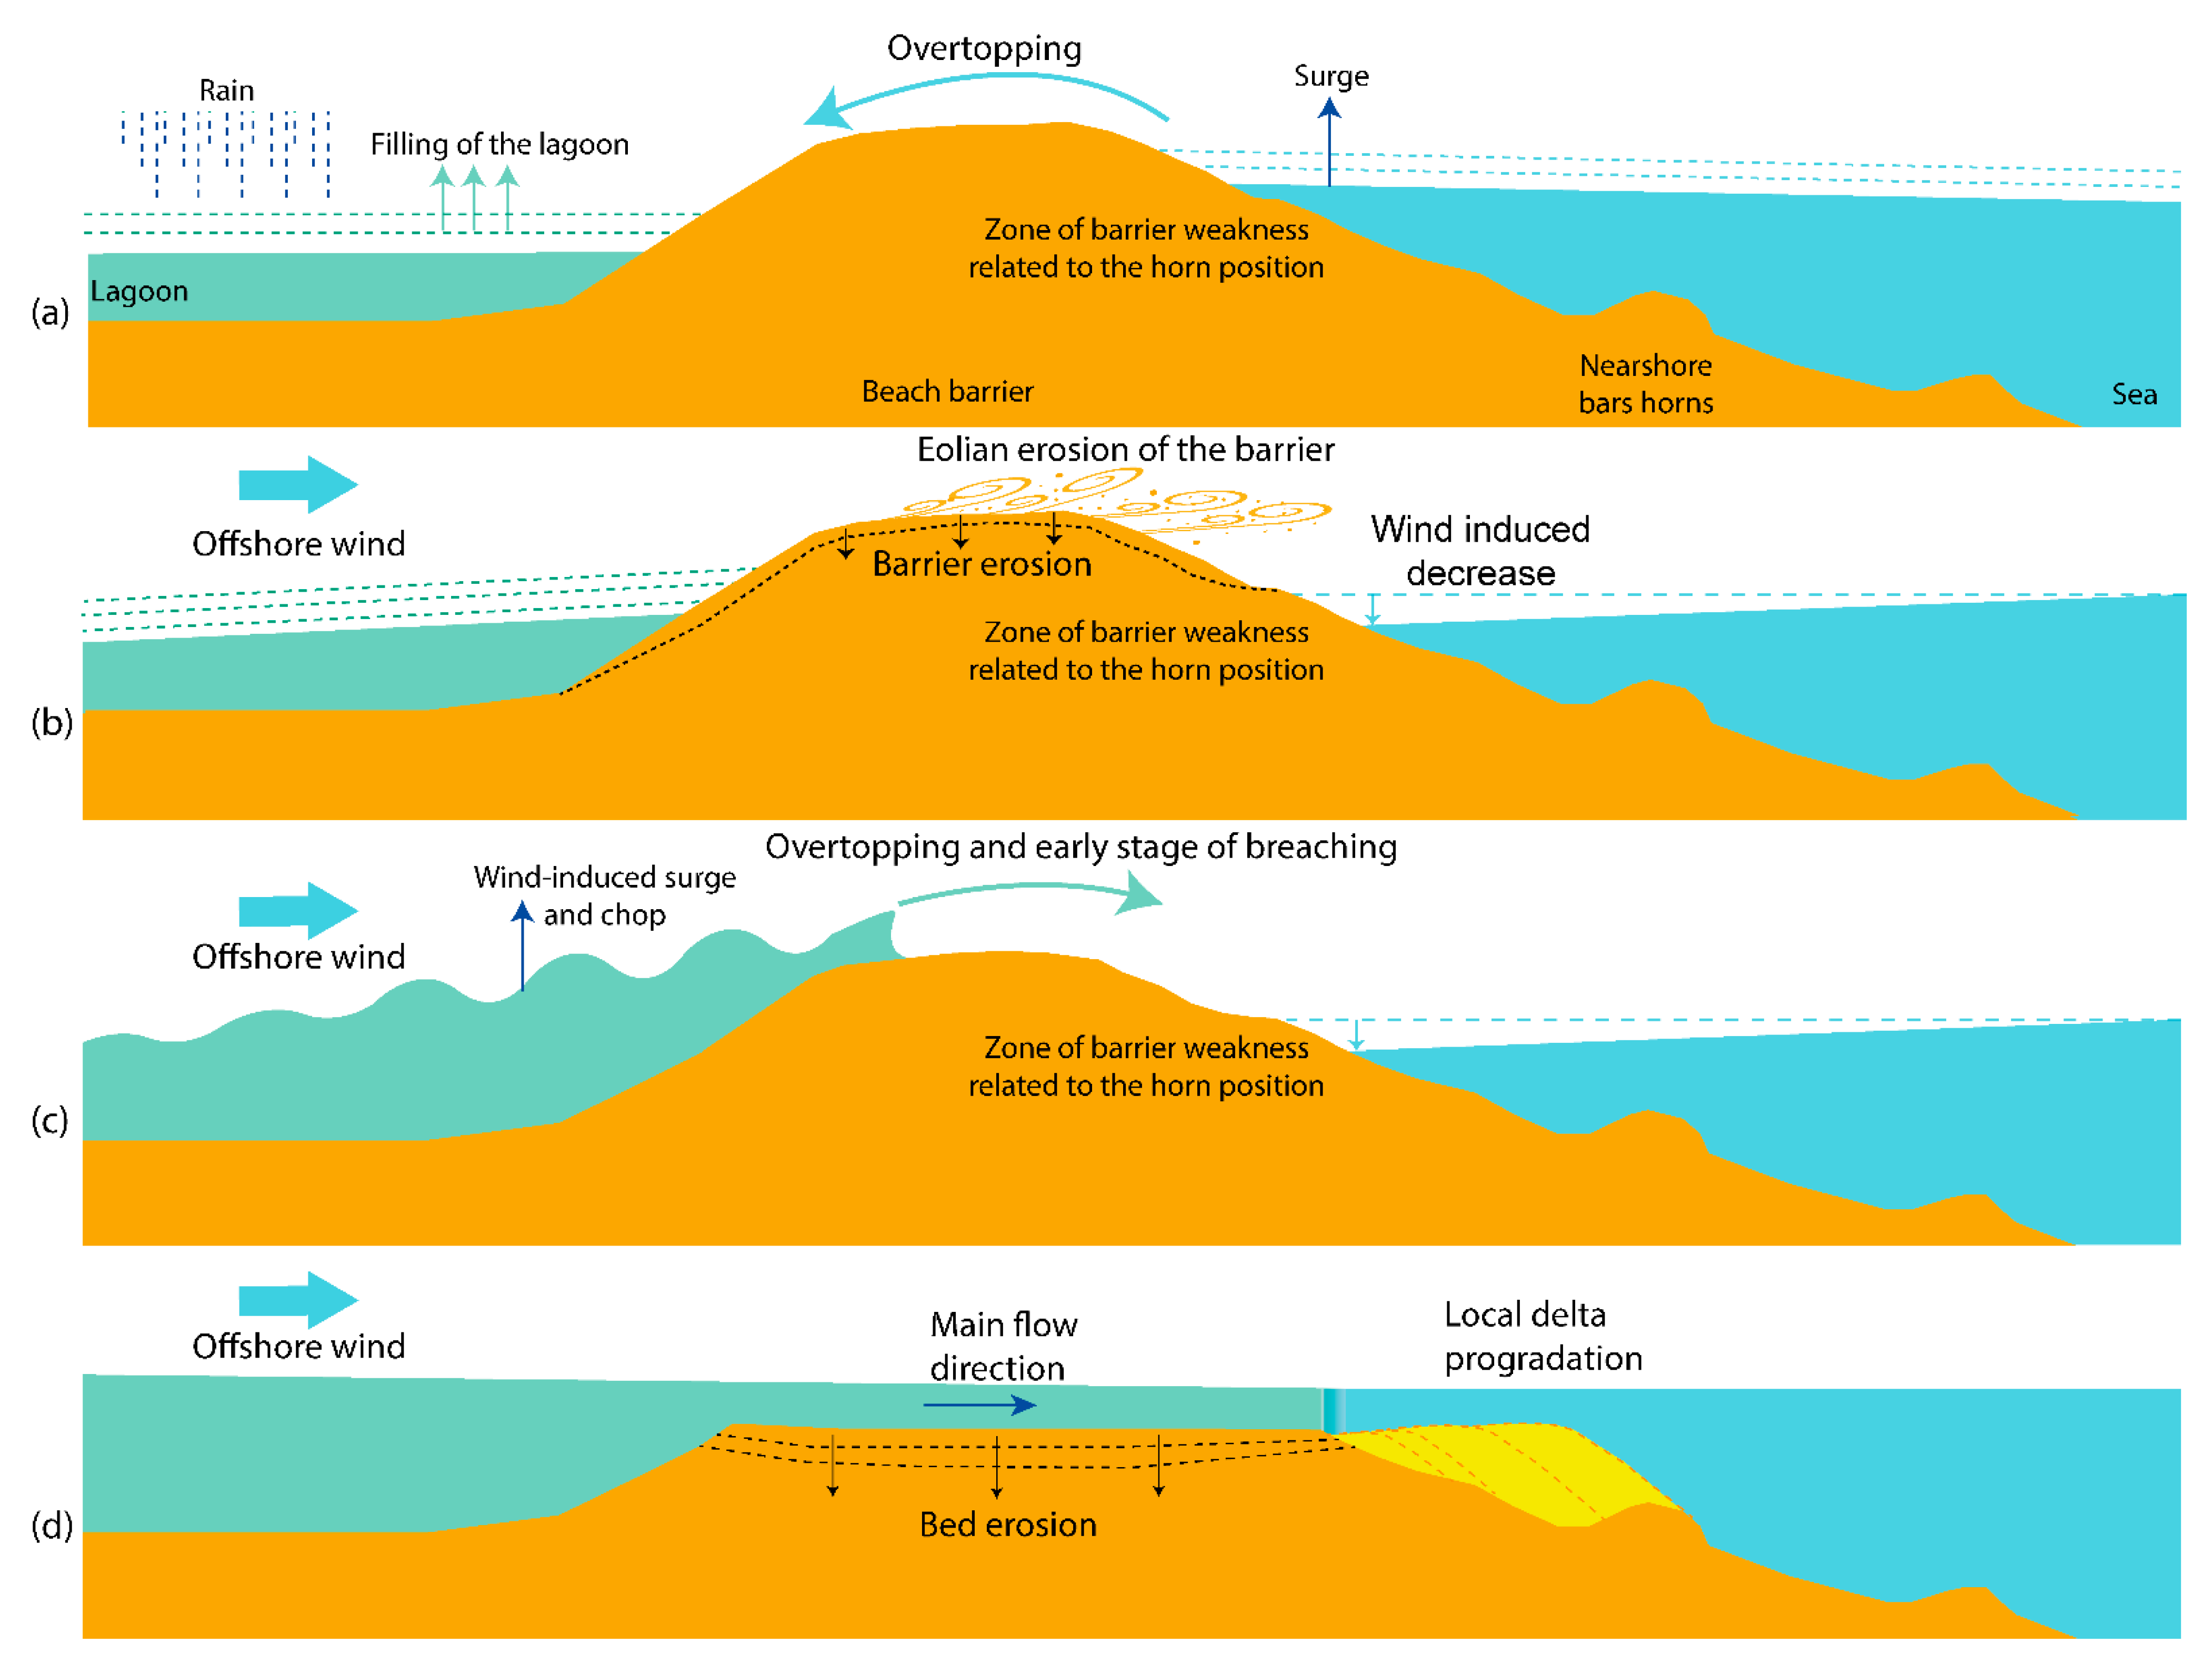
5.1.1. Early Autumn, Beginning of the Annual Cycle with Lagoonal Impounding, and Increasing System Energy

In autumn (Figure 11a), the lagoon is gradually filled by waters derived from precipitation and the inflow of marine waters caused by overtopping of the barrier (Figure 12a). This pre-conditioning phase is essential in the evolution of the system, and can be relatively long, of the order of several months (Figure 2e and Figure 12a). During this period, the offshore wind events also intensify in duration and speed, while the influence of the offshore swell remains insignificant. However, wind is an essential parameter controlling the deflation and erosion which lowers the beach (Figure 12b). The offshore wind sweeps the surface sand towards the shoreline, where its deposition creates a significant progradation. Beach megacusp horns are particularly involved in this process since they exhibit a high degree of lowering and spreading out. Some of the sand transported from the backshore may accumulate in specific zones, such as around anthropic structures on the seafront in the south of the studied area, forming aeolian accretionary prisms. Alternatively, water table outcrops can locally create pellicular or even thicker accumulations. The presence of these small sandy landforms may constrain the later position of the inlet.
Similar phenomena are commonly observed in environments where offshore winds prevail. The sediment transport on the beach is mainly directed seaward [50,51], thus allowing beach deflation and progradation of the beachface [54,55].

5.1.2. Late Autumn, the First Major Opening of the Inlet

In addition to lowering the beach profile due to erosion processes, offshore winds cause a tilting of the lagoon water surface towards the barrier (Figure 12b); strong offshore winds can blow for weeks during this period. The amplitude of these surges is controlled by the shape of the basin (area and depth) as well as by the wind speed [44,45,46,47,48]. The surges are intensified by increasing basin length, higher wind speed, and increasingly shallow water depth. They may be comparable in magnitude to floods produced by river flows. In La Franqui, the shallow depth of the lagoon and its elongated shape in the direction of the prevailing offshore wind are favourable for the formation of a considerable wind tide (in terms of water depth) against the barrier.
Therefore, surges in La Franqui lagoon can lead to opening of the inlet when the topography of the beach allows overtopping by lagoonal waters. The barrier will be breached in front of the beach horns since these areas represent connections between the subaerial beach and the nearshore bar system. These areas also correspond to sectors where the berm is lowest, allowing lagoon waters to preferentially pass through. The surge in the lagoon combined with small choppy waves behind the barrier (Figure 12c), the scouring of the beach by the wind and the possible set-down on the nearshore, will lead to failure at one of the weak points in the berm represented by beach horns (Figure 11c). Such control of beach morphology by nearshore bar geometry and surf-induced circulation cells is common on open sandy beaches [70,74,75,76,77]. By contrast, the relationship between beach morphology and inlet functioning appears to be poorly studied.
If the lagoon surge is of large amplitude (e.g., very strong offshore wind over several days, >20 m.s−1), several inlets can form simultaneously along the shoreline and persist for a few hours or days (Figure 11b), before some of them are abandoned and the system tends to an equilibrium configuration with a single inlet. At La Franqui, only the southernmost one remains open as it is located in the wind axis opposite the lagoon’s water mass, and because it is the deepest part of the lagoon.
A second but much less frequent opening mechanism can occur during the most severe marine storms accompanied by major submergence of the barrier; these forcing conditions also lead to a massive rupture of the barrier (Figure 11f).
Regardless of the opening process, the outflow from the inlet locally erodes the barrier and excavates sediment on its bed which is deposited as an underwater delta at the mouth (Figure 12d).

5.1.3. Inlet Dynamics over the Winter Period

The inlet can undergo rapid closure and reopening phases over a period of days to weeks depending on alternating weather conditions and lagoon levels (Figure 11c,d,g). The duration of the closures is too short for the beach to return to a well-built state at the inlet location.
Closures occur when the offshore wind ceases, and moderate easterly wave action becomes the dominant forcing. These highly morphogenic conditions favour reworking of the available nearshore sediments, leading to the formation of a sandbank that becomes attached to the coastline (Figure 11d). If the outflow from the lagoon is low, then waves will rework the delta sediments and cause the formation of an emergent sandbar attached to the coastline that will block the inlet as a thin berm until the next opening. This closure mechanism is very similar to the widely described cross-shore transport model where the swell is able to remobilize sediments in the surrounding area or in the nearshore bars, which then nourish the sub-aerial beach, thus filling the outlet [4,12,19,37,39,40]. As regards the speed of closure of these inlets, the smaller the width of the channel, the faster it closes. For small inlets (such as La Franqui), the closure time is of the order of a few hours and can reach several days. For larger systems, the closure speed can range from several weeks to several months [7].
Following this inlet closure at the front of the barrier, a rather deep channel will remain at the back of the berm as a trace of the main opening phase. The berm blocking the inlet is rather narrow and not very high, which facilitates submergence during marine-dominated episodes, thus contributing to the recharge of the lagoon with marine waters. The fragility of the inlet mouth berm means that it cannot persist during subsequent offshore wind events coupled with high water levels in the lagoon. The former delimitation of the channel in the lagoon will help to guide the reopening by channeling the flow of lagoon waters and creating a weak zone behind the barrier (Figure 11c–g). These episodes of short duration are referred to here as secondary openings or closures.

5.1.4. Response to Easterly Winter Storms

Due to strong swell, the coastline records a major retrogradation that can reach several tens of metres and a new well-marked berm is formed at a higher position on the beach (Figure 11e). Regarding the functioning of the inlet, several situations are possible.
  • The inlet is closed when the storm occurs and strong flooding can lead to breaching of the beach barrier (Figure 11f). However, this phenomenon is rare (only 1 of the 27 openings observed during our monitoring period). The exact moment of the rupture is not well identified, but it is strongly linked to the large quantities of sea water filling the lagoon and the submergence of the barrier;
  • The inlet remains closed if conditions are not dynamic enough to cause a breach. In this case, the inflow of water will fill the lagoon and lead to flooding of the barrier which may facilitate a future opening during offshore winds in the following days or weeks;
  • The inlet is already open at the time of the storm, in which case it will be deepened and widened by currents generated by storm surge action, flooding, or possible watershed discharge usually associated with cyclonic storms (Figure 11e);
Later, the residual small swell following storms can lead to a rapid reconstruction and progradation of the beach. However, this process is strongly dependent on the sediment availability and the characteristics of the storm decay stage.

5.1.5. Spring, Last Closure at the End of the Annual Cycle with Decreasing System Energy

During late spring, when the offshore wind is weaker and less frequent, the moderate onshore wave conditions are constructive, and the less energetic hydrodynamic conditions cause the inlet to close over the entire summer season.

5.1.6. Summer, Evolution under Low-Energy Hydrodynamic Conditions

The inlet is closed, offshore winds are less intense, and moderate onshore wave conditions will consolidate the barrier and fill the channel with sand forming a strong beach barrier along the whole coast (Figure 11g back to a). The level in the lagoon is lower due to the high rate of evaporation in a Mediterranean climate and the almost complete absence of marine inflow by submersion.
The return of autumn forcing, dominated by strong offshore wind events, will initiate another annual morphodynamic cycle (Figure 11a).

5.2. Comparison of Control Parameters Commonly Accepted in the Literature

In the literature, the more inclusive term, “intermittent estuaries” used in this article are also referred to as ICOLL, Intermittently Closed/Open Lakes and Lagoons [78]; TOCE, Temporarily Open/Closed Estuaries [79]; seasonally open inlets [4,12]; bar-built estuaries [1,80] or IOCE, Intermittently Open/Closed Estuaries [7,81].
For these estuaries, openings are mostly caused by rising lagoon levels following strong fluvial discharge [12,39,82]. In the case of La Franqui, a sufficiently high water level in the lagoon before an offshore wind event is an essential but not sufficient condition to induce an opening. Over the observation period, the effect of precipitation alone is insufficient to cause an opening of the inlet. In some cases, openings can also be caused by storms, during which high-energy overwashes will breach the barrier [3]. At La Franqui, out of the 27 openings observed during the monitoring period, only one was caused by a storm. Flooding associated with storms is, however, still important and can represent a significant inflow of water to the lagoon when the inlet is closed [64,65]. A more complex opening mechanism can also be observed coupling the impact of storm swell submergence with flooding generated by heavy precipitation (flash floods) [33,34,35]. Although observed at many Mediterranean sites, this phenomenon is difficult to consider in the case of the study site since there is no river discharge into the lagoon. At La Franqui, river discharges are small, no major rivers flow into the lagoon, and the catchment area is small. Freshwater inflows through the karst system (3 to 25 × 103 m3.d−1) are also well below the discharges normally attained by rivers in flood [68]. Nearly all the observed openings (26 out of 27) are a consequence of offshore wind events that lower the barrier height and create a surge into the lagoon. These two controlling factors are not discussed on other intermittent estuaries to the best of our knowledge.
At most intermittent estuaries, closures occur when the outflow from the estuary (related to riverine inputs or tidal currents) is no longer sufficient to remove the sand deposited by coastal processes such as longshore and cross-shore transport [4,12,37,40,41,83]. These processes bring sand into the inlet and can have several origins. The primary driver of inlet filling is the tide, and its action begins with the first flood tide that follows establishment of the inlet. Sand from the nearshore zone is transported into the inlet by tidal currents and then deposited there. The ability of ebb currents to export sand from the inlet is limited by a lower flow velocity than during the flood tide, resulting in a net import of sand during the tidal cycle [84]. This tidal asymmetry is exacerbated by the inlet filling, which further promotes the net inflow of sand. However, at the study site, the tidal range is small, around 0.3 m at mean spring tide, which reduces the tidal transport capacity. In addition, studies have shown that the tidal signal propagates very little across the inlet, and not at all into the lagoon [67]. Onshore sediment transport, generated by wave asymmetry (outside of storms), has a tendency to bring sediment from the nearshore towards the coastline [85], and this also tends to fill the inlet if the outflow current is weak enough to allow deposition [4,12,19,37,39,40,41,86]. At La Franqui, this phenomenon of sediment deposition by the swell causes the closure of the inlet. Individual storm events can facilitate berm and inlet deposition at the entrances of intermittent estuaries when large waves increase the rates of onshore sediment transport [87,88]. At the study site, the massive sediment deposition observed on the upper part of the beach under storm conditions does not lead to the closure of the inlet, but rather to its deepening and widening. This may be due to the low-lying nature of the beach, meaning that storm surges can shift the active surf zone onto the barrier. This causes large amounts of water to flow into the channel, preventing synchronous storm sediment deposition. Finally, for straight shorelines subject to oblique swells, closures can be caused by longshore transport when it dominates the river flow, leading to migration of the downstream spit, displacement of the inlet and finally to its closure [4,37,38]. Here, the longshore current is oriented from south to north [63], but the presence of Cape Leucate deflects the main flow offshore, thus restricting or impeding the longshore transport of sand [89].
Finally, to the best of the authors’ knowledge, the impact of dominant wind forcing on the dynamics of intermittent estuaries does not seem to have been studied elsewhere and is merely considered as a minor parameter. Nevertheless, this factor may be important in the dynamics of other intermittent estuaries under similar environmental conditions (i.e., prevailing offshore wind, microtidal coast, and no river discharges into the lagoon). Such estuaries can be found not only in the Gulf of Lions, but also on a significant part of the northern Mediterranean coast.

5.3. Formation of Several Inlets and Self-Organization to a Single Active Inlet

The strongest offshore wind periods are associated with high surge levels in the lagoon, which results in multiple inlets being formed at the beginning of the morphogenic cycle in late autumn. The life span of most of these inlets is relatively short, lasting a few days at most before a single inlet remains. The position of the openings is controlled by the topography of the barrier (both on the lagoon side and on the seaward side), the height of the water, and the surge level in the lagoon. Only the inlet located in the deepest part of the lagoon and oriented in the direction of the main forcing factor will become the main inlet, thus outliving all the other inlets. In the case of this study, the southernmost inlet oriented in the direction of the prevailing offshore wind remains while the other inlets farther north are dried out.
This pattern possibly reflects a phenomenon of self-organization comparable to that involved in the establishment of beach crescents [90,91], shoreline sand waves [92], nearshore bars [93,94,95], or in the dynamics of delta channels [96]. The diversity of controlling factors presented here makes it particularly difficult to carry out numerical modelling of this phenomenon.

6. Conclusions

The aim of this study is to understand the mechanisms controlling the functioning of an intermittent estuary in a microtidal environment in a case where river discharge is too low to explain the breaching of a beach barrier. Our study of inlets on La Franqui beach is based on topographic surveys over a period of five years coupled with high frequency monitoring of lagoon level, swell, and wind conditions. This study shows the importance of offshore wind in the opening phase of an intermittent estuary, whereas the most common opening mechanisms are usually governed by fluvial discharges.
The detailed functioning of the La Franqui inlet is governed by complex processes with feedback effects between hydro-meteorological and morphological forcing parameters. Our results indicate the influence of the following factors:
  • The accumulation of lagoon waters behind the sandy barrier that makes up the beach;
  • The lowering of the berm by wind deflation during intense offshore wind events and the export of sand to nearshore areas, highlighting the importance of exchanges at the coastline;
  • The surge of lagoon waters behind the beach barrier during offshore wind events;
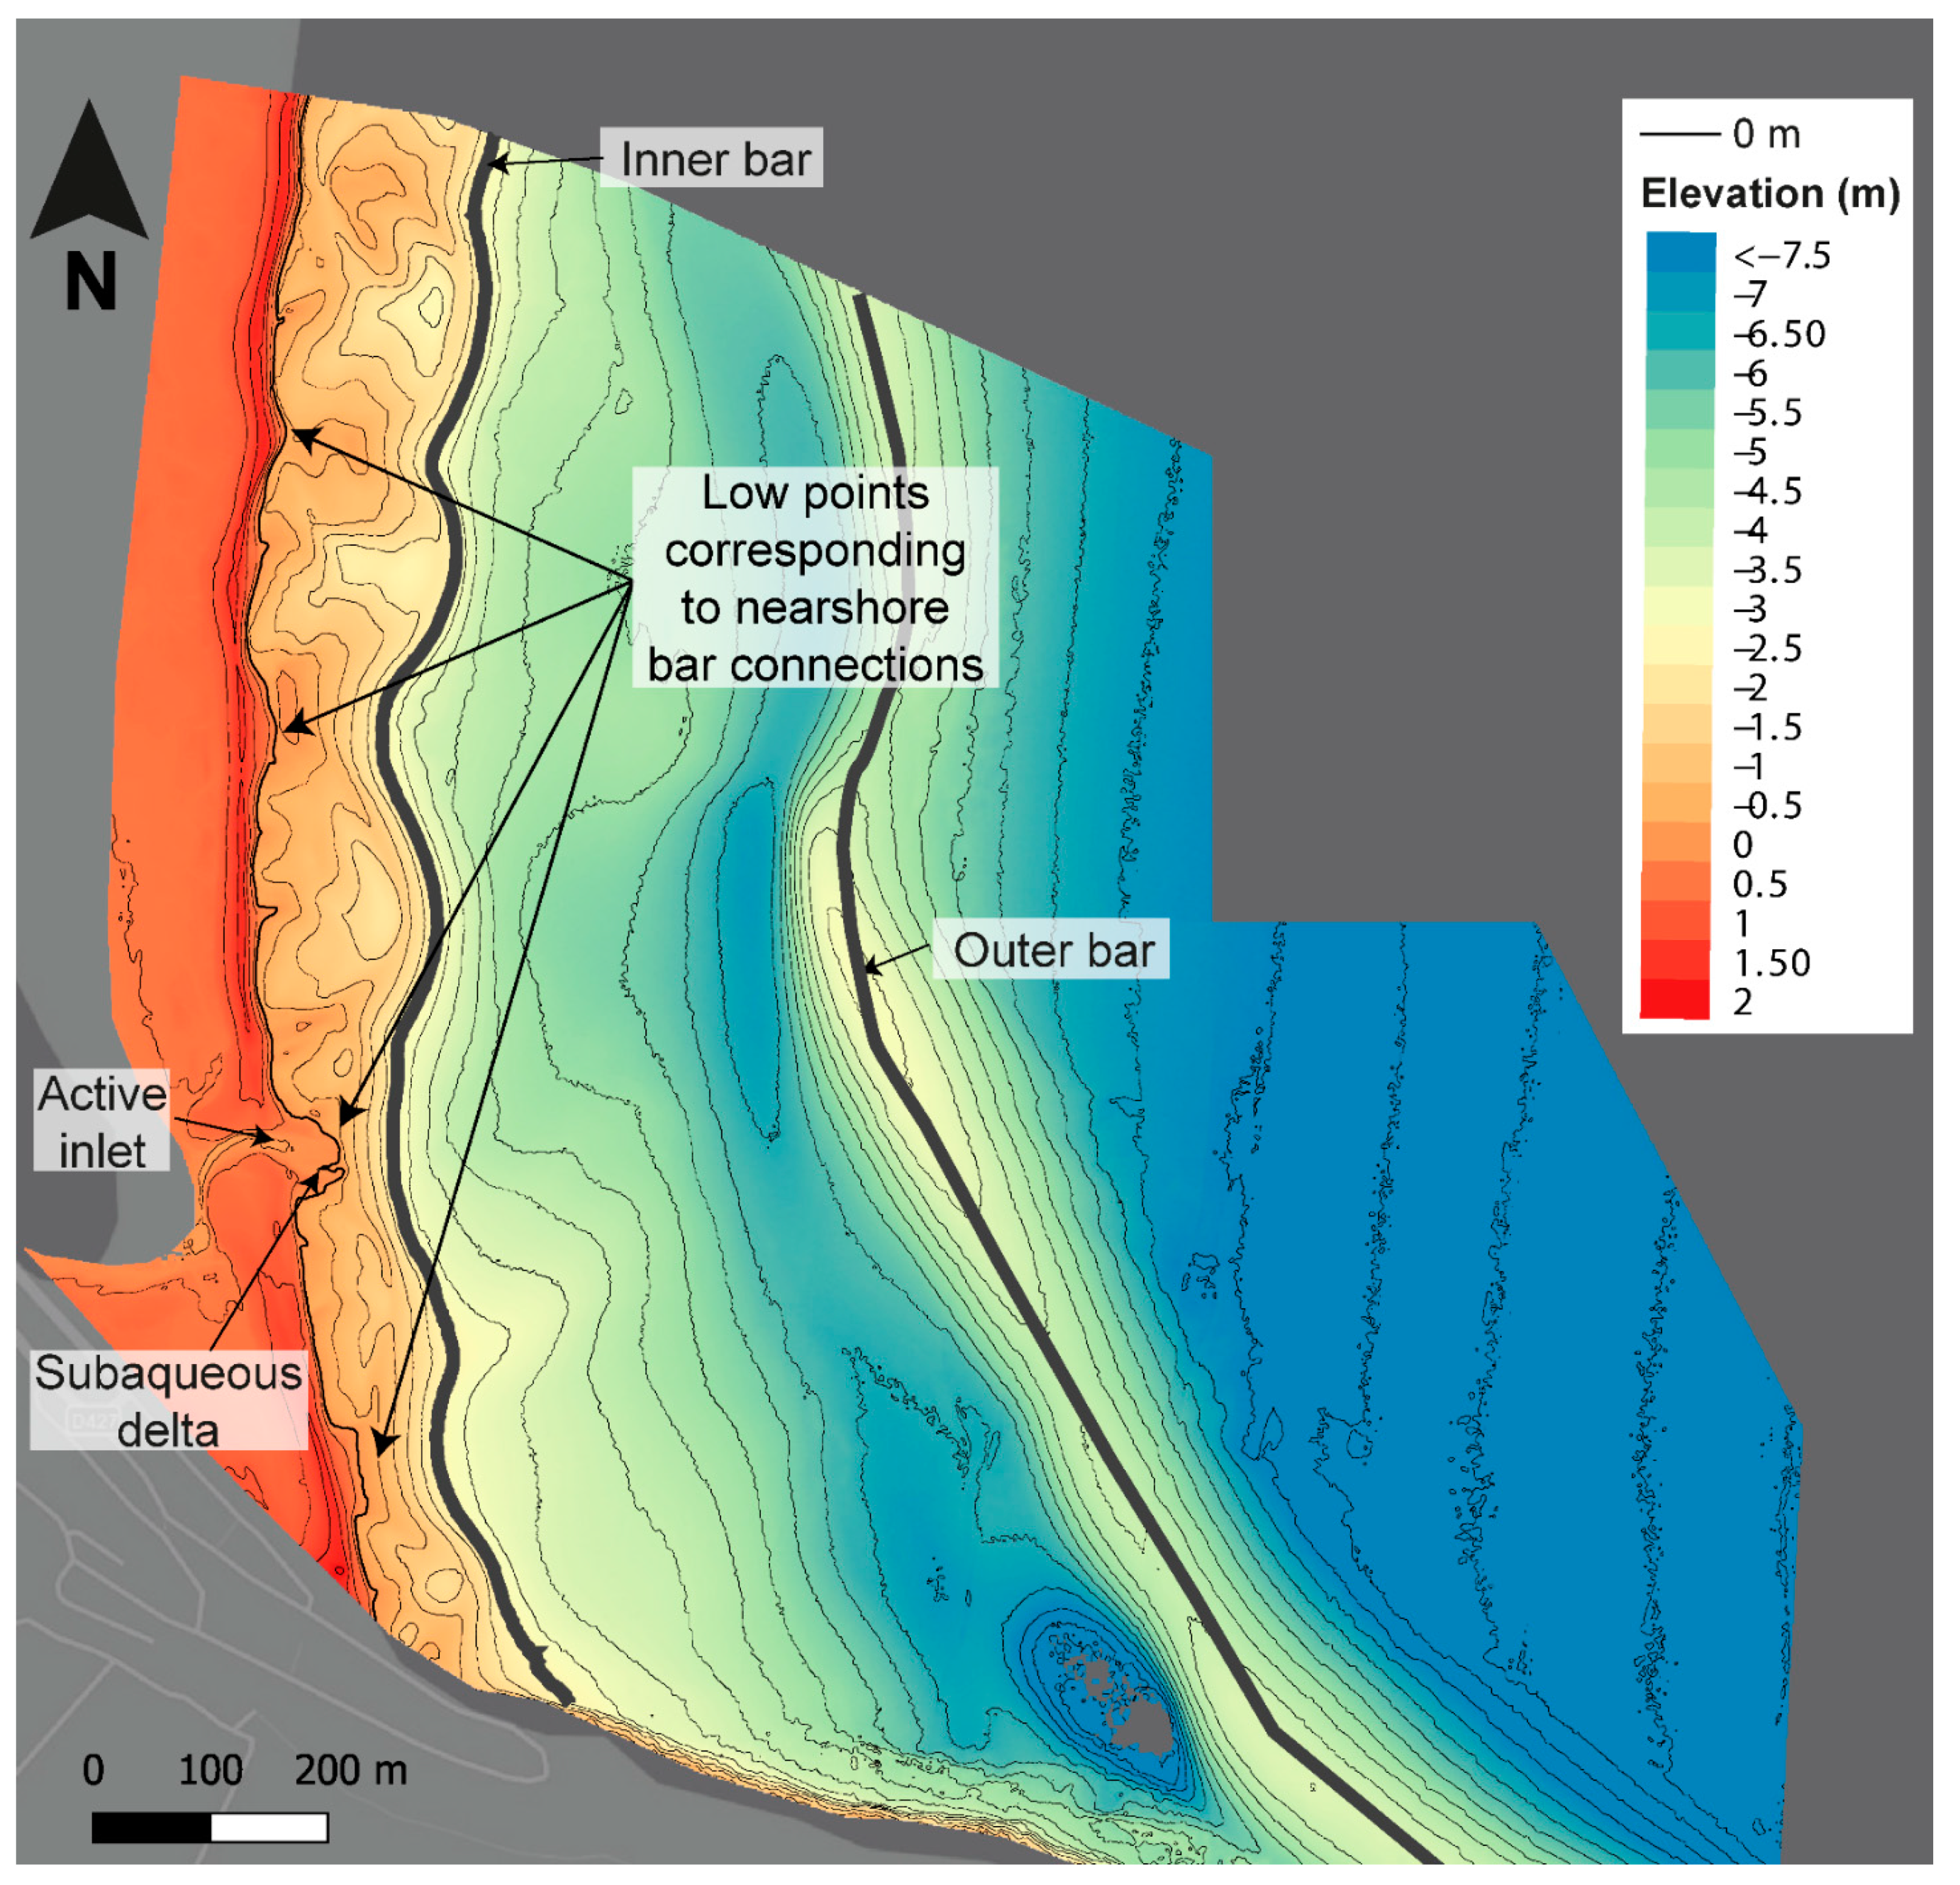
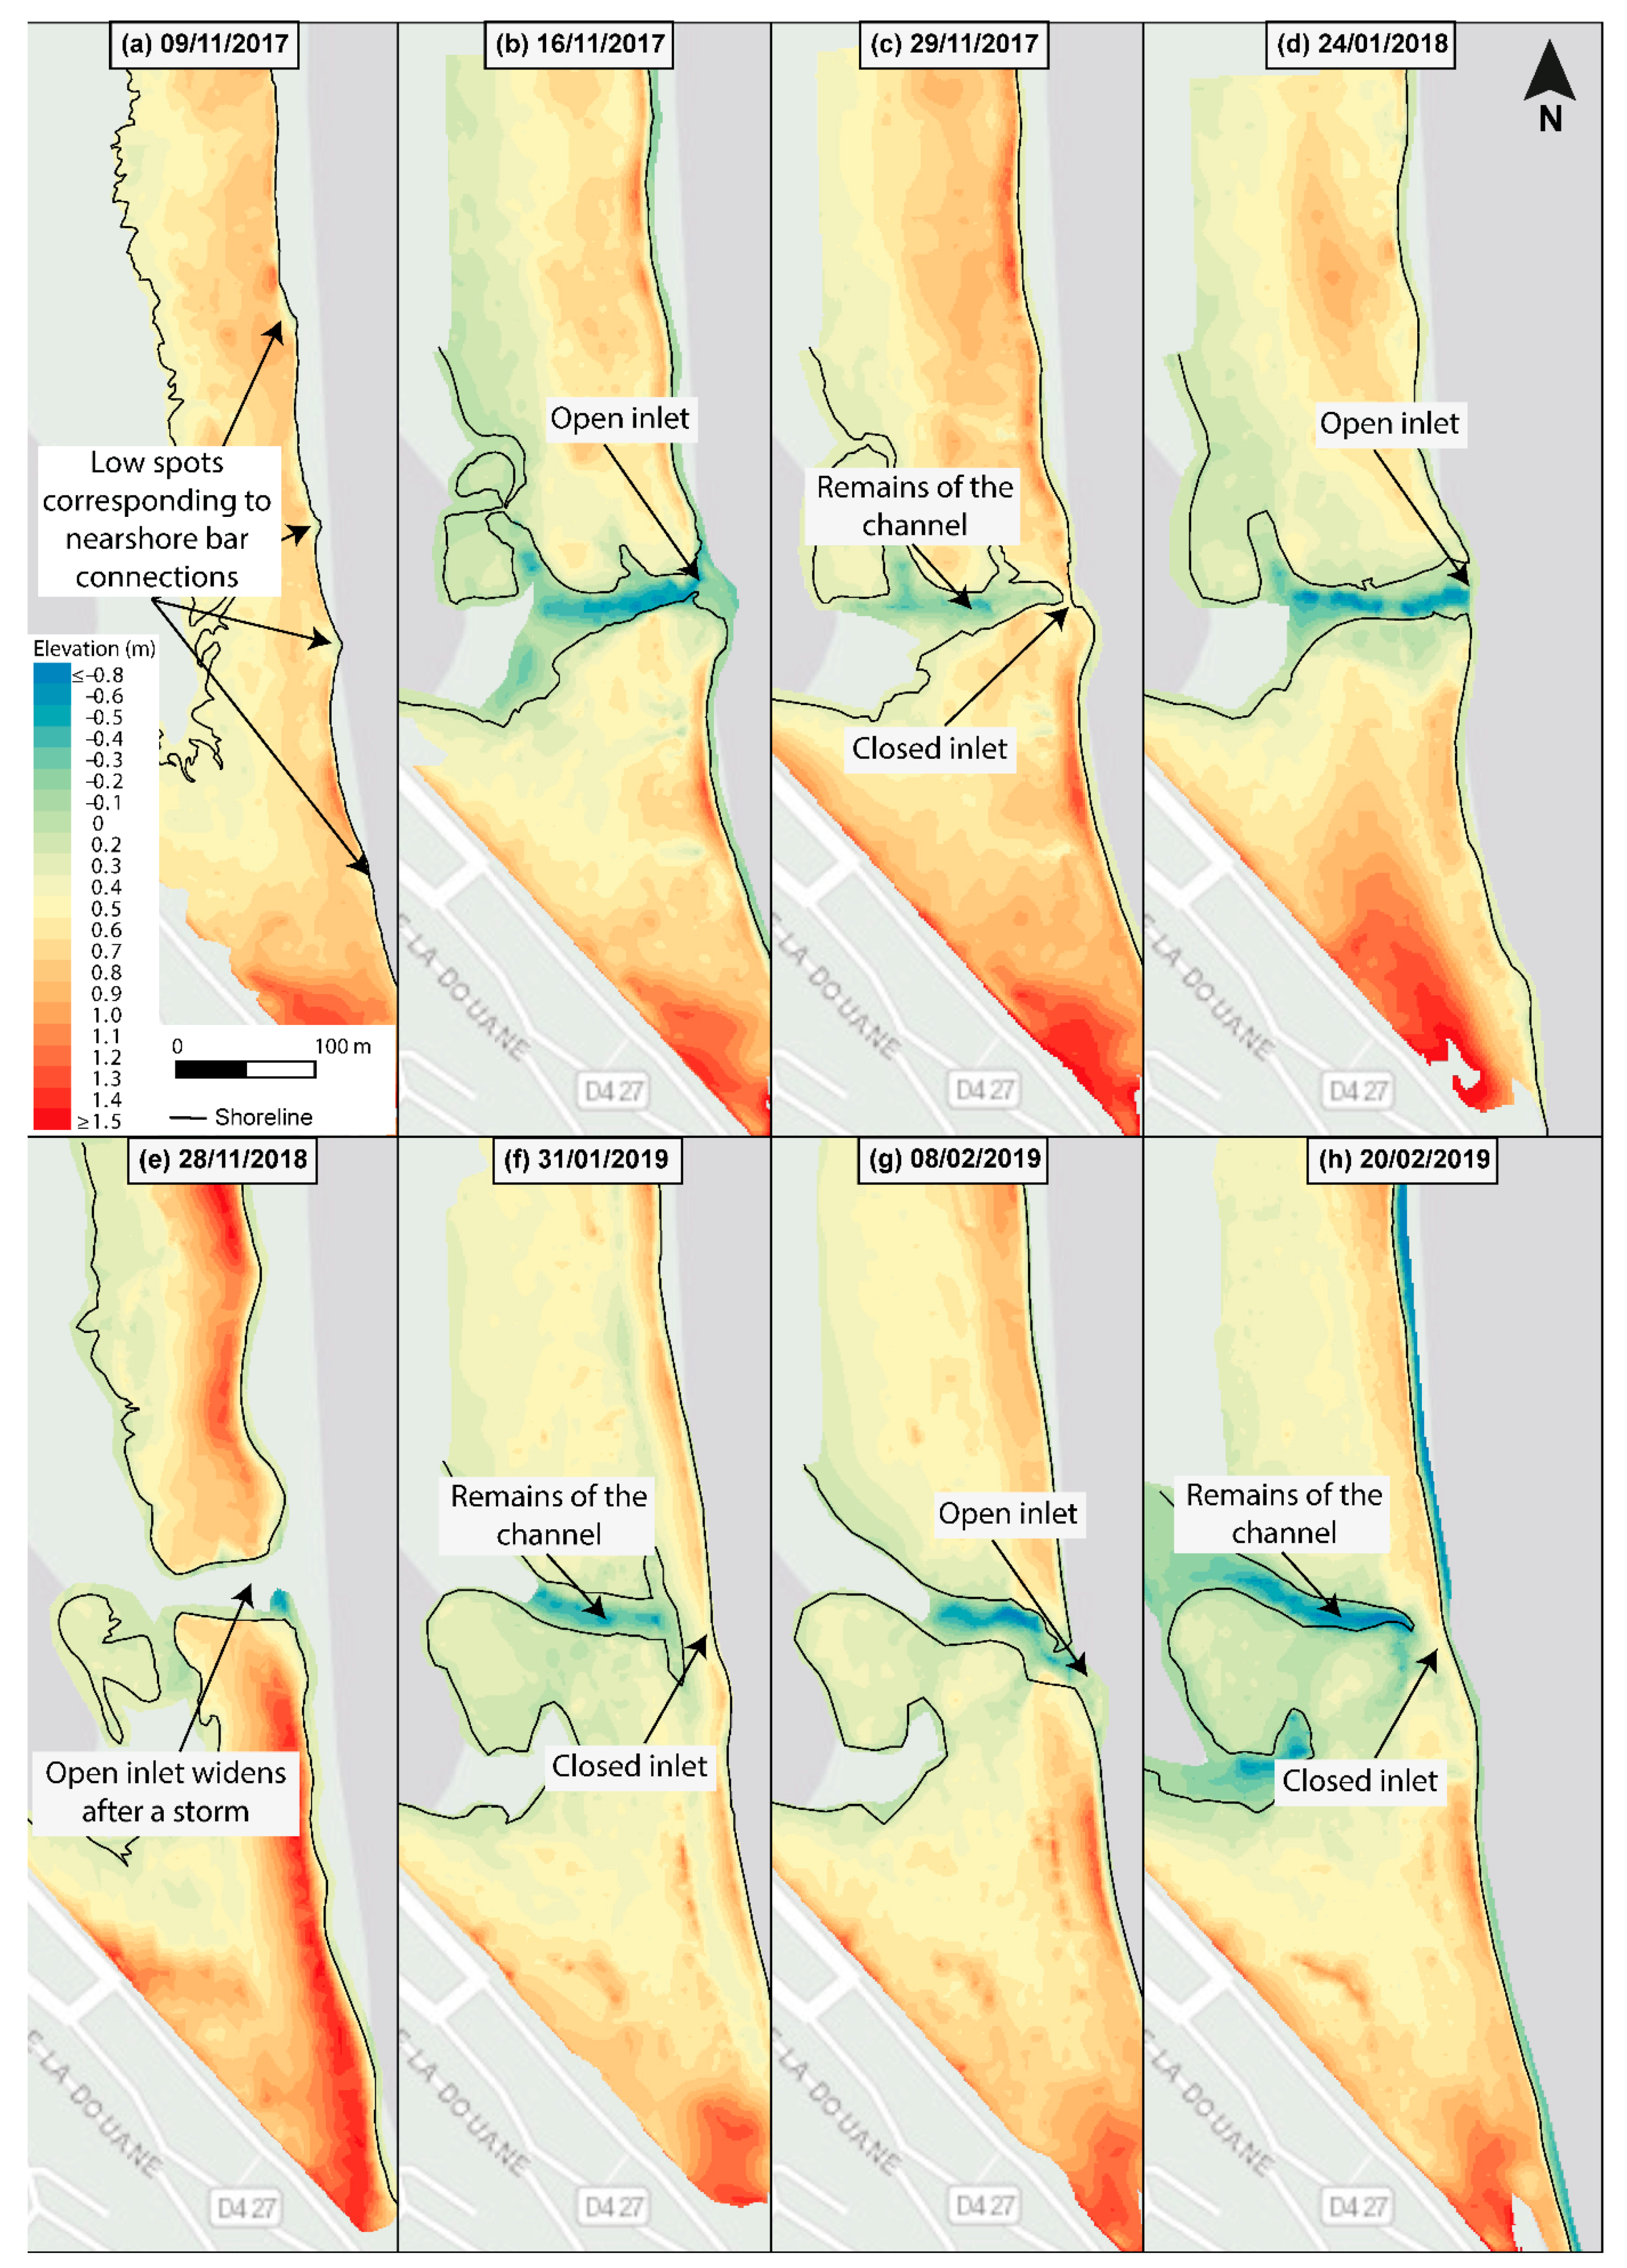
  • The position of nearshore bars, which will create areas of lower elevation of the berm in connection with beach megacusp horns;
  • Storms which can very occasionally lead to openings of the inlet concomitant with an overall retreat of the barrier, in contrast to the much more frequent openings related to offshore winds. However, the study does not address in detail the processes of syn-opening, to do so would require specific instrumentation and over significant periods of time.
As a result, this leads us to consider the integration of these controlling factors in the overall knowledge of intermittent estuary dynamics. Similar estuaries can be found in environments with similar forcing factors, especially in the Gulf of Lions, but also on a significant part of the northern Mediterranean coast.
On the other hand, the filling phases seem to be controlled by a slight easterly swell, which brings back to the coast sediments exported by the offshore wind or supplied via the inlet to the shoreface; this type of mechanism is already well documented in the literature.
The phases of opening and closing follow a seasonal cycle controlled by the variable intensity of offshore winds over the year (weaker in summer, with inlets most of the time in a closed configuration and stronger in winter with an open configuration).

Author Contributions

Conceptualization, P.F., R.C. and N.R.; methodology, P.F., O.R., N.A., B.H. and A.L.; formal analysis and data curation, P.F.; writing—original draft preparation, P.F. and R.C.; writing—review and editing, P.F., R.C., N.R. and J.-P.B.; supervision, R.C. and N.R.; funding acquisition, R.C. and N.R. All authors have read and agreed to the published version of the manuscript.

Funding

The authors would like to thank the Region Occitanie, ObsCat, the Parc Naturel Marin du Golfe du Lion and the Parc Naturel Régionale de la Narbonnaise en Méditerranée for their financial support. The La Franqui site is part of the Service National d’Observation DYNALIT observation network. The corresponding author is funded through a PhD grant from the Region Occitanie Region.

Institutional Review Board Statement

Not applicable.

Informed Consent Statement

Not applicable.

Data Availability Statement

Not applicable.

Acknowledgments

The authors would like to thank the GLADYS platform for the provision of equipment and technical support. The authors would like to thank anonymous reviewers who helped improve the first draft of this article. M.S.N. Carpenter post-edited the English style and grammar.

Conflicts of Interest

The authors declare no conflict of interest.

References

  1. Behrens, D.K.; Bombardelli, F.A.; Largier, J.L.; Twohy, E. Episodic Closure of the Tidal Inlet at the Mouth of the Russian River—A Small Bar-Built Estuary in California. Geomorphology 2013, 189, 66–80. [Google Scholar] [CrossRef]
  2. Haines, P.E.; Tomlinson, R.B.; Thom, B.G. Morphometric Assessment of Intermittently Open/Closed Coastal Lagoons in New South Wales, Australia. Estuar. Coast. Shelf Sci. 2006, 67, 321–332. [Google Scholar] [CrossRef] [Green Version]
  3. Orescanin, M.M.; Scooler, J. Observations of Episodic Breaching and Closure at an Ephemeral River. Cont. Shelf Res. 2018, 166, 77–82. [Google Scholar] [CrossRef]
  4. Ranasinghe, R.; Pattiaratchi, C.; Masselink, G. A Morphodynamic Model to Simulate the Seasonal Closure of Tidal Inlets. Coast. Eng. 1999, 37, 1–36. [Google Scholar] [CrossRef]
  5. Cooper, J.A.G. Geomorphological Variability among Microtidal Estuaries from the Wave-Dominated South African Coast. Geomorphology 2001, 40, 99–122. [Google Scholar] [CrossRef]
  6. FitzGerald, D.M. Geomorphic Variability and Morphologic and Sedimentologic Controls on Tidal Inlets. J. Coast. Res. 1996, 23, 47–72. [Google Scholar]
  7. McSweeney, S.L.; Kennedy, D.M.; Rutherfurd, I.D.; Stout, J.C. Intermittently Closed/Open Lakes and Lagoons: Their Global Distribution and Boundary Conditions. Geomorphology 2017, 292, 142–152. [Google Scholar] [CrossRef] [Green Version]
  8. Sadat-Noori, M.; Santos, I.R.; Tait, D.R.; McMahon, A.; Kadel, S.; Maher, D.T. Intermittently Closed and Open Lakes and/or Lagoons (ICOLLs) as Groundwater-Dominated Coastal Systems: Evidence from Seasonal Radon Observations. J. Hydrol. 2016, 535, 612–624. [Google Scholar] [CrossRef]
  9. Becker, A.; Laurenson, L.J.B.; Bishop, K. Artificial Mouth Opening Fosters Anoxic Conditions That Kill Small Estuarine Fish. Estuar. Coast. Shelf Sci. 2009, 82, 566–572. [Google Scholar] [CrossRef]
  10. Hayes, S.A.; Bond, M.H.; Hanson, C.V.; Freund, E.V.; Smith, J.J.; Anderson, E.C.; Ammann, A.J.; MacFarlane, R.B. Steelhead Growth in a Small Central California Watershed: Upstream and Estuarine Rearing Patterns. Trans. Am. Fish. Soc. 2008, 137, 114–128. [Google Scholar] [CrossRef]
  11. Davidson, M.A.; Morris, B.D.; Turner, I.L. A Simple Numerical Model for Inlet Sedimentation at Intermittently Open–Closed Coastal Lagoons. Cont. Shelf Res. 2009, 29, 1975–1982. [Google Scholar] [CrossRef]
  12. Ranasinghe, R.; Pattiaratchi, C. The Seasonal Closure of Tidal Inlets: Causes and Effects. Coast. Eng. J. 2003, 45, 601–627. [Google Scholar] [CrossRef]
  13. Riddin, T.; Adams, J.B. Influence of Mouth Status and Water Level on the Macrophytes in a Small Temporarily Open/Closed Estuary. Estuar. Coast. Shelf Sci. 2008, 79, 86–92. [Google Scholar] [CrossRef]
  14. Behrens, D.K.; Bombardelli, F.A.; Largier, J.L.; Twohy, E. Characterization of Time and Spatial Scales of a Migrating Rivermouth. Geophys. Res. Lett. 2009, 36. [Google Scholar] [CrossRef] [Green Version]
  15. Hinwood, J.B.; McLean, E.J. Multi-Factor Tracking of Tidal Processes in an Intermittently Open Estuarine Lake. Geomorphology 2022, 415, 108400. [Google Scholar] [CrossRef]
  16. James, G.W. Surface Water Dynamics at the Carmel Lagoon Water Years 1991 through 2005; Monterey Peninsula Water Management Agency: Monterey, CA, USA, 2005; p. 152. [Google Scholar]
  17. McSweeney, S.L.; Kennedy, D.M.; Rutherfurd, I.D. The Daily-Scale Entrance Dynamics of Intermittently Open/Closed Estuaries. Earth Surf. Process. Landf. 2017, 43, 791–807. [Google Scholar] [CrossRef]
  18. Seminack, C.T.; McBride, R.A. A Life-Cycle Model for Wave-Dominated Tidal Inlets along Passive Margin Coasts of North America. Geomorphology 2018, 304, 141–158. [Google Scholar] [CrossRef]
  19. Bertin, X.; Mendes, D.; Martins, K.; Fortunato, A.B.; Lavaud, L. The Closure of a Shallow Tidal Inlet Promoted by Infragravity Waves. Geophys. Res. Lett. 2019, 46, 6804–6810. [Google Scholar] [CrossRef]
  20. McSweeney, S.L.; Stout, J.C.; Kennedy, D.M. Variability in Infragravity Wave Processes during Estuary Artificial Entrance Openings. Earth Surf. Process. Landf. 2020, 45, 3414–3428. [Google Scholar] [CrossRef]
  21. Melito, L.; Postacchini, M.; Sheremet, A.; Calantoni, J.; Zitti, G.; Darvini, G.; Penna, P.; Brocchini, M. Hydrodynamics at a Microtidal Inlet: Analysis of Propagation of the Main Wave Components. Estuar. Coast. Shelf Sci. 2020, 235, 106603. [Google Scholar] [CrossRef]
  22. Melito, L.; Postacchini, M.; Sheremet, A.; Calantoni, J.; Zitti, G.; Darvini, G.; Brocchini, M. Wave-Current Interactions and Infragravity Wave Propagation at a Microtidal Inlet. Proceedings 2018, 2, 628. [Google Scholar] [CrossRef]
  23. Harvey, M.E.; Giddings, S.N.; Pawlak, G.; Crooks, J.A. Hydrodynamic Variability of an Intermittently Closed Estuary over Interannual, Seasonal, Fortnightly, and Tidal Timescales. Estuaries Coasts 2022. [Google Scholar] [CrossRef]
  24. Bertin, X.; Fortunato, A.; Oliveira, A. Morphodynamic Modeling of the Ancão Inlet, South Portugal. J. Coast. Res. Spec. Issue 2009, 56, 10–14. [Google Scholar]
  25. Dodet, G.; Bertin, X.; Bruneau, N.; Fortunato, A.B.; Nahon, A.; Roland, A. Wave-Current Interactions in a Wave-Dominated Tidal Inlet. J. Geophys. Res. Ocean. 2013, 118, 1587–1605. [Google Scholar] [CrossRef] [Green Version]
  26. Orescanin, M.; Raubenheimer, B.; Elgar, S. Observations of Wave Effects on Inlet Circulation. Cont. Shelf Res. 2014, 82, 37–42. [Google Scholar] [CrossRef]
  27. Hayes, M.O.; FitzGerald, D.M. Origin, Evolution, and Classification of Tidal Inlets. J. Coast. Res. 2013, 69, 14–33. [Google Scholar] [CrossRef]
  28. Rich, A.; Keller, E.A. A Hydrologic and Geomorphic Model of Estuary Breaching and Closure. Geomorphology 2013, 191, 64–74. [Google Scholar] [CrossRef]
  29. Kraus, N.C.; Patsch, K.; Munger, S. Barrier Beach Breaching from the Lagoon Side, with Reference to Northern California. Shore Beach 2008, 76, 12. [Google Scholar]
  30. Zietsman, I. Hydrodynamics of Temporary Open Estuaries, with Case Studies of Mhlanga and Mdloti. Master Thesis, University of Natal, Durban, South Africa, 2004. [Google Scholar]
  31. Robin, N.; Levoy, F.; Anthony, E.J.; Monfort, O. Sand Spit Dynamics in a Large Tidal-range Environment: Insight from Multiple LiDAR, UAV and Hydrodynamic Measurements on Multiple Spit Hook Development, Breaching, Reconstruction, and Shoreline Changes. Earth Surf. Process. Landf. 2020, 45, esp.4924. [Google Scholar] [CrossRef]
  32. Gharagozlou, A.; Anderson, D.L.; Gorski, J.F.; Dietrich, J.C. Emulator for Eroded Beach and Dune Profiles due to Storms. J. Geophys. Res. Earth Surf. 2022, 127, e2022JF006620. [Google Scholar] [CrossRef]
  33. Balouin, Y.; Bourrin, F.; Meslard, F.; Palvadeau, E.; Robin, N. Assessing the Role of Storm Waves and River Discharge on Sediment Bypassing Mechanisms at the Têt River Mouth in the Mediterranean (Southeast France). J. Coast. Res. 2020, 95, 351. [Google Scholar] [CrossRef]
  34. Meslard, F.; Balouin, Y.; Robin, N.; Bourrin, F. Assessing the Role of Extreme Mediterranean Events on Coastal River Outlet Dynamics. Water 2022, 14, 2463. [Google Scholar] [CrossRef]
  35. Warrick, J.A. Littoral Sediment From Rivers: Patterns, Rates and Processes of River Mouth Morphodynamics. Front. Earth Sci. 2020, 8, 355. [Google Scholar] [CrossRef]
  36. Donnelly, C. Morphologic Change by Overwash: Establishing and Evaluating Predictors. J. Coast. Res. 2007, 50, 520–526. [Google Scholar]
  37. FitzGerald, D.M.; Buynevich, I.V. Tidal Inlets and Deltas. In Sedimentology; Springer: Dordrecht, The Netherlands, 2003; pp. 1219–1224. ISBN 978-1-4020-3609-5. [Google Scholar]
  38. Nienhuis, J.H.; Ashton, A.D. Mechanics and Rates of Tidal Inlet Migration: Modeling and Application to Natural Examples: Inlet Migration. J. Geophys. Res. Earth Surf. 2016, 121, 2118–2139. [Google Scholar] [CrossRef]
  39. Cooper, J.A.G. Sedimentary Processes in the River-Dominated Mvoti Estuary, South Africa. Geomorphology 1994, 9, 271–300. [Google Scholar] [CrossRef]
  40. FitzGerald, D.M. Shoreline Erosional-Depositional Processes Associated with Tidal Inlets; Aubrey, D.G., Weishar, L., Eds.; Springer: New York, NY, USA, 1988; pp. 186–225. [Google Scholar]
  41. Hayes, M.O. Geomorphology and Sedimentation Patterns of Tidal Inlets: A Review; ASCE Seattle: Washington, DC, USA, 1991; pp. 1343–1355. [Google Scholar]
  42. Deng, J.; Jones, B.G.; Rogers, K.; Woodroffe, C.D. Wind Influence on the Orientation of Estuarine Landforms: An Example from Lake Illawarra in Southeastern Australia. Earth Surf. Process. Landf. 2018, 43, 2915–2925. [Google Scholar] [CrossRef] [Green Version]
  43. Hunt, S.; Bryan, K.R.; Mullarney, J.C. The Influence of Wind and Waves on the Existence of Stable Intertidal Morphology in Meso-Tidal Estuaries. Geomorphology 2015, 228, 158–174. [Google Scholar] [CrossRef]
  44. Alekseenko, E.; Roux, B.; Sukhinov, A.; Kotarba, R.; Fougere, D. Coastal Hydrodynamics in a Windy Lagoon. Comput. Fluids 2013, 77, 24–35. [Google Scholar] [CrossRef]
  45. Boutron, O.; Bertrand, O.; Fiandrino, A.; Höhener, P.; Sandoz, A.; Chérain, Y.; Coulet, E.; Chauvelon, P. An Unstructured Numerical Model to Study Wind-Driven Circulation Patterns in a Managed Coastal Mediterranean Wetland: The Vaccarès Lagoon System. Water 2015, 7, 5986–6016. [Google Scholar] [CrossRef] [Green Version]
  46. Leredde, Y.; Dekeyser, I.; Devenon, J.-L. T-S Data Assimilation to Optimise Turbulent Viscosity: An Application to the Berre Lagoon Hydrodynamics. J. Coast. Res. 2002, 18, 555–567. [Google Scholar]
  47. Paugam, C.; Sous, D.; Rey, V.; Meulé, S. Field Study of Wind Tide Semi-Enclosed Shallow Basins. Coast. Eng. Proc. 2020, 36, 27. [Google Scholar] [CrossRef]
  48. Paugam, C.; Sous, D.; Rey, V.; Meulé, S.; Faure, V.; Boutron, O.; Luna-Laurent, E.; Migne, E. Wind Tides and Surface Friction Coefficient in Semi-Enclosed Shallow Lagoons. Estuar. Coast. Shelf Sci. 2021, 257, 107406. [Google Scholar] [CrossRef]
  49. Bauer, B.O.; Davidson-Arnott, R.G.D.; Walker, I.J.; Hesp, P.A.; Ollerhead, J. Wind Direction and Complex Sediment Transport Response across a Beach–Dune System. Earth Surf. Process. Landf. 2012, 37, 1661–1677. [Google Scholar] [CrossRef]
  50. Gares, P.A.; Davidson-Arnott, R.G.D.; Bauer, B.O.; Sherman, D.J.; Carter, R.W.G.; Jackson, D.W.T.; Nordstromt, K.F. Aeolian Sediment Transport Under Offshore Wind Conditions: Implications for Aeolian Sediment Budget Calculations. J. Coast. Res. 1996, 12, 673–682. [Google Scholar]
  51. Nordstrom, K.F.; Bauer, B.O.; Davidson-Arnott, R.G.D.; Garesc, P.A.; Carter, R.W.G.; Jackson, D.W.T.; Sherman, D.J. Offshore Aeolian Transport Across a Beach: Carrick Finn Strand, Ireland. J. Coast. Res. 1996, 664–672. [Google Scholar]
  52. Nordstrom, K.F.; Jackson, N.L. Offshore Aeolian Sediment Transport across a Human-Modified Foredune. Earth Surf. Process. Landf. 2017, 43, 195–201. [Google Scholar] [CrossRef]
  53. Law, M.N.; Davidson-Arnott, R. Seasonal Controls on Aeolian Processes on the Beach and Foredune. Proc. Symp. Coast. Sand Dunes 1990, 49–68. [Google Scholar]
  54. Sabatier, F.; Chaïbi, M.; Chauvelon, P. Transport éolien par vent de mer et al.imentation sédimentaire des dunes de Camargue. Mediterranee 2007, 108, 83–90. [Google Scholar] [CrossRef] [Green Version]
  55. Sabatier, F.; Samat, O.; Chaibi, M.; Lambert, A.; Pons, F. Transport Sédimentaire de La Dune à La Zone Du Déferlement Sur Une Plage Sableuse Soumise à Des Vents de Terre. In Proceedings of the VIIIèmes Journées Nationales Génie Civil—Génie Côtier, Compiègne, France, 7–9 September 2004. [Google Scholar]
  56. Certain, R. Morphodynamique d’une côte Sableuse Microtidale à Barres: Le Golfe du Lion (Languedoc-Roussillon). Ph.D. Thesis, Université de Perpignan, Perpignan, France, 2002. [Google Scholar]
  57. Infoclimat Leucate (Aude—France)|Relevés Météo En Temps Réel—Infoclimat. Available online: https://www.infoclimat.fr/observations-meteo/temps-reel/leucate/07666.html?graphiques (accessed on 10 August 2022).
  58. Mayençon, R. Météorologie Marine; Editions Maritimes D’outre mer: Paris, France, 1992; ISBN 978-2-7373-0716-4. [Google Scholar]
  59. Aleman, N.; Robin, N.; Certain, R.; Anthony, E.J.; Barusseau, J.P. Longshore Variability of Beach States and Bar Types in a Microtidal, Storm-Influenced, Low-Energy Environment. Geomorphology 2015, 241, 175–191. [Google Scholar] [CrossRef]
  60. Aleman, N.; Robin, N.; Certain, R.; Vanroye, C.; Barusseau, J.P.; Bouchette, F. Typology of Nearshore Bars in the Gulf of Lions (France) Using LIDAR Technology. J. Coast. Res. 2011, 64, 721–725. [Google Scholar]
  61. Mendoza, E.; Jiménez, J. Storm-Induced Beach Erosion Potential on the Catalonian Coast. J. Coast. Res. SI 2006, 48, 81–88. [Google Scholar]
  62. Cerema; Dreal, L.R. Fiche Synthétique de la Campagne 01001 Leucate; Cerema: Bron, France, 2018; p. 9. [Google Scholar]
  63. Kulling, B. Déformation du Rivage et Dérive Littorale des Plages du Golfe du Lion. Ph.D. Thesis, Université d’Aix-Marseille, Marseille, France, 2017. [Google Scholar]
  64. PNRNM Carte Du Fonctionnement Hydrologique de l’étang de La Palme 2010; Parc naturel régional de la Narbonnaise en Méditerranée: Sigean, France, 2010.
  65. Anselme, B.; Goeldner-Gianella, L.; Durand, P. Le Risque de Submersion Dans Le Système Lagunaire de La Palme (Languedoc, France): Nature de l’aléa et Perception Du Risque. In Proceedings of the Colloque International Pluridisciplinaire, Les littoraux: Subir, Dire et agir, Lille, France, 16–18 January 2008. [Google Scholar]
  66. Larue, J.-P.; Rouquet, J. La lagune de La Palme (Aude, France) face au comblement et à l’eutrophisation. Physio-Géo. Géographie Phys. Environ. 2016, 10, 45–60. [Google Scholar] [CrossRef]
  67. Fiandrino, A.; Giraud, A.; Robin, S.; Pinatel, C. Validation D’une Méthode D’estimation des Volumes D’eau Echangés Entre la mer et les Lagunes. 2012, p. 104. Available online: https://archimer.ifremer.fr/doc/00274/38544/37064.pdf (accessed on 1 April 2019).
  68. Rodellas, V.; Stieglitz, T.C.; Andrisoa, A.; Cook, P.G.; Raimbault, P.; Tamborski, J.J.; van Beek, P.; Radakovitch, O. Groundwater-Driven Nutrient Inputs to Coastal Lagoons: The Relevance of Lagoon Water Recirculation as a Conveyor of Dissolved Nutrients. Sci. Total Environ. 2018, 642, 764–780. [Google Scholar] [CrossRef] [PubMed]
  69. Wilke, M.; Boutière, H. Hydrobiological, physical and chemical characteristics and spatio-temporal dynamics of an oligotrophic mediterranean lagoon: The etang de La Palme (France). Vie Et Milieu 2000, 50, 101–115. [Google Scholar]
  70. Ferrer, P. Morphodynamique à Multi-Echelles du Trait de Côte (Prisme Sableux) du Golfe du Lion Depuis le Dernier Optimum Climatique. Ph.D. Thesis, Université de Perpignan Via Domitia, Perpignan, France, 2010. [Google Scholar]
  71. Aleman, N. Morphodynamique à l’échelle Régionale d’une Avant-Côte Microtidale à Barres Sédimentaires. Le cas du Languedoc-Roussillon à l’aide de la Technologie LIDAR. Ph.D. Thesis, Université de Perpignan Via Domitia, Perpignan, France, 2013. [Google Scholar]
  72. Cerema; Dreal, L.R. Observatoire Océanologique de Banyuls CANDHIS—Détail de La Campagne 01101—Leucate. Available online: http://candhis.cetmef.developpement-durable.gouv.fr/campagne/?idcampagne=c81e728d9d4c2f636f067f89cc14862c (accessed on 1 April 2019).
  73. Stockdon, H.F.; Holman, R.A.; Howd, P.A.; Sallenger, A.H. Empirical Parameterization of Setup, Swash, and Runup. Coast. Eng. 2006, 53, 573–588. [Google Scholar] [CrossRef]
  74. Castelle, B.; Marieu, V.; Bujan, S.; Splinter, K.D.; Robinet, A.; Sénéchal, N.; Ferreira, S. Impact of the Winter 2013–2014 Series of Severe Western Europe Storms on a Double-Barred Sandy Coast: Beach and Dune Erosion and Megacusp Embayments. Geomorphology 2015, 238, 135–148. [Google Scholar] [CrossRef]
  75. Castelle, B.; Scott, T.; Brander, R.; Mccarroll, R. Rip Current Types, Circulation and Hazard. Earth-Sci. Rev. 2016, 163, 1–21. [Google Scholar] [CrossRef]
  76. Thornton, E.B.; MacMahan, J.; Sallenger, A.H. Rip Currents, Mega-Cusps, and Eroding Dunes. Mar. Geol. 2007, 240, 151–167. [Google Scholar] [CrossRef]
  77. Masselink, G.; Pattiaratchi, C.B. Seasonal Changes in Beach Morphology along the Sheltered Coastline of Perth, Western Australia. Mar. Geol. 2001, 172, 243–263. [Google Scholar] [CrossRef]
  78. Roy, P.S.; Williams, R.J.; Jones, A.R.; Yassini, I.; Gibbs, P.J.; Coates, B.; West, R.J.; Scanes, P.R.; Hudson, J.P.; Nichol, S. Structure and Function of South-East Australian Estuaries. Estuar. Coast. Shelf Sci. 2001, 53, 351–384. [Google Scholar] [CrossRef]
  79. Stretch, D.; Parkinson, M. The Breaching of Sand Barriers at Perched, Temporary Open/Closed Estuaries—A Model Study. Coast. Eng. J. 2006, 48, 13–30. [Google Scholar] [CrossRef]
  80. Tagliapietra, D.; Sigovini, M.; Ghirardini, A.V. A Review of Terms and Definitions to Categorise Estuaries, Lagoons and Associated Environments. Mar. Freshw. Res. 2009, 60, 497–509. [Google Scholar] [CrossRef]
  81. Kennedy, D.M.; McSweeney, S.L.; Mariani, M.; Zavadil, E. The Geomorphology and Evolution of Intermittently Open and Closed Estuaries in Large Embayments in Victoria, Australia. Geomorphology 2020, 350, 106892. [Google Scholar] [CrossRef]
  82. Ranasinghe, R.; Pattiaratchi, C. The Seasonal Closure of Tidal Inlets: Wilson Inlet—A Case Study. Coast. Eng. 1999, 37, 37–56. [Google Scholar] [CrossRef]
  83. Cooper, J.A.G. Lagoons and Microtidal Coasts. In Coastal Evolution Late Quaternary Shoreline Morphodynamics; Carter, R.W.G., Woodroffe, C.D., Eds.; Cambridge University Press: Cambridge, UK, 1994; pp. 219–266. [Google Scholar] [CrossRef]
  84. Ranasinghe, R.; Pattiaratchi, C. Tidal Inlet Velocity Asymmetry in Diurnal Regimes. Cont. Shelf Res. 2000, 20, 2347–2366. [Google Scholar] [CrossRef]
  85. Wright, L.D.; Short, A.D. Morphodynamic Variability of Surf Zones and Beaches: A Synthesis. Mar. Geol. 1984, 56, 93–118. [Google Scholar] [CrossRef]
  86. González-Villanueva, R.; Pérez-Arlucea, M.; Costas, S. Lagoon Water-Level Oscillations Driven by Rainfall and Wave Climate. Coast. Eng. 2017, 130, 34–45. [Google Scholar] [CrossRef]
  87. Baldock, T.E.; Birrien, F.; Atkinson, A.; Shimamoto, T.; Wu, S.; Callaghan, D.P.; Nielsen, P. Morphological Hysteresis in the Evolution of Beach Profiles under Sequences of Wave Climates—Part 1; Observations. Coast. Eng. 2017, 128, 92–105. [Google Scholar] [CrossRef] [Green Version]
  88. Morris, B.D.; Turner, I.L. Morphodynamics of Intermittently Open–Closed Coastal Lagoon Entrances: New Insights and a Conceptual Model. Mar. Geol. 2010, 271, 55–66. [Google Scholar] [CrossRef]
  89. Brunel, C.; Certain, R.; Sabatier, F.; Robin, N.; Barusseau, J.P.; Aleman, N.; Raynal, O. 20th Century Sediment Budget Trends on the Western Gulf of Lions Shoreface (France): An Application of an Integrated Method for the Study of Sediment Coastal Reservoirs. Geomorphology 2014, 204, 625–637. [Google Scholar] [CrossRef]
  90. Coco, G.; Huntley, D.A.; O’Hare, T.J. Investigation of a Self-Organization Model for Beach Cusp Formation and Development. J. Geophys. Res. Ocean. 2000, 105, 21991–22002. [Google Scholar] [CrossRef]
  91. Coco, G.; Burnet, T.K.; Werner, B.T. Test of Self-Organization in Beach Cusp Formation. J. Geophys. Res. Earth Surf. 2003, 108, 3101. [Google Scholar] [CrossRef]
  92. Falqués, A.; Ribas, F.; Idier, D.; Arriaga, J. Formation Mechanisms for Self-Organized Km-Scale Shoreline Sand Waves: Self-Organized Shoreline Sand Waves. J. Geophys. Res. Earth Surf. 2017, 122, 1121–1138. [Google Scholar] [CrossRef] [Green Version]
  93. Caballeria, M.; Coco, G.; Falqués, A.; Huntley, D.A. Self-Organization Mechanisms for the Formation of Nearshore Crescentic and Transverse Sand Bars. J. Fluid Mech. 2002, 465, 379–410. [Google Scholar] [CrossRef] [Green Version]
  94. Coco, G.; Caballeria, M.; Falqués, A.; Huntley, D. Crescentic Bars and Nearshore Self-Organization Processes. J. Fluid Mech. 2002, 465, 379–410. [Google Scholar] [CrossRef]
  95. Coco, G.; Murray, A.B. Patterns in the Sand: From Forcing Templates to Self-Organization. Geomorphology 2007, 91, 271–290. [Google Scholar] [CrossRef]
  96. Fagherazzi, S. Self-Organization of Tidal Deltas. Proc. Natl. Acad. Sci. USA 2008, 105, 18692–18695. [Google Scholar] [CrossRef] [PubMed]
Figure 1. Location of the Coussoules barrier La Palme lagoon and Le Grau de La Franqui (42°55′56.12″ N; 3°2′23.54″ E) with instrument positions and main forcings.
Jmse 10 01817 g001
Figure 2. Recorded daily forcing conditions during the monitoring period. (a) Wave direction and height (periods of offshore-directed waves are not indicated for sake of clarity as they are not relevant for beach morphodynamics); The dates of the surveys are indicated by the red circles; (b) Wind direction and speed; (c) Precipitation and atmospheric pressure; (d) Water level and calculated values of run-up; (e) State of the inlet (open in white/closed in red).
Jmse 10 01817 g002
Figure 3. Recorded hourly forcing conditions during hydrodynamic monitoring with closed inlet. (a) Wave conditions measured at the Leucate buoy (periods of offshore-directed waves are not indicated for sake of clarity); (b) Wind conditions; (c) Precipitation and atmospheric pressure; (d) Water-level variations between the southern basin (green, see 3 in Figure 1); (e) Grazel (blue, see 2 in Figure 1); (f) Current velocities measured at location 3 between the southern basin and Grazel (black, see 3 in Figure 1).
Jmse 10 01817 g003
Figure 4. Recorded hourly lagoon surface slope versus effective wind speed (Ve). Ve > 0 for onshore forcing and Ve < 0 for offshore forcing, where Ө is the angular difference between the recorded wind direction and the reference axis parallel to the Grazel (between sensors 2 and 3).
Jmse 10 01817 g004
Figure 5. Recorded hourly forcing conditions before and during inlet opening. (a) Wave conditions measured at the Leucate buoy (periods of offshore-directed waves are not indicated for sake of clarity); (b) Wind conditions; (c) Precipitation and atmospheric pressure; (d) Seawater levels and run-up values; (e) Lagoon water level measured at Grazel (see 2 in Figure 1) and measured barrier height.
Jmse 10 01817 g005
Figure 6. Morphological evolution of La Franqui beach, during periods of offshore wind with single (I, a,c) or multiple (III, e,g) inlet openings and during periods of offshore wind without inlet opening (II, b,d & IV, f,h). Dotted profiles correspond to the initial profile and solid profiles to the final situation.
Jmse 10 01817 g006
Figure 7. Topo-bathymetric LiDAR (summer 2014) showing connections between the beachface, the inner bar system, and the position of the inlet.
Jmse 10 01817 g007
Figure 8. Inlet dynamics over the winter periods of 2017/2018 and 2018/2019.
Jmse 10 01817 g008
Figure 9. Photographs illustrating evolution in the development of inlets. (a) three active inlets at the time of opening; (b) a first inlet dries up in the north, the southernmost one is the widest and seems to be the deepest; (c) only the southernmost inlet remains, the others are filled in and dried up.
Jmse 10 01817 g009
Figure 10. Morphological evolution of La Franqui beach, during periods of onshore-wave action closing the inlet (I, a,c) and building of the beachface (II, b,d) and for a storm of decadal recurrence at the La Franqui (III, f,h) and storm events of annual recurrence (IV, f,h). Dotted lines correspond to the initial profile and solid lines to the final situation. The beach is completely submerged during storms (III,IV) and the channel is too deep to be surveyed (>1.2 m).
Jmse 10 01817 g010
Figure 11. Morphodynamic model of an intermittent microtidal inlet. The evolution of the inlet is shown in relation to the dominant forcing, with offshore processes upward and onshore downward. The pie chart shows the most common periods for each of the situations. (a) the state of the beach at the end of the summer period; opening by offshore wind (b,c); (f) opening following a storm event and (e) impact of a storm on an already open inlet. Wave closure mechanism (d,g).
Jmse 10 01817 g011
Figure 12. Sectional diagram of the opening mechanisms during periods of strong offshore wind; (a) pre-conditioning of the barrier due to filling of the lagoon by precipitation and overtopping by waves; (b) Beach barrier erosion and reduction of beach height due to offshore wind erosion; (c) Barrier breaching due to lagoon water overtopping and lowering of berm zone due to connection of nearshore bars at the level of beach megacusp horns, associated with local progradation; (d) Opening of the inlet, with bed erosion by currents and deposition of a delta at the outlet.
Jmse 10 01817 g012
Publisher’s Note: MDPI stays neutral with regard to jurisdictional claims in published maps and institutional affiliations.

