Article

Development of Ship Route-Planning Algorithm Based on Rapidly-Exploring Random Tree (RRT*) Using Designated Space

1
Graduate School of Maritime Transportation System, Mokpo National Maritime University, Mokpo 58628, Republic of Korea
2
Division of Navigation Science, Mokpo National Maritime University, Mokpo 58628, Republic of Korea
*
Author to whom correspondence should be addressed.
J. Mar. Sci. Eng. 2022, 10(12), 1800; https://doi.org/10.3390/jmse10121800
Submission received: 26 October 2022 / Revised: 17 November 2022 / Accepted: 18 November 2022 / Published: 22 November 2022
(This article belongs to the Section Ocean Engineering)

Abstract

:
Ship route planning is a crucial activity that must consider not only the safety of the ship but also the safe passage of nearby ships in the same space and time. This study aims to provide general route-planning guidance to shipping traffic by improving conventional sampling-based route-planning algorithms in accordance with the maritime environment from a ship operator’s perspective. The obstacle safety margin in a marine environment can be reflected in a binary image map space based on an electronic navigational chart. Consequently, an initial route was created using the probabilistic road map (PRM) algorithm in the configured map space to increase the speed of the conventional sampling-based route-planning algorithm. Based on the initial route created, a designated space—that is, a multi-elliptical area—was created to limit the route-search range. After searching the final route in the designated space based on the rapidly-exploring random tree (RRT*) algorithm, optimal route planning could be achieved by generating a collision-free space graph to remove unnecessary nodes from the searched final route. The simulation results showed that the route was shortened by approximately 33.7 km compared with the conventional RRT* algorithm, and the calculation time was shortened by approximately 2.5 times.

1. Introduction

The International Maritime Organization (IMO) is continuously conducting research to introduce e-navigation for data exchanges between ship operators and onshore management systems and to utilize intelligent systems at sea, including autonomous ships and unmanned ships [1]. Among intelligent shipping systems, route planning and navigation are the most important features, their fundamental aims being improved life safety, navigational safety, efficiency at sea, and protection of maritime safety. In general, for safe ship navigation, a ship operator plans a safe route based on the fixed-obstacle information of the navigation area—including islands and shallow waters—before the start of the voyage. Additionally, a vessel traffic service (VTS) monitors and controls collisions and groundings based on the predicted routes according to the ship destinations in the VTS area [2]. As such, a ship’s route planning is an important operation that must be considered not only for the safety of the ship but also for the safe passage of nearby ships in the same space and time.
Route-planning algorithms for moving objects can be classified into global and local route-planning algorithms. In this study, we considered the global route-planning problem for generating a safe, collision-free route amidst fixed obstacles at sea. The most important problem in global route planning is allowing moving objects to determine the optimal route in a given form space. Here, the optimal route is the shortest route that can be found while avoiding obstacles from the starting point to the final destination.
The global route generation algorithm is a process of searching for and selecting the most appropriate route for objects among several routes configured in the map space, and it has two steps. The first step is identifying all routes through which an object is safe from obstacles in a map space [3]. The cell decomposition method [4] and the roadmap method [5] are used to configure and indicate routes in the map space. The cell decomposition method decomposes the map space into movable and immovable areas using cells. In addition, the cell decomposition method can be divided into exact cell decomposition [6,7] and approximate cell decomposition [8]. Exact cell decomposition determines obstacles and constructs cells using a geometric-based algorithm using convex polygon decomposition with the trapezoidal decomposition method. Approximate cell decomposition is a proposed method for accurate cell decomposition calculation at high dimensions using regular grid decomposition with the quadtree decomposition method. The roadmap method represents a set of feature points in a map space and all routes through a graph or tree. The most common methods of creating roadmaps are visibility graph [9], Voronoi graph [10], probabilistic roadmap (PRM) [11], and rapidly exploring random tree (RRT) [6]. The second step is searching for and determining the shortest path to efficiently move an object from the start point to the arrival point, considering all routes configured in the map space. Dijkstra [12], the A* algorithm [13], and the Bellman–Ford algorithm [14] are the most representative methods for exploring shortest paths. In a graph consisting of sets of nodes and edges, the route is identified between the two vertices with the least weighted sum of the edges. Generally, a ship’s global route generation algorithm aims to generate a route that minimizes fuel consumption or sailing time as a target function. Szlapczynska [15] generated a route to reduce fuel consumption or navigation time using the genetic algorithm, and Sen et al. [16] used the Dijkstra algorithm. Moreover, Vettor and Soares [17] generated routes to increase efficiency using weather data. According to the IMO’s navigation planning guidelines [18], the principle of establishing a ship’s route planning states that safe navigation should be the first goal and that the reduction of navigation time and economic feasibility should be considered. In this study, we considered generating efficient routes to ensure safety from obstacles in the complex coastal waters. Shah and Gupta [19] adopted the quadtree representation to analyze the changes in large marine environments to improve computational efficiency. The A* algorithm was used to search the path, and a new heuristic function was established. Niu et al. [20] constructed a Voronoi diagram on the coast of Singapore. In addition, visibility graphs were used to remove unnecessary points from the route calculated from the Voronoi diagram. Ari et al. [21] proposed a technique to determine the shortest routes using the A* algorithm in the presence of obstacles according to the ship’s turning radius constraints. Lee et al. [1] proposed a path generation method that combines quadtrees and visibility graphs in coastal waters and sets the separation distance from obstacles considering water depth information. Shi et al. [22] constructed an obstacle model based on satellite images to identify obstacles in the map space for route generation. Ozkan et al. [23] generated routes to avoid obstacles using image processing based on the ground image for rescue activities using boats in a flooded environment.
Among the global route-planning techniques used to generate optimal routes, sampling-based algorithms can efficiently generate a route within a short period of time in a complex, high-dimensional space. In addition, compared to non-sampling-based algorithms, sampling-based algorithms have the advantage of generating graphs not limited to a specific shape to determine the optimal solution. However, the sampling calculation time increases with a larger map space. The part that determines the interference with the land affects the computation time of the algorithm significantly. Therefore, this study proposed a method for creating a multi-ellipse space that can limit the path search space to reduce the computation time of the sampling-based algorithm. Sampling-based algorithms are used in a variety of fields, including robot engineering and autonomous driving [24]. The most widely used sampling-based algorithms include PRM [24,25], RRT [6,26], and RRT* [27,28]. The PRM [6,25] is a sampling method for multiple query types, which creates a roadmap that connects randomly selected collision-free nodes across a map of fixed obstacles in a graph. The algorithm searches for the route to the end point by connecting a specific start point with a close node among randomly selected nodes while also connecting the closest node from the end point. The RRT algorithm finds the endpoint by expanding the road map from the starting point and repeating the single-query planning algorithm [29,30]. The RRT* algorithm was developed to overcome the limitation that a route generated using the RRT algorithm was not optimal. The RRT* algorithm is identical to the RRT algorithm until a parent node is selected. However, it differs in the next step of the process, where if there is an existing node that can reduce the cost among neighboring nodes within a certain radius, the optimal route is determined by repeatedly replacing the existing node with a random new node. However, the single-query algorithm must create a road map anew when the start and endpoints are changed. Conversely, the multiple-query algorithm can change the start and end points in a road map generated once. Nevertheless, the single-query method is more effective than the multiple-query method in finding the optimal route because of the time required to configure the road map [29,30].
In this paper, we propose a route-planning algorithm in multi-ellipse spaces based on the RRT* algorithm that uses the multiple-query and single-query algorithms in a step-by-step way based on the similarities and characteristics of these sampling algorithms. The algorithm consists of four steps: first, a map space is constructed for the path search; second, the PRM algorithm is used to generate the initial path in the map space; third, the RRT* algorithm generates the final path in the multi-ellipse space created based on the initial path; and finally, among the nodes of the final path generated using the RRT* algorithm, unnecessary nodes are removed to generate a collision-free space graph, and the path is optimized. The purpose of this study is to construct the shortest, safe path amidst fixed obstacles in the sea space and to shorten the time it takes to create a path and the total distance compared to the existing RRT* algorithm. The main contributions of this study are summarized as follows:
  • We constructed a map space reflecting the characteristics of ships and created a global route in coastal waters. Geometric elements and morphological image processing were used to expand the size of obstacles to generate a safe path.
  • By constructing a designated navigational space as a multi-ellipse, our method can generate efficient routes quickly compared to classic sampling-based route planning algorithm methods in a wide range of sea spaces.
  • To simplify the generated route, we used graph algorithms to eliminate unnecessary nodes and visualize the shortest-distance paths, avoiding collisions with obstacles.
The remainder of this paper is organized as follows. Section 2 reviews the literature on route planning. In Section 3, we describe the methodology of pathfinding, and in Section 4, we describe simulations of the South Korean coastal area and related research results. In Section 5, we present our conclusions and discuss future work.

2. Related Literature Review

2.1. Ship’s Route-Planning Process

According to the IMO’s navigation planning guidelines, the principle of establishing a ship’s route planning states that safe navigation should be the first goal and that the reduction of navigation time and economic feasibility should be considered [18,31].
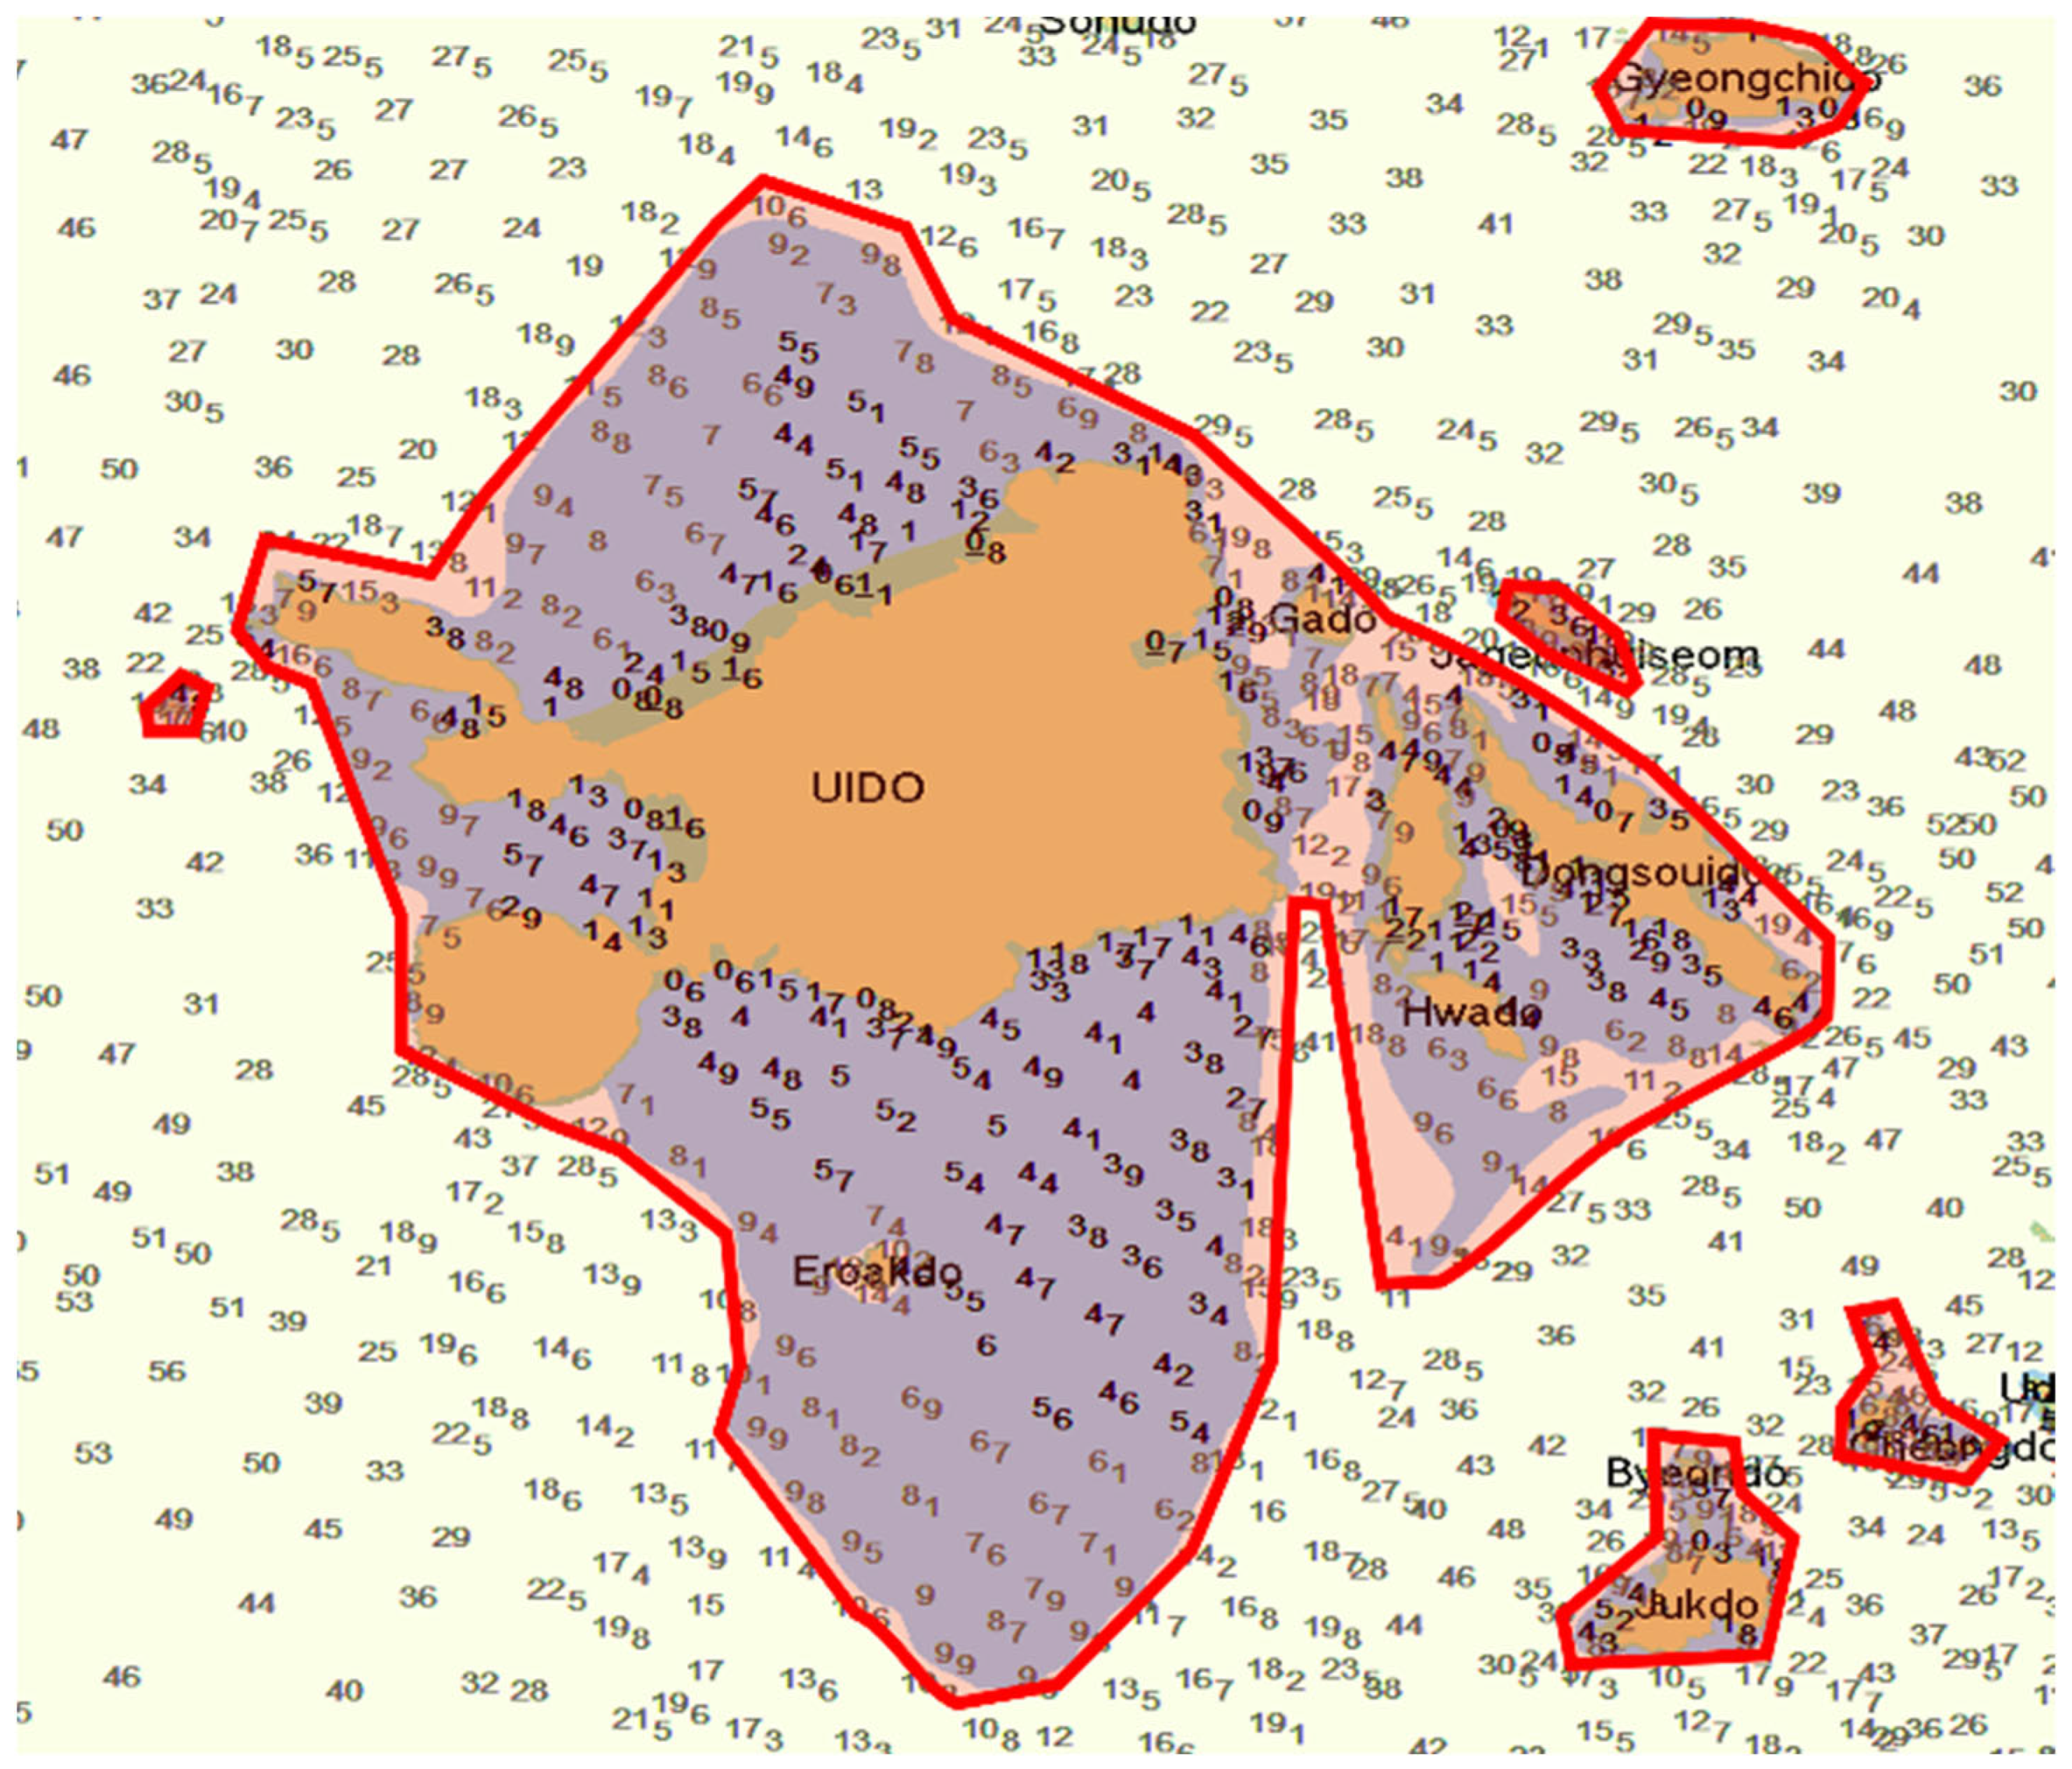
As shown in Figure 1, when the ship’s next destination is determined, the navigator collects the necessary information regarding the planned sea area—for example, the shallow water, land, islands, reefs, and small crags. Based on the collected information, the approximate initial route is drawn on a small-scale chart, and the safety of the initial route is confirmed on a large-scale chart used for actual navigation. While confirming the safety of the initial route, the ship operator should avoid taking a route close to land or passing through a sea area with dangerous substances to shorten the voyage. Moreover, they should be able to navigate while maintaining a safe depth and distance—that is, the navigator should calculate the bottom margin considering the draft of the ship and select a route with sufficient safety latitude. Therefore, the ship operator must identify the safe depth according to the ship’s draft in advance and mark the no-go area on the chart, as shown in Figure 2, to facilitate navigation on safe water. The safe water is where the ship can navigate, except for the water area marked as a no-go area. Moreover, the no-go area is where the ship cannot navigate due to obstacles or low depths of water.
In waters where the tidal range may not be very large, no-go areas include all charted depths of less than the ship’s draught plus a safety margin. Consequently, the line determining the “no-go” area can be selected based on Equation (1) as follows:
Safety   depth =   Max . draught + UKC
According to the Korea Ministry of Ocean and Fisheries (MOF) “Port and Harbor Design Standards” [32], it is necessary to sufficiently secure the under keel clearance (UKC) between the bottom of the ship and the seabed at the maximum draft to ensure navigational safety. The standard stipulates that the ship’s “safe depth” must be secured, as listed in Table 1.
Furthermore, the World Association for Waterborne Transport Infrastructure (PIANC)—a route guide written by port and route design experts—defines the water depth criteria, as shown in Table 2.
Regarding the ship’s “safe distance,” the navigator should select a route and determine the ship’s distance from the coastline and dangerous obstacles in case of navigational negligence or engine failure. A safe distance is required around the no-go areas at a distance that, in the worst probable circumstances, the ship being navigated will not pass. Several factors need to be considered when deciding on the size of the safety margin, as follows:
  • The dimension of the ship;
  • The accuracy of the navigational systems;
  • Tidal streams; and
  • The maneuvering characteristics of the ship.

2.2. Sampling-Based Route-Planning Algorithm

Route searches using the roadmap method can generate a set of routes using a set of feature points from a configured space before generating the optimal route [5,33]. In particular, the PRM and RRT algorithms are sampling-based route-search methods that are efficient in geometrically complex spaces [5,34]. They have a similar method of connecting randomly sampled points in a space into a graph; however, they have different methods of configuring the graph that connects the sampled points.

2.2.1. The Probabilistic Road Map (PRM) Algorithm

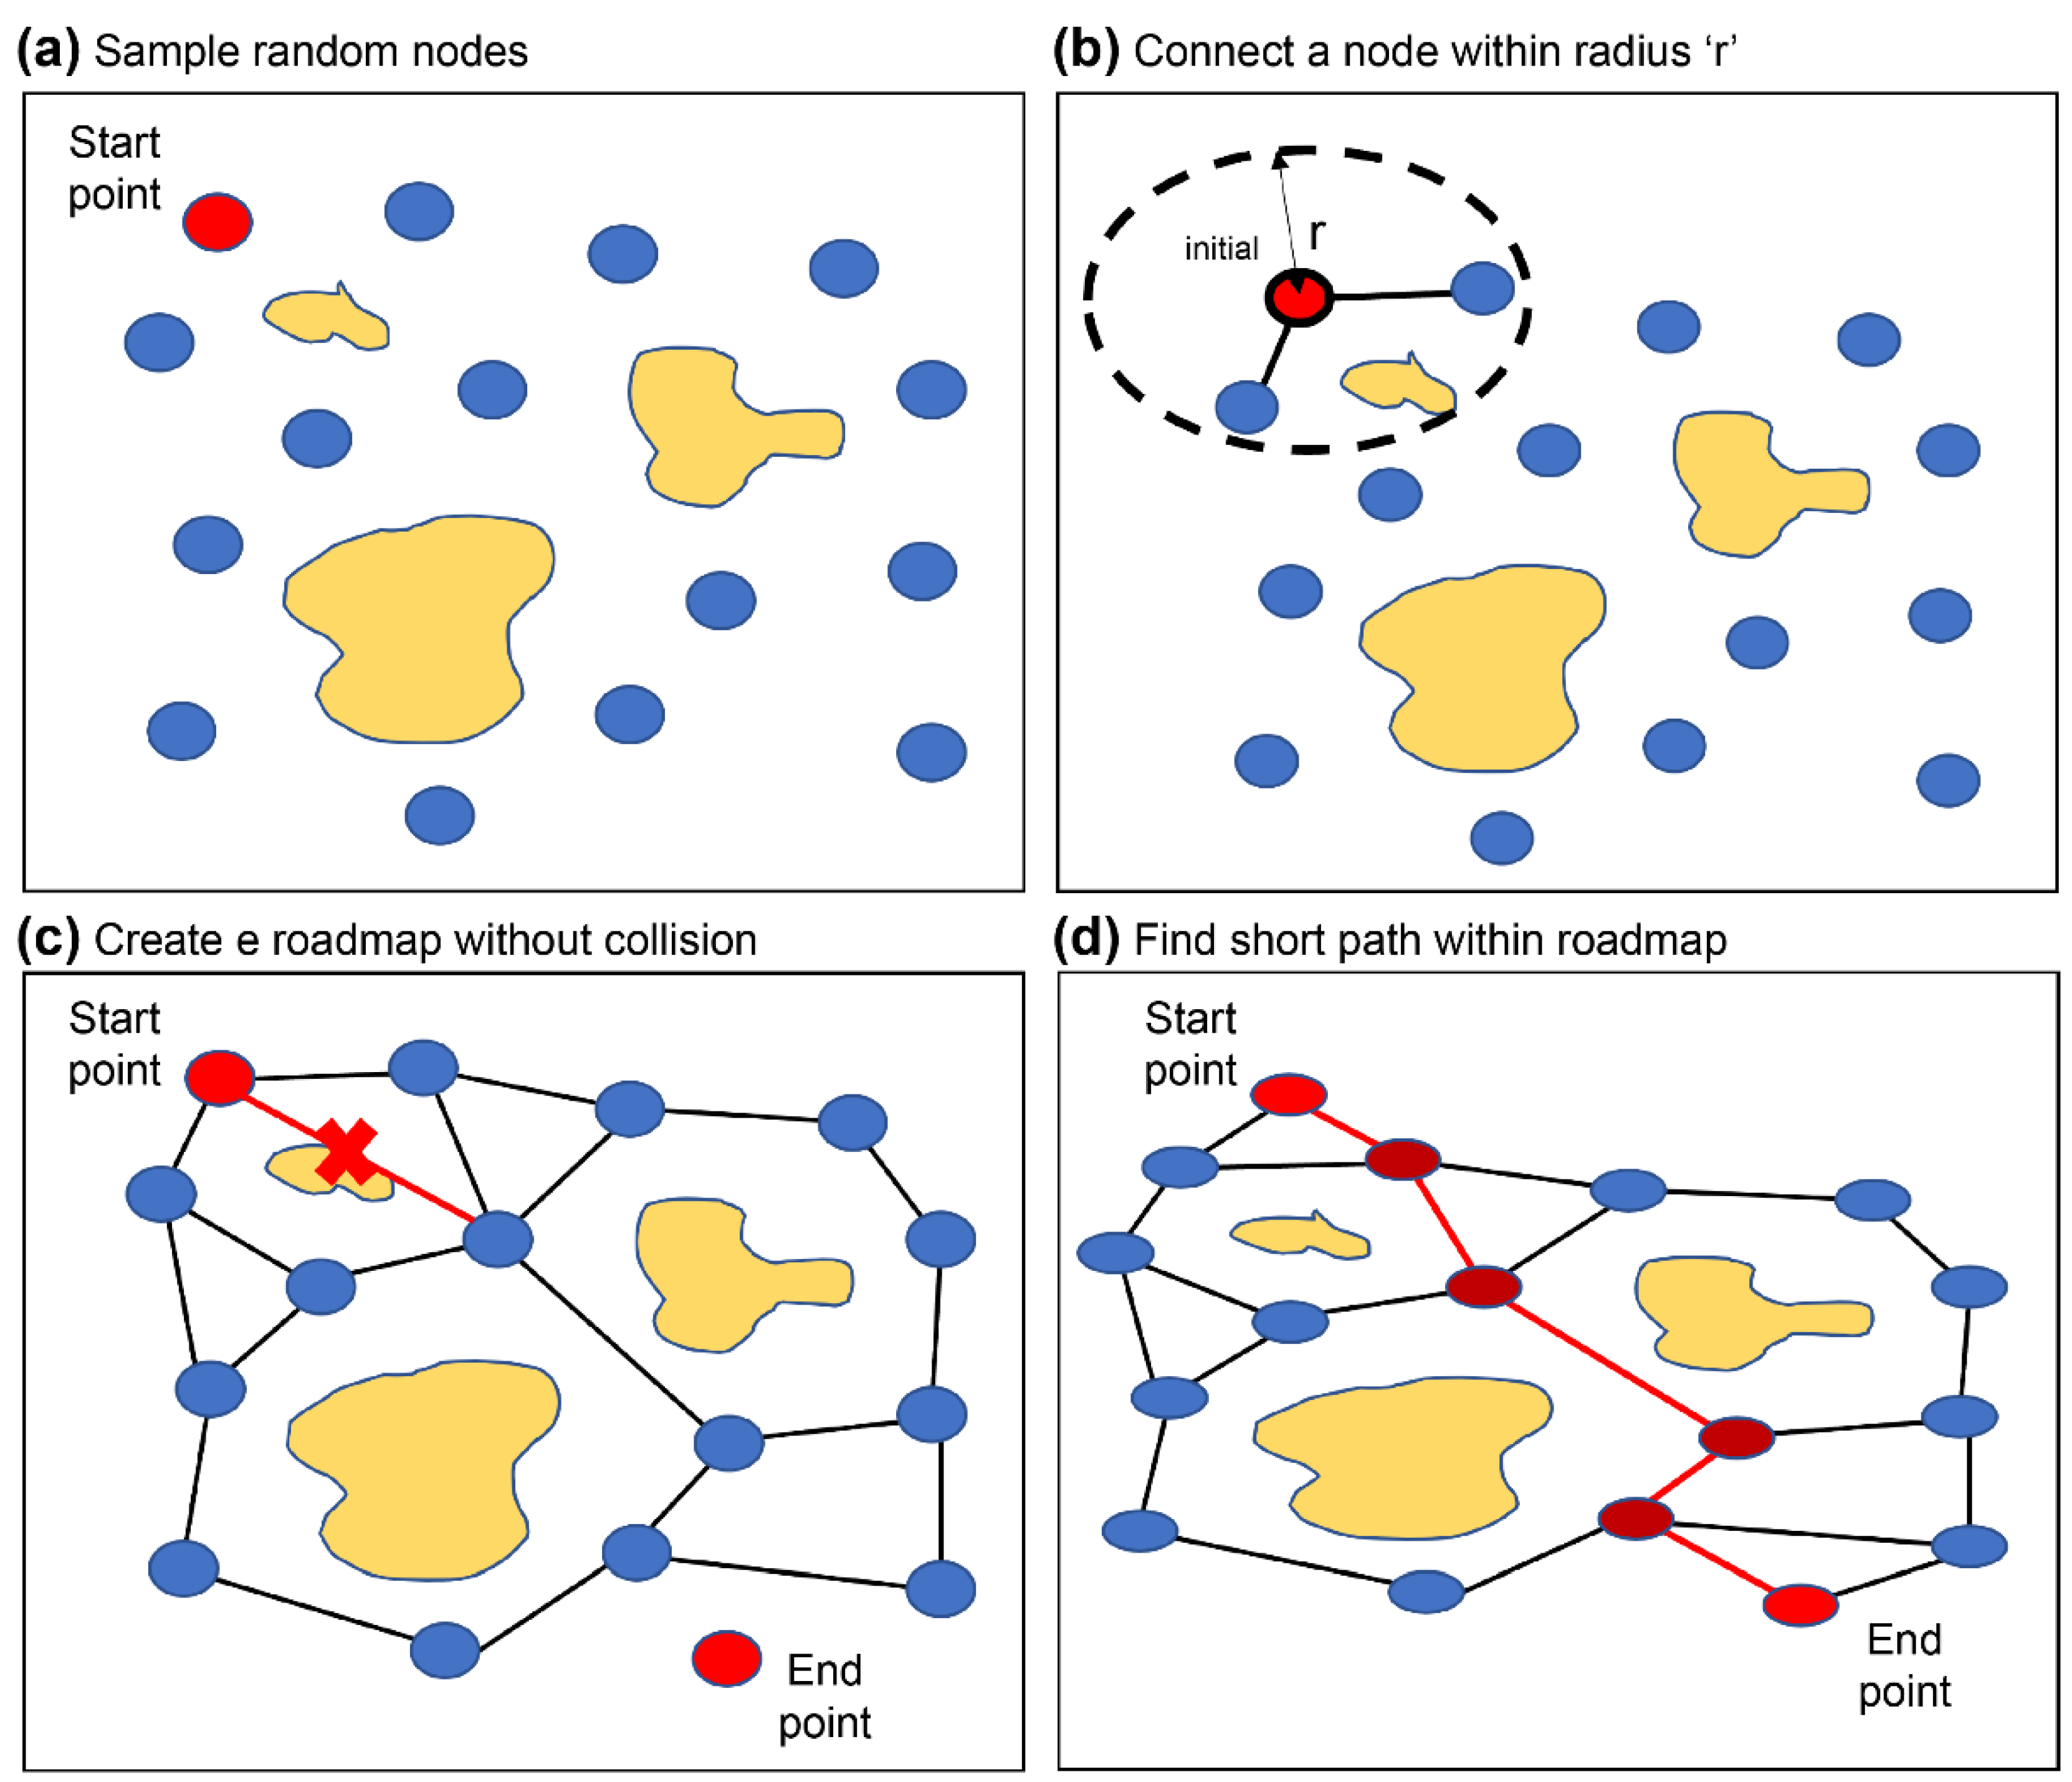
The PRM is a network graph of the possible routes in each map based on free and occupied spaces. The PRM algorithm’s search process in two-dimensional space is shown in Figure 3. First, the nodes are randomly generated in a space with obstacles (a). Whether a node is in free space is checked using the multiple-query method, after which it is connected to the closest node at a certain distance (b). Whether the edge that interconnects the nodes crosses an obstacle can then be determined (c). The roadmap is generated by repeating this process until all samples are passed and the optimal route is found (d) [24,29]. Although the PRM algorithm itself cannot determine the optimal route, the generated roadmap can be used to do so, even when the start and end points are changed. Consequently, it is not necessary to repeatedly create new graphs to determine a single route.

2.2.2. The Rapidly-Exploring Random Tree (RRT) Algorithm

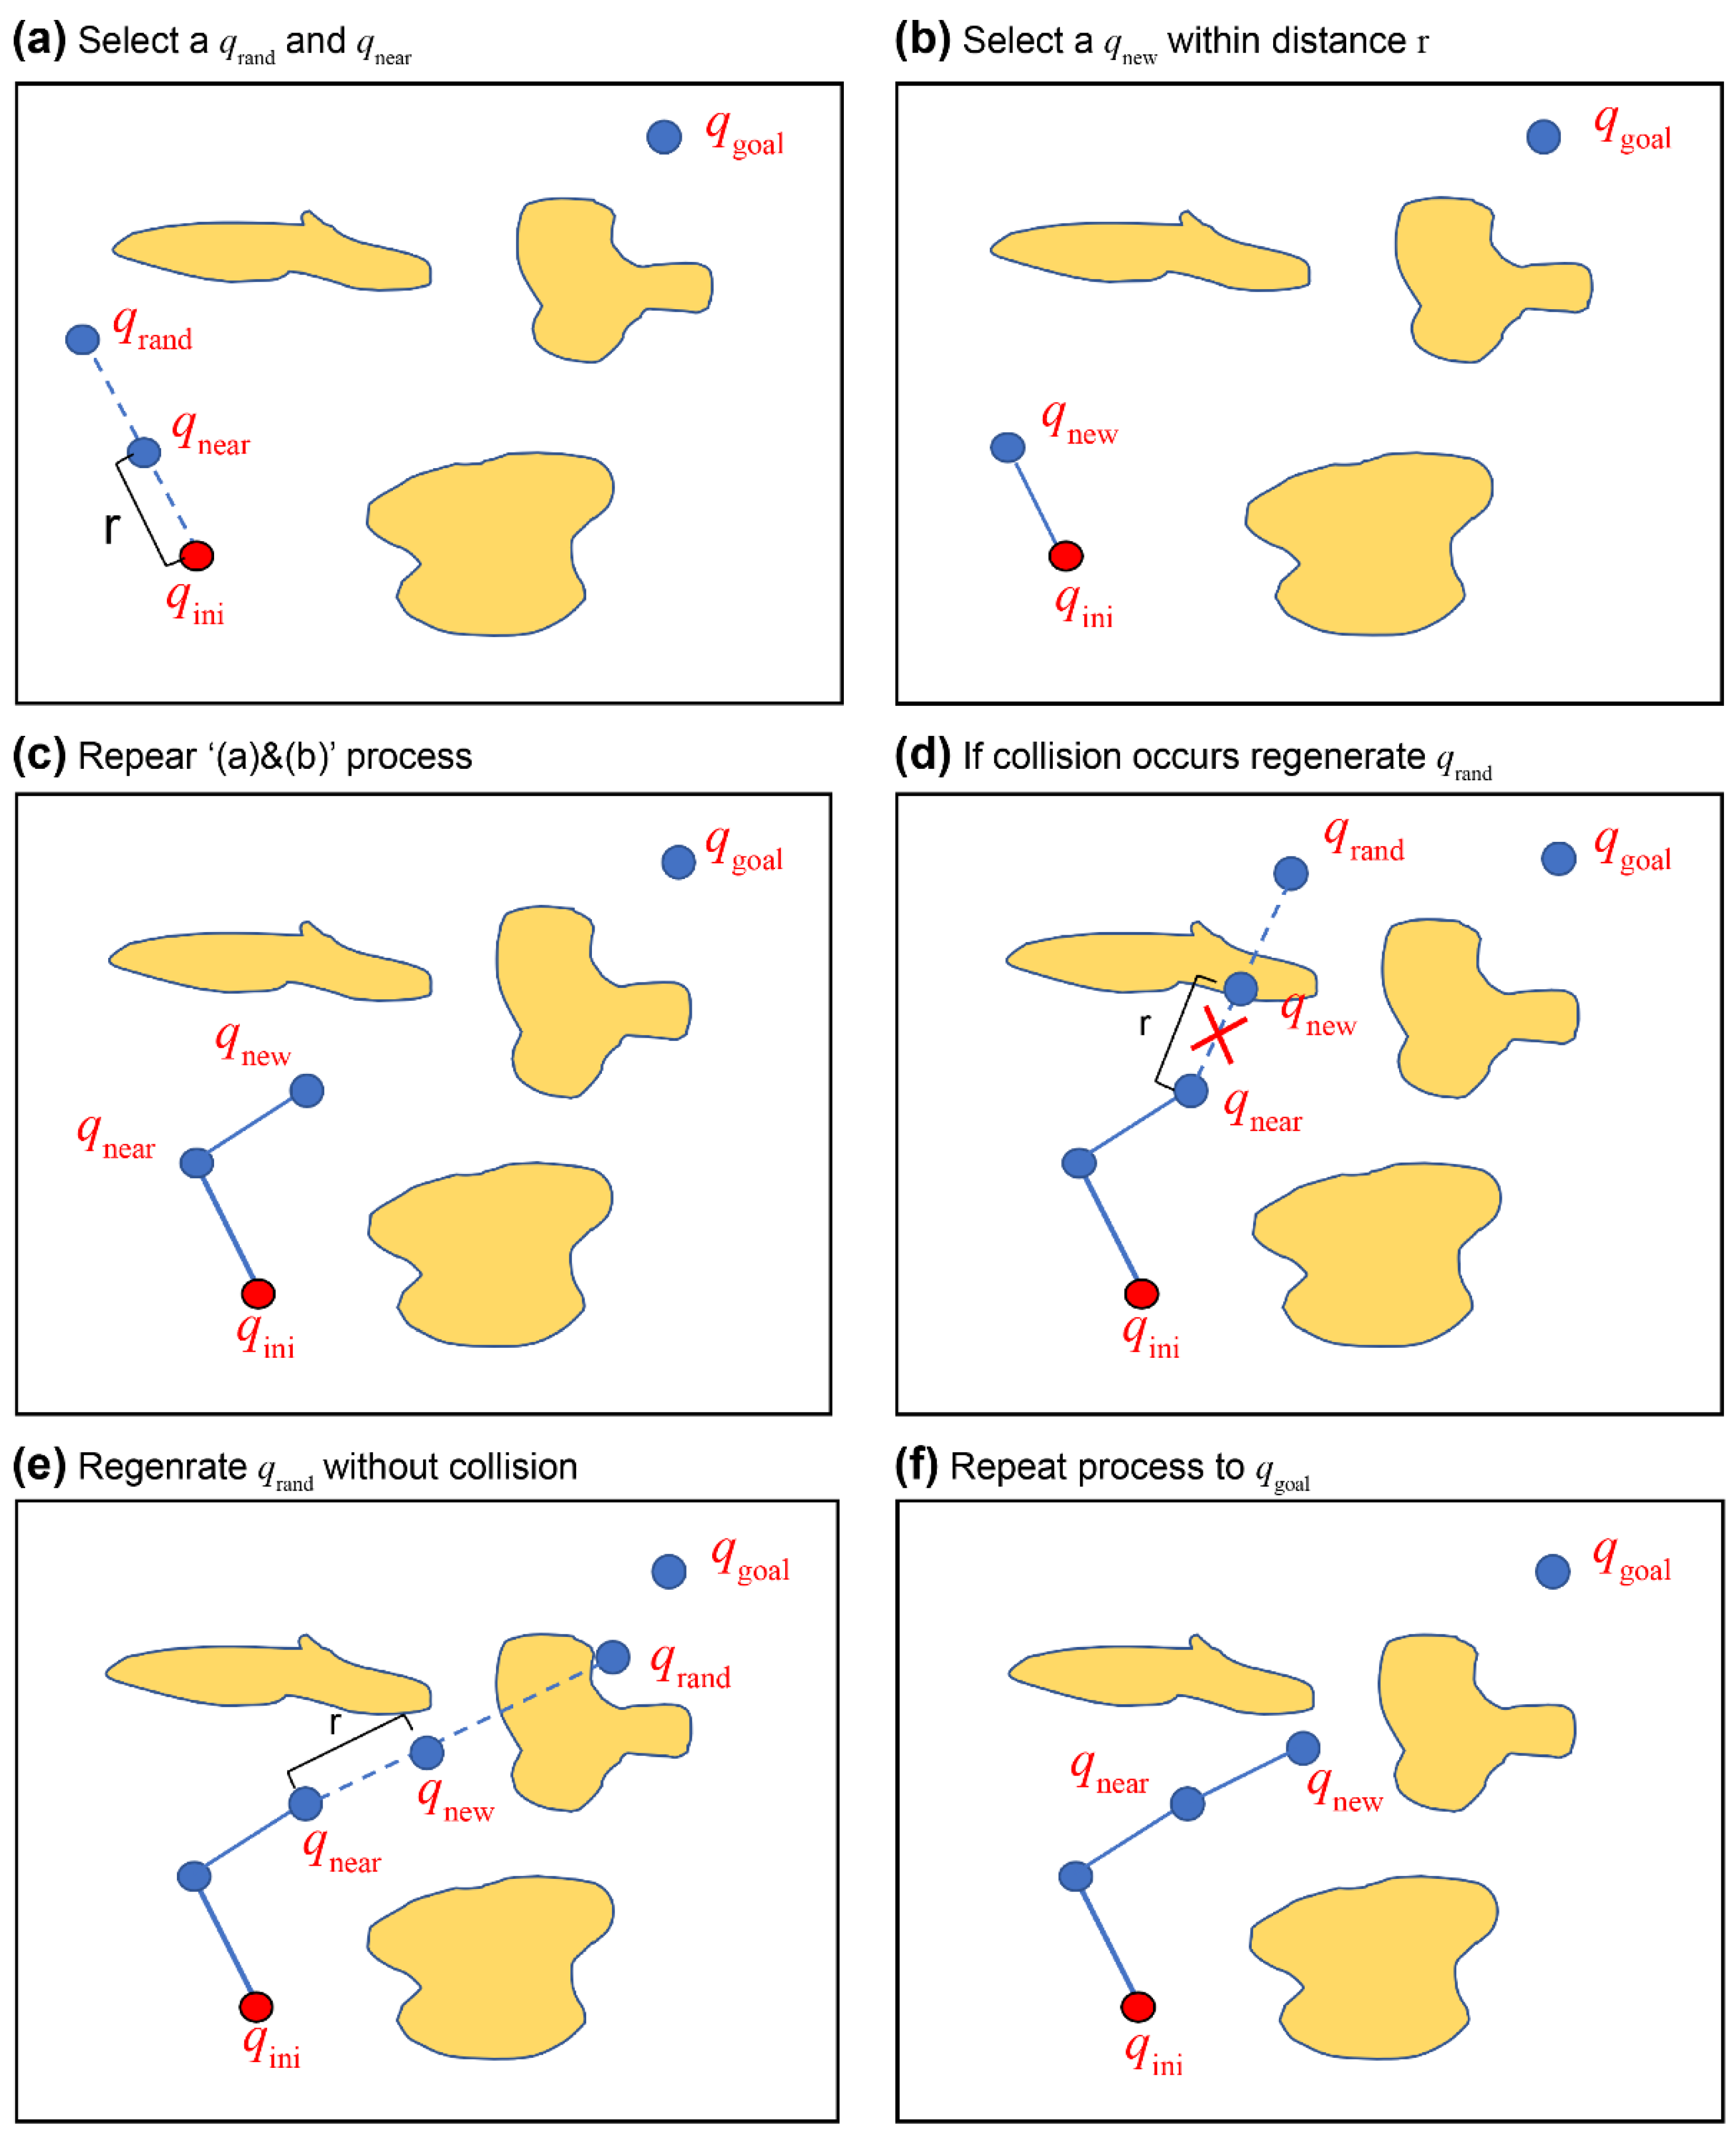
The RRT algorithm is a single-query method that quickly generates a route by finding the destination while expanding the roadmap from the starting point [6]. First proposed by LaValle [26], the RRT algorithm constructs a graph called a “tree,” comprising nodes and edges. As a sampling-based algorithm applicable even to high-level environments without falling into a local optimum, the RRT algorithm has high usability. Moreover, various algorithms have been developed to improve its shortcomings. The RRT algorithm’s search process is illustrated in Figure 4. Every node is connected to another node called a “parent”, and the start point becomes the root, which is the highest parent of a tree. A sample node ( q r a n d ) is generated, and the closest node ( q n e a r ) from q r a n d is found in the tree (a). A node separated by a certain distance ( r ) on a straight line connected from q n e a r to q r a n d is generated as a new node ( q n e w ) (b). q n e w is then added to the tree if a straight line from q n e a r to q n e w does not collide with an obstacle. This process is repeated (c). If the straight line from q n e a r to qnew collides with an obstacle in the tree-expanding step, the existing node q r a n d is discarded (d), and a new node q r a n d is generated. The tree generation process is then repeated (e).

2.2.3. The Improved RRT* Algorithm

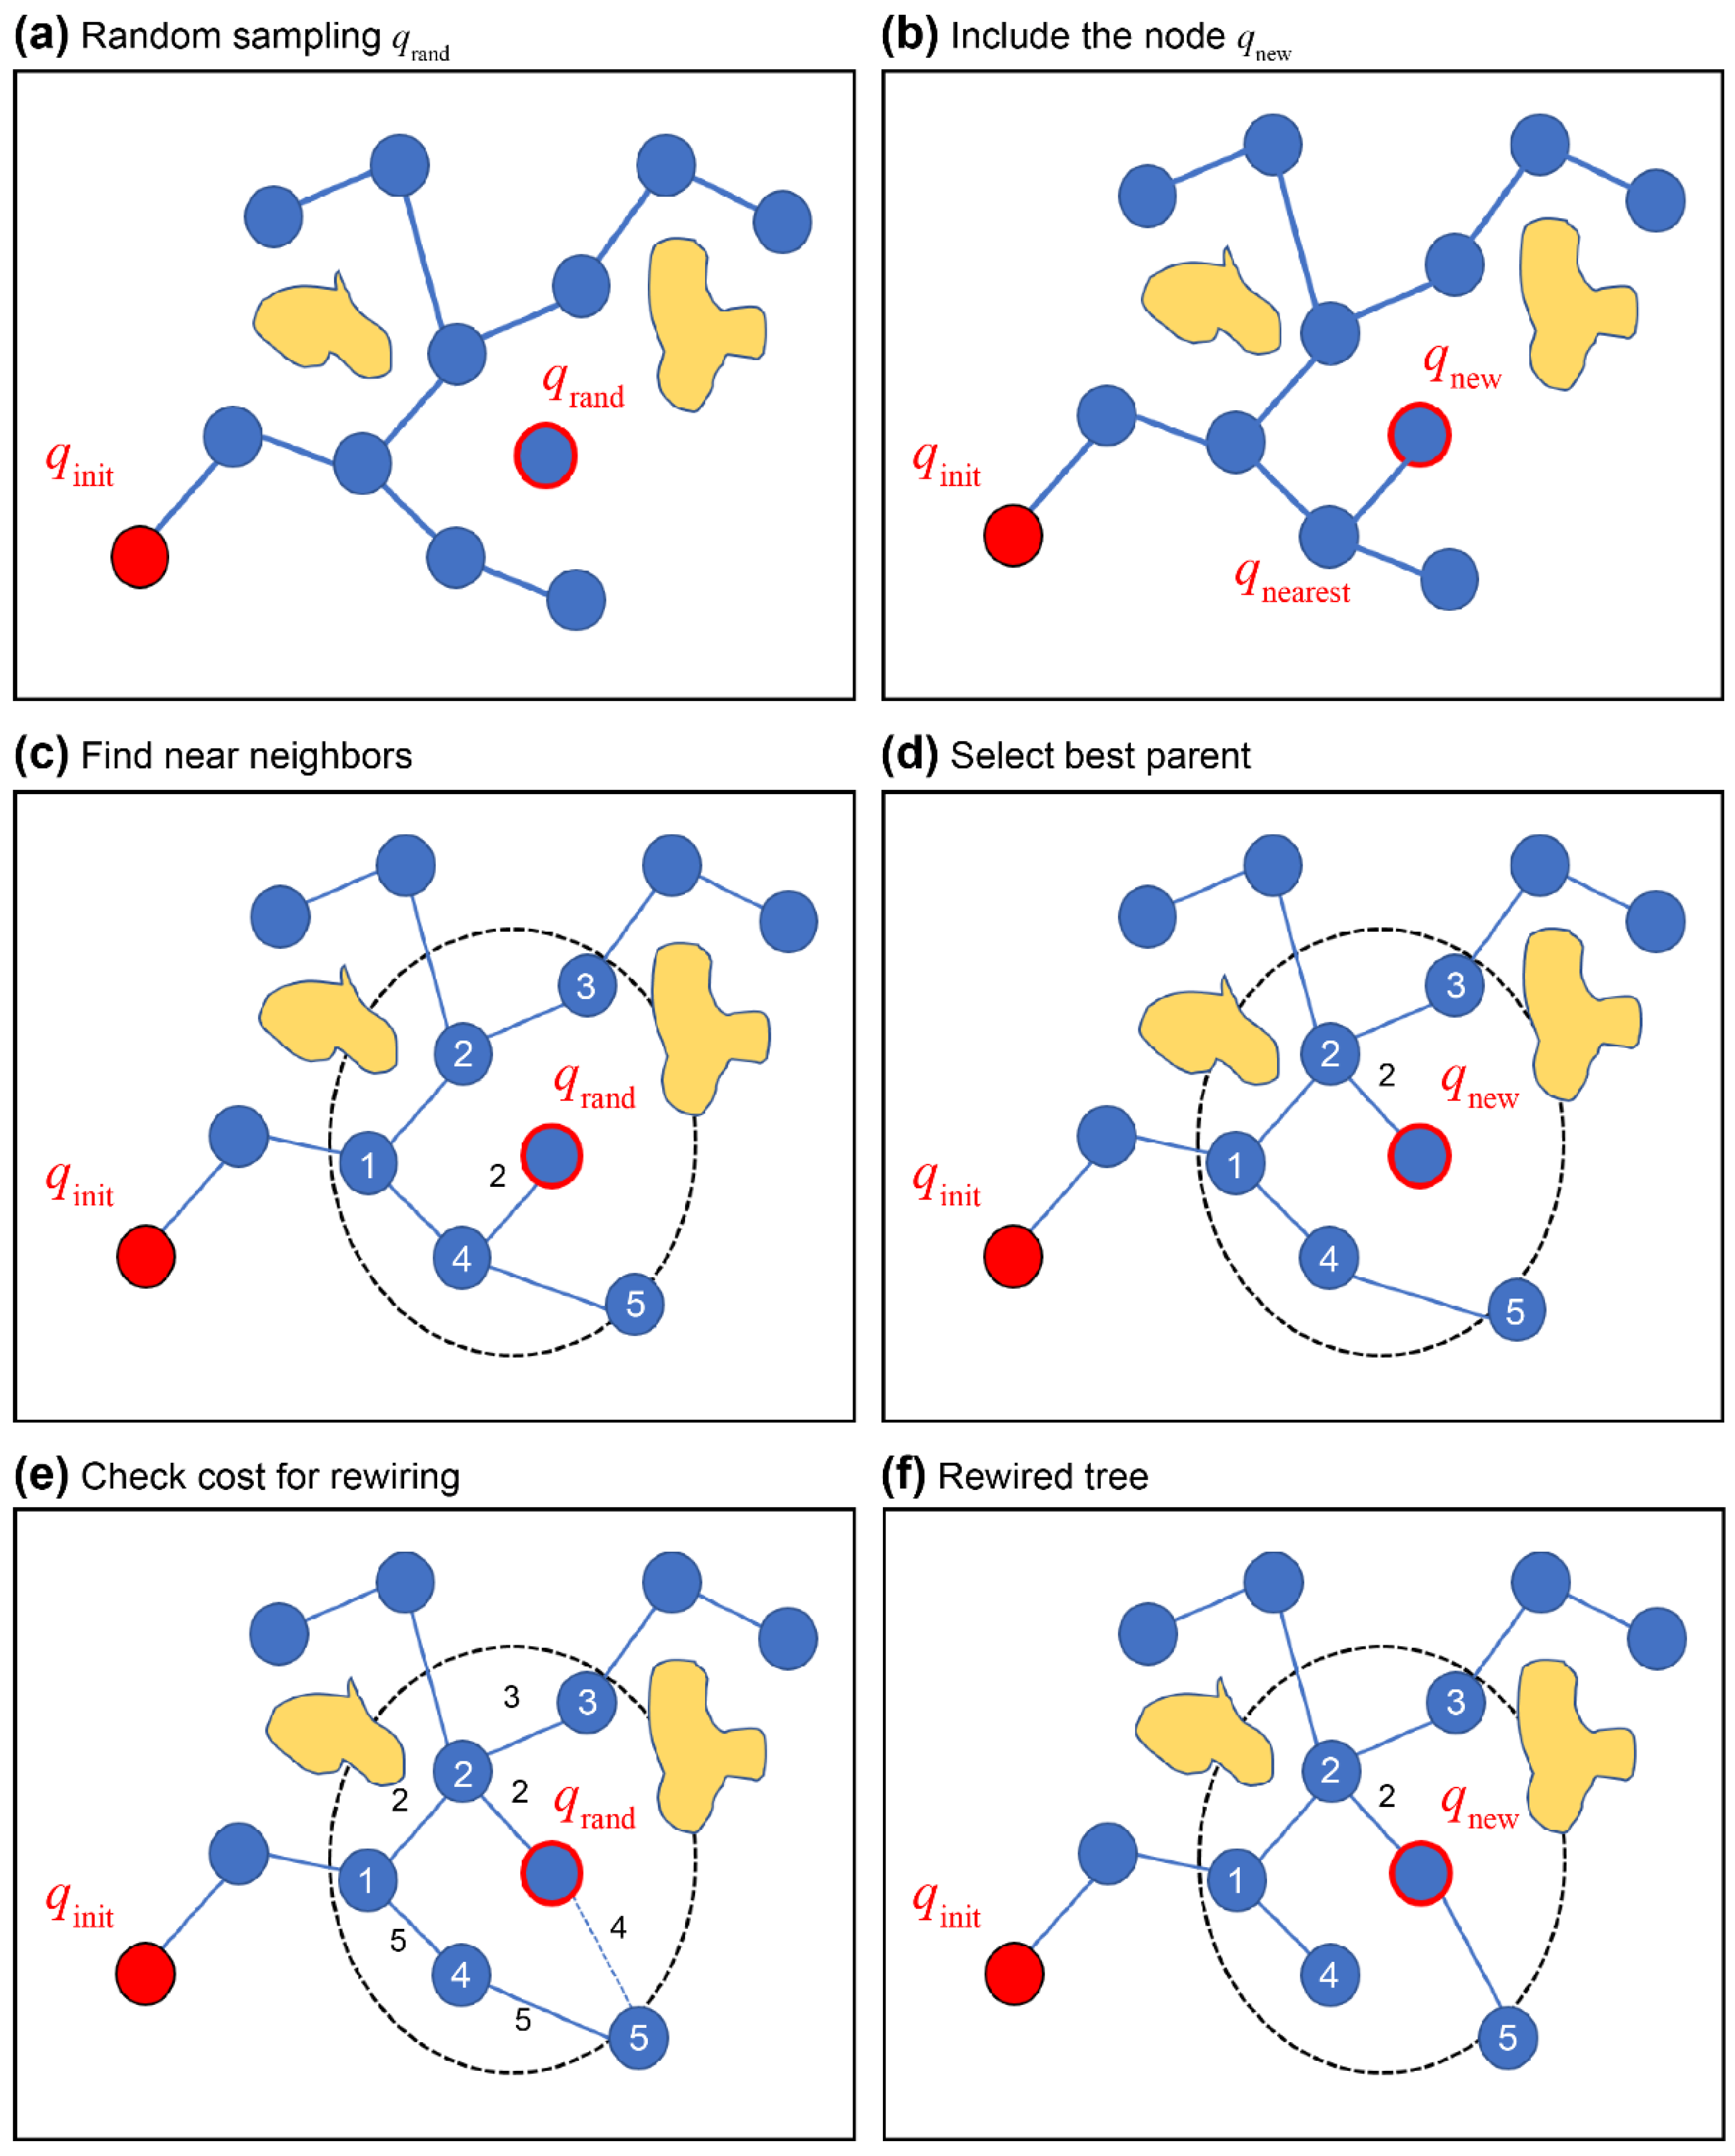
The RRT algorithm does not guarantee the shortest route distance because it does not modify a tree that has been generated. An improved algorithm—that is, the RRT* algorithm [27,28]—replaces an existing node when a random point created in the search area can replace the existing node in the tree while reducing the cost, finding the optimal route while repeating this process. The RRT* algorithm may take some time, depending on the number of sampled nodes and search areas. However, it has distinct advantages in solving high-level optimal route-planning problems, and its effectiveness has been proven in many studies. The RRT* algorithm’s search process is illustrated in Figure 5. It executes the same process as the RRT algorithm until the generation of q n e w (b). However, while q n e a r , which is the closest node to q n e w , becomes the parent node in the RRT search process, RRT* searches for nodes within a certain radius around q n e w (c). It selects a node with the minimum cost as the parent node by comparing the costs of nodes within a certain radius around q n e a r (d). The cost of nodes within this radius is compared with the cost when the nodes are connected as child nodes of q n e w (e). If the cost of connecting a node as a child node is lower, the existing link with the parent node is disconnected, and it is set as a child node of q n e w (f).

2.3. Implications

In this study, we considered two problems regarding global route planning for ships based on sampling algorithms. First, a route reflecting a ship’s safety margin was planned to secure its safety from fixed obstacles; the safety margin included the UKC based on the maximum draft of the ship and the UKC based on the ship’s maneuvering characteristics.
Second, a route was created with the shortest distance and fastest calculation time in the same space as the conventional algorithm. The RRT* algorithm adds a cost function to the conventional RRT algorithm, performing the node rewiring process to achieve more effective route planning using similar computational resources as the RRT algorithm. However, because the RRT* algorithm randomly generates samples over the entire map space, sampling can also be performed in an unnecessary space as the tree progresses from the start point to the end point. For effective sampling in a wide map space—such as a marine environment—it is necessary to improve the sampling area limitation to reflect the characteristics and direction of the moving vessel.
Consequently, this study proposed an optimal route generation algorithm that increased the calculation speed by limiting the sampling area to efficiently solve the problem of determining a ship’s route in a marine environment.

3. Methods

3.1. Process Flow of the Algorithm

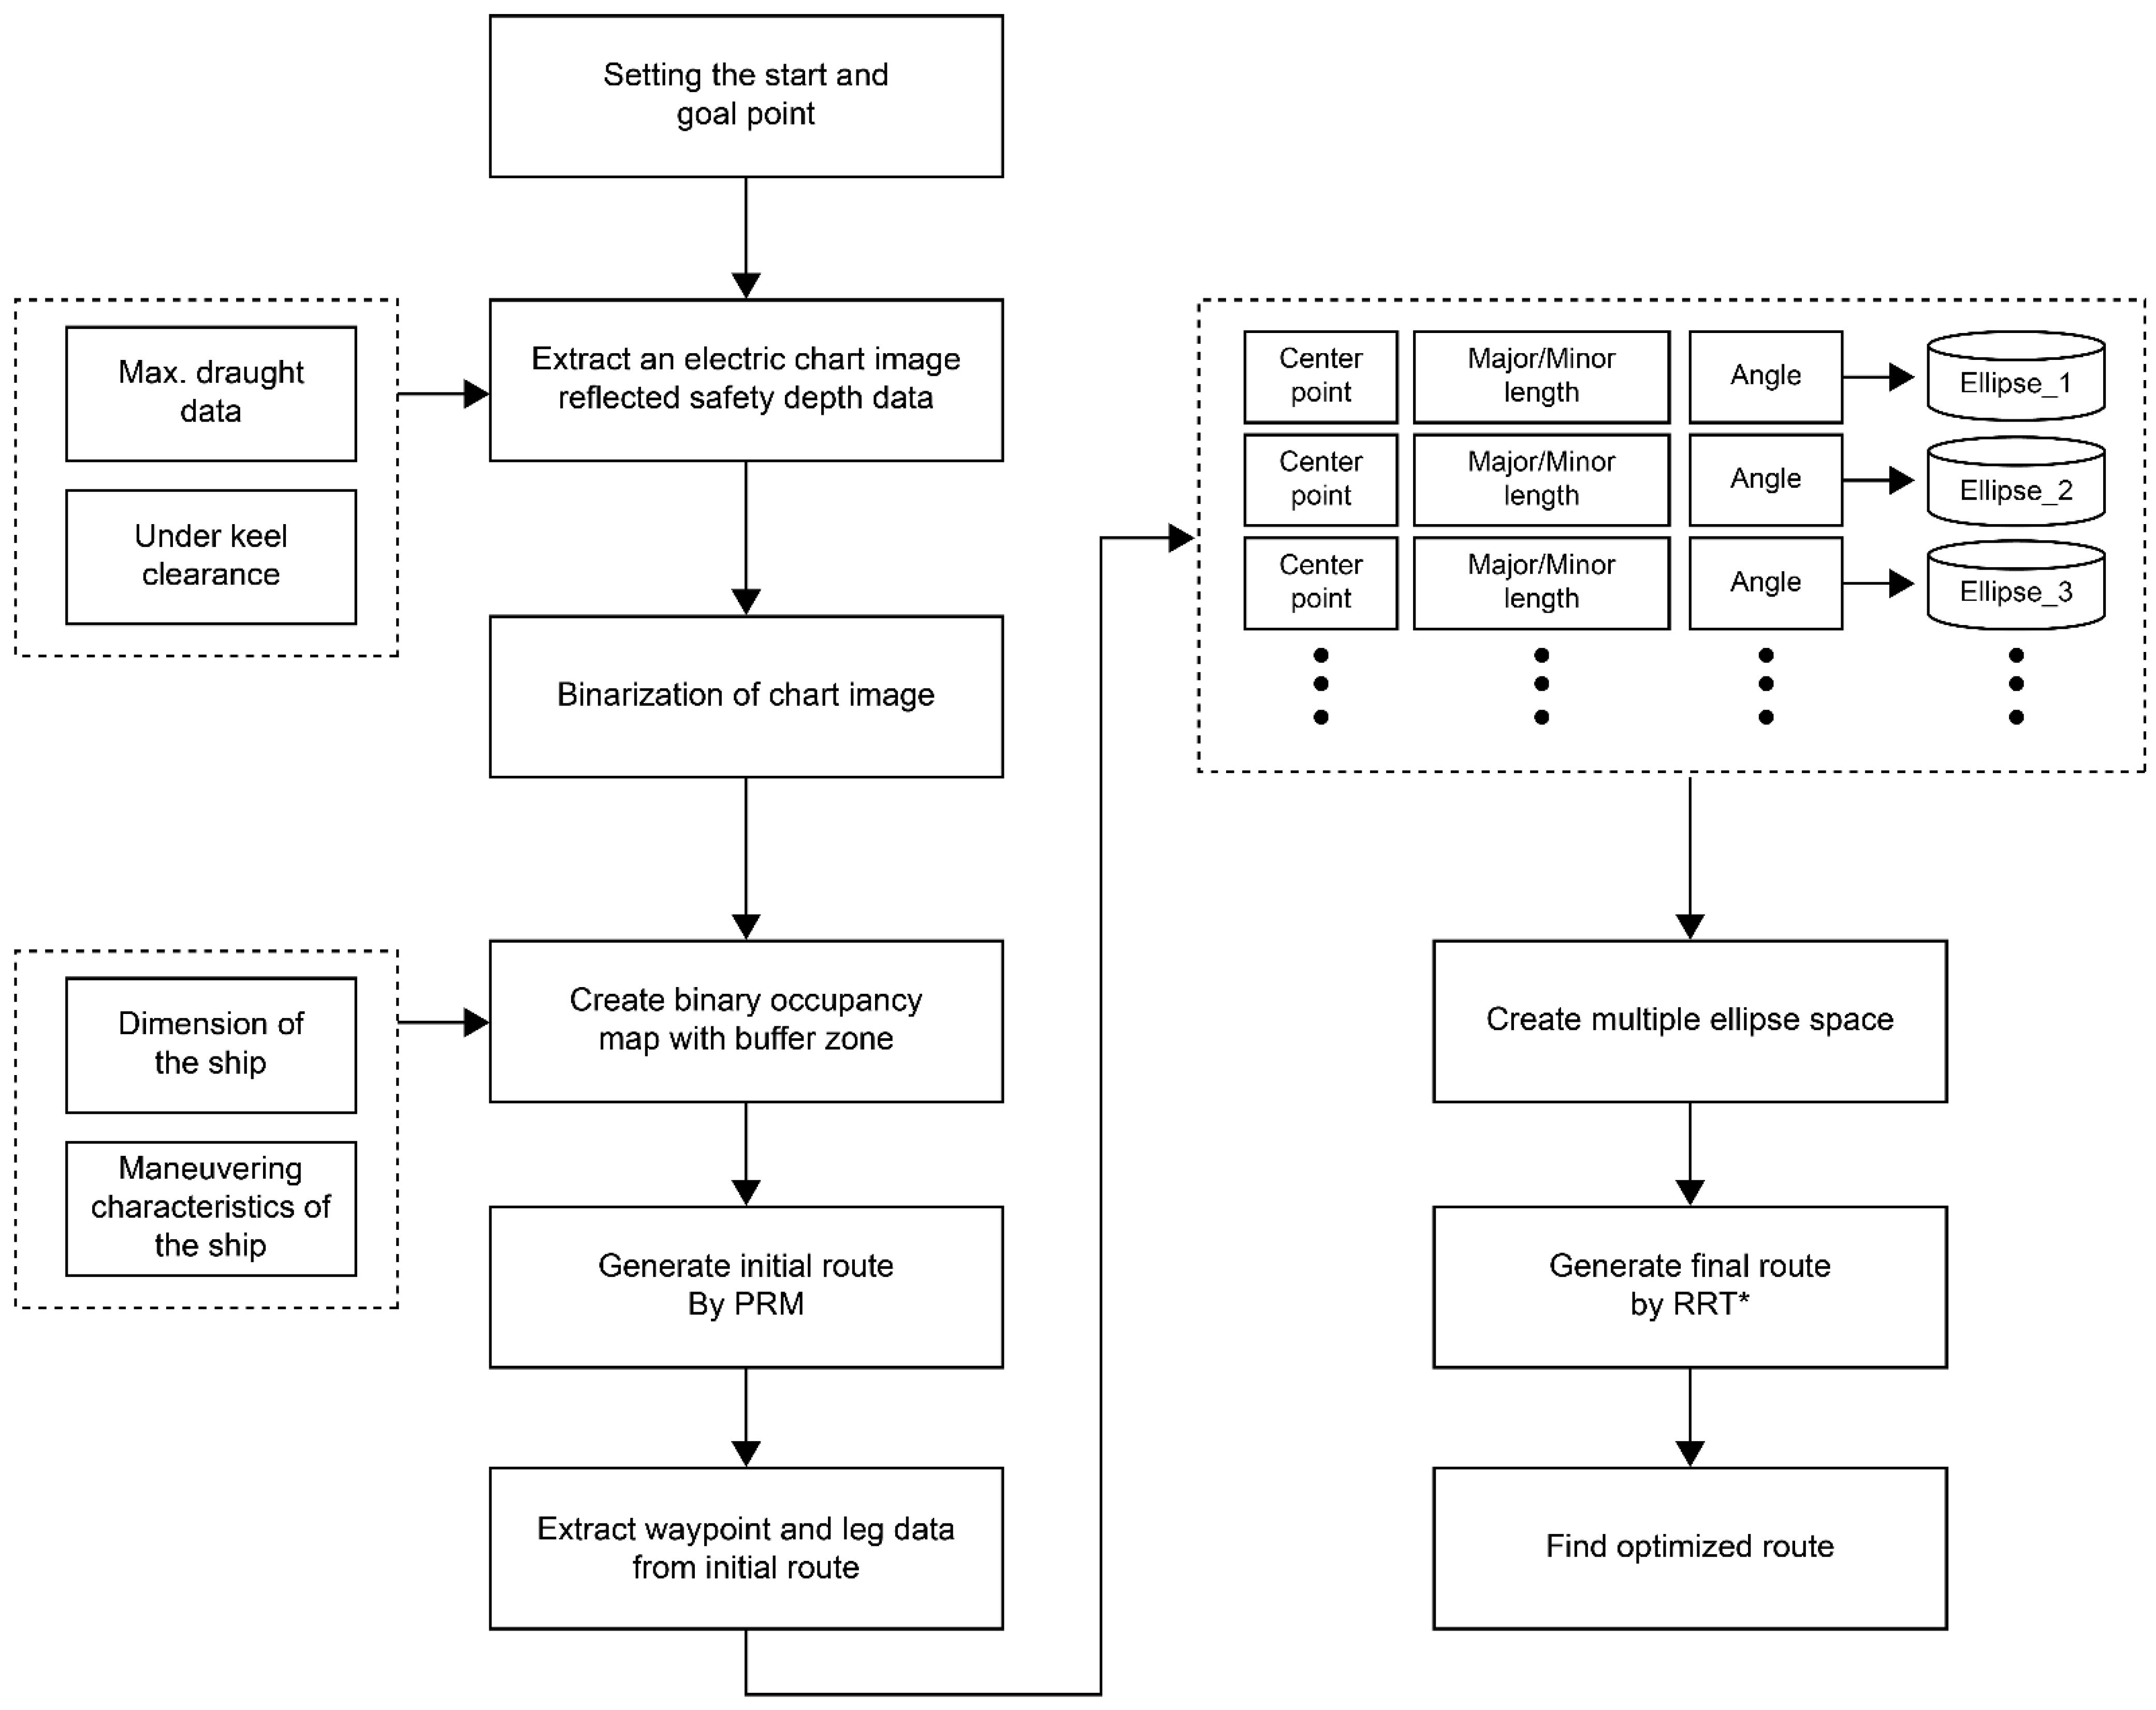
Figure 6 shows the proposed route-search algorithm’s search process. In this study, the PRM and RRT* algorithms are mixed and used step-by-step, with the creation of a multiple-ellipse space that limits the sampling area being added before the execution of the conventional RRT* algorithm. In other words, an attempt is made to induce sampling using the RRT* algorithm within a specified range in the multiple-ellipse space generated using the initial route and to increase the convergence speed. The algorithm is divided into three steps; that is, the PRM-based initial route creation, the RRT*-based route search using multiple-ellipse spaces, and the route optimization. In the first step, an electronic navigational chart image reflecting the UKC of the target ship is extracted and binarized for the initial route generation. The boundary lines of the fixed obstacles that are binarized are then expanded using an image-expansion technique to reflect a safe distance for safe passage. After configuring a binary image as an occupancy map capable of route search, an initial route is generated using the PRM algorithm.
In the second step, the connecting line between the nodes of the initial route is set as a leg, and an ellipse is created in which the minimum width through which a vessel in the target sea can pass for each leg is the minor axis length of the ellipse. A multi-ellipse space is then created by removing the overlapping areas from all the generated ellipses, and the RRT* algorithm is applied within the limited area. Finally, a graph interconnecting the nodes of the route generated using the RRT* algorithm is generated, and the graph-overlapping obstacles are removed. Finally, the optimal route is determined for the remaining graph using the Dijkstra algorithm [12].

3.2. Binary Occupancy Map Creation

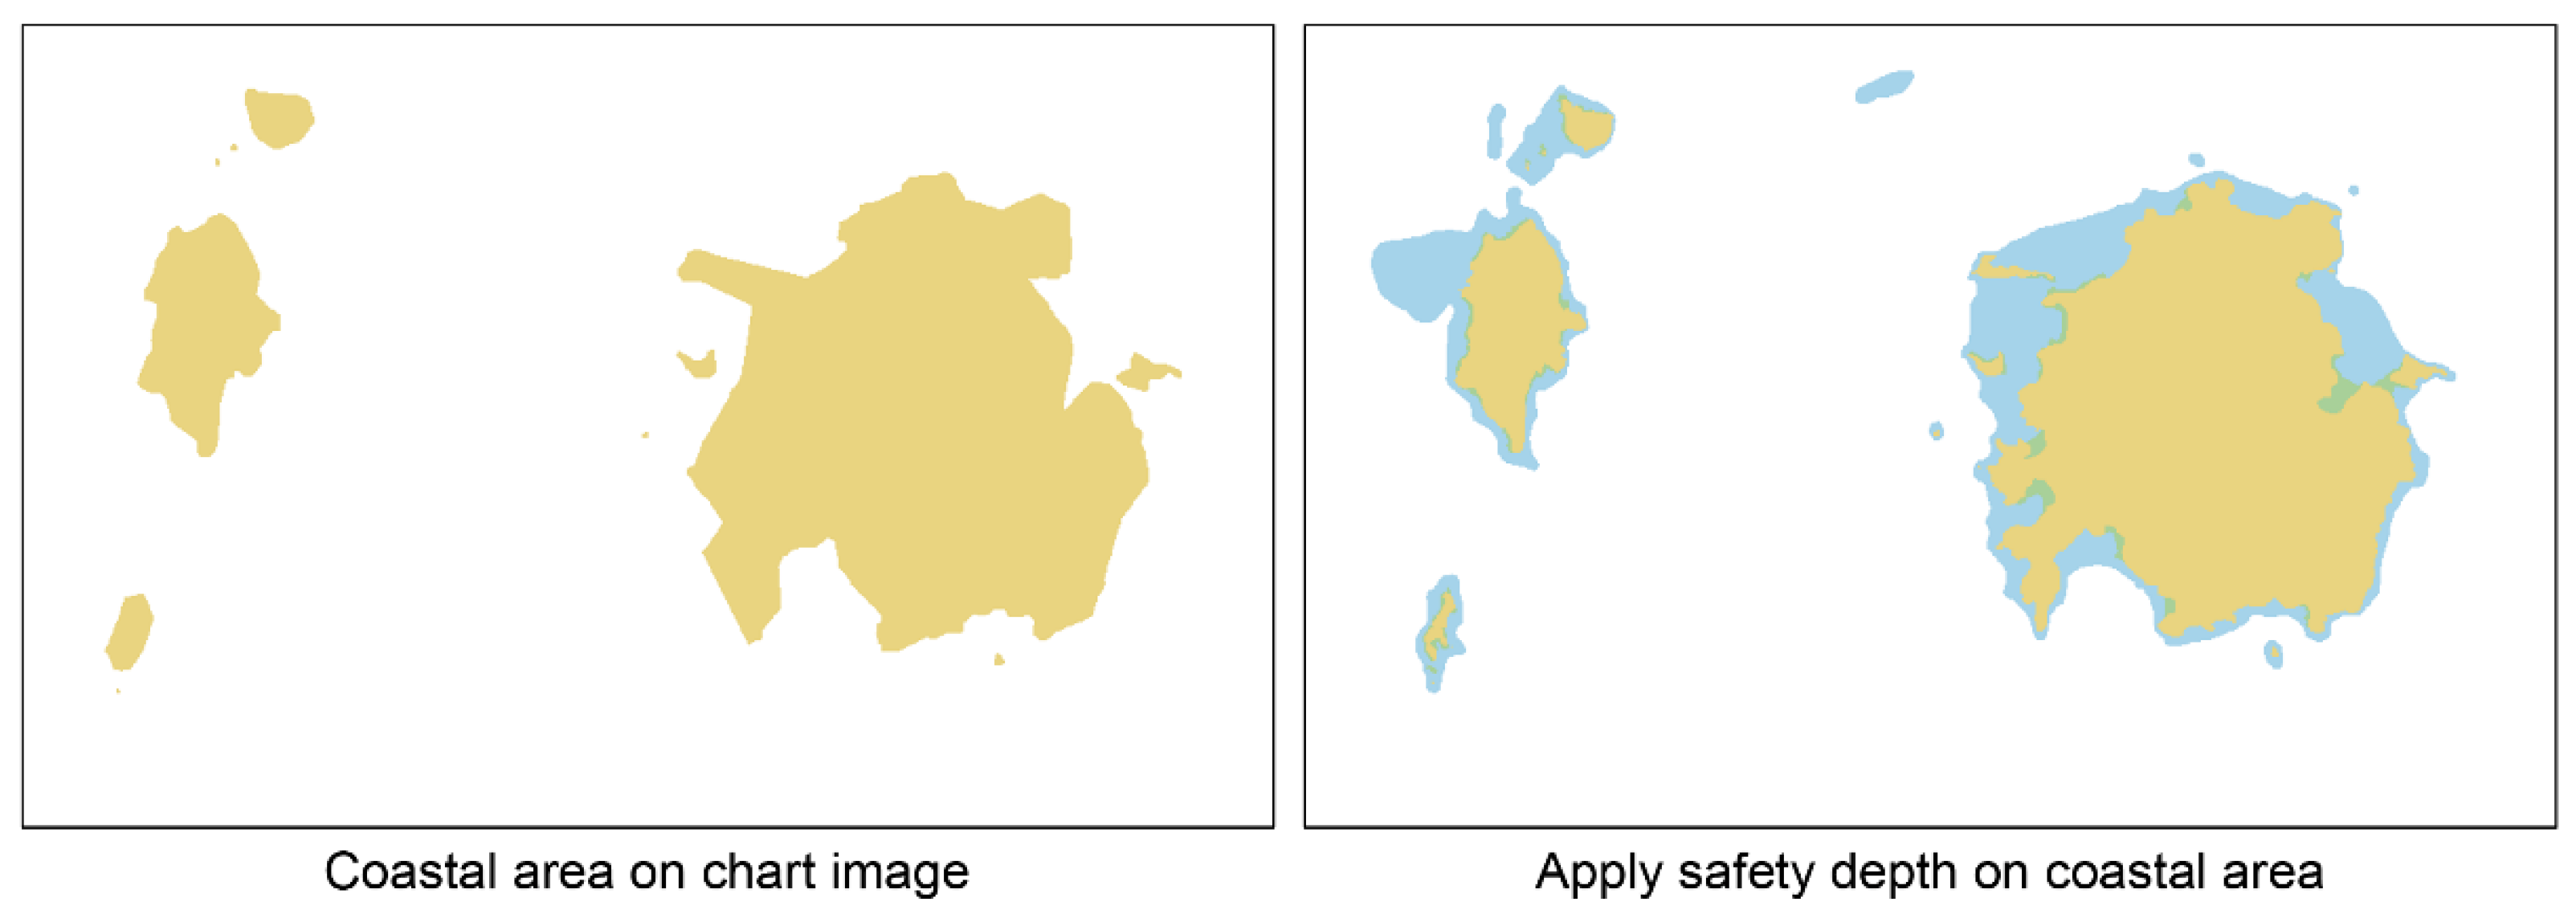
In general, route plans prepared by ship operators are done on paper or electronic charts, the charts indicating the depth of the sea, bottom type, height, characteristics and configuration of the coast, navigational aids, and dangerous obstacles [35]. In this study, a binary occupancy map—which is often used in motion planning—was created using navigational chart images as a map space for route planning. After setting the water depth based on the PIANC safety depth criteria, an electronic navigational chart was created, and an image outlining the safety depth was extracted, as shown in Figure 7.
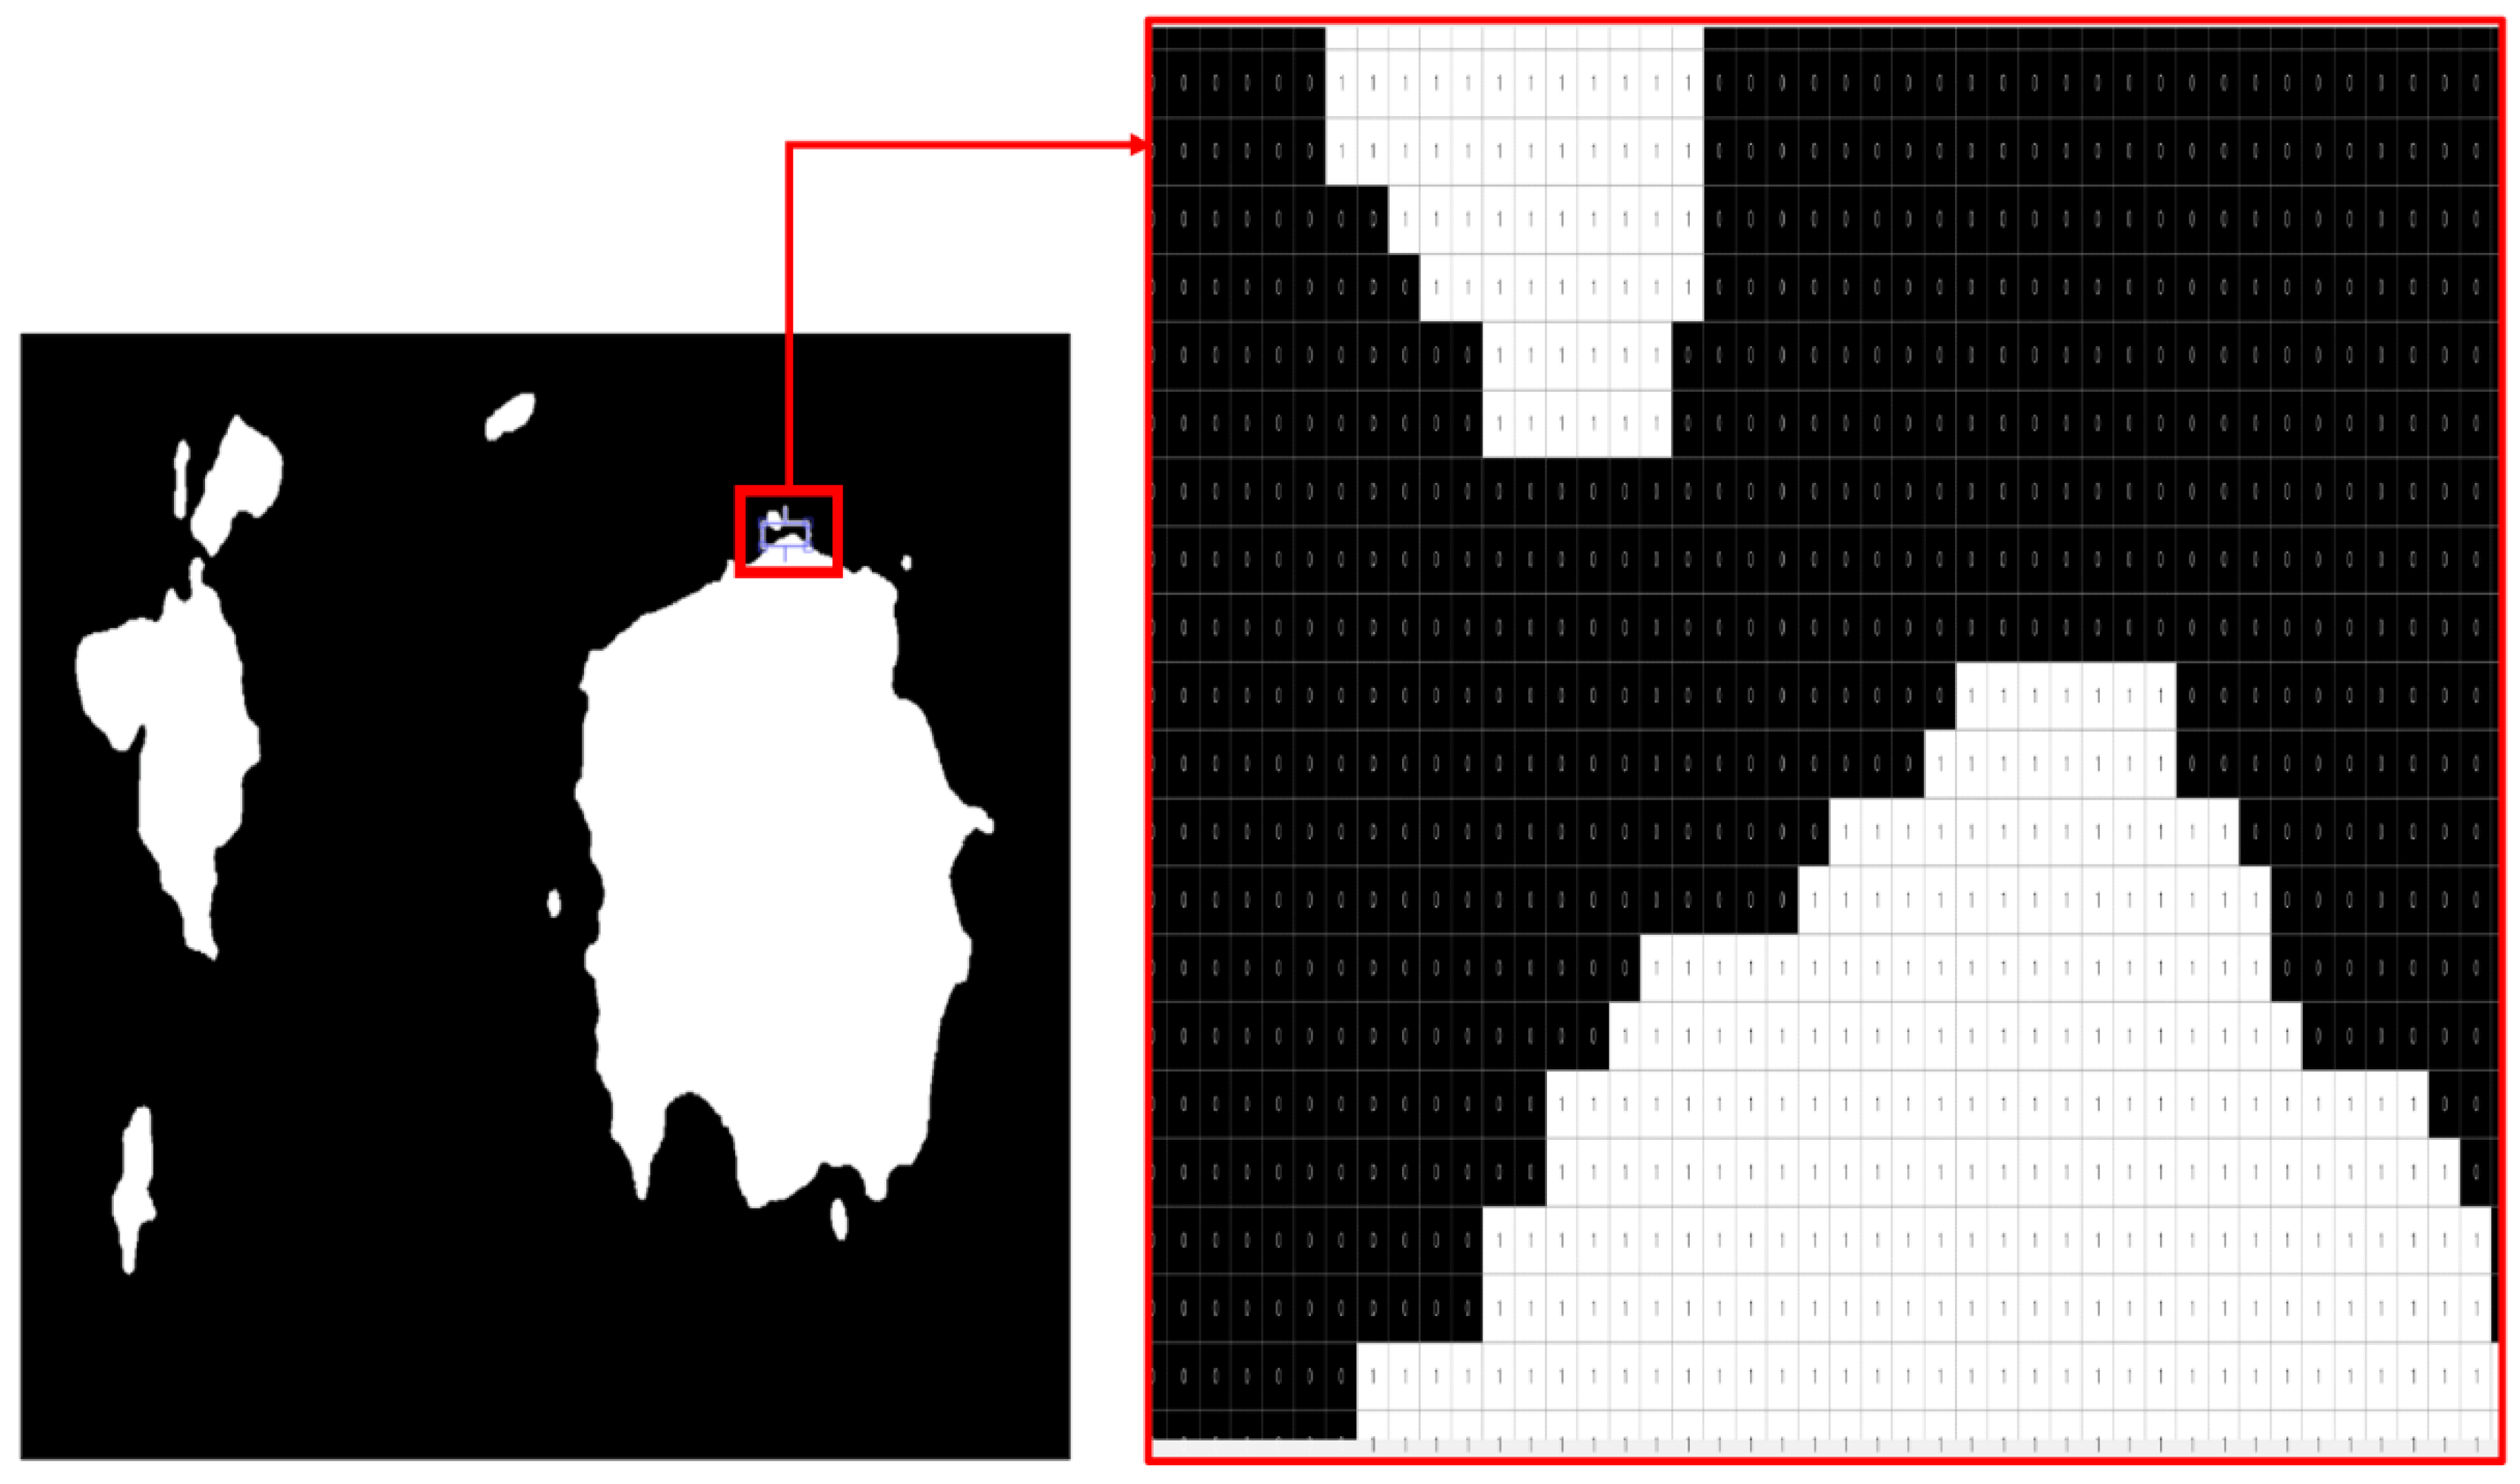
The threshold image segmentation technique was used to transform the extracted electronic navigational chart image into a binary image. As shown in Figure 8, the threshold technique is a global fixed binarization processing technique that turns all pixels brighter than a given threshold white (=1) and all other pixels black (=0). The threshold was determined using the Otsu method, which minimizes the variance within the black and white pixels. The Otsu method selects a threshold by minimizing the internal variance σ 2 W of C 1 = [ 0 ,   c ] and C 2 = [ c + 1 ,   L 1 ] or by maximizing the inter-cluster variance σ 2 B [36,37].
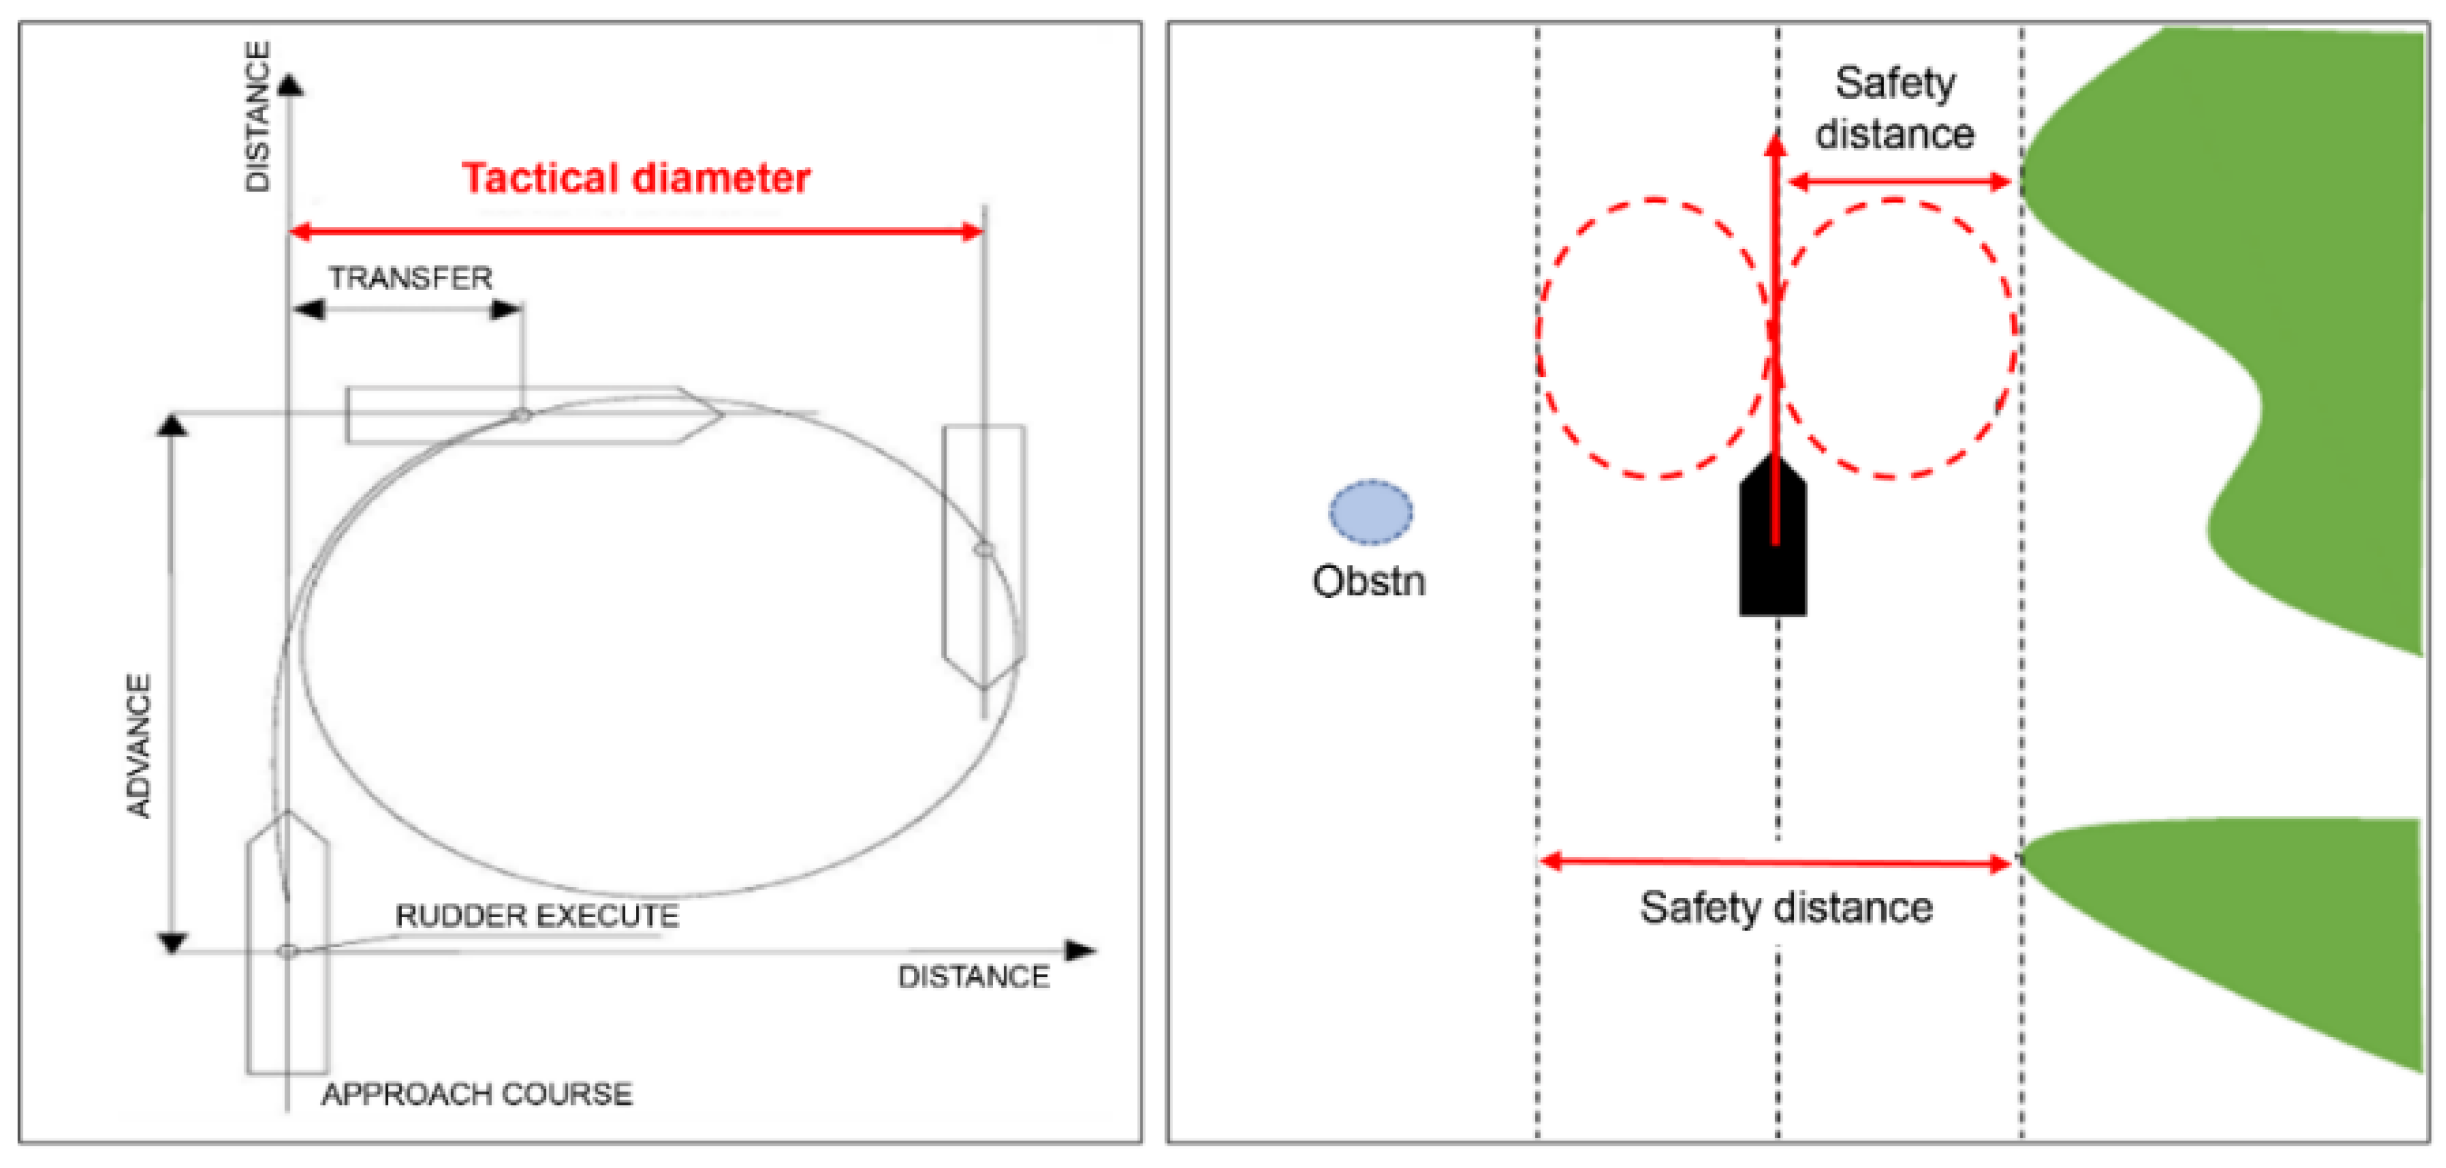
The ship operator sets the safe obstacle distance in advance to prevent the ship from approaching obstacles during the route planning process in sea areas where obstacles exist. The safe distance may vary depending on the ship’s characteristics and operating environment. In this study, the tactical diameter—reflecting the steering characteristics of the ship—was selected as the safe distance, as shown in Figure 9. The tactical diameter, an indicator of the maneuverability of a ship, is the distance measured at right angles to the ship as the hull turns 180° from its original course [38]. The IMO standard steering performance criteria (IMO resolution MSC.137(76) and MSC/Circ.1053) state that the tactical diameter should not exceed a maximum of 5⋅L, where L is the ship’s length. Consequently, in this study, five times the ship’s length was selected as the safe distance based on the IMO standard steering performance criteria.
This study proposed an algorithm to plan the optimal global route for fixed obstacles, rather than local route planning, which searches the ship’s route in real time. Consequently, a binary image-expansion technique that expands the obstacle boundaries, as shown in Figure 9, was used to reflect the safe distance for ships to avoid collisions with obstacles in the route planning process. The boundary line of the fixed obstacle is expanded to five times the ship’s length to create a buffer zone, and a route that can be navigated at a safe distance from the obstacles is generated [39]. Finally, a binary image reflecting the safety depth and safety distance is generated as a binary occupancy grid map with obstacles, as shown in Figure 10. A binary occupancy grid map is a two-dimensional map space configuration method used in motion planning; it is a composite space map that displays free space and obstacles to express empty space for path planning. The binary occupancy grid map uses a white background as free space and black for obstacles; the map can be used to navigate through paths avoiding obstacles. A binary image displays various uncertain distance data using 0 and 1, and uncertain information cannot be displayed in detail on the map. However, as shown in Figure 10, the distance data of binary occupancy grid maps can be represented in detail through the interval in grid space, and the moving objects can identify the presence of obstacles. Binary occupancy grid maps discretize a space into squares of arbitrary resolution and assign each square either a binary or probabilistic value of being full or empty. This study used an image processing method to separate the safe water and the no-go areas. Moreover, the path planning algorithm was simulated on the binary occupancy grid map [37,40].

3.3. Generating Initial Route Based on the PRM Algorithm

The PRM algorithm is a multiple-query sampling method that can be used even when changing the start and end points of the roadmap once it is generated, making it suitable for generating the initial route. In this study, an initial route was generated using the sampling-based PRM algorithm applied to a binary occupancy map reflecting the safety depth and distance. To create an ellipse space in the initial route generated using the PRM algorithm, each node of the route is designated as a waypoint, and the edge, which is a connecting line between nodes, is designated as a leg, indicating the ship’s course. The PRM algorithm converges on the optimal route as the number of nodes increases. However, the number of nodes must be selected based on the size of the map space and the optimality of the route used, as it affects the search time owing to the increasing computational overhead. In this study, the optimal route was determined by setting a sufficiently large number of nodes, as the route was not generated in real time.

3.4. The Designated RRT* Algorithm Using Multiple-Ellipse Space

The RRT* algorithm—that is, the designated RRT* algorithm, which adds a designated space generation method to limit the sampling area—is used to generate an elliptical space with a constant navigable width through the initial route. The RRT* algorithm is then applied to the designated space, called the multiple-ellipse space, by combining elliptical spaces (an ellipse being a curve formed by a set of points whose sum of the distances from two vertices on a plane is constant). If the minor axis of the ellipse is the same as the diameter of a general circle, then the major axis of the ellipse is longer than the diameter of the circle. Consequently, in the route search process, an elliptical area with a larger range in the forward direction than a general circle can be searched. Equations (2)–(4) show the process of finding the coordinates of N [X, Y] points that can be used to draw an ellipse on a plane, as follows:
k = Create   a   vector   of   N evenly   spaced   points   within   0   and   360 ( N = Number   of   coordinates   for   ellipse )
X = O x + { M i n o r x c o s ( k ( p i / 180 ) ) c o s ( a n g l e ( p i / 180 ) )                                               M a j o r x s i n ( k ( p i / 180 ) ) s i n ( a n g l e ( p i / 180 ) ) }
Y = O y + { M i n o r y cos ( k ( p i / 180 ) ) sin ( a n g l e ( p i / 180 ) ) )                                               + M a j o r y s i n ( k ( p i / 180 ) ) c o s ( a n g l e ( p i / 180 ) ) }
where angle denotes the angle of the ellipse (degrees), Ox, Oy denote the center of the ellipse, Minorx, Minory denote the vector representing the ellipse minor axis, and Majorx, Majory denote the vector representing the ellipse major axis.
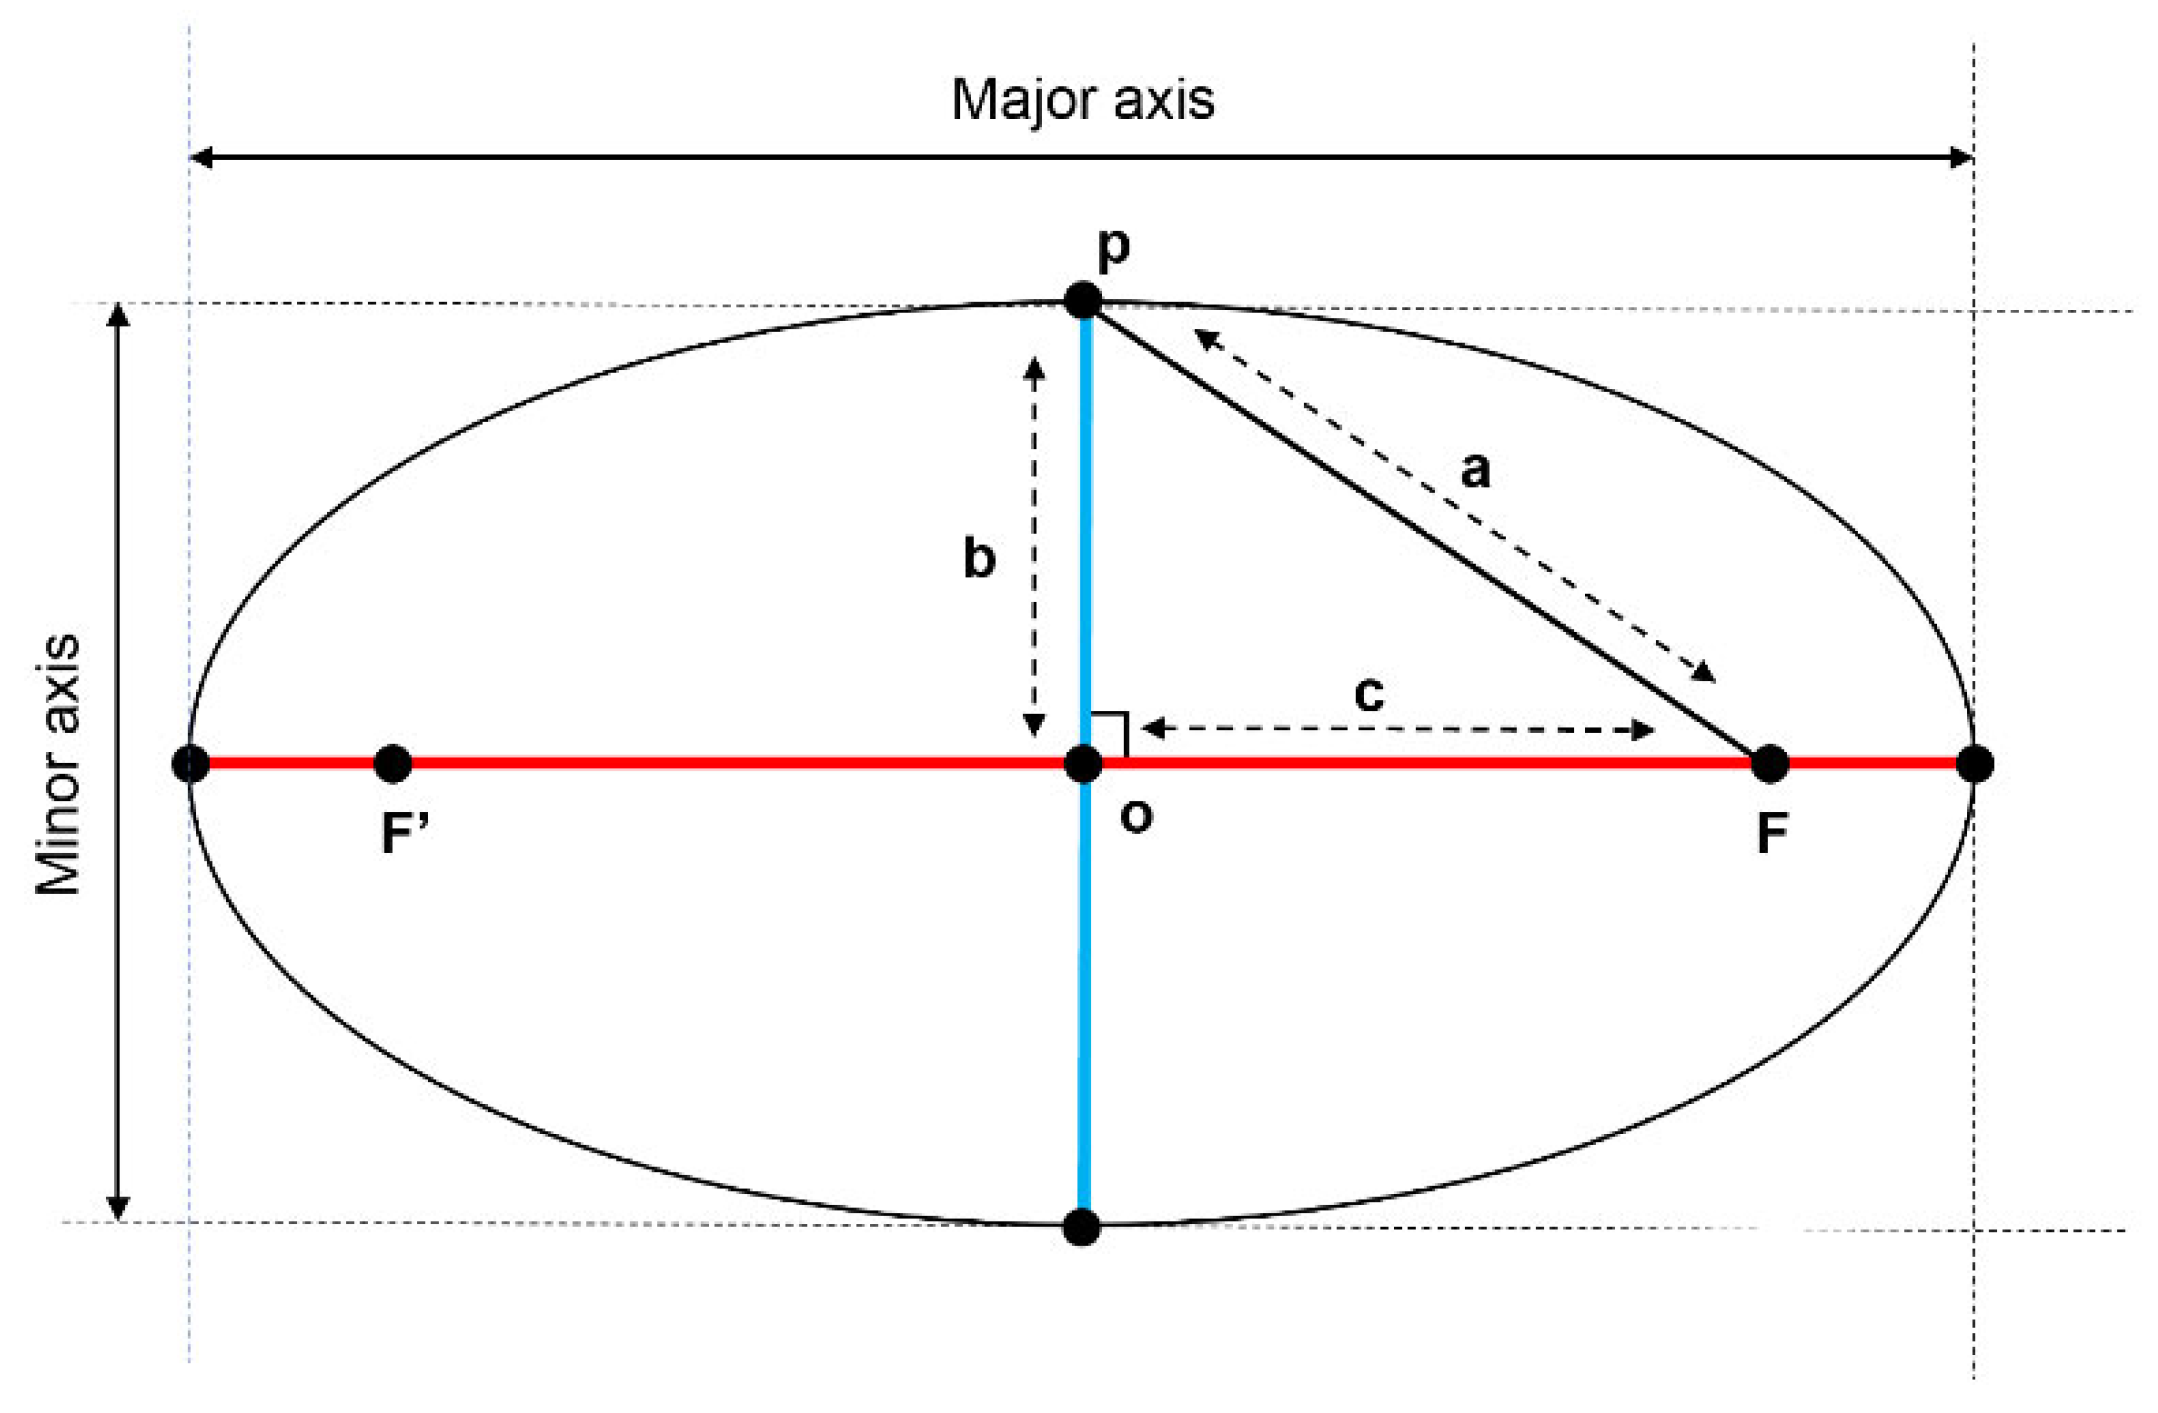
To obtain the coordinates of the [ X , Y ] point necessary to draw an ellipse, the center coordinates, minor axis, and major axis of the ellipse are required. An ellipse can be implemented by adding the angle for each leg, that is, the ship’s course parameter. The center coordinates of the ellipse are then calculated as the midpoint between the waypoints of each leg, the major and minor axes of the ellipse representing the characteristics of the ellipse. As shown in Figure 11, if point P on the ellipse is above the vertex, ∆ O F P becomes a right triangle. At this point, if the distance F F ¯ from the focal point F to F’ and the minor axis length (2b) are known, it is evident that the major axis length (2a) of the ellipse is ‘ Major   = 2 · c 2 b 2 ’. In this case, F F ¯ is the length of each leg of the initial path created using the PRM algorithm, and the minor axis is the navigable width. The available water width can be varied within a range that does not exceed the length of each leg so that the boundary of the fixed obstacles around the initial path is included in the multiple-ellipse space. An elliptical area can then be generated by calculating the length of the major axis for searching in the ship’s forward direction and obtaining the angle for each leg (the ship’s course).
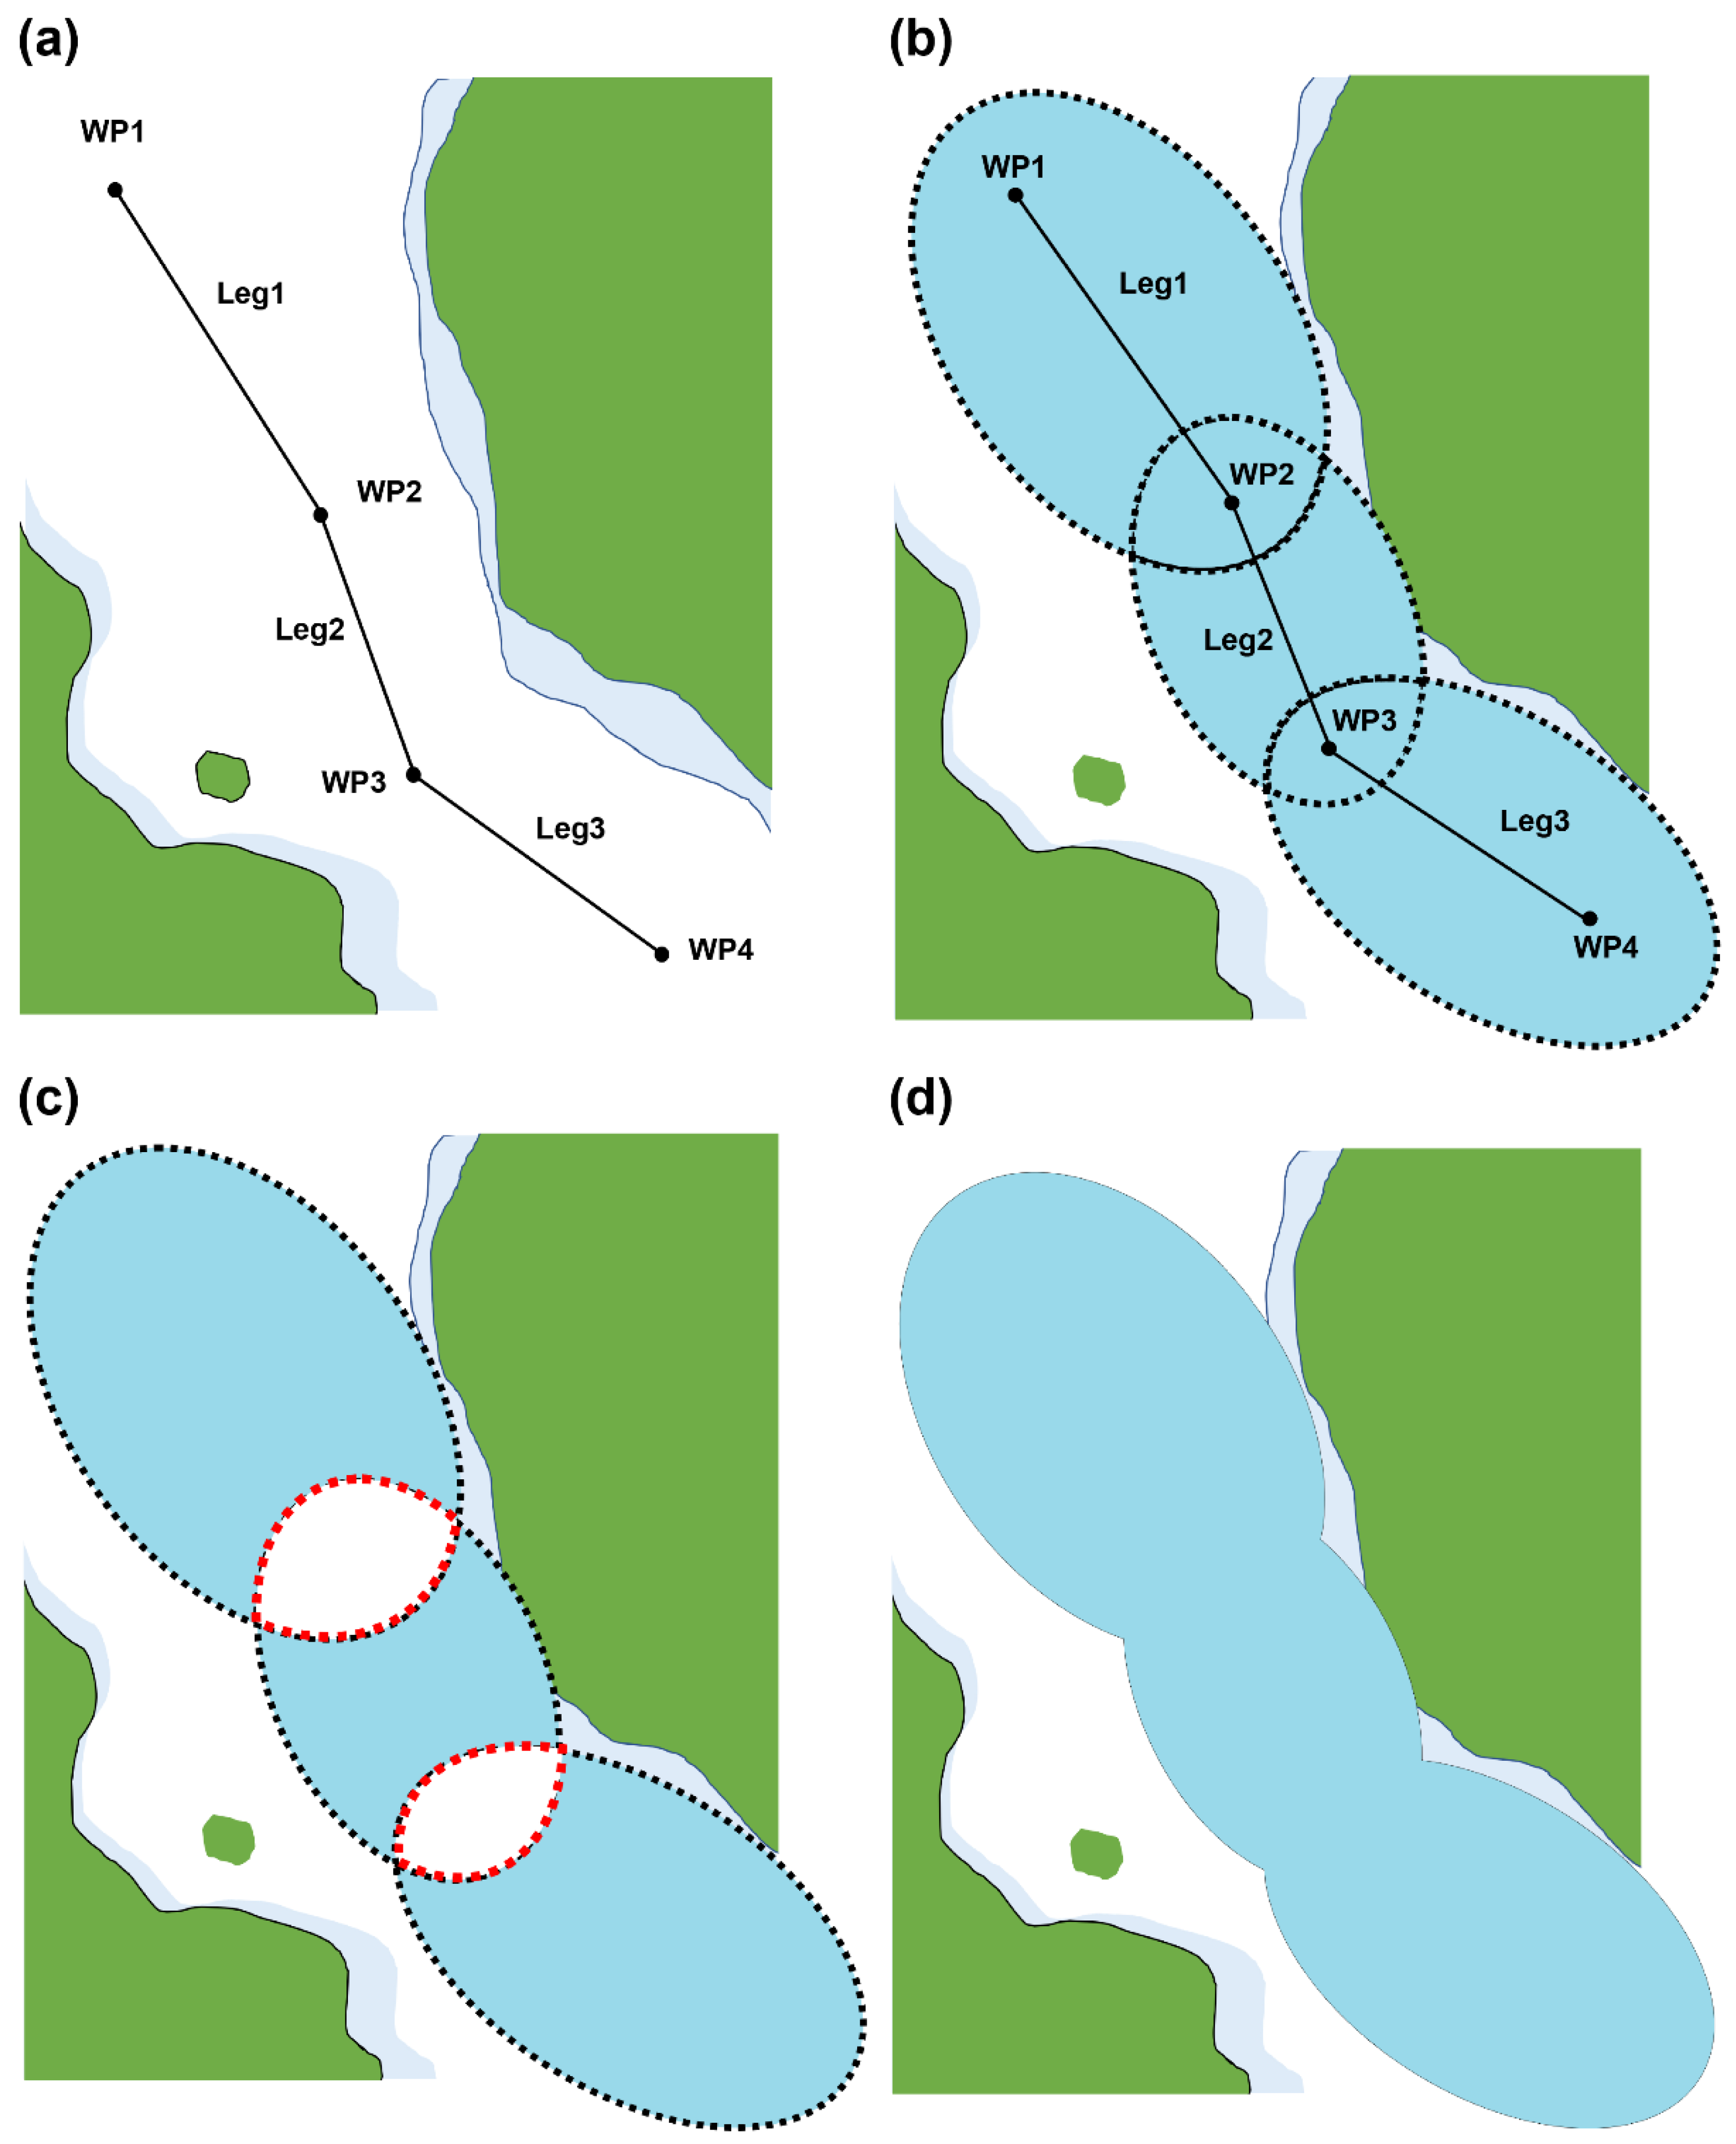
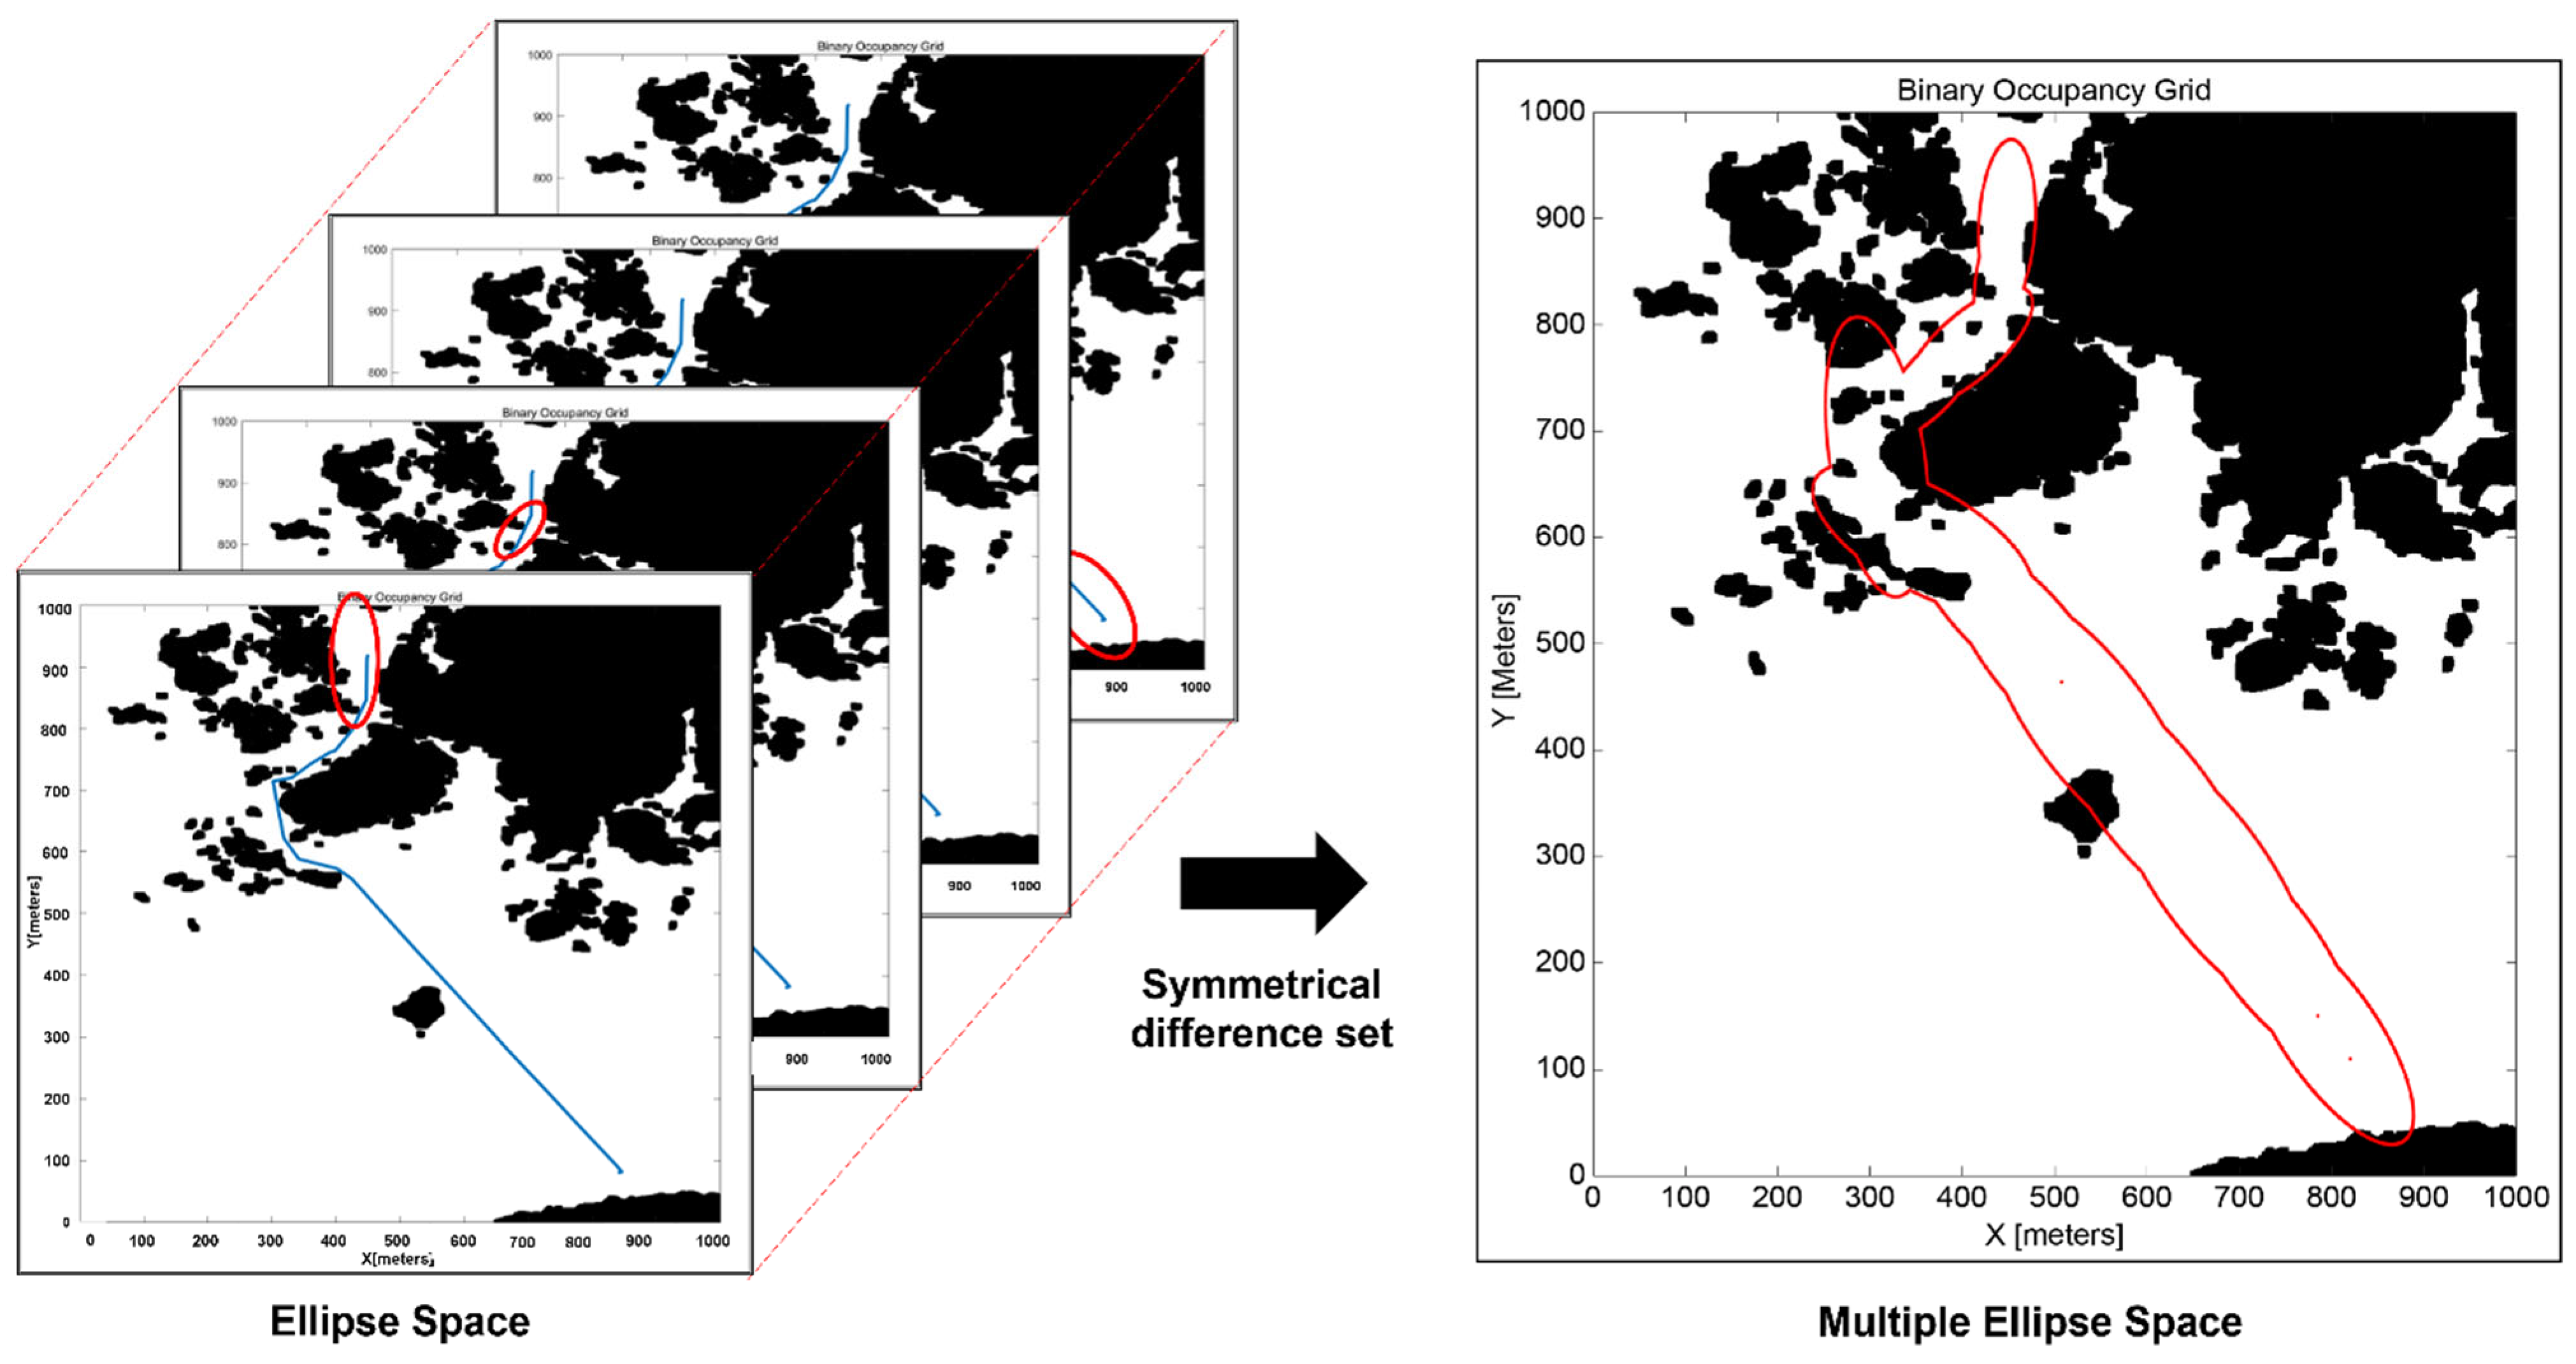
The generated ellipse has an overlapping area, as shown in Figure 12. The overlapping area between the ellipses can be removed to create a multi-ellipse space. A symmetrical difference set can then be used for the coordinate sets of the ellipses to determine the overlapping areas. As shown in Figure 12, a symmetrical difference set is a set of elements that can be included in one set but not in both sets. For two sets, A and B, A     B = ( A B )   ( B A ) is the symmetrical difference set. When the coordinates of the overlapping areas are removed using the symmetrical difference set between the ellipses, a multi-ellipse area is created, as shown in Figure 13. The final route can then be searched using the RRT* algorithm within the multi-ellipse space, as shown in Figure 14.

3.5. Route Optimization

The RRT*-based route-search algorithm can search for an efficient route in a high-dimensional environment; however, it cannot find the optimal route. This is because the RRT* algorithm produces a zigzag route. As a result of this study, the search time may be reduced compared to the original algorithm, but the zigzag route can incur additional movement costs compared to a straight route. Moreover, unlike mobile robots or automobiles, a ship’s route, with its limited maneuverability, should be as straight as possible. Consequently, in this study, the process of finding the shortest distance using only the minimum number of nodes was performed after removing inefficient nodes by applying a network optimization algorithm to the route generated as a result of the RRT*-based route-search algorithm using multi-ellipse spaces. After creating graphs connecting all the nodes of the route searched using the RRT* algorithm, the optimal route was determined using the minimal graphs remaining after searching the graphs of obstacles and collision-free spaces.

3.5.1. Boundary Detection

The obstacle boundary data can be extracted from the constructed map to straighten an obstacle-free route. The same boundary coordinate information as the nodes used in the RRT*-based algorithm discussed in Section 3.4 cannot be obtained from the binary image map that reflects the multi-ellipse space. Consequently, in this study, the obstacle boundary information was extracted from a binary image map using the area boundary tracking technique [41]. Additionally, an area boundary tracking algorithm was used to segment areas by tracing the boundary of the binary image. Moore’s neighbor tracking (MNT) algorithm [42] was used to track the connectivity of neighboring pixels in eight directions around a specific pixel, as shown in Figure 15.

3.5.2. Collision-Free Space Graph

A graph is a data structure that collects the nodes and edges that interconnect them into one group. They can be used for subway route maps, electric circuits, and road intersections. Graphs can be classified into directed and undirected graphs, depending on the directionality of the edges. In this study, an undirected graph without weights was used.
First, an array—comprising a source node and a target node—is created using the binomial coefficient expression ( n k ) = n k = ( n , k ) = k ! ( n k ) ! k ! , which represents the number of combinations that select k nodes at a time among the n nodes of the route searched using the RRT* algorithm. The graph G = {Node, Edge} can be constructed using the edges connecting the array of two node pairs comprising the source node (s) and the target node (t). To construct a collision-free space graph, we checked whether the edges of the graph connecting all nodes collided with the obstacle area. The intersection points between all obstacles and edges on the map can then be calculated, and whether the edge is inside or outside the obstacle can be inspected. As expressed in Equation (5), when an intersection point with an obstacle is generated, the edge is excluded from the graph. As a result, a collision-free space graph array with a weight of one can be configured with edges that have no intersection point with an obstacle, as follows:
( s , t ) G X s , t = {   1 ,   if ,   Edge   is   not   intersected   on   obstructions 0 , if   Edge   is   intersected   on   obstrucions
The shortest path problem using graphs is to find the smallest number of edges connecting two nodes in an unweighted graph; the sum of the weights of the edges connecting two nodes in a weighted graph is the minimum. In this study, the optimal route was searched using the Dijkstra algorithm, which is a breadth-first shortest path algorithm, to obtain an unweighted collision-free space graph where the weight of every edge was 1.

4. Results and Discussions

The selected simulation sea area used in this study was the coastal waters of the Southwest Sea of Korea, where there are many fixed obstacles, including land and islands. The simulation was performed by designating the average number of ships passing through the target sea area as a model ship. Furthermore, the start and end points of the simulation were selected as the pilot disembarkation points, where the ship operator directly piloted the ship. The details of the simulation target area and the model ship are listed in Table 3.
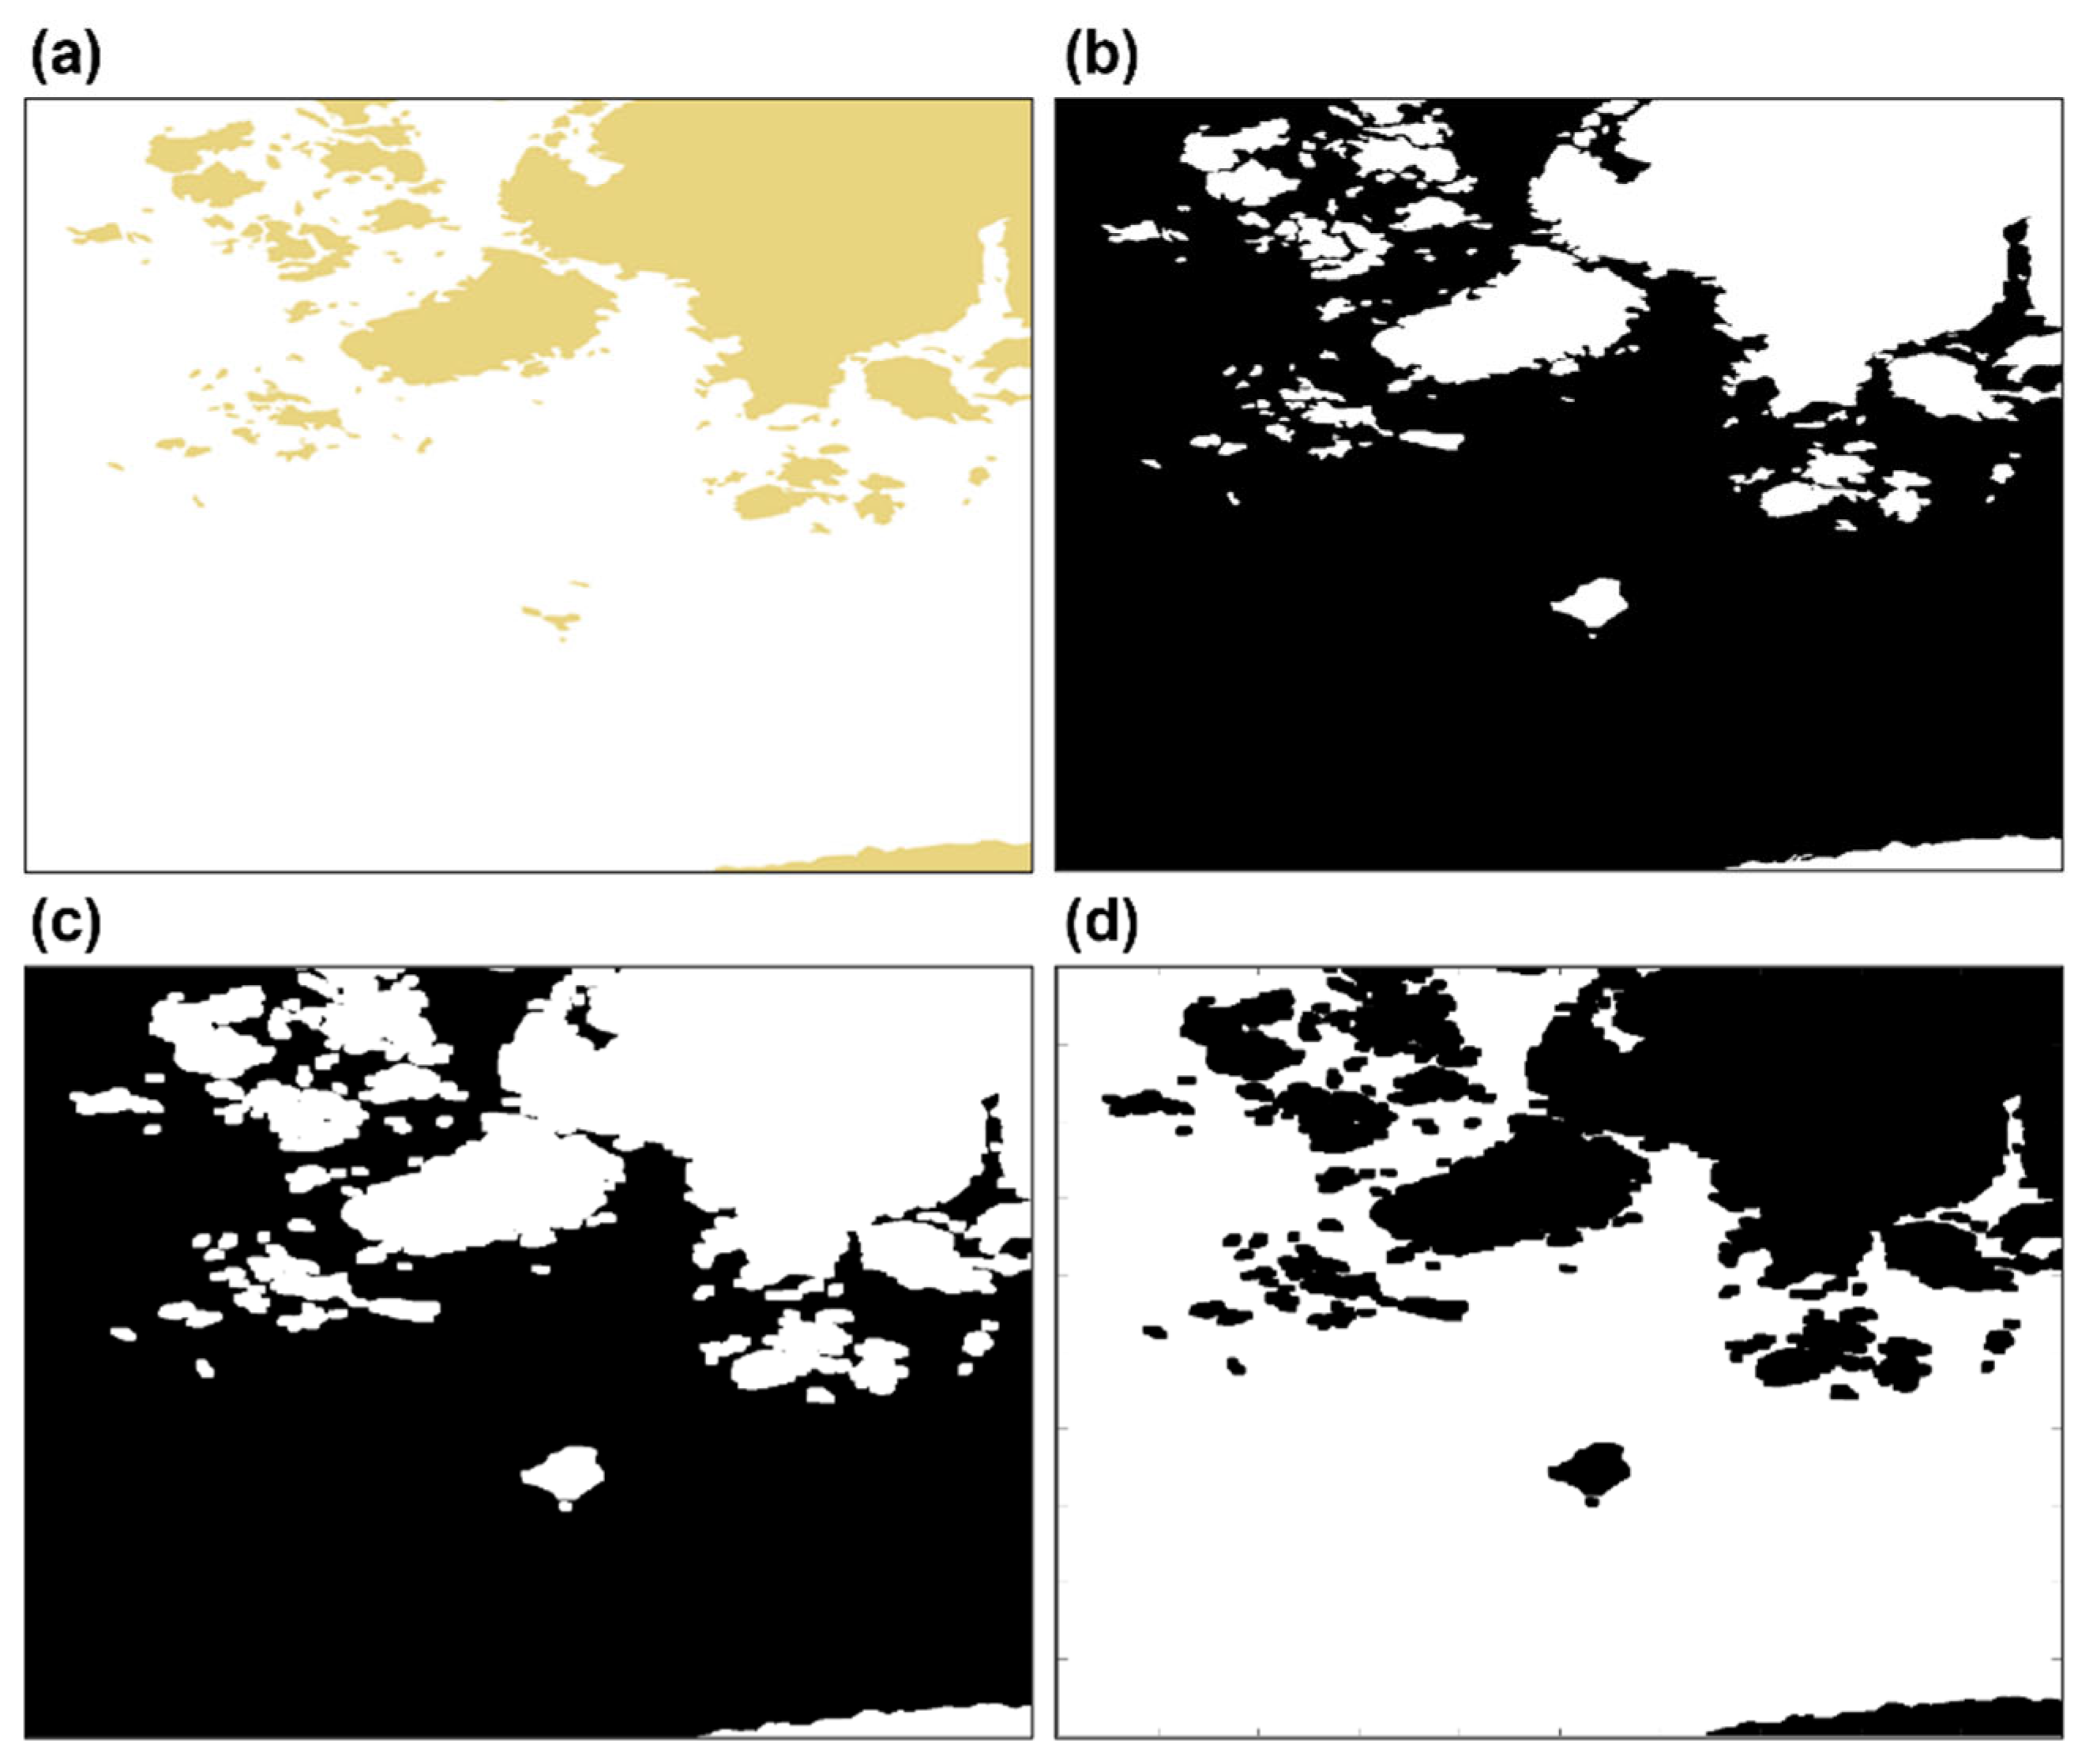
Figure 16 shows the mapping process for generating the initial route for the target sea area. First, the UKC is reflected in the image of the electronic navigational chart in Figure 16a based on the maximum draft of the model ship, as shown in Figure 16b. The buffer zone, considering the safety margin, can then be calculated (600 m) using the length of the model ship, as shown in Figure 16c. Finally, a binary occupancy map for the initial route generation can be created, as shown in Figure 16d.
The PRM algorithm was then used to generate the initial route, with the route search converging on the optimal route as the number of nodes increased. However, this process can increase the computational overhead and cause problems related to computational speed and system overload. Nonetheless, an effective route search is possible by adjusting the parameters of the PRM algorithm. Complex maps with many obstacles have a higher probability of finding an optimal route as the connection distance between nodes is shorter and the number of nodes is higher.
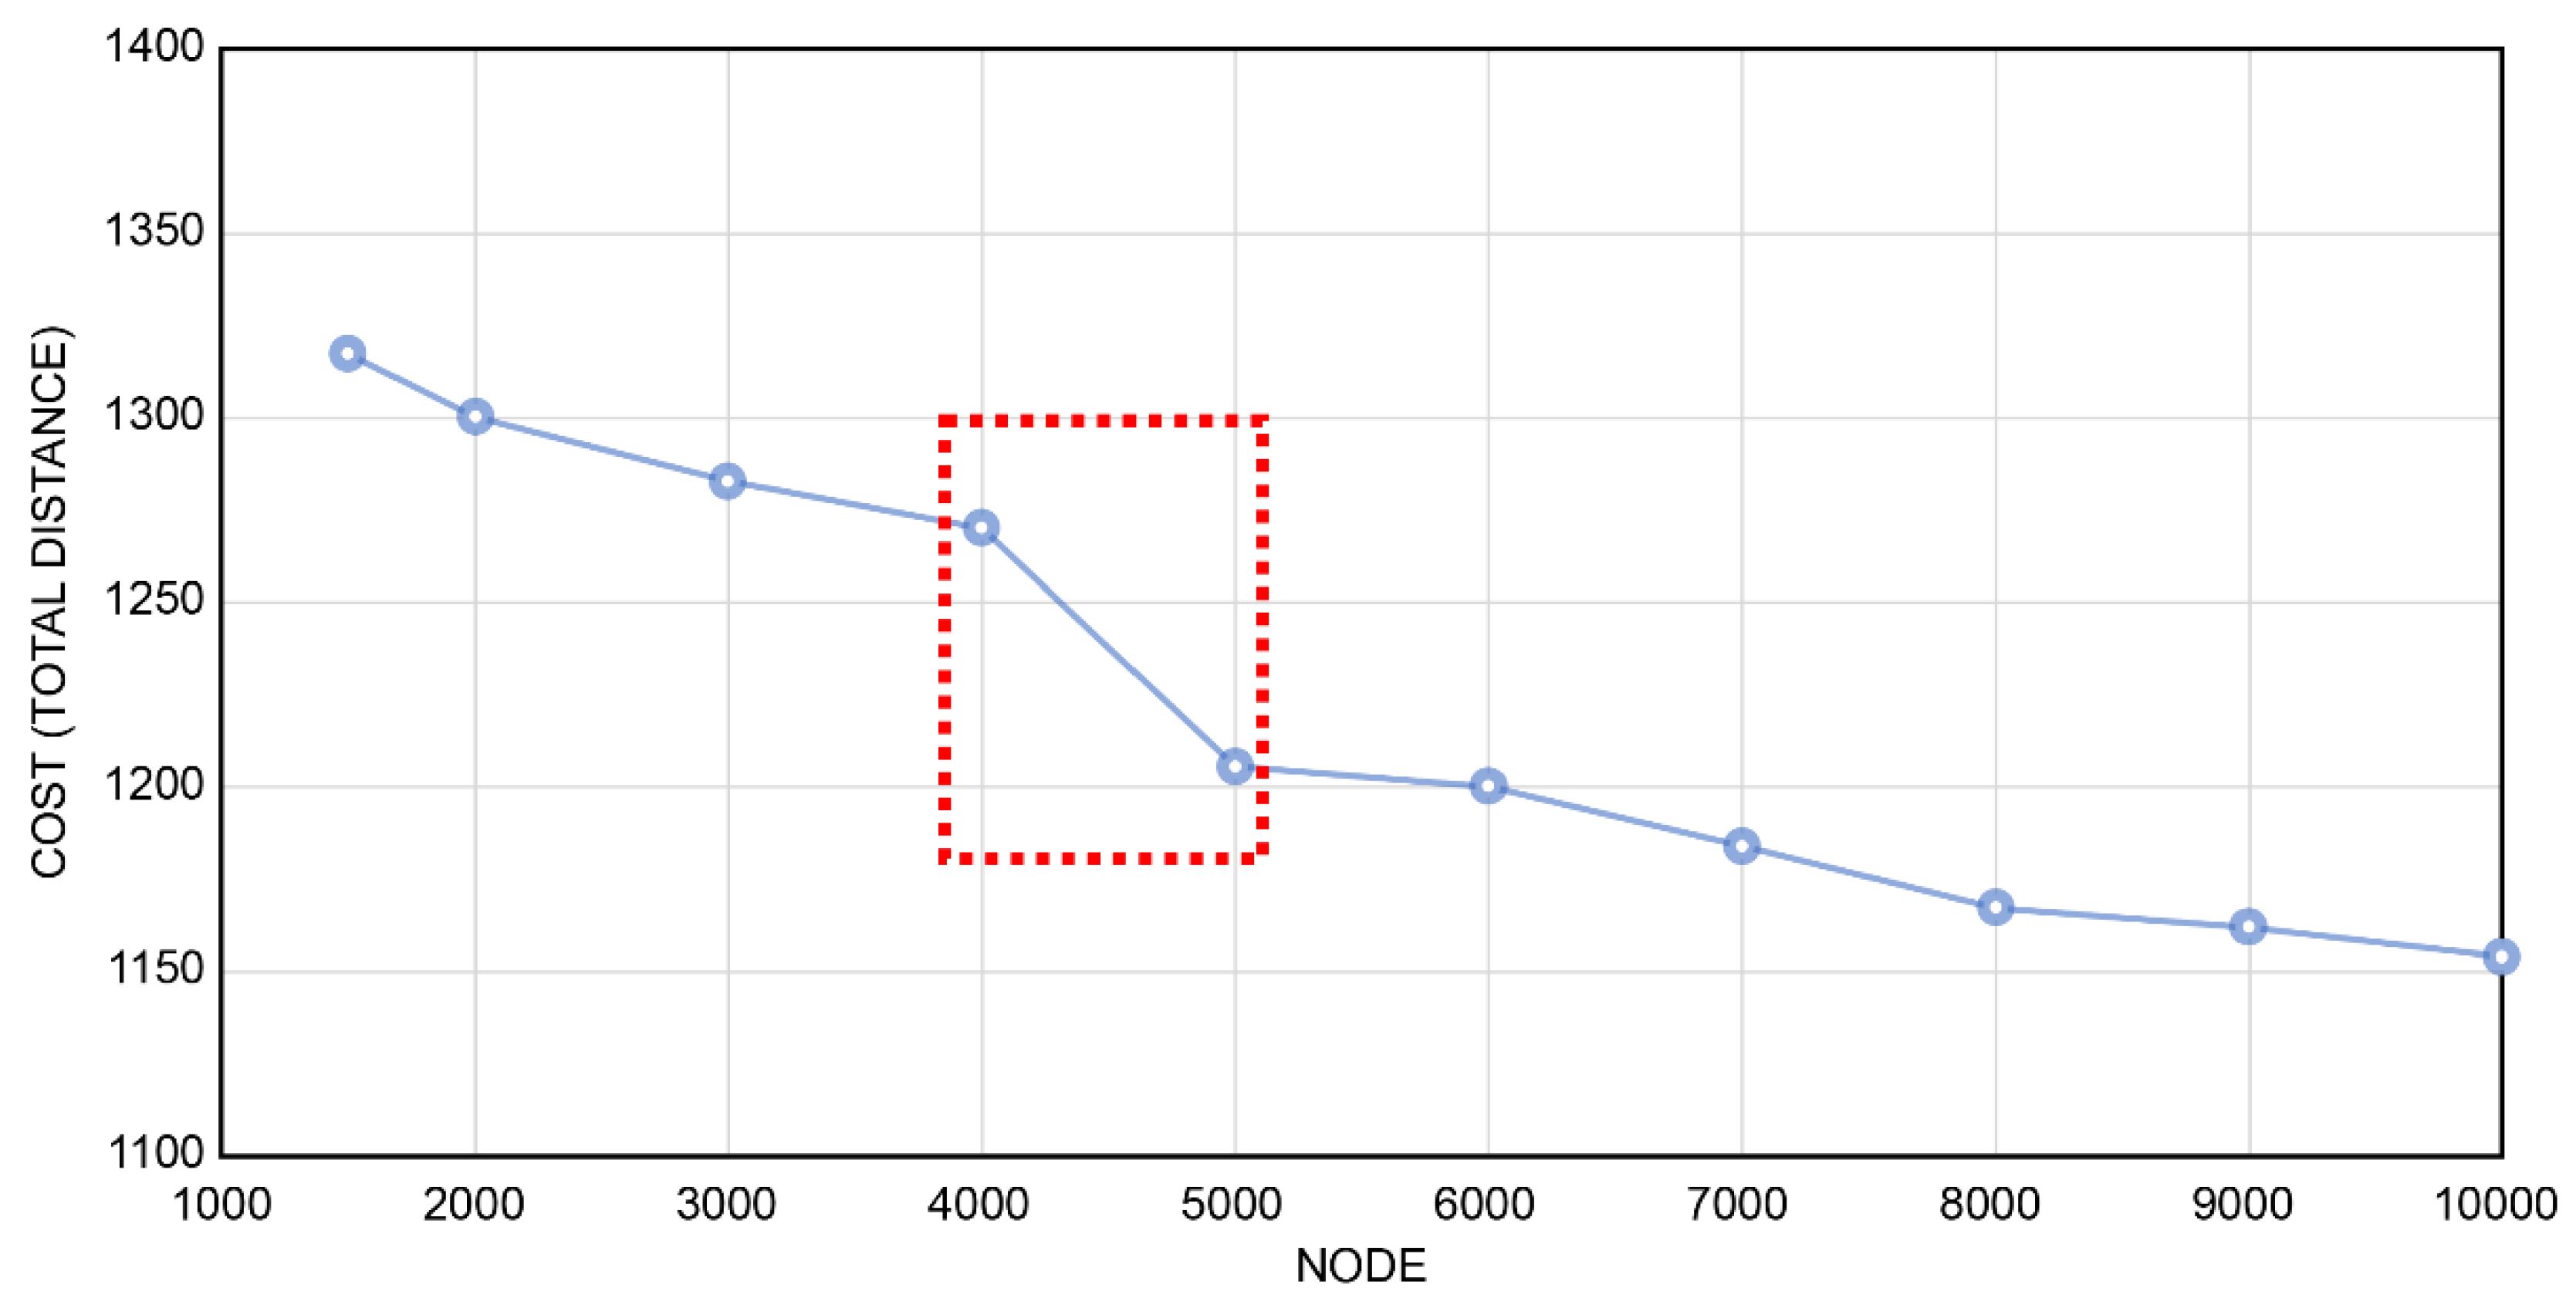
In this study, the travel distance was analyzed based on the number of nodes to determine the optimal node for generating the initial route. Consequently, the travel distance did not change substantially after 5000 nodes, as shown in Figure 17. Therefore, in this study, the PRM algorithm was applied by using 5000 nodes for the initial route generation, the results of which are shown in Figure 18.
A multi-ellipse space was created based on the initial route generated using the PRM algorithm, as shown in Figure 19.
A simulation to evaluate the performance of the RRT*-based route-search algorithm using the multi-ellipse space proposed in this study was performed, as summarized in Table 4. The map space for this simulation was a 100 × 100 km binary occupancy map. A maximum connection distance of 500 m—which is the safe distance for the model ship—and 1000 m—which is twice the safe distance—were used in the simulation. Route-planning simulations were conducted 10 times by changing the maximum number of iterations for cases with a maximum number of tree nodes of 10,000 and 20,000, respectively.
The simulation results are presented in Table 5 and Figure 20. Owing to the size of the map space during the 10 simulations, route generation failed when the number of iterations of both algorithms was less than 10,000. Additionally, in the simulations of Case 2 and Case 4, optimal results were obtained when the number of iterations for both algorithms was 20,000. In Case 1 and Case 3, optimal results were obtained when the number of RRT* iterations was 80,000 and 320,000. However, it was evident that the optimal results were determined when the number of iterations was 200,000 for all of the proposed algorithms. Details of the optimal results for each case are shown in Figure 21, Figure 22, Figure 23 and Figure 24.
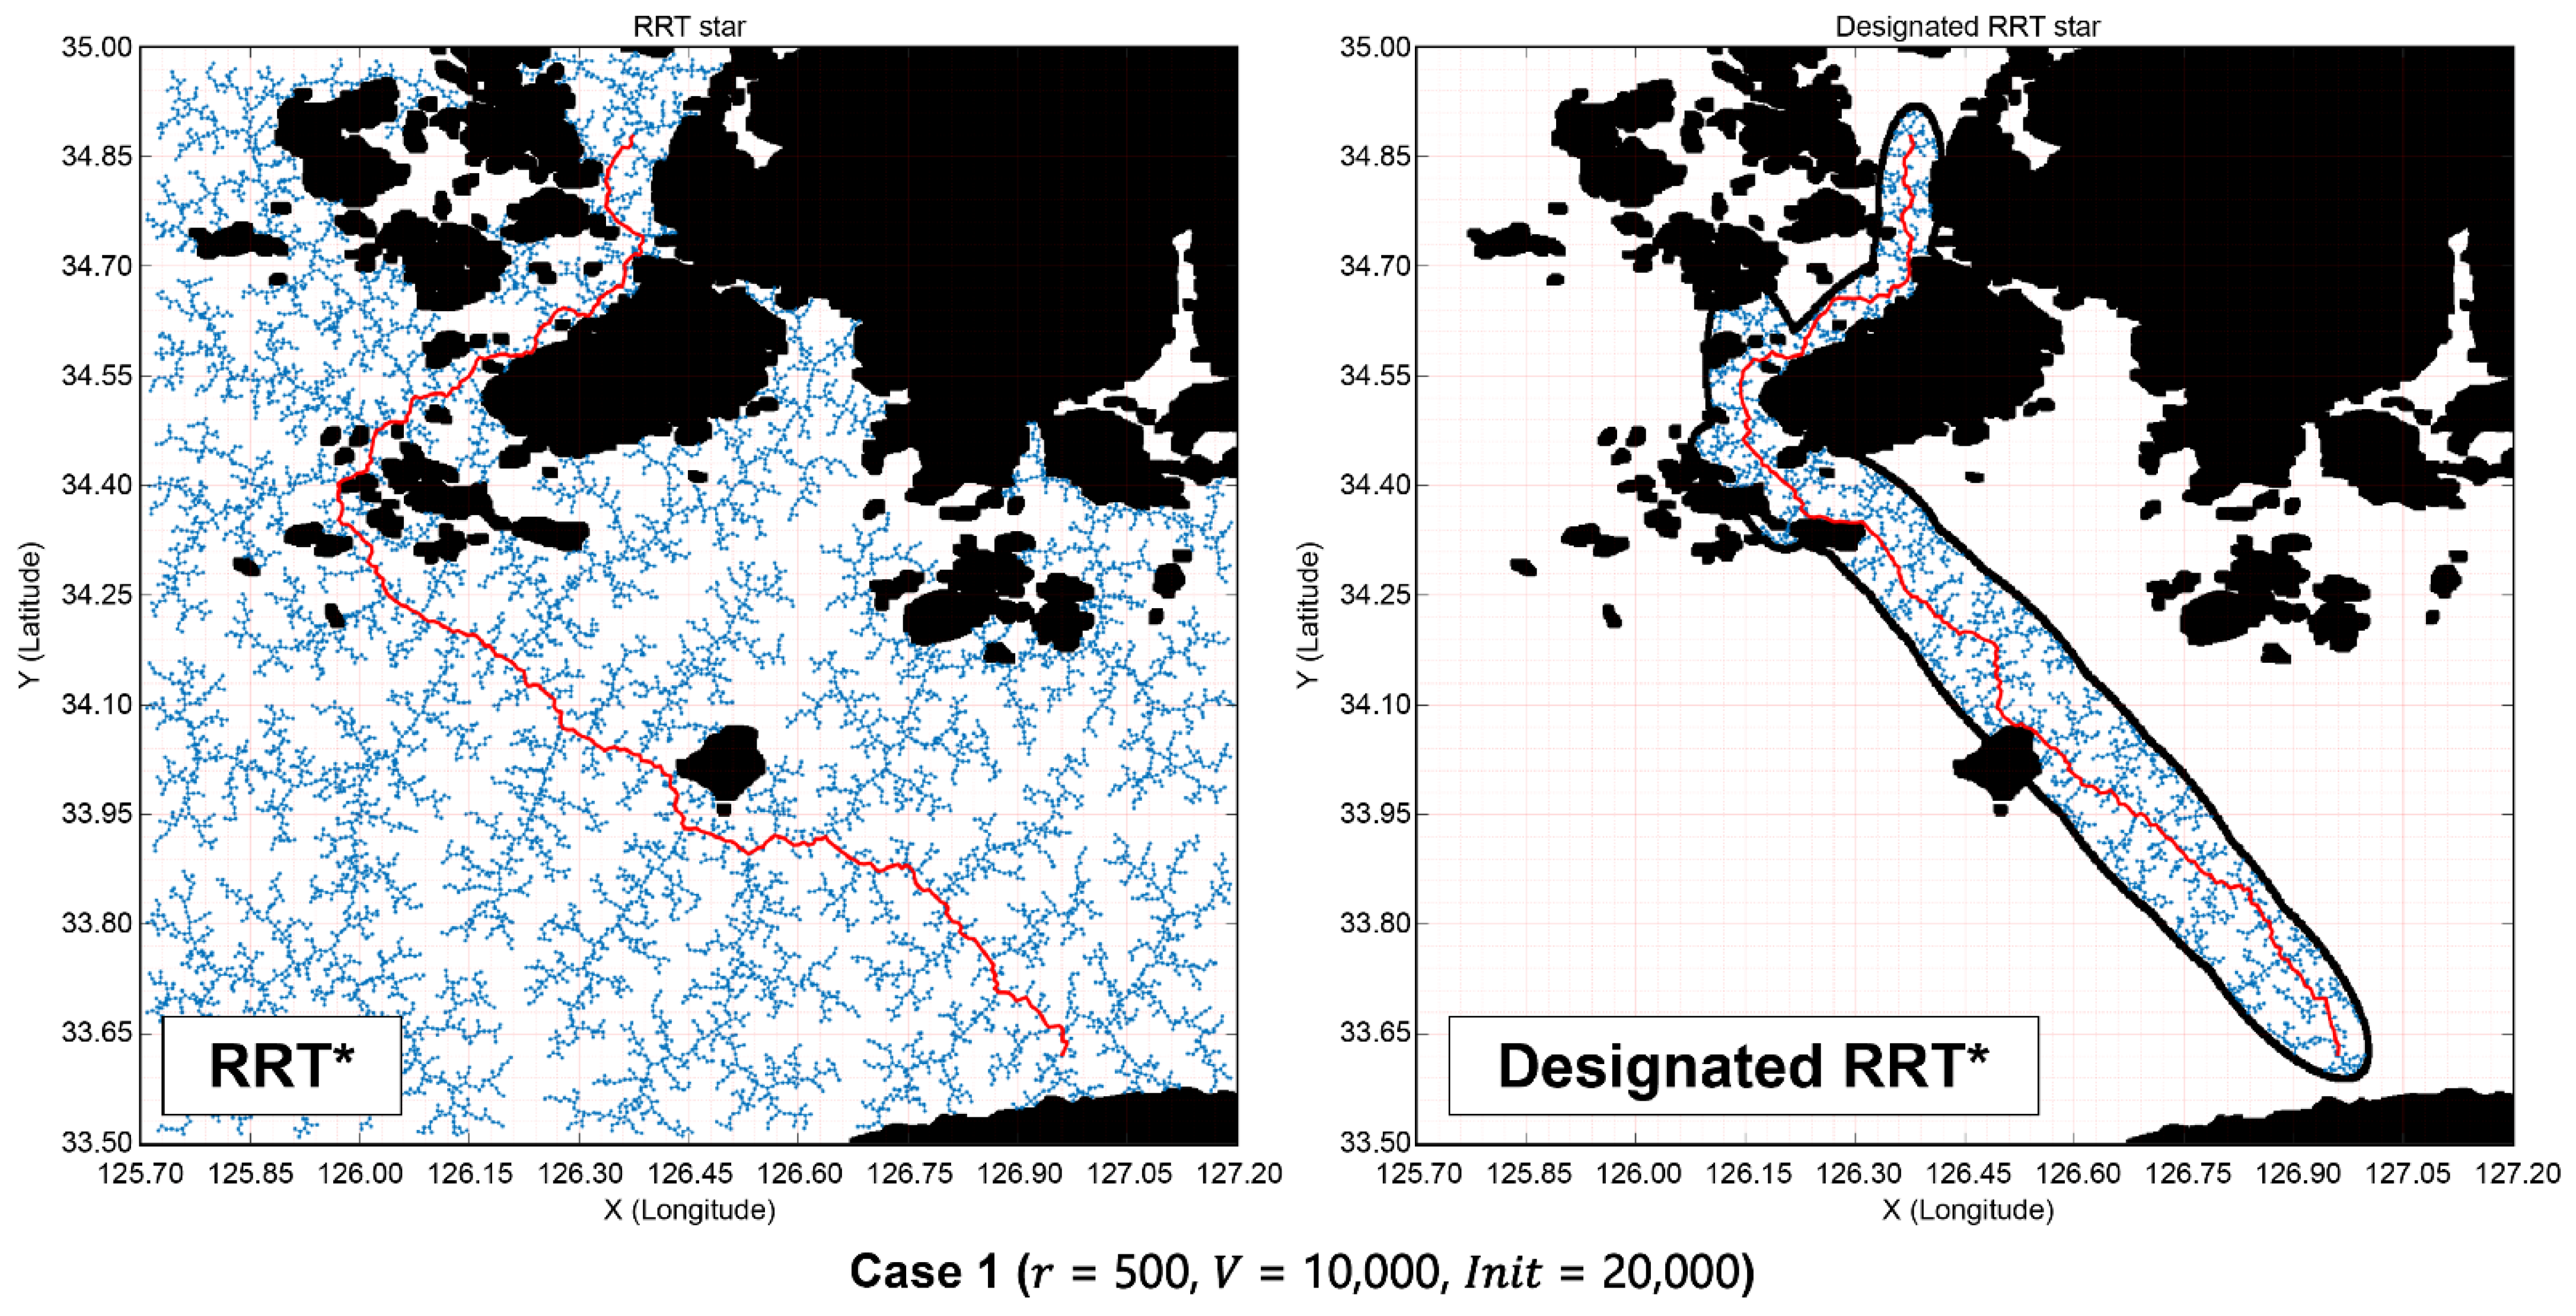
Figure 21 shows the simulation results for Case 1, where the maximum number of tree nodes is 10,000, and the maximum connection distance is 500 m. When the maximum number of iterations is 20,000, the designated RRT* algorithm yields the best results. Compared with the RRT*-based results, the calculation time is shortened by approximately 4.7 times, and the travel distance is reduced by approximately 33.7 km (approximately 1.3 times).
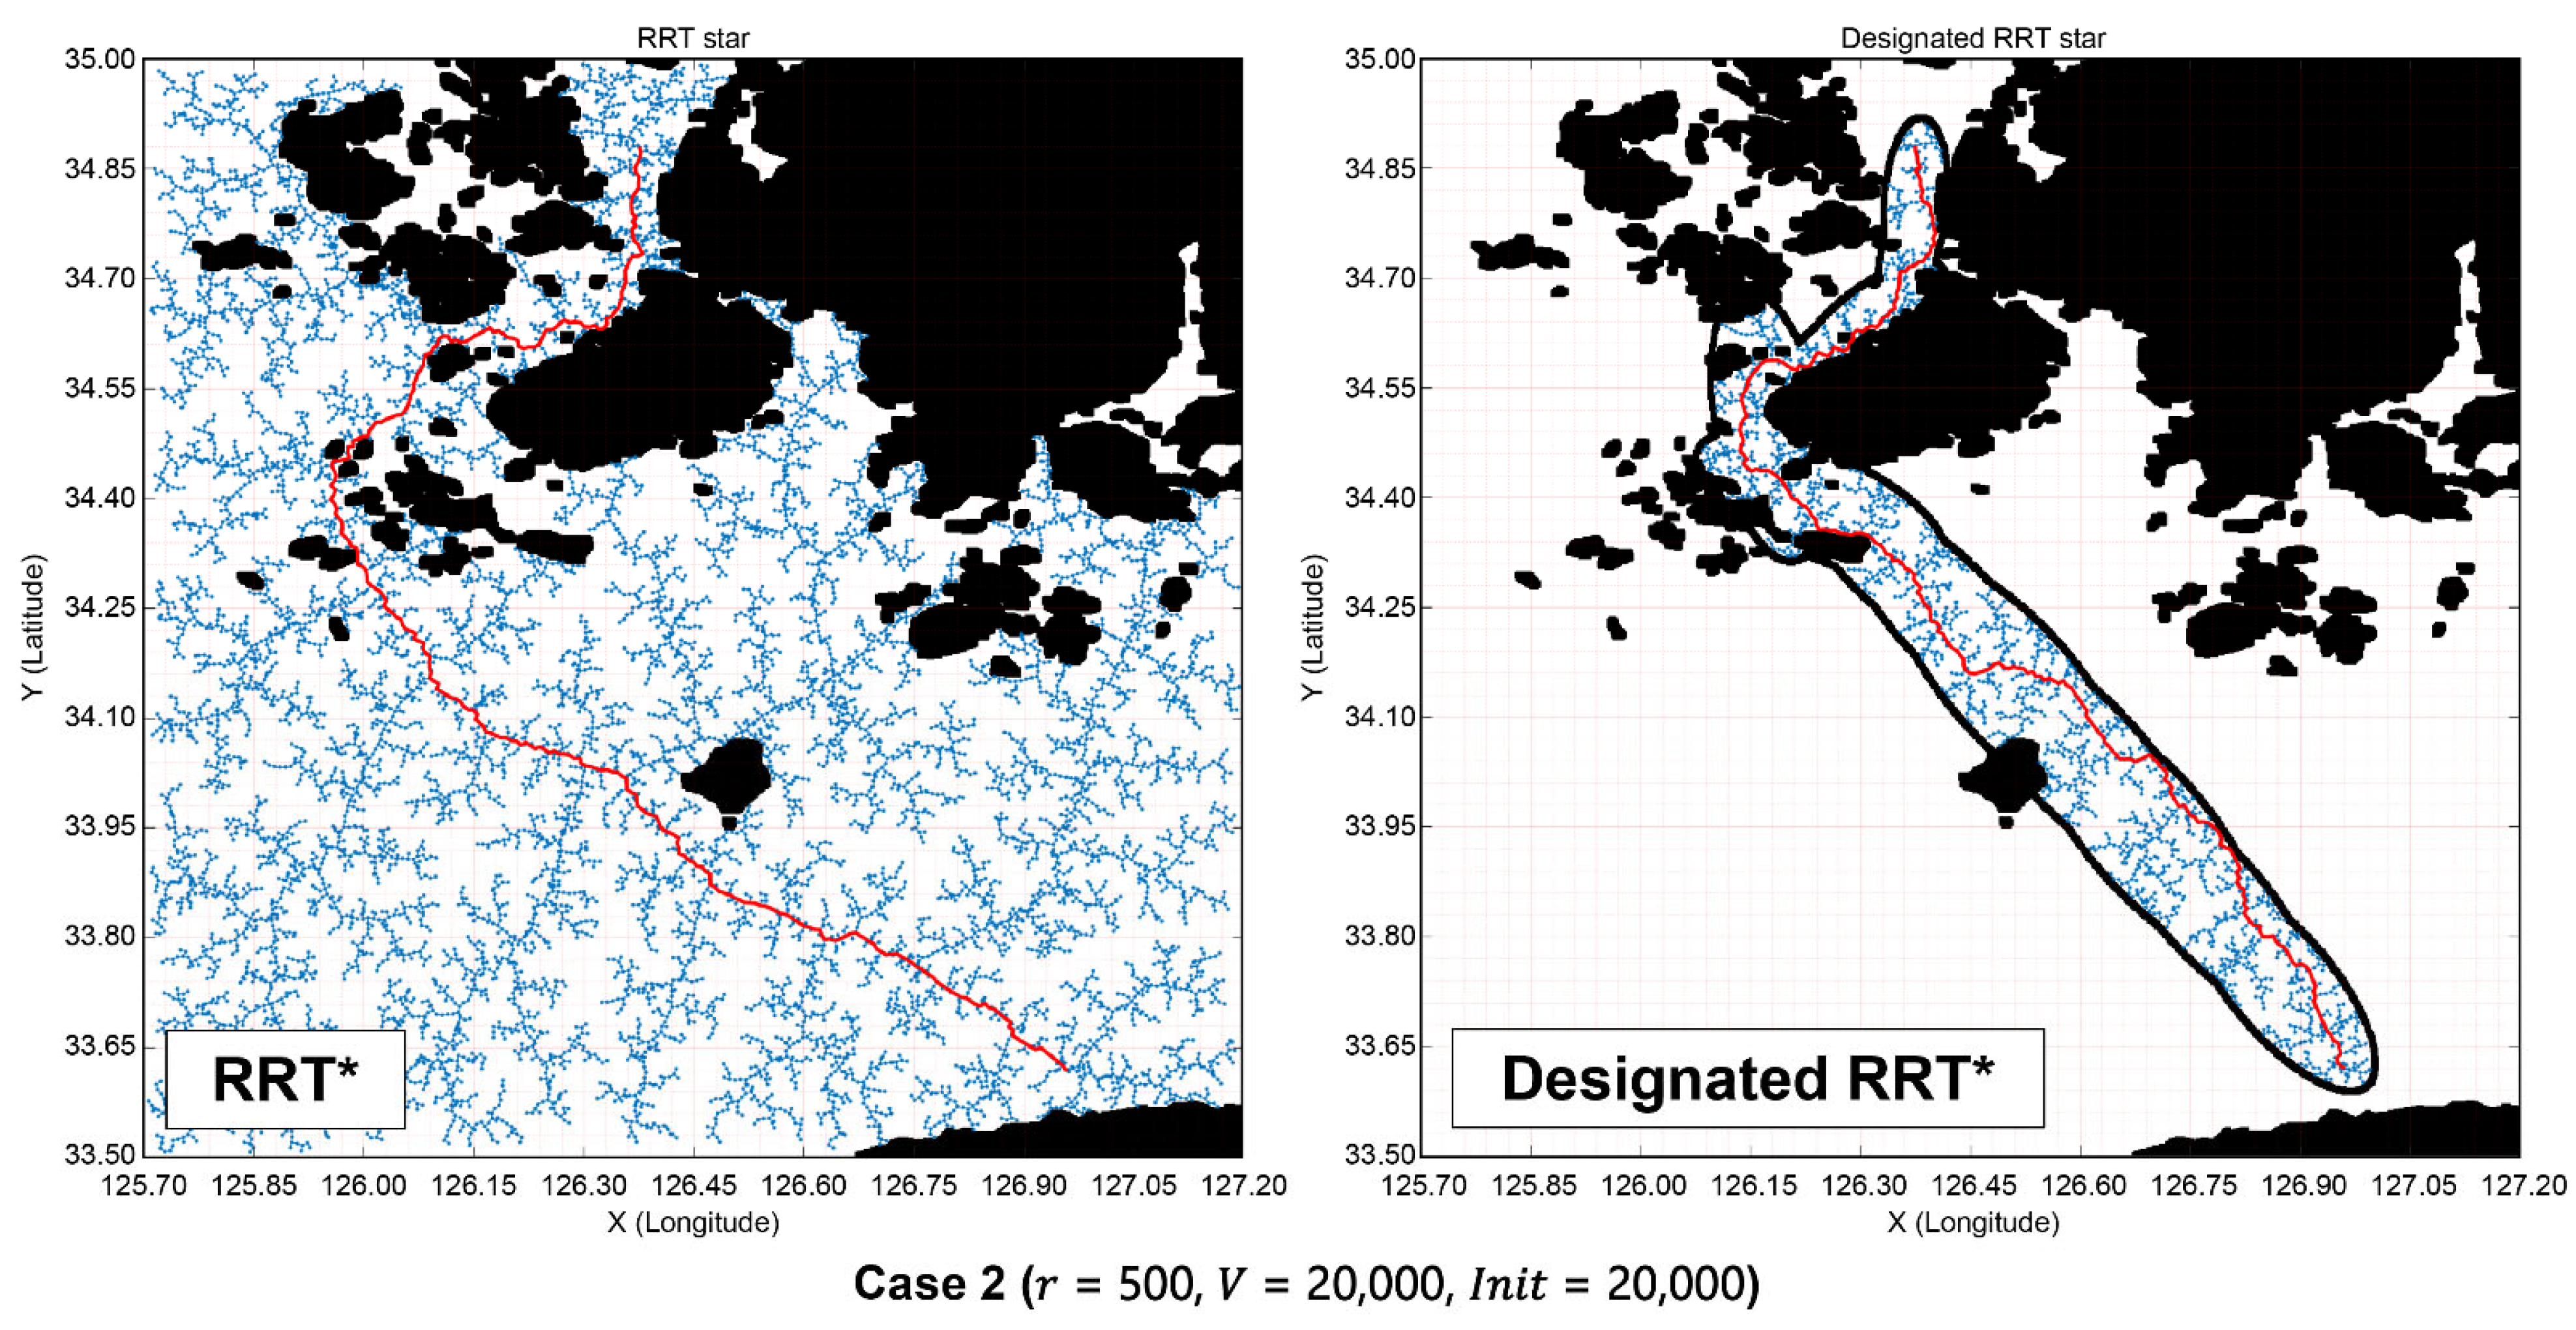
Figure 22 shows the simulation results for Case 2, where the maximum number of tree nodes is 20,000 and the maximum connection distance is 500 m. When the maximum number of iterations is 20,000, the designated RRT* algorithm yields the best results. Compared with the RRT*-based results, the calculation time is shortened by approximately 5.0 times and the travel distance by approximately 25.5 km (approximately 1.2 times).
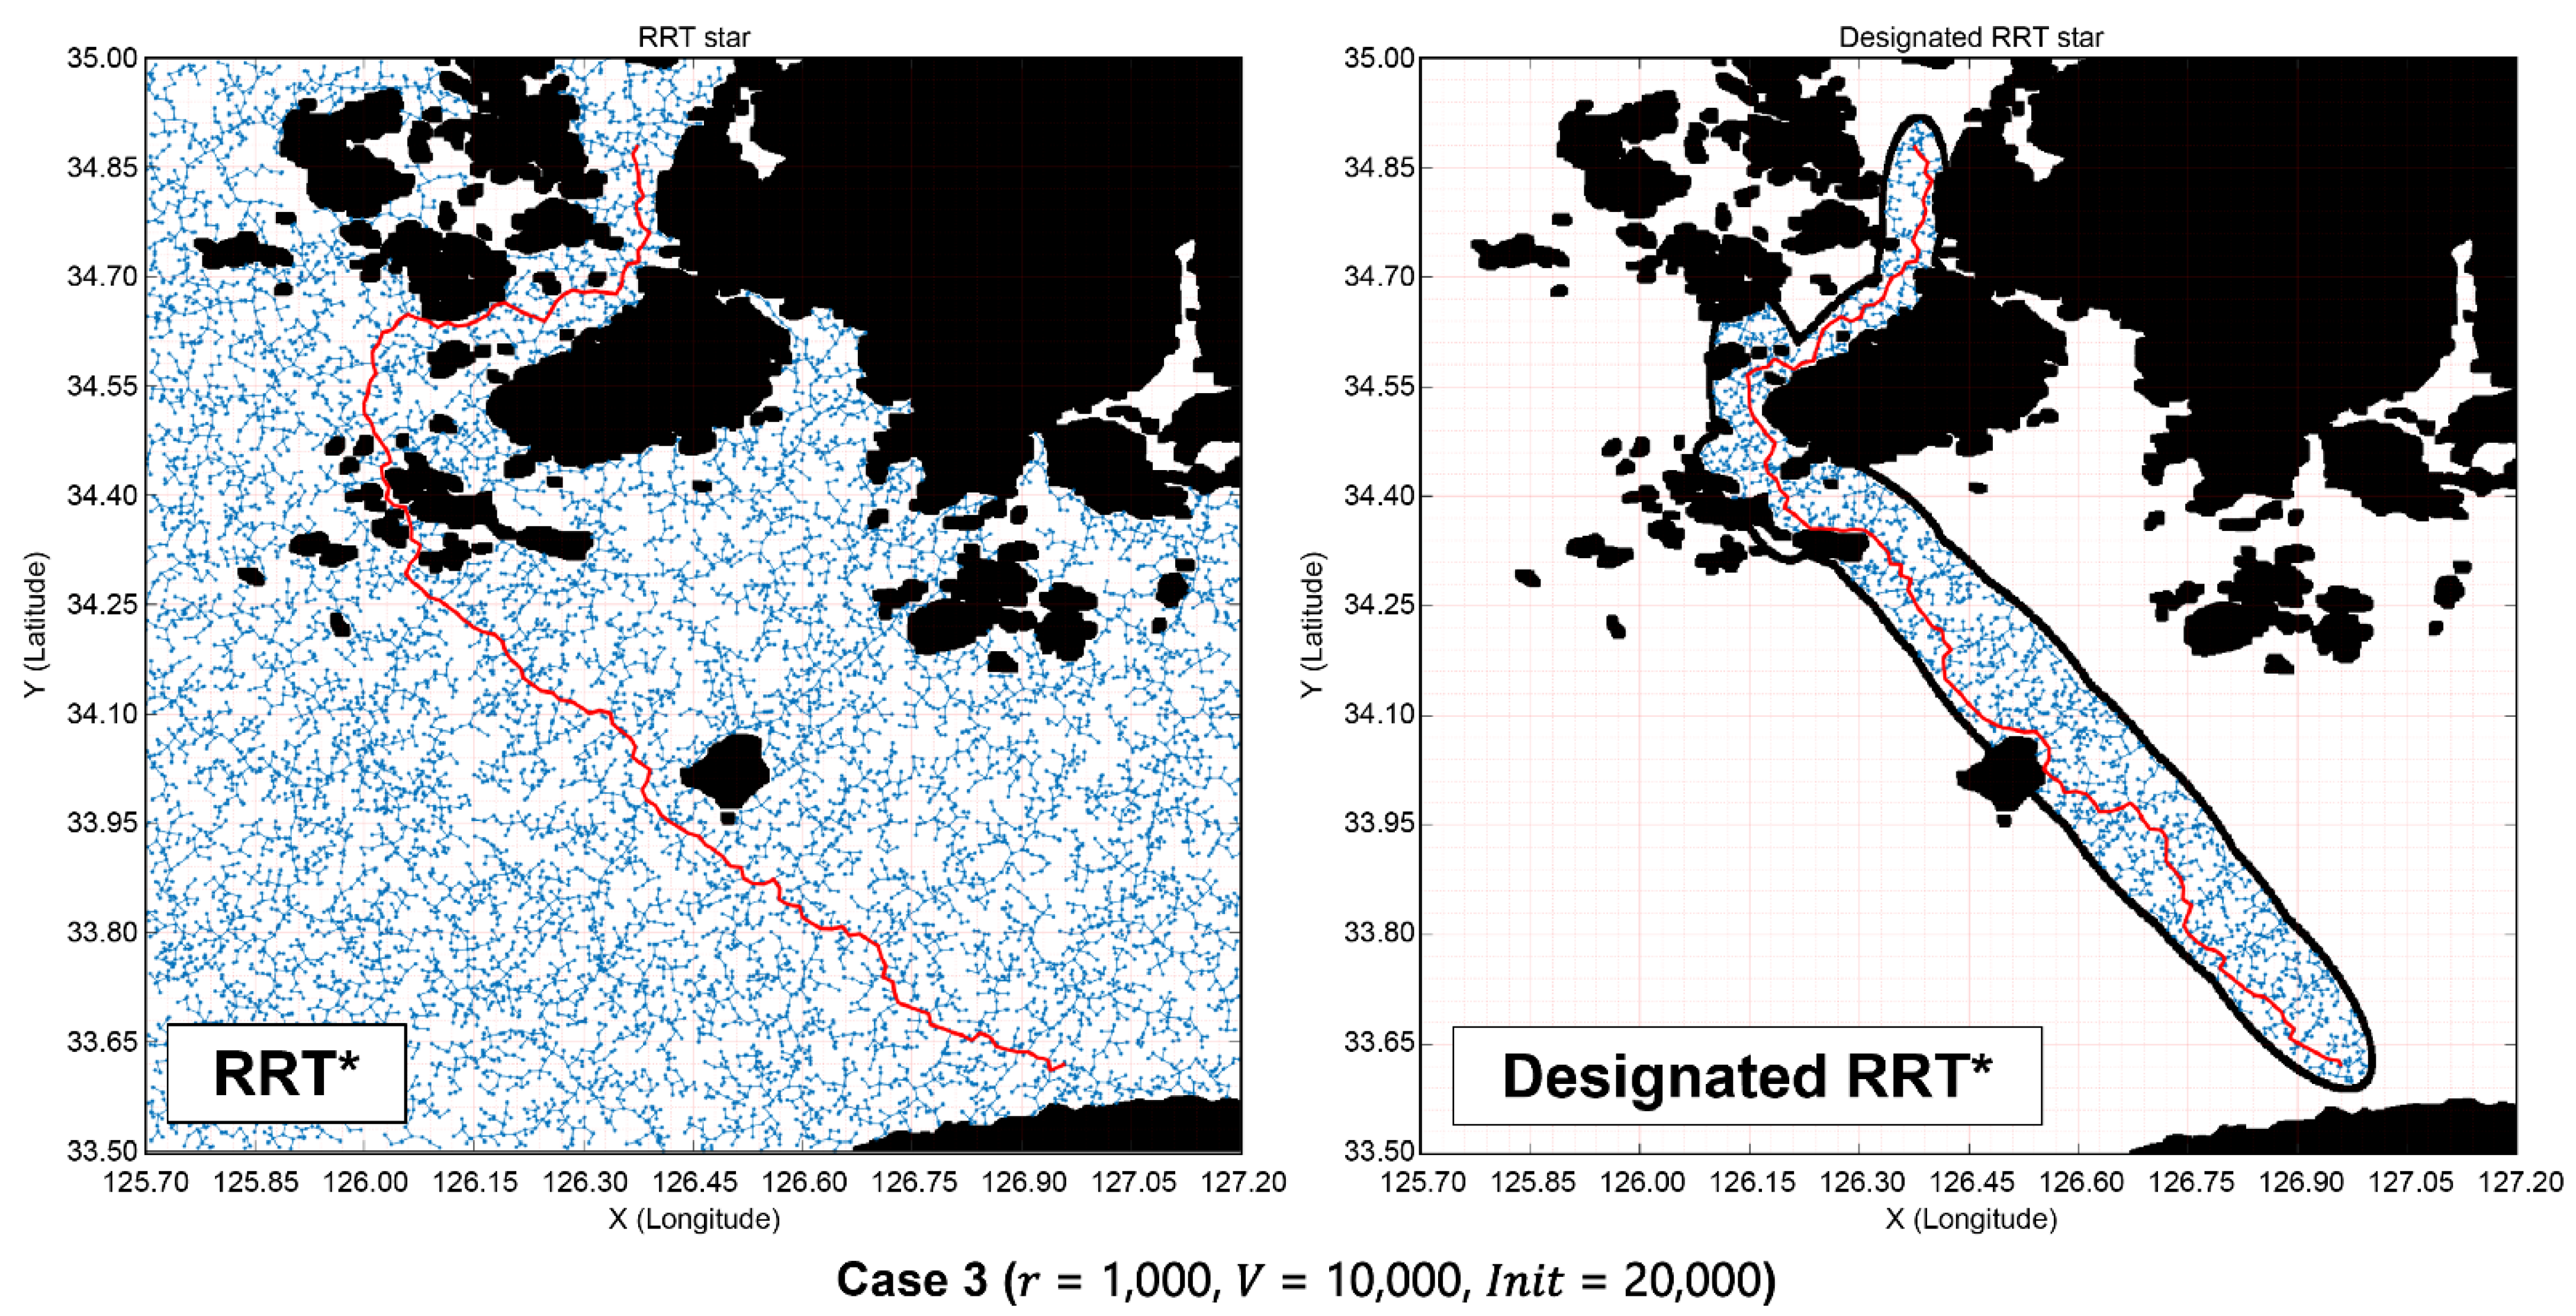
Figure 23 shows the simulation results for Case 3, where the maximum number of tree nodes is 10,000 and the maximum connection distance is 1000 m. When the maximum number of iterations is 2000, the designated RRT* algorithm yields the best results. Compared with the RRT*-based results, the calculation time is shortened by approximately 4.2 times and the travel distance by approximately 17.7 km (approximately 1.1 times).
Figure 24 shows the simulation results for Case 4, where the maximum number of tree nodes is 20,000 and the maximum connection distance is 1000 m. When the maximum number of iterations is 2000, the designated RRT* algorithm yields the best results. Compared with the RRT*-based results, the calculation time is shortened by approximately 4.2 times and the travel distance by approximately 16.4 km (approximately 1.1 times).
As a result of the simulations, the optimal result was derived from the designated RRT* algorithm when the maximum number of iterations was 20,000, which could shorten the travel distance faster than using the conventional RRT* method. Moreover, because the designated RRT* algorithm searches the route only within the specified sampling area, the travel distance result did not change much above the maximum number of iterations where the optimal result was derived, although the calculation speed improved.
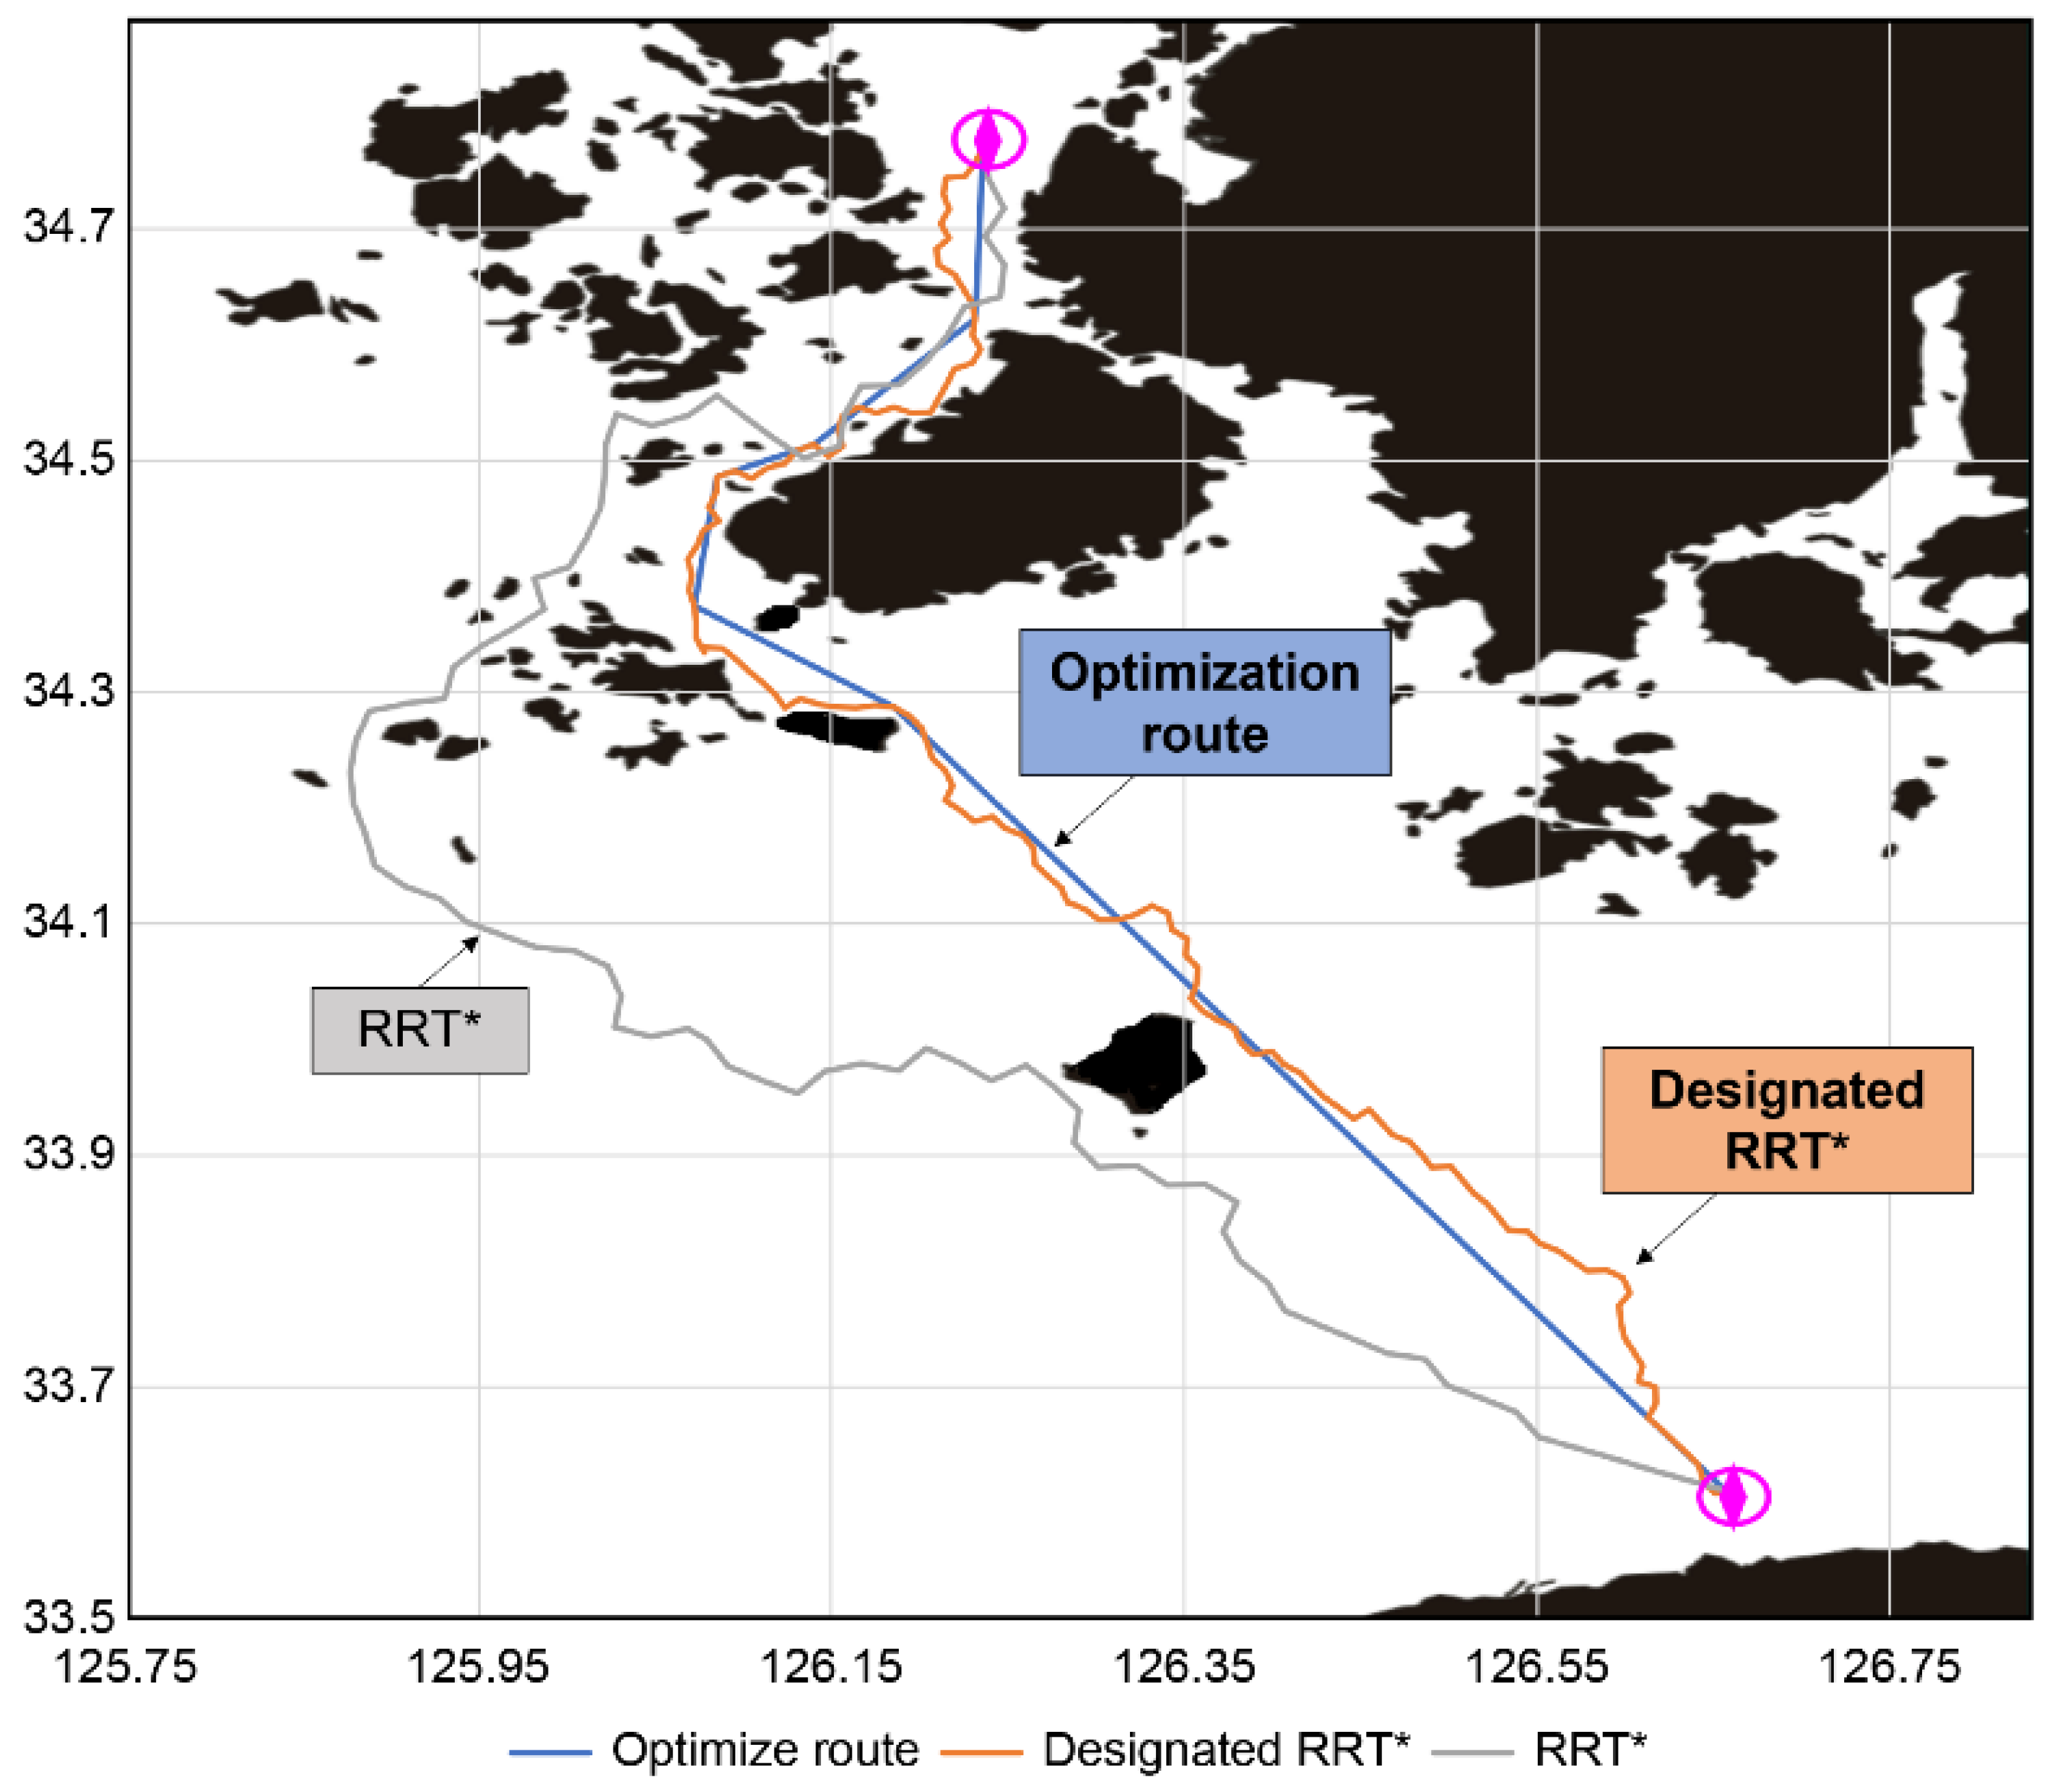
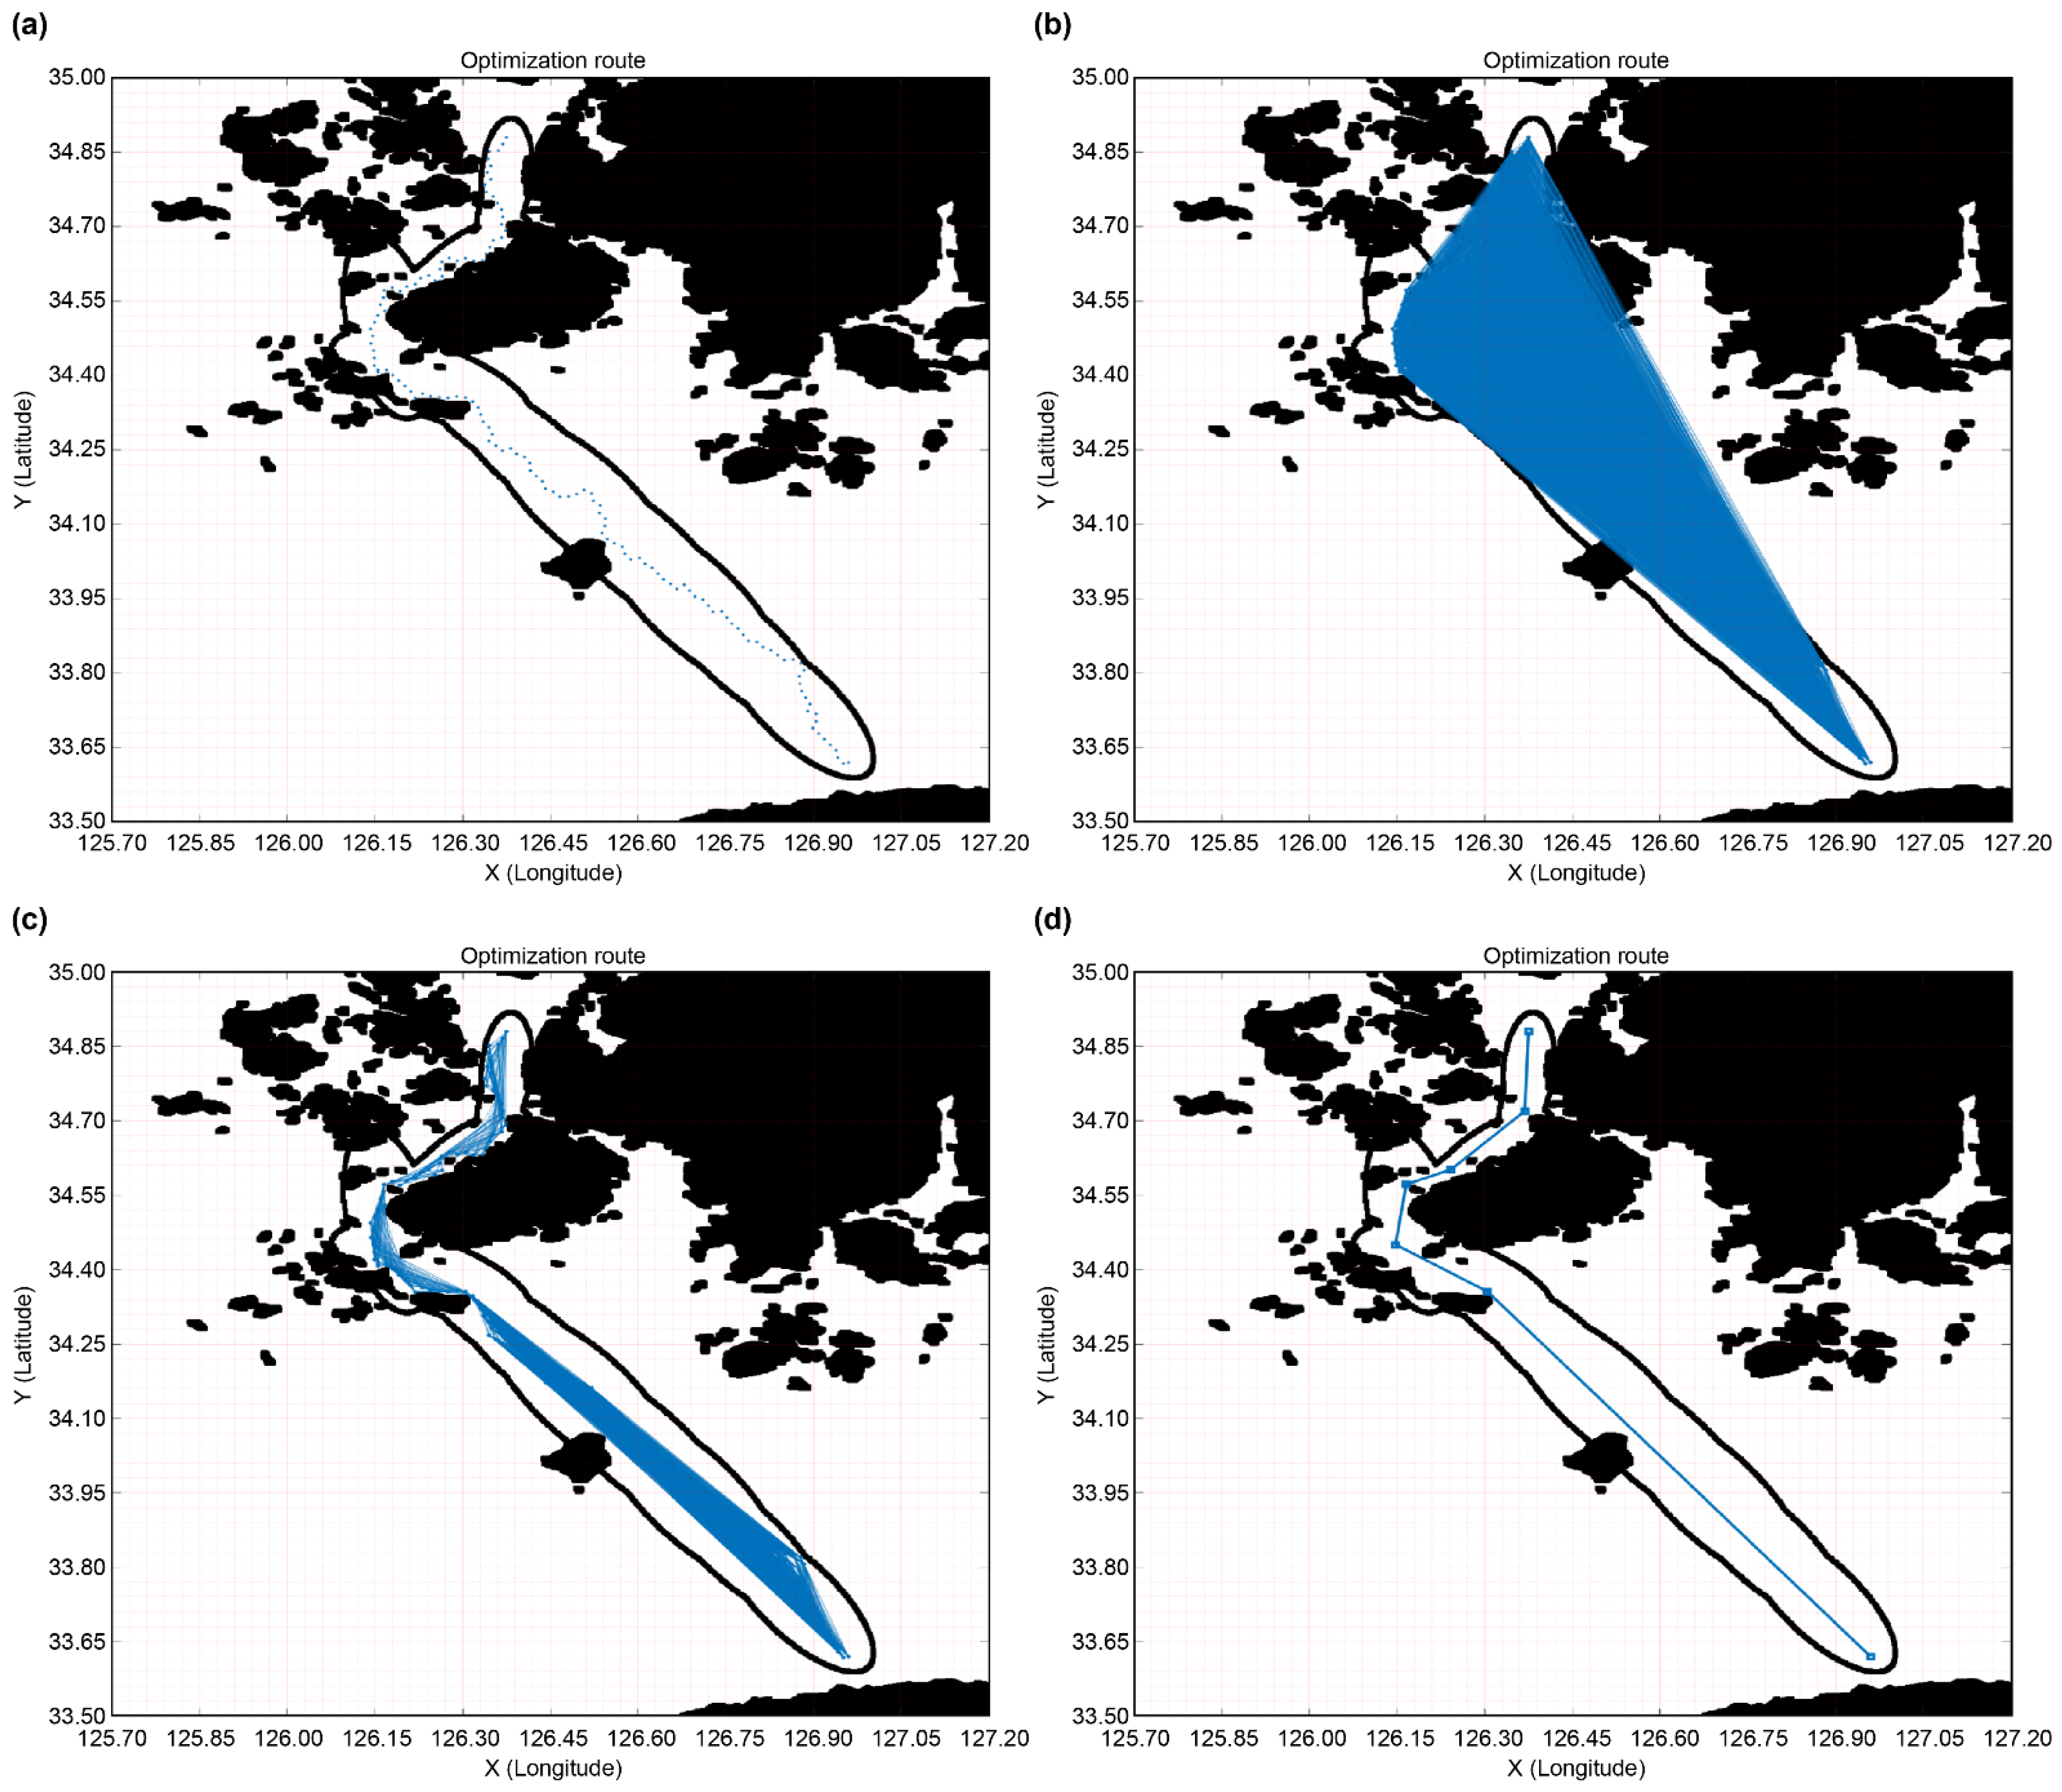
The simulation results showed that the optimal route among the final routes of the designated RRT* algorithm was that of Case 1. The final route derived in Case 1 consists of 67 nodes, as shown in Figure 25a. For the final route optimization, an unweighted, undirected graph with 9453 combinations can be generated by interconnecting all 138 nodes, as shown in Figure 25b. When the collision-free space graph between the graph and obstacle areas is searched, a graph comprising 3503 combinations is generated, as shown in Figure 25c. The result of applying Dijkstra’s algorithm to the collision-free space graph is shown in Figure 25d.
Consequently, an optimal route with a travel distance shortened by approximately 10.1 km when compared with the final route derived using the designated RRT* algorithm and by approximately 50.7 km when compared with the conventional RRT* algorithm was generated.

5. Conclusions

Ships’ route planning is a very important task for ships to reach their destination from their origin. The ship’s optimal route refers to a route that is safe from obstacles in the sea area that are expected to be navigated, determined by considering the economic feasibility and navigational efficiency of the operation. Therefore, this study designed a ship optimal route generation model that keeps safety from the risk factors existing in the maritime space and navigates to the shortest distance. This paper proposes an RRT*-based route-planning algorithm using multi-ellipse spaces to find the optimal route that guarantees greater safety and efficiency than the conventional RRT* algorithm in coastal waters. The initial route was generated using the PRM algorithm, which is a multiple-query algorithm. Moreover, the RRT*-based route-planning algorithm was applied to a multi-ellipse space based on the initial route. The shortest route free of collisions was searched using the graph algorithm to optimize the final route generated using the RRT* method. To verify the performance of the proposed algorithm, a route-search simulation was performed using the Mokpo Port pilot boarding point as the starting point and the Jeju Port pilot boarding point as the end point. Simulation results in four cases showed that changing the route generation parameter improved the efficiency of the algorithm proposed by this study was improved in terms of distance and calculation time for route generation in all cases. As a result of the comparison, the distance of the generated route was reduced by up to 33.7 km, and the calculation time was reduced by about 4.7 times. In addition, as a result of optimization of the path generated through the algorithm proposed in this study, the distance of about 10.1 km was shortened. Compared to the existing RRT*, an optimal route with a reduced distance of about 50.7 km was generated. Therefore, in this study, it was possible to generate an optimal route through a minimal node by removing unnecessary nodes and creating a graph without collisions with obstacles so that ships could navigate along the route.
There are some limitations to this study, firstly, as the range of the target sea area increases, it may not be possible to express in detail the shape of the obstacle area when creating the map space. Secondly, the fact that only vessels in a specific coastal area were included, so the results may not be extensible to other geographical locations. Therefore, in the future, the scope of research should be expanded so that it can be applied to a wider range of areas, not to generate routes that only apply to specific spaces. Ships generally follow the traffic flow and navigation regulations for safe navigation when there are traffic partitions, one-way routes, and navigation regulations in the sea area to be crossed. However, regarding the safety factors considered for route search in this study, only the safety depth of passing ships and the safety distance to fixed obstacles in the sea were considered. Therefore, in the future, research on how to reflect navigation regulations and traffic flow information in route generation will be needed for the exchange of optimal route information between ship operators and VTSO. Furthermore, although the simulation in this study only searched for the route from Mokpo Port to Jeju Port in South Korea, segmented routes would need to be searched for larger sea areas because the range of routes searched at sea could be considerably larger, depending on their start and end points. Future research should conduct a route search that reflects navigation regulations and traffic flow information. Moreover, to verify the route generation algorithm from the perspective of the ship operator and ship traffic manager, the risk should be analyzed through the simulation of ship handling in a virtual environment using the Full Mission Ship Handling Simulator and the real ship experiment using the real ship. In addition, the route validity must be verified through a tank experiment using a model ship equipped with a sensor device to navigate a route created in an environment with several obstacles similar to those in the real environment.
Nevertheless, the route-search method in a multi-ellipse space proposed in this study can be expected to contribute to the reduction of marine accidents by providing the expected route for the main ship, as well as other ships and ship traffic observers, and by enabling fast, safe route searches in complex sea environments.

Author Contributions

Conceptualization, D.-u.J. and J.-s.K.; methodology, J.-s.K.; software, D.-u.J. and J.-s.K.; validation, D.-u.J. and J.-s.K.; formal analysis, J.-s.K.; investigation, D.-u.J.; resources, D.-u.J.; data curation, D.-u.J.; writing—original draft preparation, D.-u.J.; writing—review and editing, J.-s.K.; visualization, D.-u.J.; supervision, J.-s.K.; project administration, J.-s.K.; funding acquisition, J.-s.K. All authors have read and agreed to the published version of the manuscript.

Funding

This work is part of the project titled “Development of cloud-based next-generation VTS Integration platform”, funded by the Korea Coast Guard (KIMST-20210591).

Institutional Review Board Statement

Not applicable.

Informed Consent Statement

Not applicable.

Data Availability Statement

Not applicable.

Conflicts of Interest

The authors declare no conflict of interest. The funders had no role in the design of the study; in the collection, analyses, or interpretation of data; in the writing of the manuscript; or in the decision to publish the results.

References

  1. Lee, W.H.; Choi, G.H.; Kim, T.W. Visibility graph-based path-planning algorithm with quadtree representation. Appl. Ocean Res. 2021, 117, 102887. [Google Scholar] [CrossRef]
  2. Lee, L.N.; Kim, J.S. Development of priority index for intelligent vessel traffic monitoring system in vessel traffic service areas. Appl. Sci. 2022, 12, 3807. [Google Scholar] [CrossRef]
  3. Lozano-Perez, T. Spatial planning: A configuration space approach. IEEE Trans. Comput. 1983, 100, 108–120. [Google Scholar] [CrossRef] [Green Version]
  4. Sleumer, N.; Tschichold-Gürmann, N. Exact Cell Decomposition of Arrangements Used for Path Planning in Robotics; Technical Report/ETH Zurich, Department of Computer Science 329: Zürich, Switzerland, 1999. [Google Scholar]
  5. Amato, N.M.; Wu, Y. A Randomized Roadmap Method for Path and Manipulation Planning. In Proceedings of the IEEE International Conference on Robotics and Automation, Minneapolis, MN, USA, 22–28 April 1996; Volume 1, pp. 113–120. [Google Scholar]
  6. LaValle, S.M. Rapidly-exploring random trees: A new tool for path planning. Res. Rep. 1998, 9811, 1–4. Available online: https://www.cs.csustan.edu/~xliang/Courses/CS4710-21S/Papers/06%20RRT.pdf (accessed on 8 November 2022).
  7. Brooks, R.A.; Lozano-Pérez, T. A subdivision algorithm in configuration space for find path with rotation. IEEE Trans. Syst. Man Cybern. 1985, SMC-15, 224–233. [Google Scholar] [CrossRef] [Green Version]
  8. Mark, B.; Cheong, O.; Krevel, M.; Overmars, M. Computational Geometry: Algorithms and Applications; Springer: Berlin/Heidelberg, Germany, 2008; ISBN 978-3-540-77973-5. [Google Scholar]
  9. Fiorini, P.; Shiller, Z. Motion planning in dynamic environments using velocity obstacles. Int. J. Robot. Res. 1998, 17, 760–772. [Google Scholar] [CrossRef]
  10. Choset, H.; Burdick, J. Sensor Based Planning. I. The Generalized Voronoi Graph. In Proceedings of the 1995 IEEE International Conference on Robotics and Automation, Nagoya, Japan, 21–27 May 1995; pp. 1649–1655. [Google Scholar]
  11. Hsu, D.; Kavraki, L.E.; Latombe, J.C.; Motwani, R.; Sorkin, S. On finding narrow passages with probabilistic roadmap planners. In Robotics: The Algorithmic Perspective: 1998 Workshop on The Algorithmic Foundations of Robotics; A K Peters/CRC Press: New York, NY, USA, 1998; pp. 141–154. [Google Scholar]
  12. Dijkstra, E.W. A note on two problems in connexion with graphs. Numer. Math. 1959, 1, 269–271. [Google Scholar] [CrossRef] [Green Version]
  13. Hart, P.E.; Nilsson, N.J.; Raphael, B. A formal basis for the heuristic determination of minimum cost paths. IEEE Trans. Syst. Sci. Cybern. 1968, 4, 100–107. [Google Scholar] [CrossRef]
  14. Bellman, R. On a routing problem. Quart. Appl. Math. 1958, 16, 87–90. [Google Scholar] [CrossRef] [Green Version]
  15. Szlapczynska, J. Multi-objective weather routing with customised criteria and constraints. J. Navig. 2015, 68, 338–354. [Google Scholar] [CrossRef] [Green Version]
  16. Sen, D.; Padhy, C.P. An approach for development of a ship routing algorithm for application in the north Indian ocean region. Appl. Ocean Res. 2015, 50, 173–191. [Google Scholar] [CrossRef]
  17. Vettor, R.; Guedes Soares, C. Development of a ship weather routing system. Ocean Eng. 2016, 123, 1–14. [Google Scholar] [CrossRef]
  18. IMO. IMO Resolution A. 893(21) Guidelines for Voyage Planning; IMO: London, UK, 1999. [Google Scholar]
  19. Shah, B.C.; Gupta, S.K. Long-distance path planning for unmanned surface vehicles in complex marine environment. J. Ocean. Eng. 2019, 45, 813–830. [Google Scholar] [CrossRef]
  20. Niu, H.L.; Savvaris, A.; Tsourdos, A.; Ji, Z. Voronoi-visibility roadmap-based path planning algorithm for unmanned Surface vehicles. J. Navig. 2019, 72, 850–874. [Google Scholar] [CrossRef]
  21. Ari, I.; Aksakalli, V.; Aydog, V.; Kum, S. Optimal ship navigation with safety distance and realistic turn constraints. Eur. J. Oper. Res. 2013, 229, 707–717. [Google Scholar] [CrossRef]
  22. Shi, B.; Su, Y.; Zhang, H.; Liu, J.; Wan, L. Obstacles modeling method in cluttered environments using satellite images and its application to path planning for USV. Int. J. Nav. Archit. Ocean Eng. 2018, 11, 202–210. [Google Scholar] [CrossRef]
  23. Ozkan, M.F.; Carrillo, L.R.G.; King, S.A. Rescue Boat Path Planning in Flooded Urban Environments. In Proceedings of the 2019 IEEE International Symposium on Measurement and Control in Robotics (ISMCR), Houston, TX, USA, 19–21 September 2019; pp. B2-2-1–B2-2-9. [Google Scholar]
  24. Kavraki, L.E.; Svestka, P.; Latombe, J.C.; Overmars, M.H. Probabilistic roadmaps for path planning in high-dimensional configuration spaces. IEEE Trans. Robot. Autom. 1996, 12, 566–580. [Google Scholar] [CrossRef] [Green Version]
  25. Kavraki, L.E.; Kolountzakis, M.N.; Latombe, J.C. Analysis of probabilistic roadmaps for path planning. IEEE Trans. Robot. Autom. 1998, 14, 166–171. [Google Scholar] [CrossRef] [Green Version]
  26. LaValle, S.M.; Kuffner, J.J., Jr. Randomized kinodynamic planning. Int. J. Robot. Res. 2001, 20, 378–400. [Google Scholar] [CrossRef]
  27. Karaman, S.; Frazzoli, E. Sampling-based algorithms for optimal motion planning. Int. J. Robot. Res. 2011, 30, 846–894. [Google Scholar] [CrossRef] [Green Version]
  28. Karaman, S.; Frazzoli, E. Incremental sampling-based algorithms for optimal motion planning. In Robotics: Science and Systems; MIT Press: Cambridge, MA, USA, 2011; Volume 6, pp. 267–274. [Google Scholar]
  29. Geraerts, R.; Overmars, M.H. A comparative study of probabilistic roadmap planners. In Algorithmic Foundations of Robotics V; Springer: Berlin/Heidelberg, Germany, 2004; pp. 43–57. [Google Scholar]
  30. Kim, J.T.; Kim, D.J. Single-query probabilistic roadmap planning algorithm using remembering exploration method. J. KIISE Comput. Pract. Lett. 2010, 16, 487–491. [Google Scholar]
  31. International Chamber of Shipping. Bridge Procedures Guide, 5th ed.; International Chamber of Shipping: London, UK, 2016. [Google Scholar]
  32. Ministry of Ocean and Fisheries (MOF). Port and Harbor Design Standards; MOF: Sejong City, Korea, 2017. [Google Scholar]
  33. Bhattacharya, P.; Gavrilova, M.L. Roadmap-based path planning-using the voronoi diagram for a clearance-based shortest path. IEEE Robot. Autom. Mag. 2008, 15, 58–66. [Google Scholar] [CrossRef]
  34. Plaku, E.; Bekris, K.E.; Chen, B.Y.; Ladd, A.M.; Kavraki, L.E. Sampling-based roadmap of trees for parallel motion planning. IEEE Trans. Robot. 2005, 21, 597–608. [Google Scholar] [CrossRef]
  35. International Maritime Organization. ECDIS—Guidance for Good Practice, MSC.1-Circ.1503-Rev.1; IMO: London, UK, 2017. [Google Scholar]
  36. Lee, Y.; Kim, J.H. A computational improvement of Otsu’s algorithm by estimating approximate threshold. J. Korea Multimed. Soc. 2017, 20, 163–169. [Google Scholar] [CrossRef] [Green Version]
  37. Otsu, N. A Threshold Selection Method from Gray-Level Histograms. IEEE Trans. Syst. Man Cybern. 1979, 9, 62–66. [Google Scholar] [CrossRef]
  38. IMO. Standards for Ship Maneuverability; Resolution MSC.137(76); IMO: London, UK, 2002. [Google Scholar]
  39. Haralick, R.M.; Shapiro, L.G. Computer and Robot Vision, 1st ed.; Addison-Wesley Reading: Boston, MA, USA, 1992. [Google Scholar]
  40. Yang, A.; Niu, Q.; Zhao, W.; Li, K.; Irwin, G.W. An Efficient Algorithm for Grid-Based Robotic Path Planning Based on Priority Sorting of Direction Vectors. In Life System Modeling and Intelligent Computing; ICSEE 2010 LSMS 2010; Lecture Notes in Computer Science; Springer: Berlin/Heidelberg, Germany, 2010; Volume 6329. [Google Scholar]
  41. Gonzalez, R.C.; Eddins, S.L.; Woods, R.E. Digital Image Publishing Using MATLAB, 1st ed.; Prentice Hall: Upper Saddle River, NJ, USA, 2004. [Google Scholar]
  42. Batko, Y.; Dyminsky, Y. Fast contour tracing algorithm based on a backward contour tracing method. In Proceedings of the ACIT 2018: International Conference “Advanced Computer Information Technologies”, Ceske Budejovice, Czech Republic, 1–3 June 2018. [Google Scholar]
Figure 1. The navigator’s route planning process.
Jmse 10 01800 g001
Figure 2. No go area indicates the area shaded in red, including safety depth and obstacles marked on the chart.
Jmse 10 01800 g002
Figure 3. The probabilistic road map (PRM) algorithm’s search process: (a). Sample random nodes, (b) Connect a node within radius ‘ r ’, (c) Create e roadmap without collision, and (d) Find short path within roadmap.
Jmse 10 01800 g003
Figure 4. The rapidly-exploring random tree (RRT) algorithm’s search process: (a) Select a q r a n d and q n e a r , (b) select a q n e a r within distance r , (c) repeat ‘(a) and (b)’ process, (d) if collision occurs regenerate q r a n d , (e) regenerate q r a n d without collision, and (f) repeat process to q g o a l .
Jmse 10 01800 g004
Figure 5. The RRT* algorithm’s search process: (a) Random sampling q r a n d , (b) include the node q n e w , (c) Find near neighbors, (d) select best parent, (e) check cost for rewiring, and (f) rewired tree.
Jmse 10 01800 g005
Figure 6. Process flow of the proposed route-planning algorithm.
Jmse 10 01800 g006
Figure 7. Electric chart image with safety depth.
Jmse 10 01800 g007
Figure 8. The creation of a binary image using the threshold image segmentation technique.
Jmse 10 01800 g008
Figure 9. Safety distance using the tactical diameter.
Jmse 10 01800 g009
Figure 10. Binary occupancy grid map used for route planning.
Jmse 10 01800 g010
Figure 11. Characteristics of the ellipse.
Jmse 10 01800 g011
Figure 12. Symmetrical difference set.
Jmse 10 01800 g012
Figure 13. The multi-ellipse space created for the RRT* algorithm.
Jmse 10 01800 g013
Figure 14. The multi-ellipse map process: (a) Initial route data, (b) create an ellipse through each leg data, (c) calculation of symmetrical difference set, and (d) create a multi-ellipse space.
Jmse 10 01800 g014
Figure 15. The contour tracing method.
Jmse 10 01800 g015
Figure 16. Building a map for generating the initial route: (a) Original chart image, (b) binary image map with safety depth data (c) applied safety margin (d) binary occupancy grid map for route search.
Jmse 10 01800 g016
Figure 17. Comparison of the cost based on the number of nodes.
Jmse 10 01800 g017
Figure 18. Initial route generation results using the PRM algorithm.
Jmse 10 01800 g018
Figure 19. The process of generating a multi-ellipse space.
Jmse 10 01800 g019
Figure 20. The route planning simulation results.
Jmse 10 01800 g020
Figure 21. Comparison of the simulation results (Case 1).
Jmse 10 01800 g021
Figure 22. Comparison of the simulation results (Case 2).
Jmse 10 01800 g022
Figure 23. Comparison of the simulation results (Case 3).
Jmse 10 01800 g023
Figure 24. Comparison of the simulation results (Case 4).
Jmse 10 01800 g024
Figure 25. The route optimization process: (a) The final route derived in Case 1 consists of 67 nodes, (b) generate undirected graph by inter-connecting all nodes, (c) searched collision-free space graph between the graph and obstacles area, and (d) The result of applying Dijkstra’s algorithm to the collision-free space graph.
Jmse 10 01800 g025
Table 1. The Korean Ministry of Ocean and Fisheries (MOF) “Port and Harbor Design Standards” relating to a ship’s under-keel clearance (UKC).
Application WaterMax. UKC
In case of harbor10% of maximum draft
In case of inner channel or harbor approach without swell15% of maximum draft
There is a swell, or the route is relatively long20% of maximum draft
Table 2. The World Association for Waterborne Transport Infrastructure (PIANC)’s depth components.
DescriptionVessel
Speed
Wave
Conditions
Channel
Bottom
Inner
Channel
Outer
Channel
Ship   Related   Factors
Depth (h) 10   kts None 1.10   T
10 15   kts 1.12   T
>15 kts 1.15 T
AllLow swell
( H s < 1   m )
1.15   T   to
1.2 T
Moderate swell
( 1   m < H s < 2   m )
1.2   T   to
1.3   T
Heavy swell
( H s > 2   m )
1.3   T   to
1.4   T
Add for Channel Bottom Type
AllAllMudNoneNone
Sand/Clay0.4 m0.5 m
Rock/Coral0.6 m1.0 m
Note: Assumes T > 10   m . If T < 10   m , use the value for T = 10   m . T means the draught of the ship.
Table 3. Details of the simulation target area and ship model.
ItemDescription
Extract rangeLat: 33°30′30″ N~34°50′56″ N, Lon: 125°45′00″ E~126°49′42″ E
Start point
Goal point
34°27′42″ N, 126°03′45″ E (Mokpo No.1 Pilot Station)
33°34′00″ N, 126°33′00″ E (Jeju Pilot Station)
Model shipLOA: 103.4 (m)Breadth: 15.0 (m)Max. Draft: 7.0 (m)
Table 4. Components of the route-planning simulation.
Simulation Case4 Cases
Map size100 × 100 km
Max .   Connection .   Distance ,   r 500, 1000 m
Max .   Number   of   Tree   Nodes ,   V 10,000, 20,000
Max .   Iterations ,   I n i t 5000; 10,000; 20,000; 40,000; 80,000; 160,000; 320,000
Number of Simulations10
Table 5. Results of the simulations.
CaseMax.
r
M a x .
V
M a x .
I n i t
RRT*Designated RRT* (Proposed)
Ave.
Time
Ave.
Cost
* PathAve.
Time
Ave.
Cost
* Path
150010,00050001.39171.53360.65138.9656
10,0005.03168.65581.07133.4759
20,00013.74166.709102.95133.02710
40,00013.62157.7791010.10138.27810
80,00013.50139.3861030.94136.27410
160,00013.64136.2041065.48137.68910
320,00013.47135.8021067.58133.70110
250020,00050001.17161.88980.63135.6857
10,0003.98161.50181.54134.0818
20,00019.05161.083103.80135.56710
40,00051.73150.7151010.07136.40510
80,00051.91149.6471030.27136.93910
160,00052.24146.23510106.15129.27610
320,00051.45145.48210245.52140.12510
3100010,00050001.71151.48170.51137.1037
10,0005.33150.97891.25135.7189
20,00013.48150.477103.22132.78310
40,00013.70157.006109.21136.41210
80,00013.74153.8481030.05135.81910
160,00013.88149.8251067.59139.58910
320,00014.07147.2361067.30133.69410
4100020,00050001.38151.55390.45138.8498
10,0004.76151.076101.25137.7009
20,00022.96150.254103.30133.82410
40,00053.20148.527109.29136.08810
80,00052.62147.9111029.78136.52610
160,00052.43145.62210105.46134.62410
320,00053.89144.41710244.77134.239 10
* Path: Number of paths actually created as a result of the simulations.
Publisher’s Note: MDPI stays neutral with regard to jurisdictional claims in published maps and institutional affiliations.