Article

Analysis of Cyclic Shear Stress–Displacement Mechanical Properties of Silt–Steel Interface in the Yellow River Delta

1
Key Laboratory of Geological Safety of Coastal Urban Underground Space, Ministry of Natural Resources, Qingdao 266100, China
2
Qingdao Geo-Engineering Surveying Institute, Qingdao Geological Exploration Development Bureau, Qingdao 266100, China
3
Department of Environmental Science and Engineering, Ocean University of China, Qingdao 266100, China
4
Key Laboratory of Marine Environmental Science and Ecology, Ministry of Education, Qingdao 266100, China
*
Author to whom correspondence should be addressed.
J. Mar. Sci. Eng. 2022, 10(11), 1704; https://doi.org/10.3390/jmse10111704
Submission received: 21 September 2022 / Revised: 26 October 2022 / Accepted: 7 November 2022 / Published: 9 November 2022
(This article belongs to the Special Issue Advances in Marine Engineering: Geological Environment and Hazards)

Abstract

:
Pile foundations of offshore structures are often subjected to cyclic loads under storm loads, thus reducing their vertical bearing capacity. Therefore, studying the cyclic shear behavior of the soil–structure interface is important for maintaining the stability of offshore structures. A series of cyclic shear tests of the silt–steel interface were carried out using a large interface shear apparatus. The effects of various factors (i.e., normal stress, shear displacement amplitude, roughness, and water content) on the shear stress characteristics of the silt–steel interface were investigated. The stress–displacement model of the cyclic shear silt–steel interface was deduced. The results showed that the shear stress at the silt–steel interface was softened, and the type of bulk deformation was shear shrinkage under cyclic shear. With the increase in shear amplitude, the hysteresis curve gradually developed from “parallelogram” to “shuttle” and “hysteresis cake”. With the increase in normal stress and roughness and the decrease in water content, the interfacial shear strength, volume displacements growth rate, and growth rate increased. The stress–displacement mathematical model of the silt–steel interface based on the modified hyperbolic model was in good agreement with the test data.

1. Introduction

Pile foundations are increasingly widely used in offshore projects, such as offshore wind power and oil and gas platforms. During their service period, they bear the static load generated by the self-weight of the superstructure and the cyclic load generated by waves and winds. Research on the weakening mechanism of the pile–soil interface under cyclic loading is helpful in revealing the mechanical characteristics and load transfer mechanism of the pile–soil interface and is significant for further study of the long-term bearing capacity of pile foundations.
Scholars in the relevant field have carried out cyclic shear tests on soil–structure interfaces. For example, Zhang et al. (2018) [1] designed and developed a new type of 80 ton 3D multi-functional equipment to study the cyclic characteristics of the soil–structure interface under 2D and 3D complex load conditions. Li and Guo (2020) [2] studied the influence of cementitious materials and surface roughness on interfacial shear strength. Jotisankasa et al. (2018) [3] and Li et al. (2020) [4] studied the mechanical properties of sandy soil and the clay pile–soil interface, respectively, and specifically considered the change rule for the shear stiffness and the damping ratio. Wang et al. (2016) [5] used the direct shear after cyclic shear (PCDS) test method to discuss the mechanical properties, including the residual strength, of the interface after re-consolidation under large shear deformation. With regard to the soil–structure interface cyclic shear mechanical model, Liu et al. (2014) [6] proposed a constitutive interface model based on critical state soil mechanics and generalized plasticity that could simulate the cyclic 3D behavior of the soil–structure interface for wide ranges of soil density, normal pressure, and normal stiffness. Stutz et al. (2016) [7] proposed an enhanced non-plastic interface model. The existing plastic model with a predefined sand limit state surface was converted into an interface model by reducing the stress and tension vectors and redefining the tensor. Saberi et al. (2020) [8] continuously revised and improved a two-sided plastic interface constitutive model by introducing critical state soil mechanics, a particle breakage rate, a new failure surface, a 3D shear coupling load, etc., so that the interface model could simulate the complex cyclic behavior of various soil–structure interfaces. However, there are few studies on the silt–structure interface.
Silt, as a transitional soil between sand and clay, presents dual mechanical behavior related to both and has relatively special engineering properties. However, the Yellow River delta silt is formed from rapid sedimentation. The soil has the characteristics of high water content, high pore water pressure, high compressibility, and low shear strength. In this study, a large-scale cyclic shear test of the silt–steel interface was carried out for the silt in the Yellow River subaqueous delta. Considering normal stress, roughness, water content, number of cycles, and shear amplitude, the mechanical characteristics of the shear stress and the displacement at the pile–soil interface under storm cyclic loading were studied, and the mathematical model of stress and displacement was derived. The results are expected to provide a theoretical reference for the design and evaluation of engineering structures under vertical cyclic loading in the Yellow River delta.

2. Materials and Methods

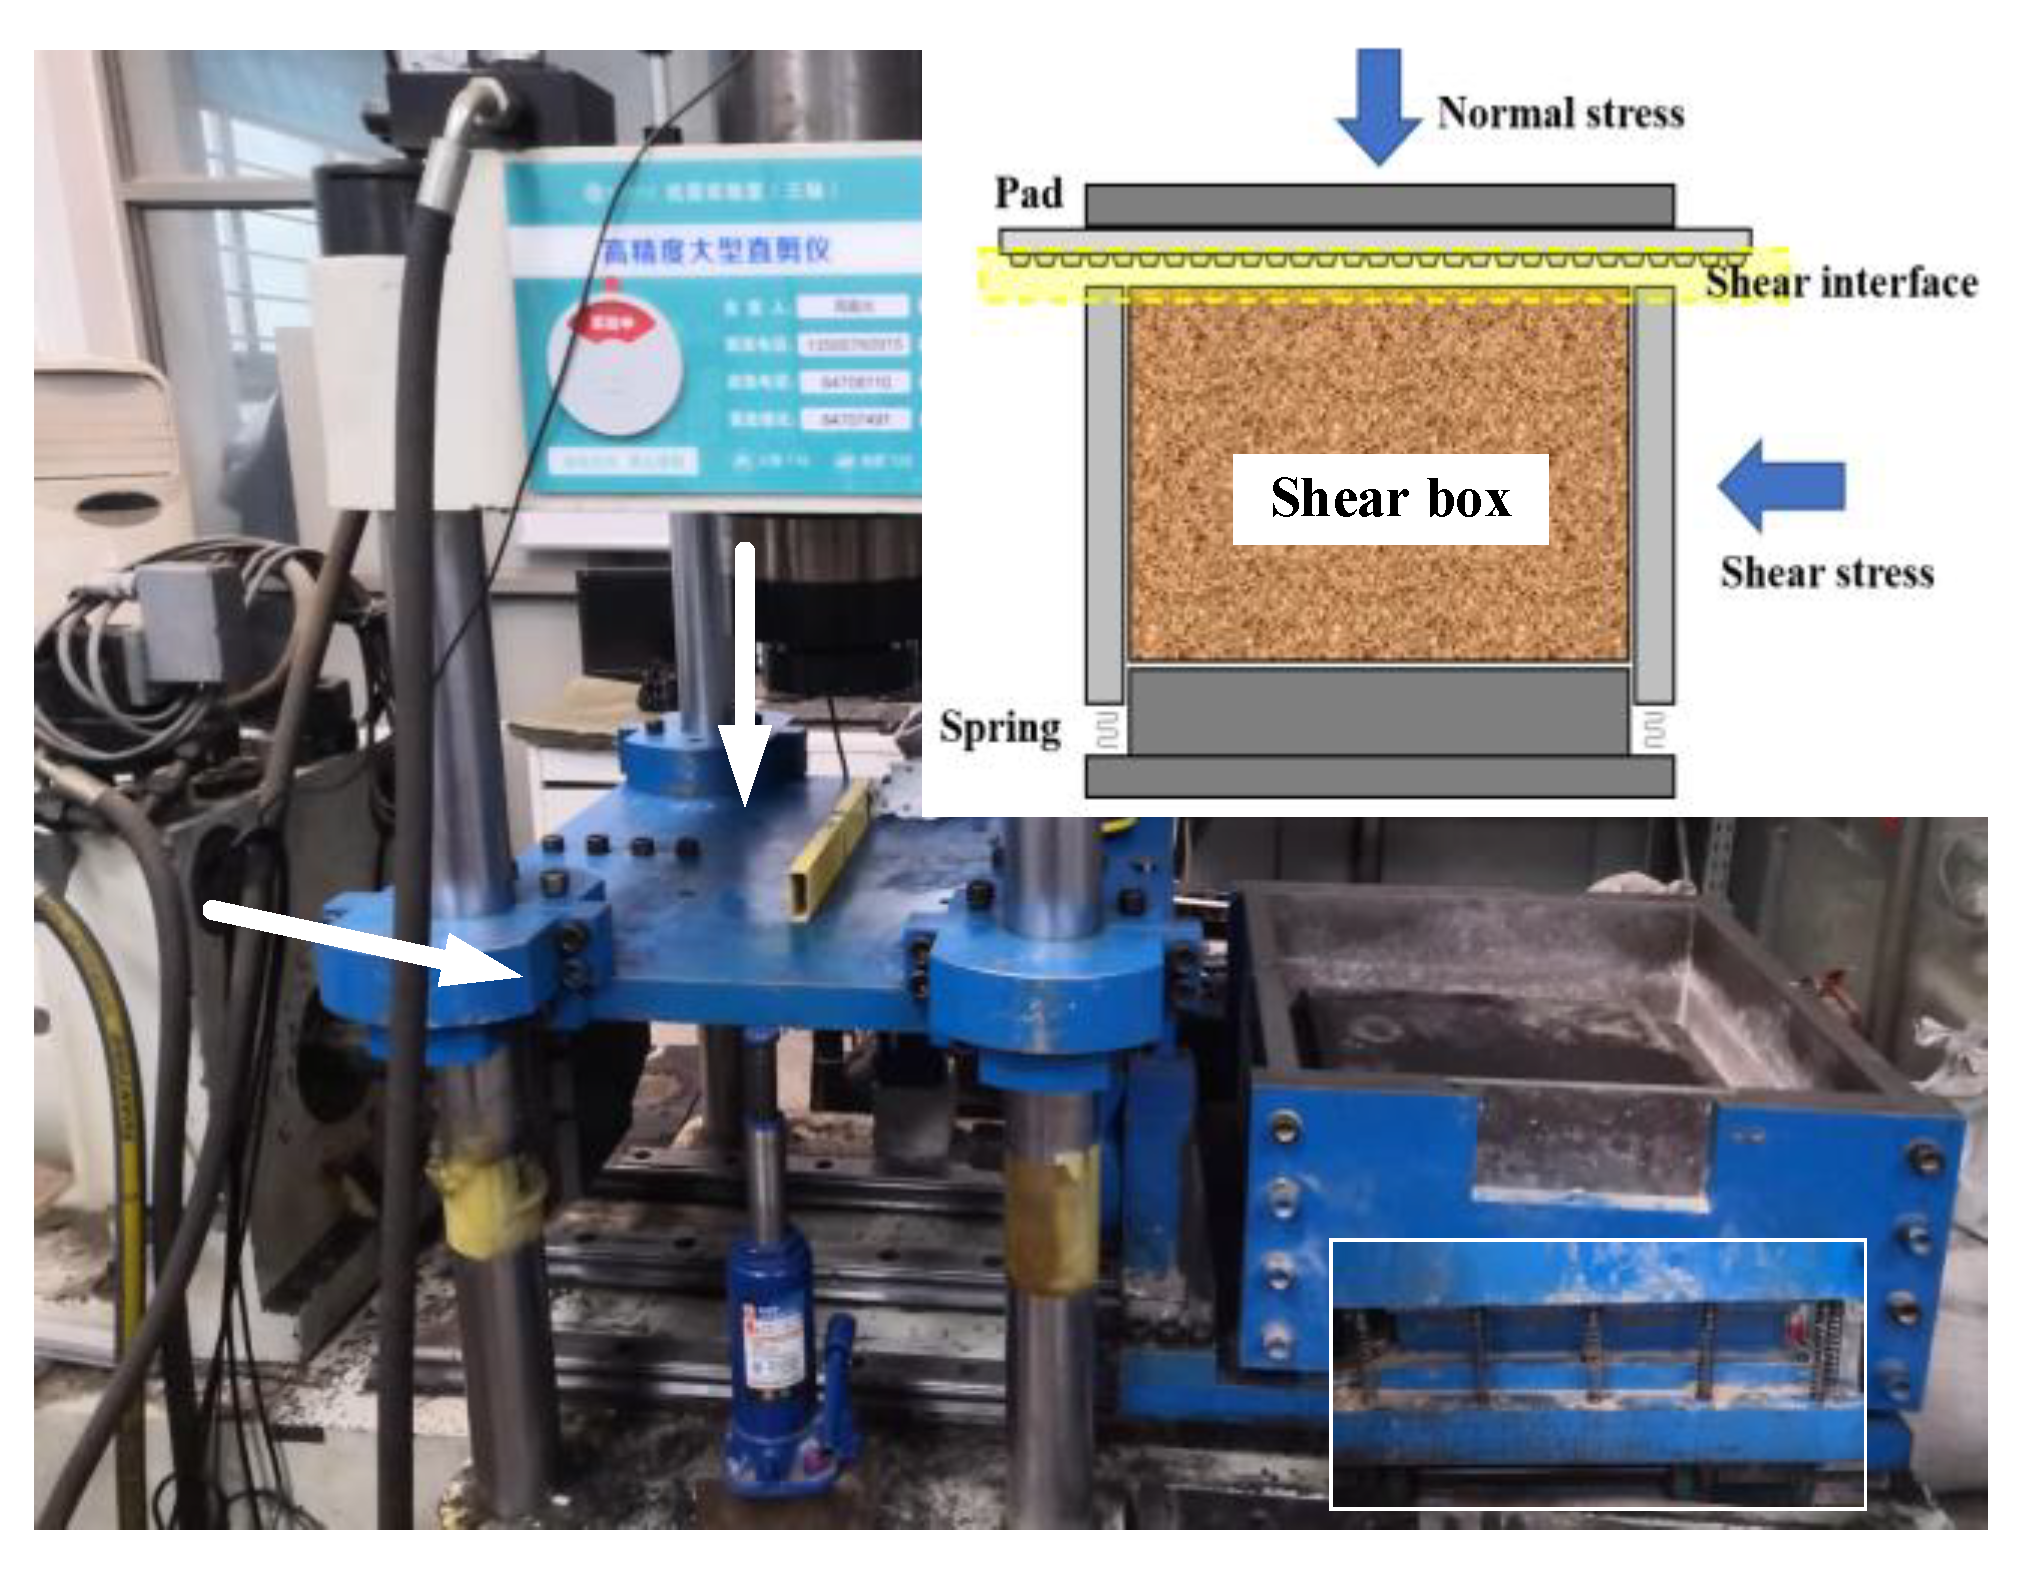
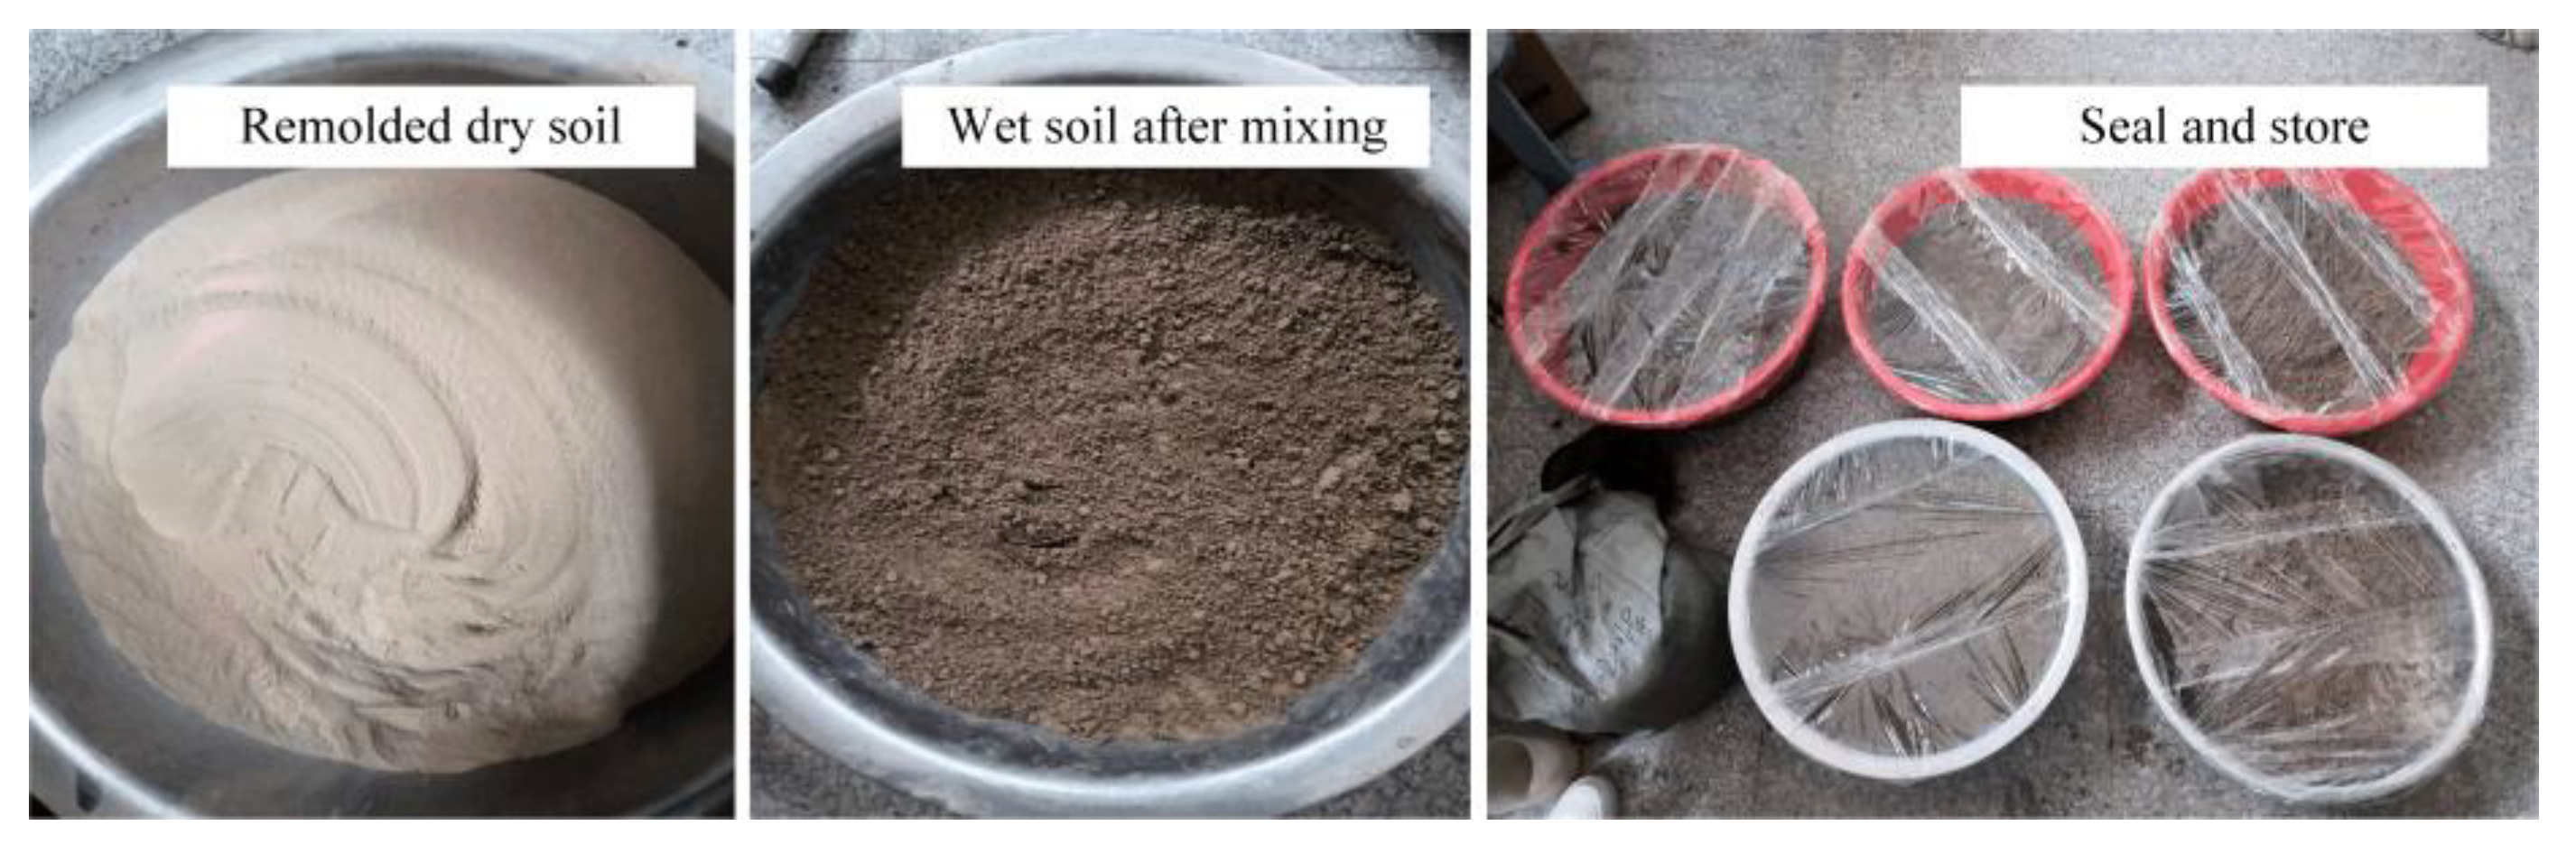
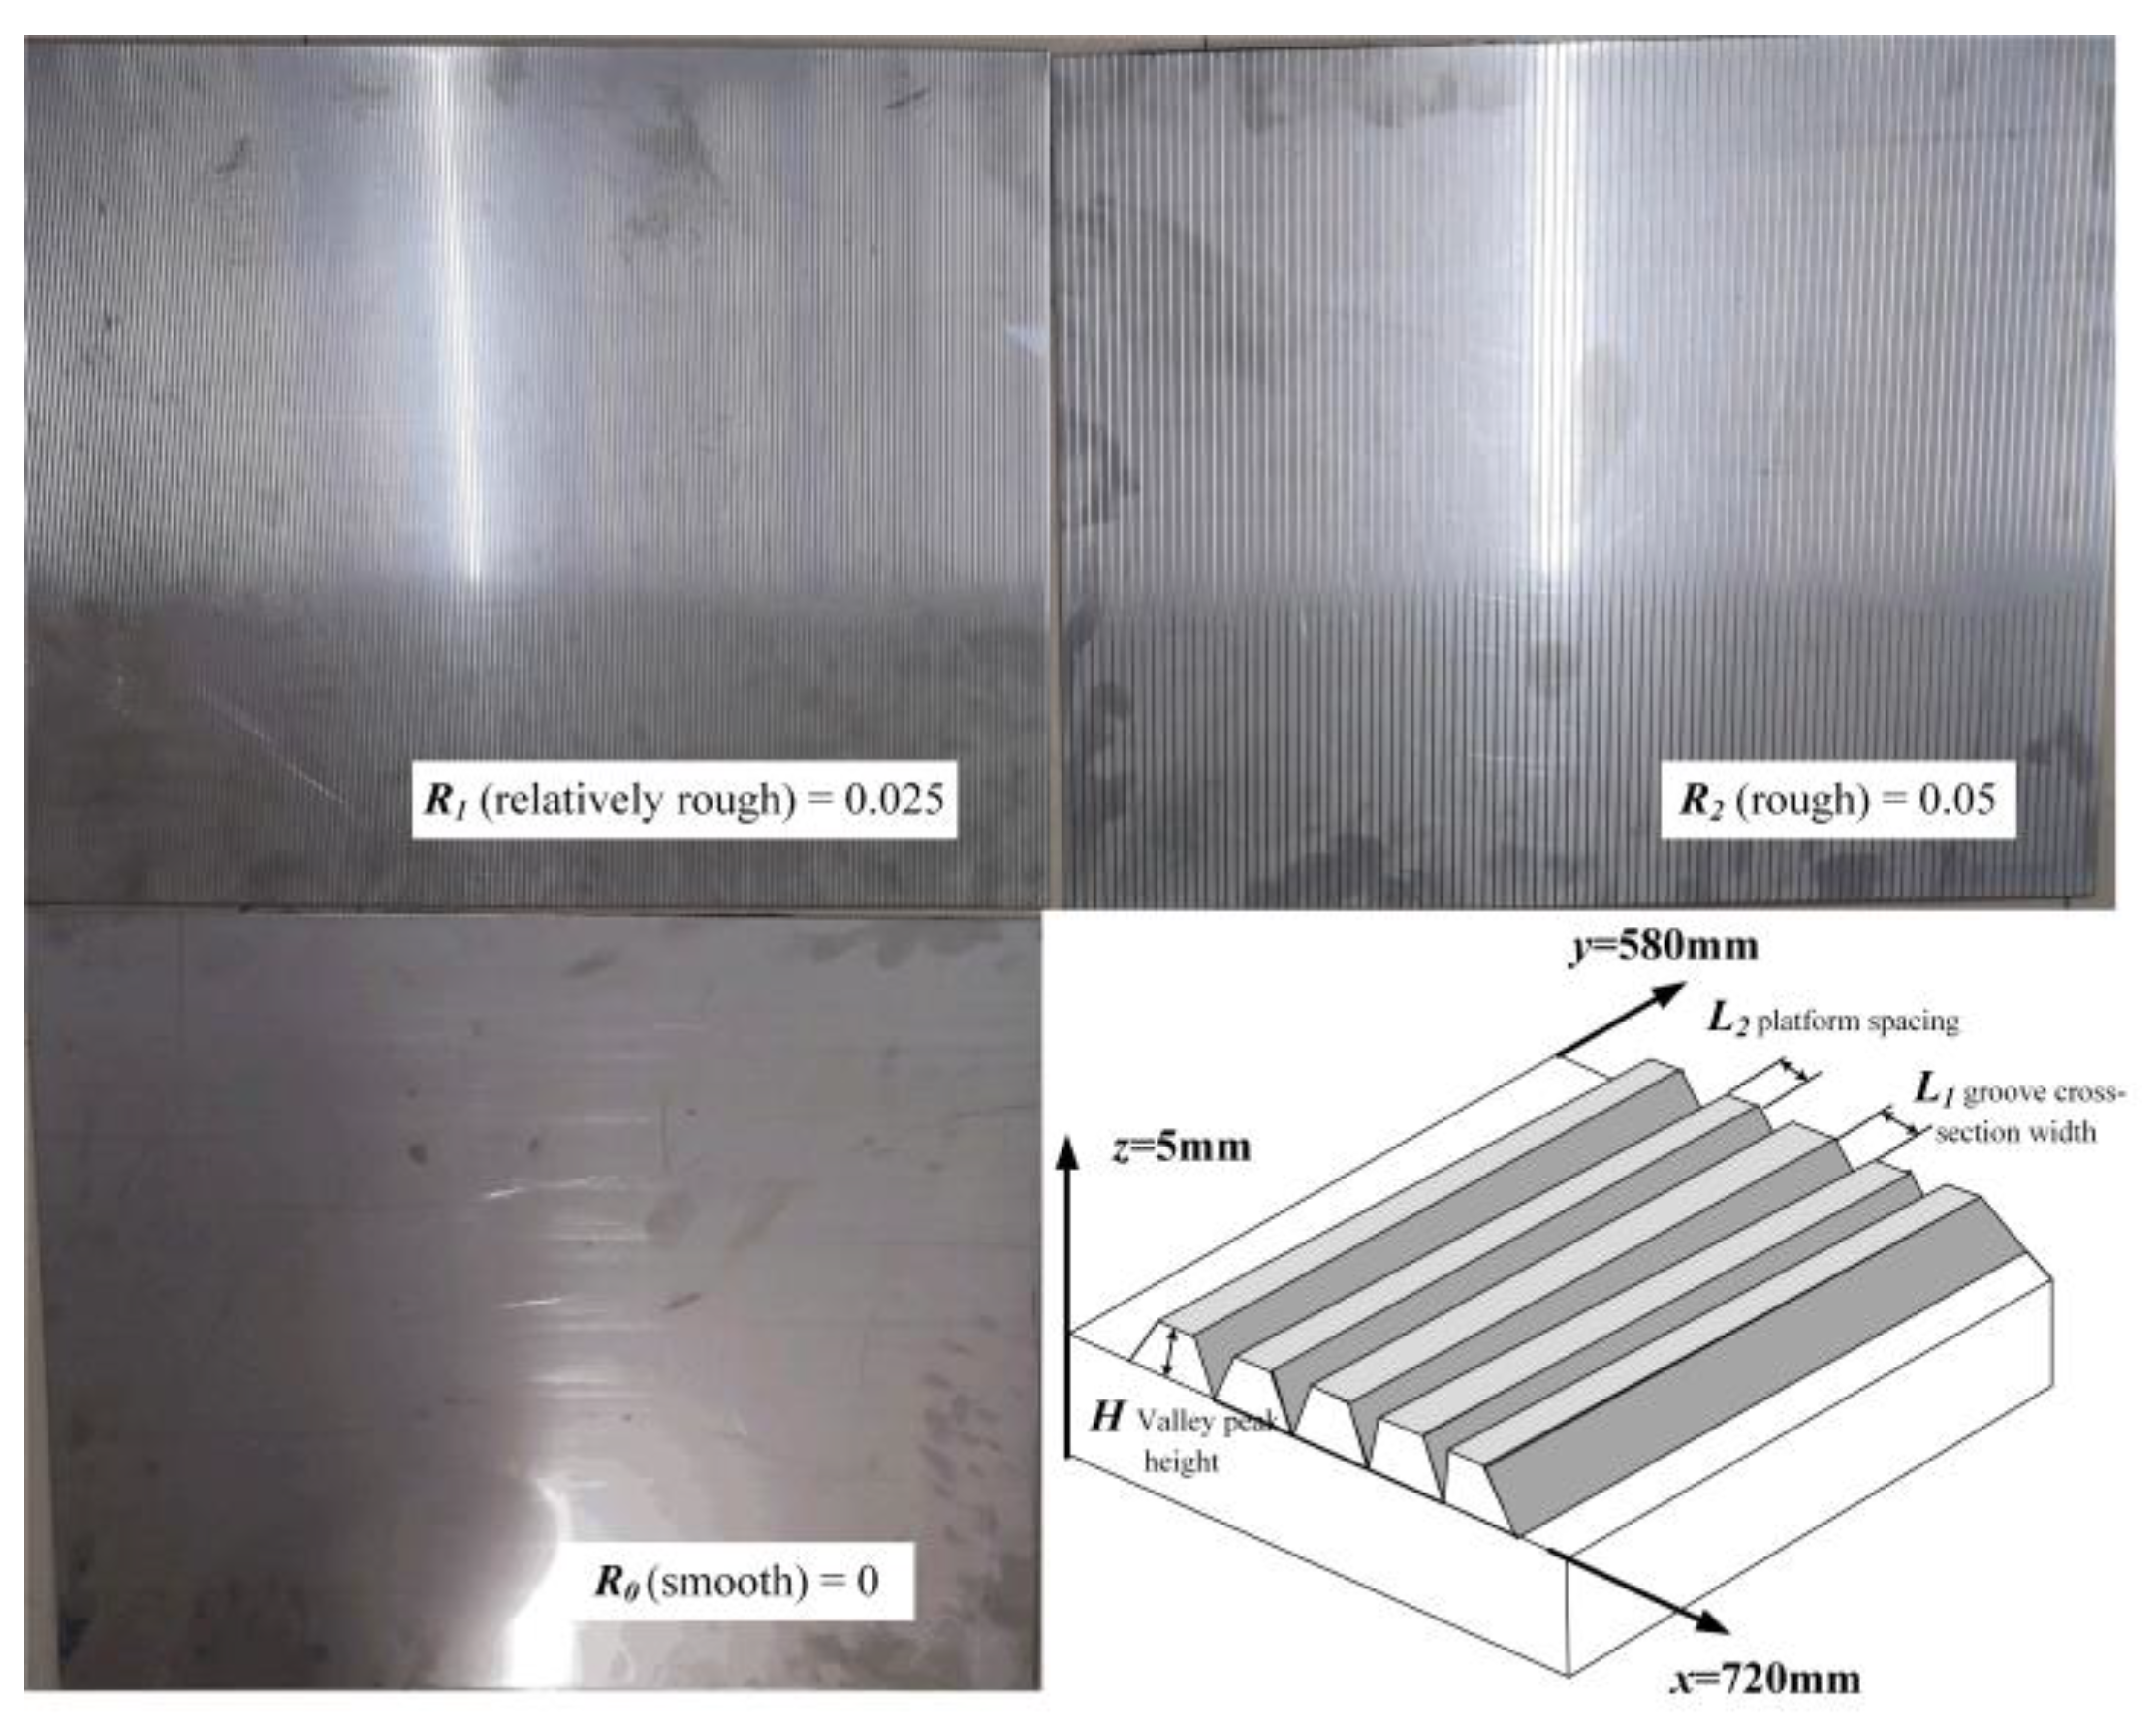
2.1. Test Instruments and Materials
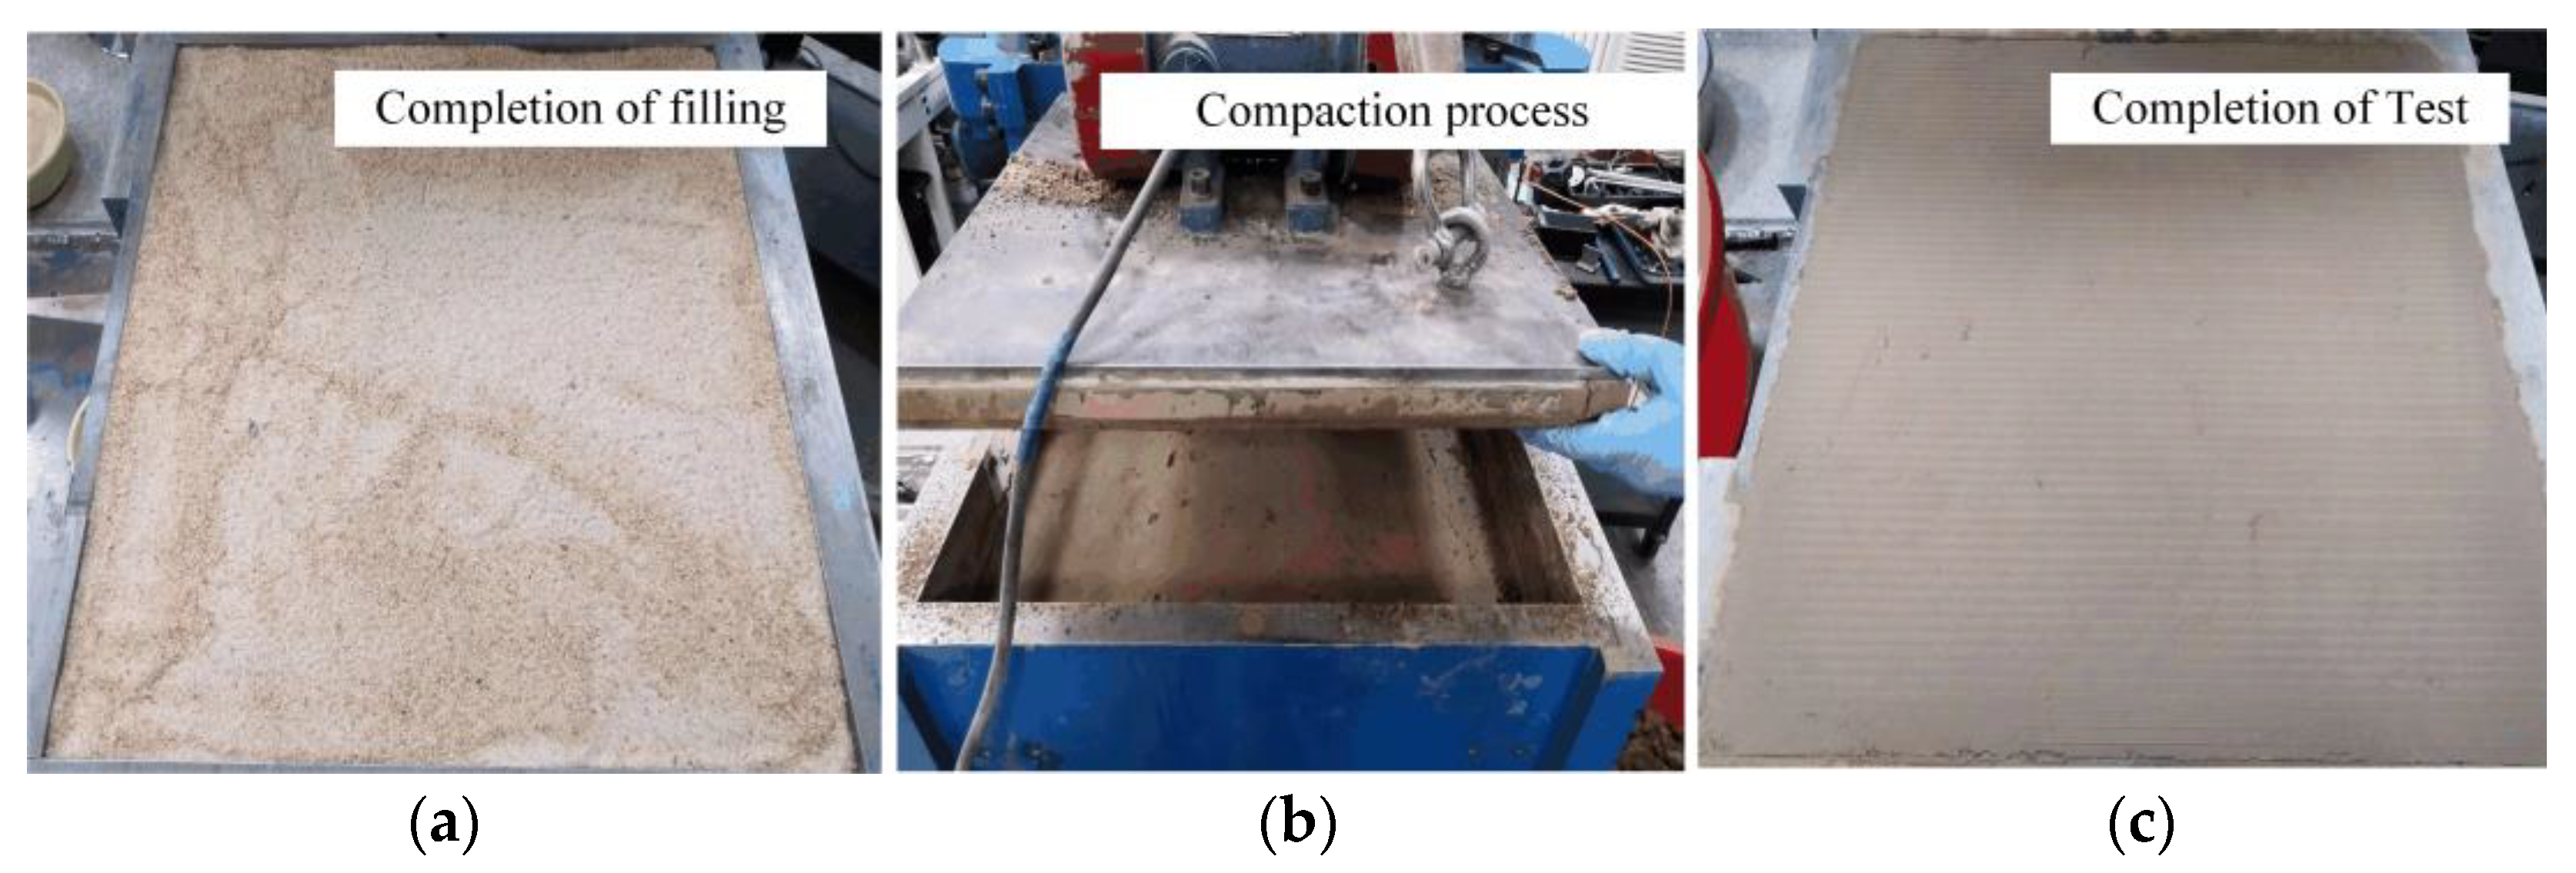
The cyclic shear test was carried out in the Seismic Research Institute of Dalian University of Technology using the JAW-500 large shear apparatus (Figure 1). This large-scale shear apparatus includes the following important components: (1) A computer-controlled automatic hydraulic loading system. The system is equipped with cooling equipment so that a constant load can be applied during the test. (2) A large shear box. The size of the shear box is 500 mm × 500 mm × 300 mm. Transparent glass is set on the side to observe the shear behavior, and the larger size also reduces the boundary effect [9]. (3) A shearing box protection device. The upper part of the shear box is provided with a base plate, and the normal stress is transmitted to the contact surface through the base plate to effectively control the normal boundary conditions. The lower part of the shear box is equipped with 20 springs to measure the volume change during the shearing process.
In accordance with the test conditions, the soil used in this test was the remolded silty seabed soil of the Yellow River delta [10]. The mechanical parameters and grading of the silt are shown in Table 1 and Table 2, and the average particle size d50 = 0.03 mm. Firstly, undisturbed soil with high porosity and poor permeability was remolded through drying, crushing, and screening. Then, the dry density of soil was set to 1.61 g/cm3, and soil samples with different water content were prepared by adding water of different quality. The water content was set according to the engineering geological characteristics of soft soil sediments in the modern underwater delta of the Yellow River [11,12,13] and the optimal water content (19.6%) for soil samples. The relationship between natural water content and void ratio w = 36.668e − 0.983 was adopted for calculations. In addition, considering that soil is close to a soft plastic state when the water content is too large, it cannot withstand the normal pressure of 300 kPa, and the conventional direct shear test cannot be carried out. Therefore, the maximum water content was set to 24% (saturation of 95.2%). Finally, remolded soil samples with a water content of 16%, 20%, and 24% (saturation of 63.5%, 79.3%, and 95.2%) were obtained. After the soil samples were fully stirred, the uniformly stirred soil samples were stored for two days (Figure 2).
To ensure that the effective contact area between the soil samples and steel plate remained unchanged during shearing, the steel plate size along the shearing direction was 220 mm longer than the lower shear box, and the selected steel plate size was 720 mm × 580 mm × 5 mm (Figure 3). In order to simulate the rusting or erosion of pile foundations under actual sea conditions, three steel plate roughness levels (i.e., R0 (smooth), R1 (relatively rough), and R2 (rough)) were set using the modified sand filling method (Table 3) [14]. The steel plate parameters included valley peak height H, groove cross-section width L1, and platform spacing L2. The roughness calculation equation used was as follows:
R = H L 1 2 ( L 1 + L 2 )

2.2. Test Methods

In order to study the relationship between cyclic shear stress and displacements at the silt–steel interface, five influencing factors—normal stress, cycle times, shear amplitude, roughness, and water content—were selected in this test. Given the problems of the large loading and unloading workload and the long test time needed for the large shear apparatus, nine groups were set up in this test: three normal stresses, three shear amplitudes, three roughness levels, and three levels of moisture content (Table 4). It should be noted that this experiment was carried out under the condition of constant normal load (CNL).
Ren et al. (2020) [15] found that the underwater delta of the Yellow River consolidated due to rapid sedimentation, wave action, etc., during its formation. Therefore, undrained fast shear was adopted in this test. Due to the lack of experimental research on the silt interface in the Yellow River subaqueous delta, the test parameters were set according to previous studies on clay and loess interfaces. The normal stress was obtained from the round hole expansion theory, the coefficient of static earth pressure of silt K0 = 0.33, and the horizontal self-weight stress of soil mass σcx = σcy = K0σcz = K0γz. The maximum normal stress was set as 300 kPa. The shear rate was set as 1 mm/s, as recommended by Wang et al. (2019) [16]. The shear amplitudes were set as 5 mm, 15 mm, and 35 mm, in accordance with the size of the instrument. Each group of tests cycled 30 times with a frequency of 0.01 Hz.
Before the test, the soil sample in the shear box was compacted using an automatic compactor. Each layer was filled with 6 cm of soil and was compacted five times. The surface of the soil sample was roughened after each compaction to ensure that the soil sample was isotropic and uniform. After all soil samples were loaded, the soil samples were consolidated for a short time (15 min) under a vertical pressure of 25 kPa to ensure the full transmission of normal stress and avoid the influence of the over-consolidation ratio.
At the beginning of the test, constant normal pressure was applied first, followed by a tangential waveform force. The tangential force, tangential displacement, normal displacement, and other parameters were collected during the test. After the test, the shear plane failure was observed (Figure 4). A large amount of original data for each group of tests was processed using the average displacement value. Furthermore, 20–25 representative points were counted for drawing and analysis. Therefore, the fluctuation in the data curve caused by volume change was not significant [17].

3. Results and Discussion

3.1. Relationship between Shear Stress and Shear Displacement

Isochronous voltage automatic measurement was adopted for data acquisition in the test. There were 1000 data points in each cycle and 30,000 data points in each group of 30 cycles. The data were too extensive to be displayed individually, so the results of the 1st, 5th, 10th, 15th, 20th, 25th, and 30th test cycles were selected as representative data for analysis.

3.1.1. Effect of Normal Stress

Figure 5 shows the shear stress–shear displacement curves under different normal stresses of 100 kPa, 200 kPa, and 300 kPa, with a fixed shear amplitude of 5 mm, steel plate roughness of 0.05, and water content of 20%. The results showed that:
(1) Except for the first cycle, the shear stress–shear displacement hysteresis curve was basically closed. With the increase in the number of cycles, the hysteresis loop shrank inwards, indicating that the interfacial shear stress was softening. This test phenomenon was inconsistent with the test results obtained by Wang et al. (2021) [18] and Rui et al. (2020) [19]. One of the reasons for the inconsistency was the different types of test soil. The above scholars used coarse sand and rockfill materials with larger particle sizes. With increases in the number of cycles, particles break, which causes hardening. However, silt from the Yellow River delta with a smaller particle size was used in this study. In addition, the softening phenomenon was consistent with the test results for red clay with smaller particle sizes [20] and silt [21] from the Yellow River flood area, while the shear amplitude was different. The shear amplitude of 1–3 mm set by the above scholars was relatively small. However, larger shear amplitudes of 5 mm, 15 mm, and 35 mm were selected for this test. In the first few cycles (total shear displacement < 50 mm), the stage of failure equilibrium was almost reached. Therefore, with the increase in the shear displacement, softening occurred;
(2) Under the condition of small shear amplitude, the shear stress–shear displacement hysteresis curve was a parallelogram, and the slope of the loading section was smaller than that of the unloading section. With the increase in normal stress, the slope of the loading section increased while the slope of the unloading section decreased;
(3) In the same cycle, the mechanical properties along different shear directions showed anisotropy. The maximum shear stress in the positive and negative directions appeared at the maximum shear displacement in the respective directions, but the values were different. The maximum shear stress in each direction increased with the increase in normal stress. Zhang et al. (2018) [1] attributed the anisotropy between the shear mechanical response and the shear direction of this interface to the directional constraint of the roughness of the steel plate on the soil particles, and the reverse shear effect caused the soil particles to become reordered.

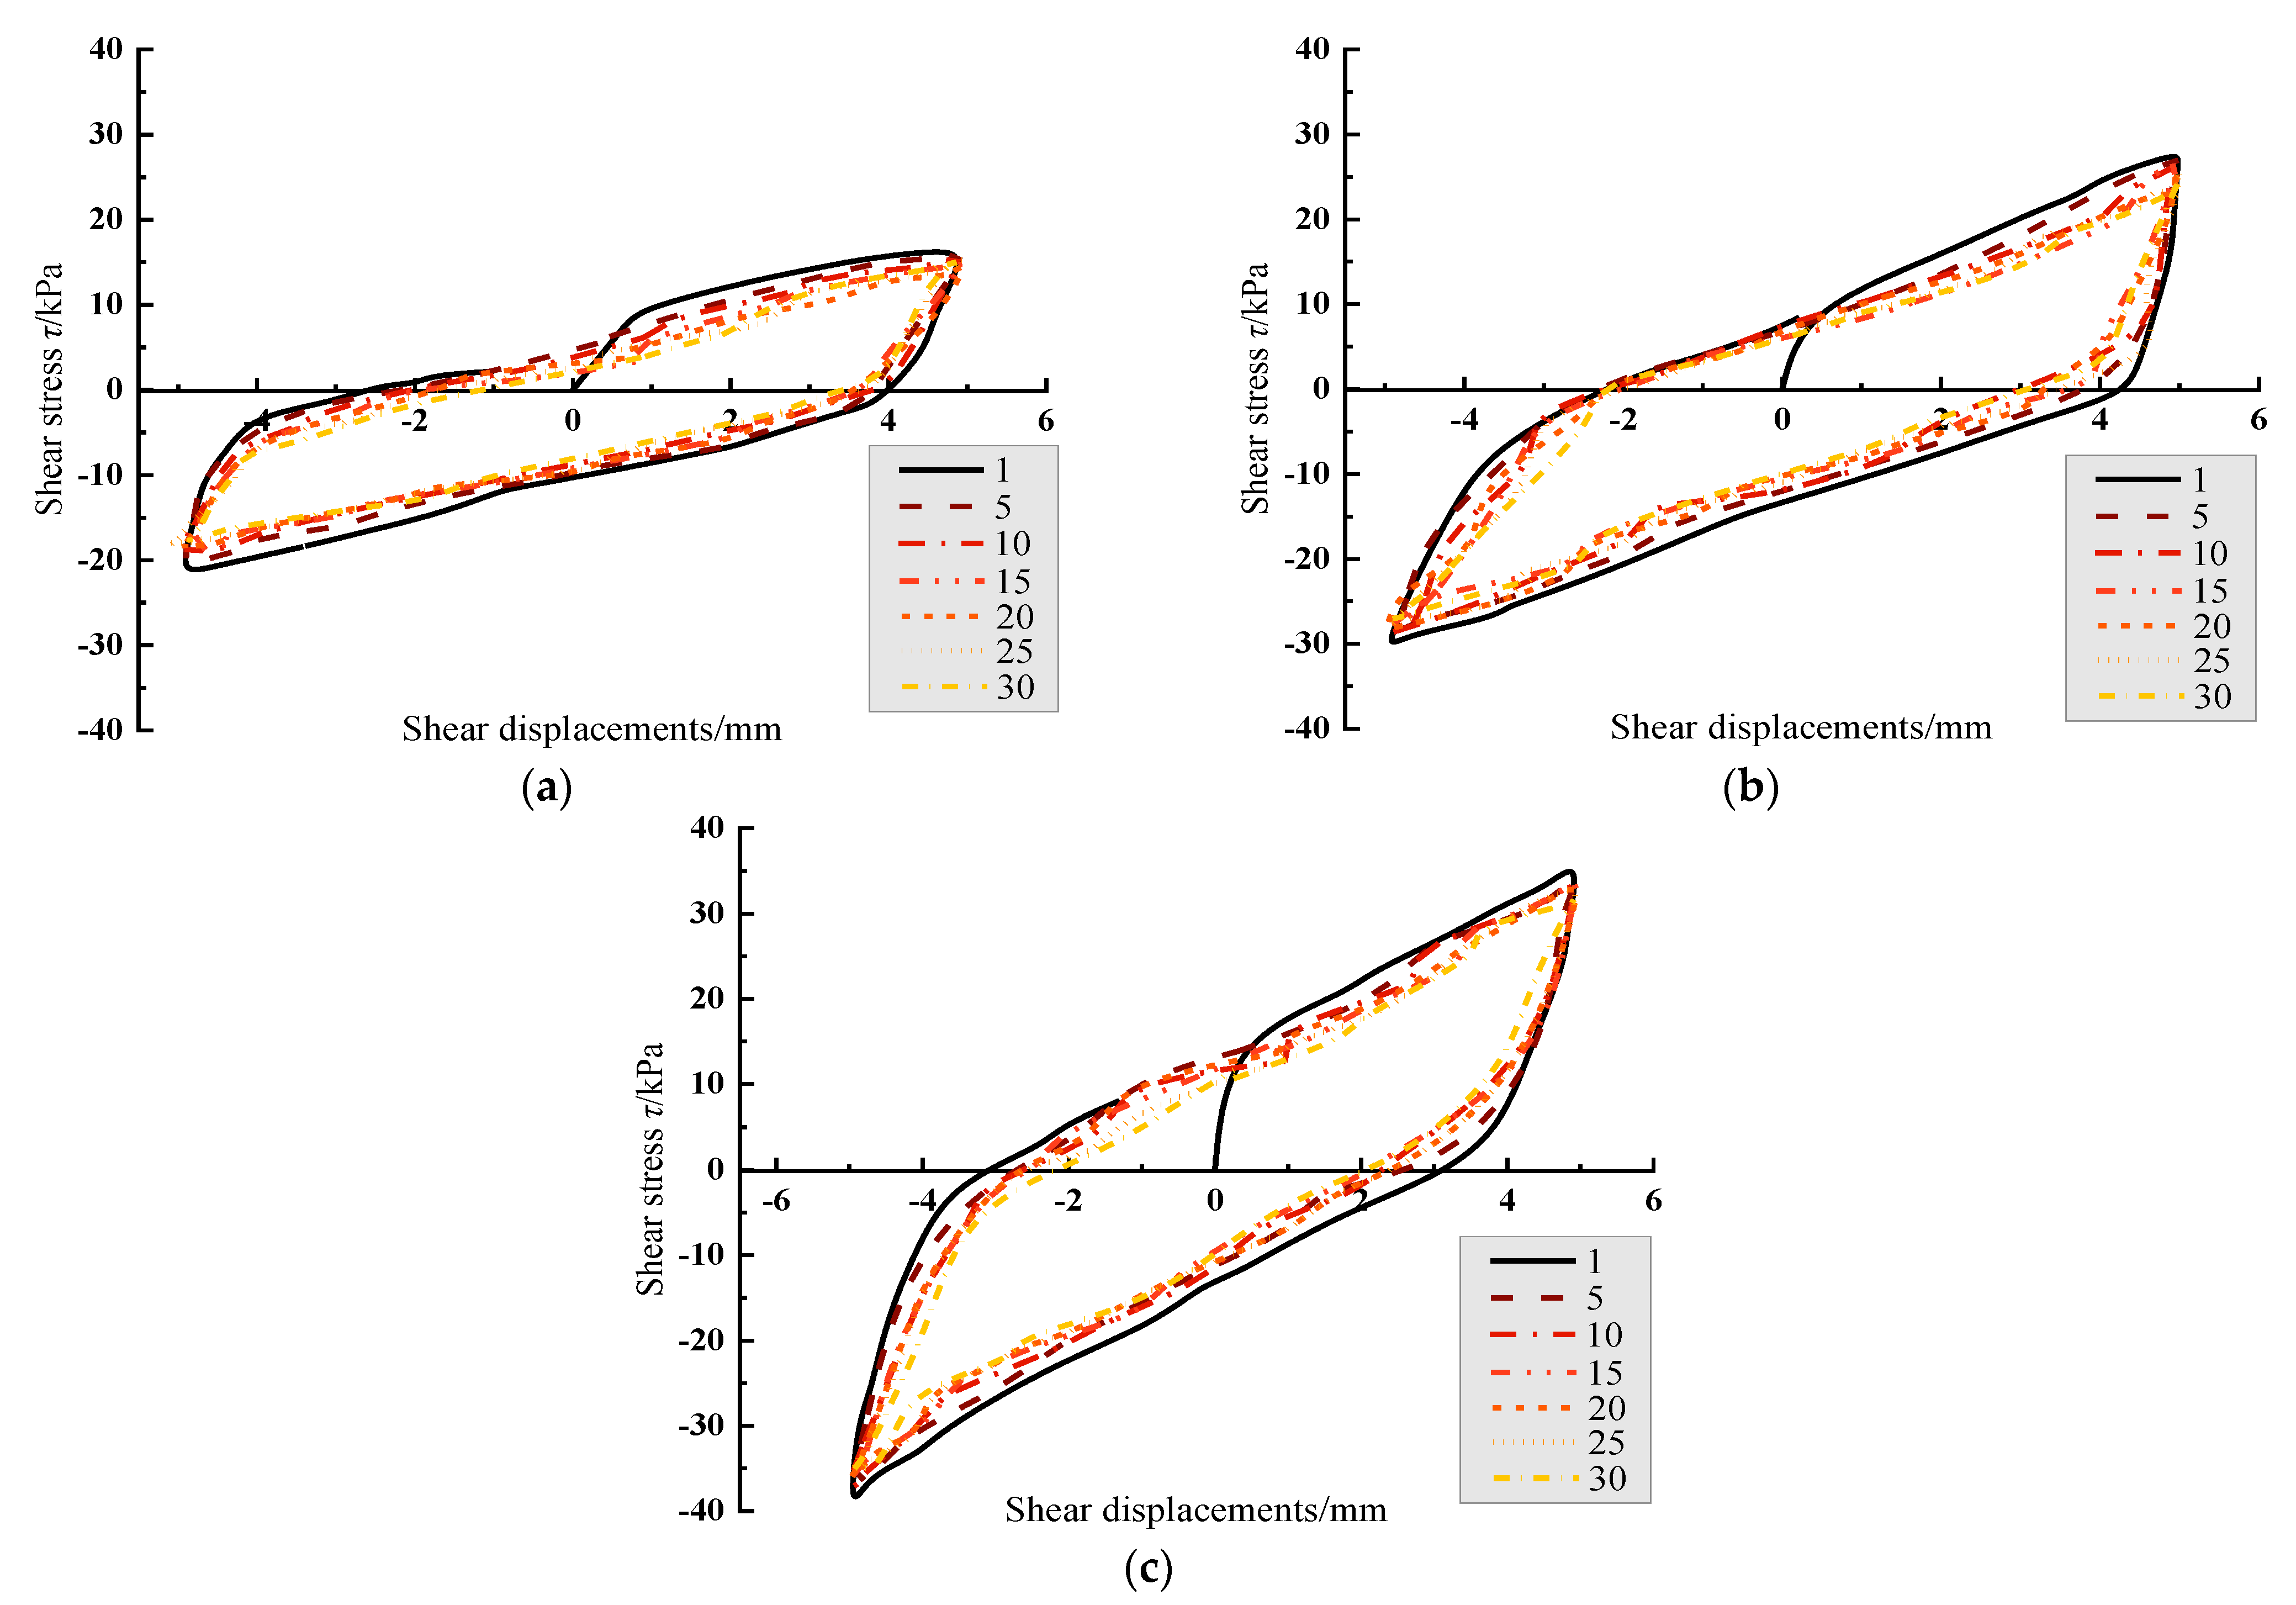
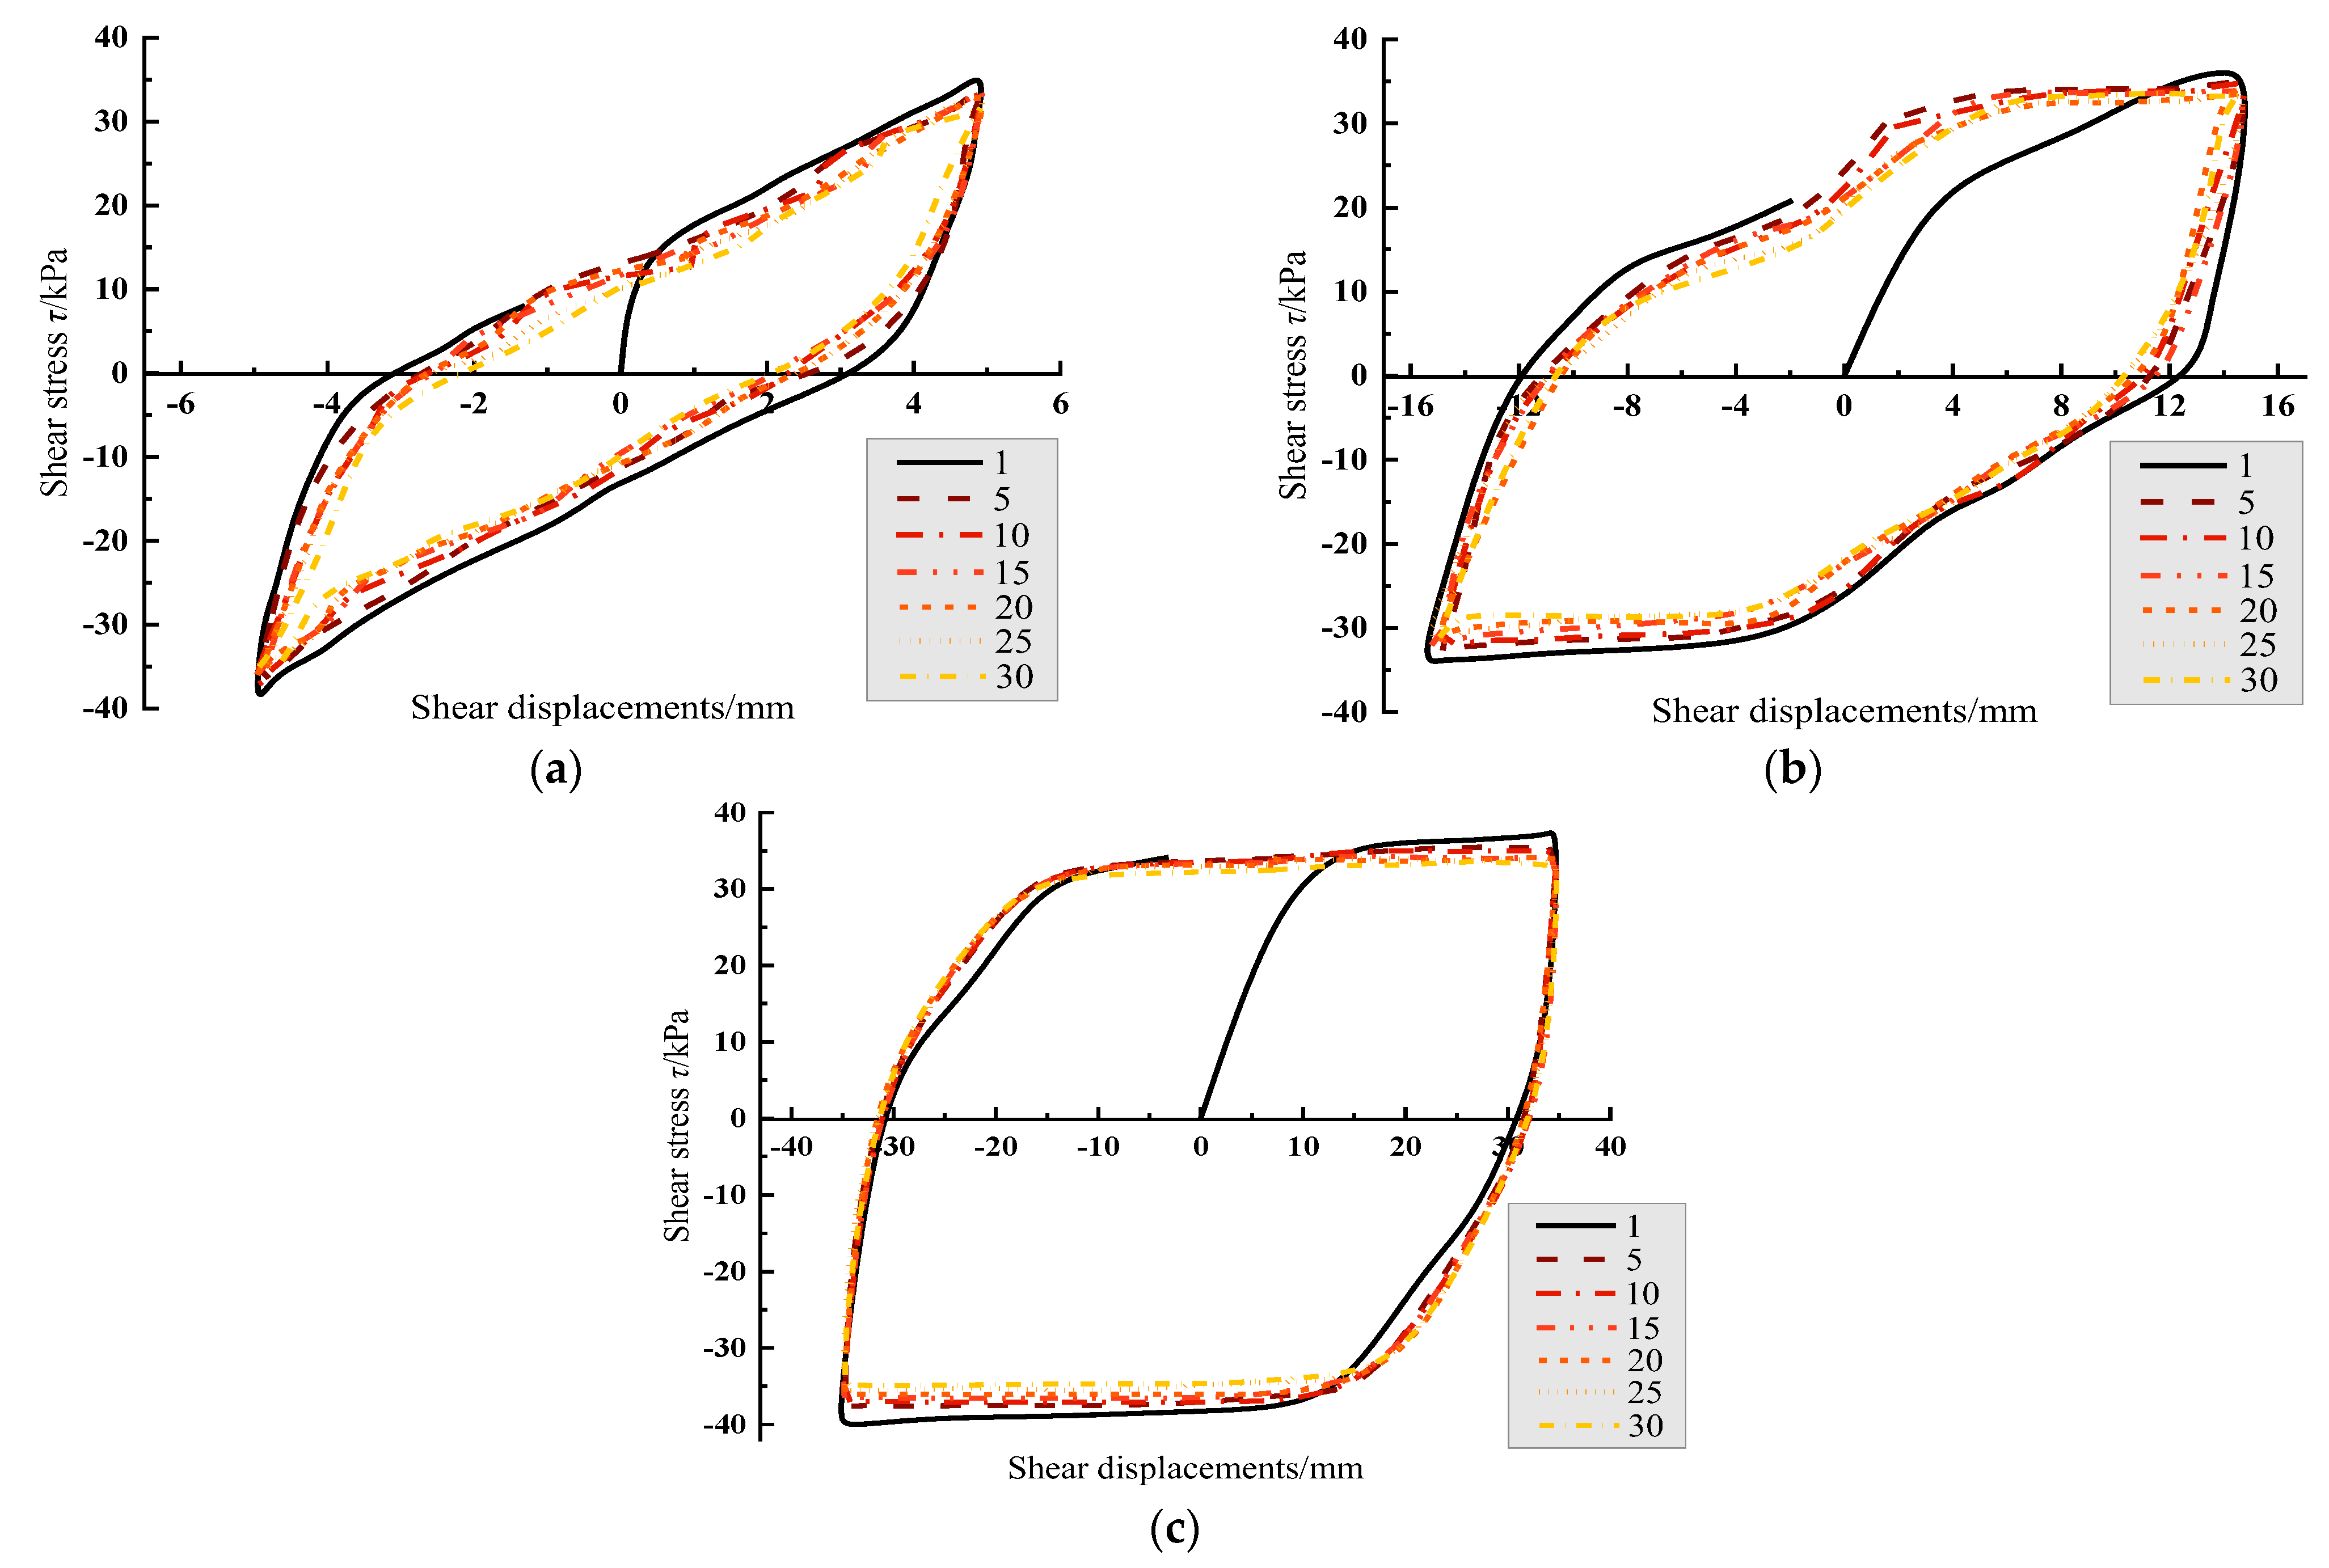
3.1.2. Effect of Shear Amplitude

Figure 6 shows the shear stress-shear displacement curves under different shear amplitudes of 5 mm, 15 mm, and 35 mm with a fixed constant normal stress of 200 kPa, steel plate roughness of 0.05, and water content of 20%. The results showed that:
(1) A change in the shear amplitude could change the shape of the hysteresis curve. With the increase in the shear amplitude, the hysteresis curve gradually developed from “parallelogram” to “shuttle” and “hysteresis cake”;
(2) The slope of the loading section increased with the increase in the shear amplitude, while the slope of the unloading section decreased with the increase in the shear amplitude.

3.1.3. Effect of Roughness

Figure 7 shows the shear stress–shear displacement curve under the conditions of R = 0, 0.025, and 0.05 with a fixed constant normal stress of 200 kPa, shear amplitude of 35 mm, and water content of 20%. Roughness had little effect on the hysteresis curve. The change in the roughness mainly affected the maximum shear stress. Greater roughness resulted in greater maximum shear stress, which was consistent with the conclusion of the direct shear test [22].

3.1.4. Effect of Water Content

Figure 8 shows the shear stress–shear displacement curves with a fixed constant normal stress of 200 kPa, shear amplitude of 35 mm, and steel plate roughness of 0.05 under different water content conditions of 16%, 20%, and 24%. Water content also had little effect on the hysteresis curve. The change in the water content mainly affected the maximum shear stress. Lower water content resulted in greater maximum shear stress, which was consistent with the conclusion of the direct shear test [22].

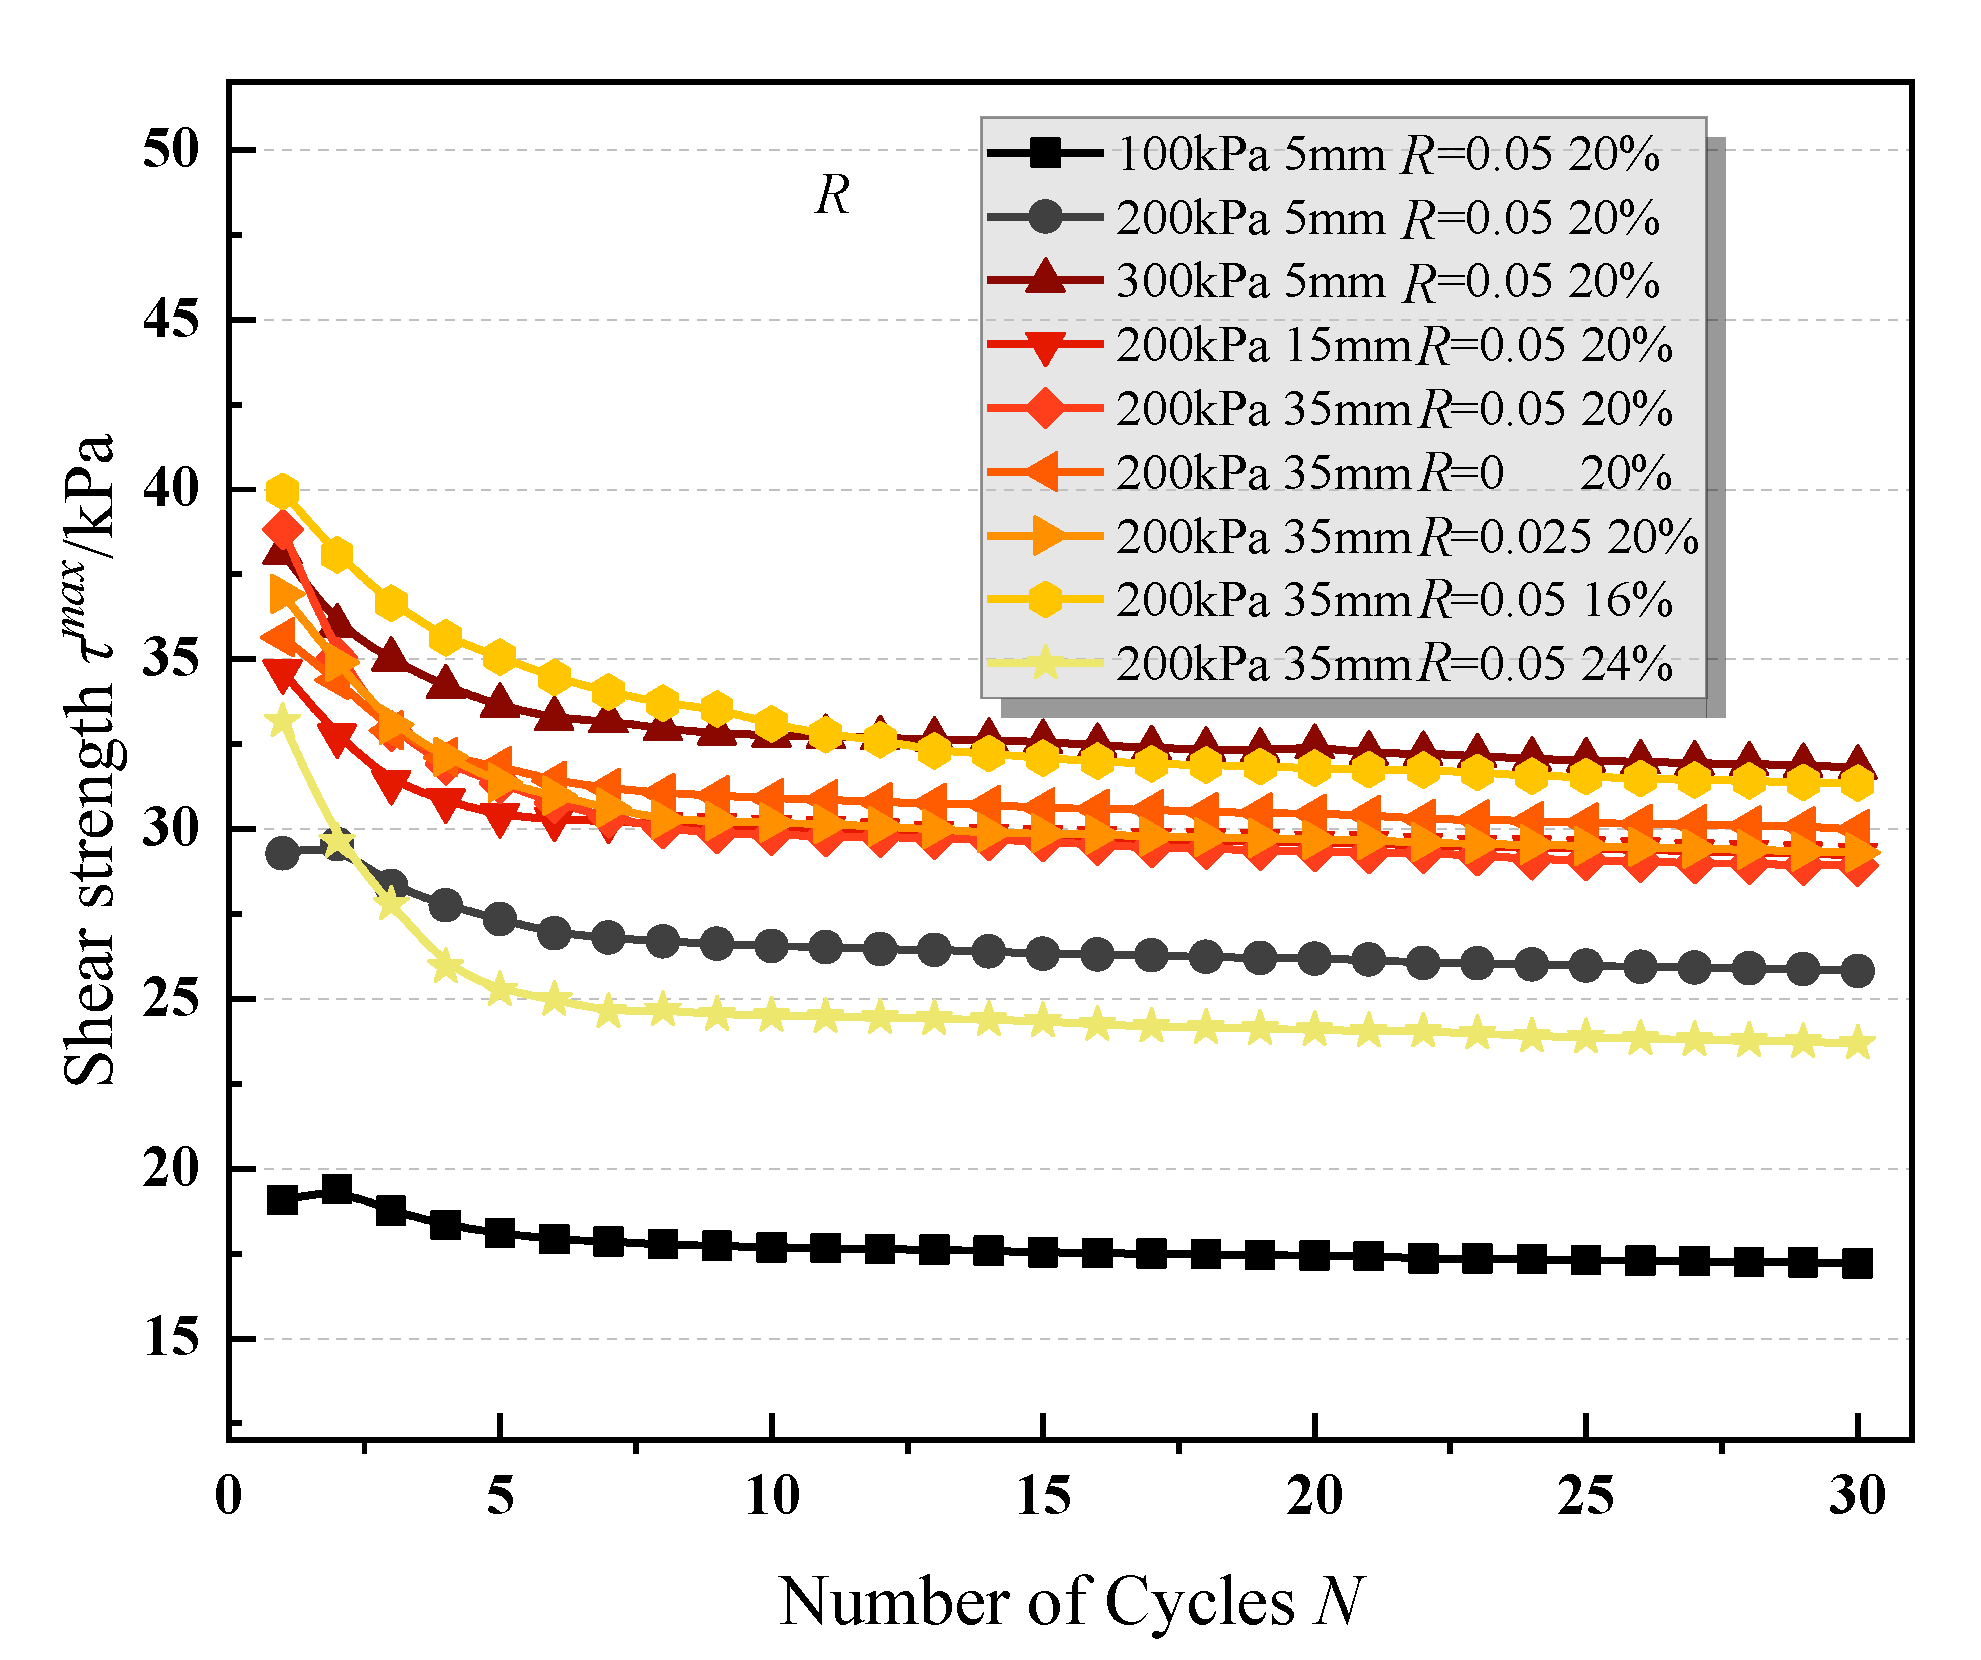
3.1.5. Shear Strength

The concept of peak shear stress τmax was also introduced, and the influence of various factors on the interface shear strength was calculated. The peak shear stress is calculated as follows:
τ m a x = τ 1 + | τ 2 | 2
where τ1 is the maximum shear stress in the positive direction of a cycle and τ2 is the maximum shear stress in the negative direction of a cycle.
The peak shear stress of the first cycle was defined as the shear strength, and the peak shear stress of the last cycle was defined as the residual shear strength, as shown in Figure 9. The results were as follows:
  • With the increase in the cyclic shear, the interface tended to weaken. The shear strength and residual shear strength increased with the increase in the shear amplitude.
  • With the increase in the normal stress and roughness and the decrease in the water content, the interfacial shear strength and residual shear strength increased. The results were consistent with the direct shear test results for the silt–steel interface [22].

3.2. Body Change Law

In this experiment, the area of the contact surface remained unchanged during the shearing process. Therefore, the change in the normal displacement of the contact surface reflected the volume change law for the soil during the shearing process.

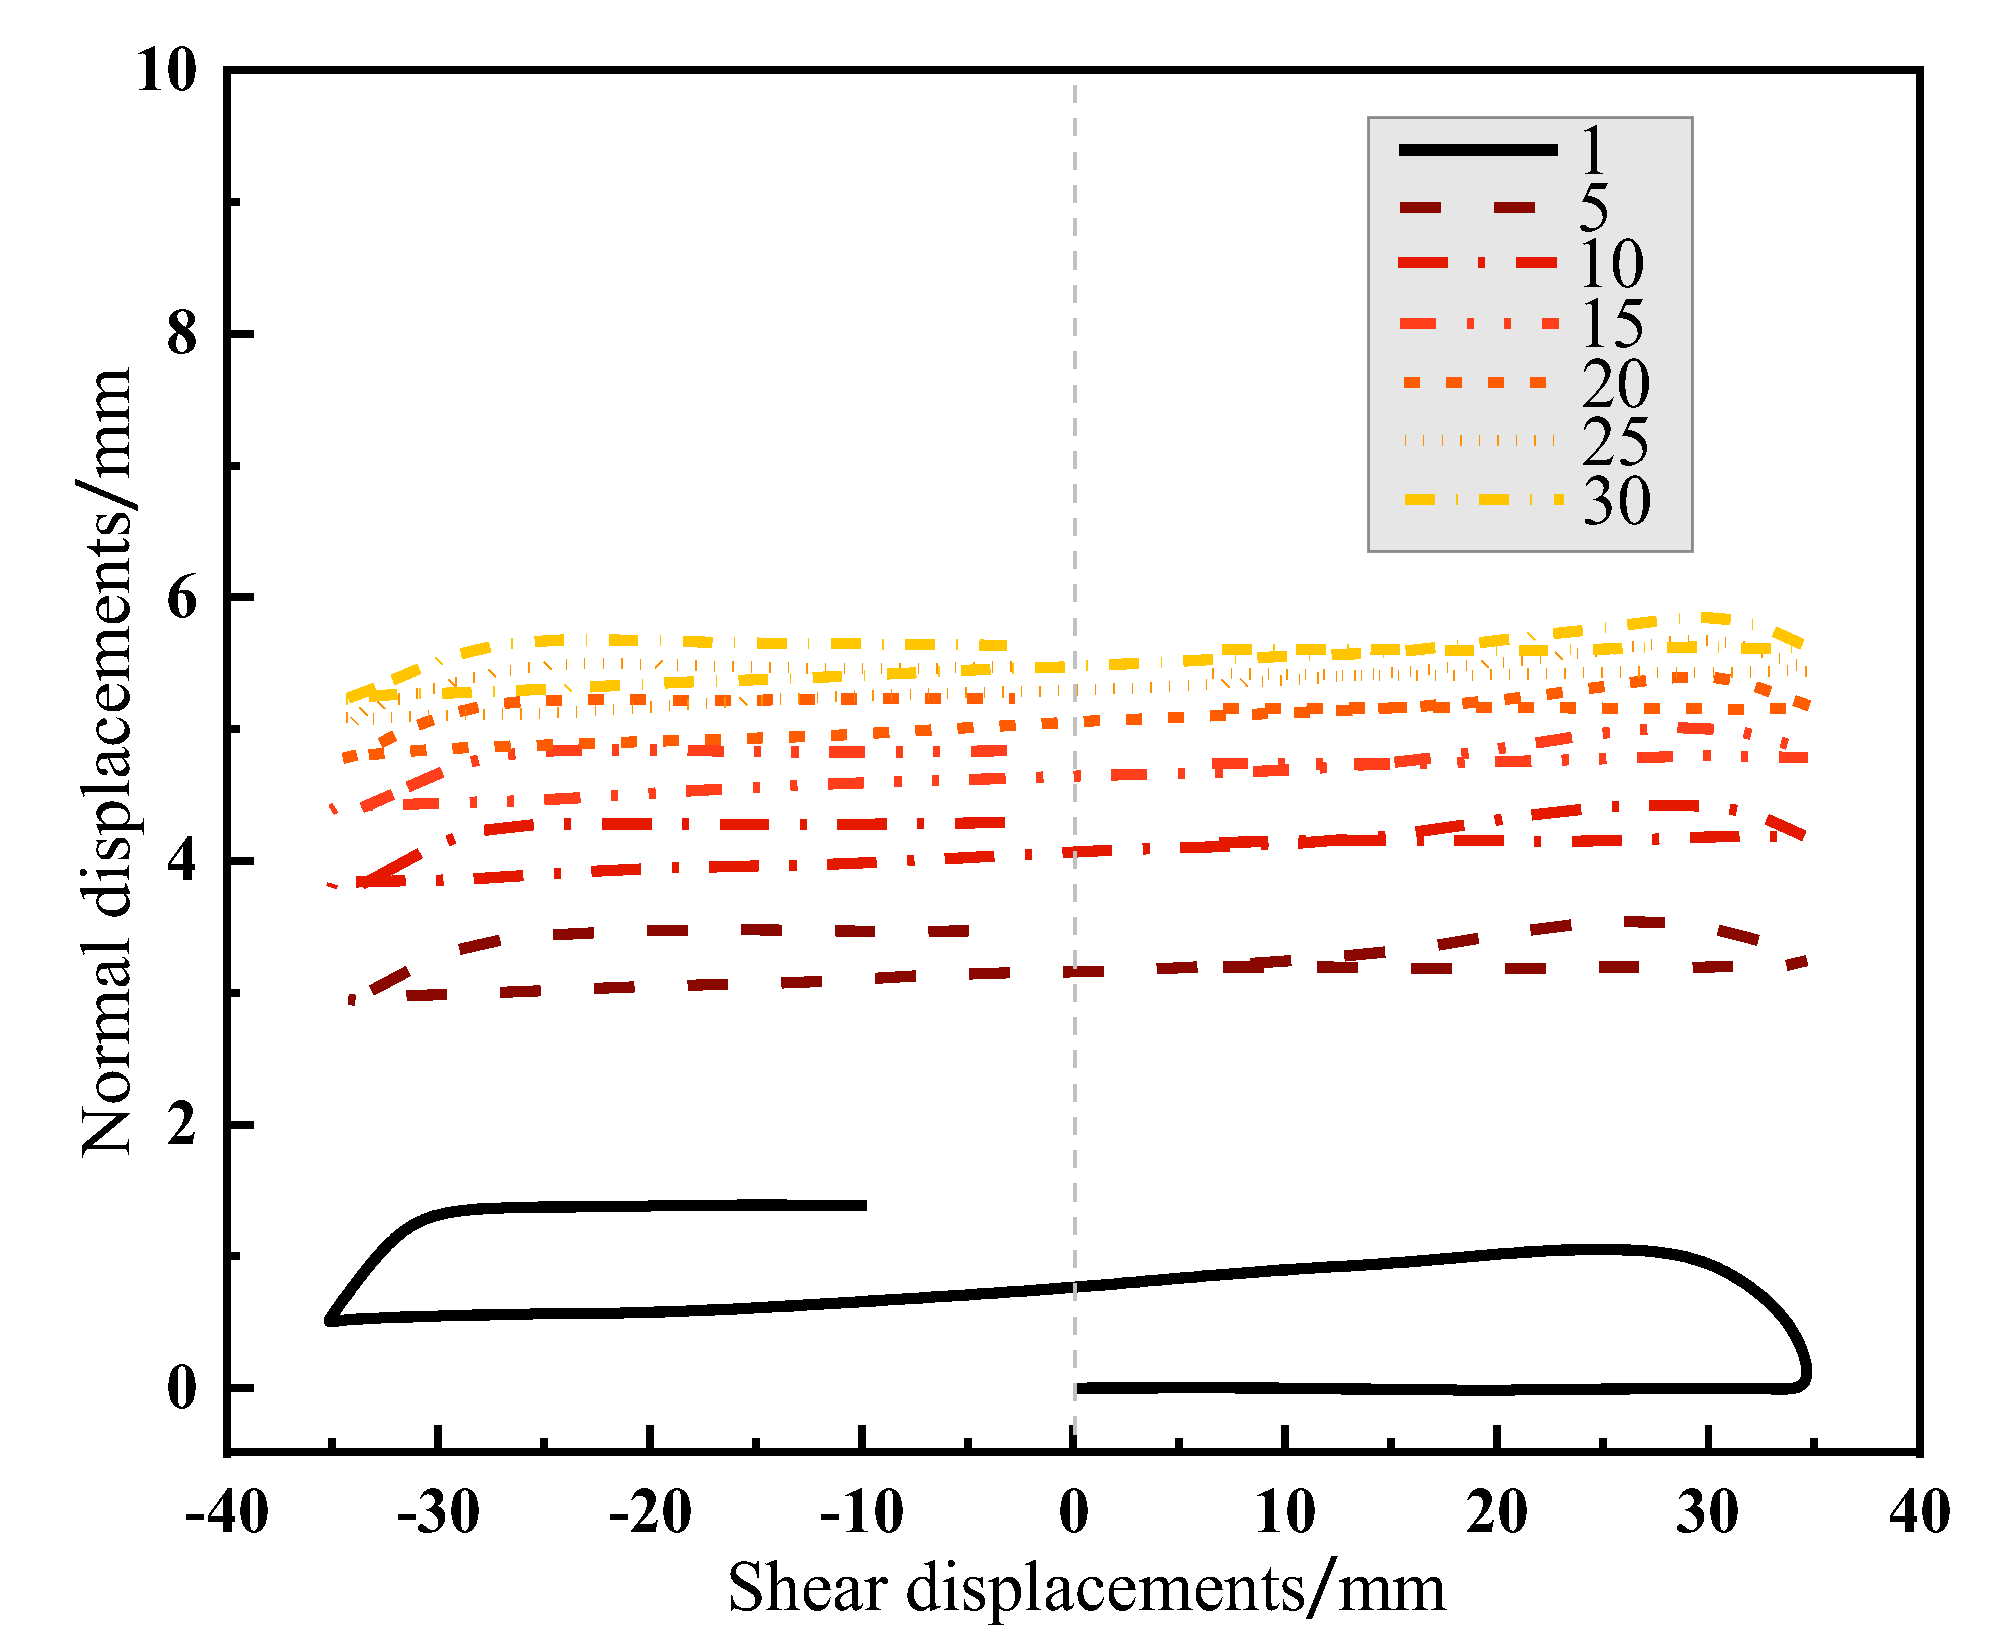
3.2.1. Typical Curve for Normal Displacement–Shear Displacement

As the volume change laws obtained from each group of tests were approximately similar, the test data curve with the constant normal stress of 200 kPa, shear amplitude of 35 mm, steel plate roughness of 0.05, and water content of 20% was selected as the typical characteristic curve to analyze the influence of cycle times on the volume change laws. The defined shrinkage was positive, the shrinkage of each circle was defined as the shrinkage value at the end of the circle, and the final shrinkage value was defined as the shrinkage value at the end of the last circle. The normal displacement–shear displacement curve in Figure 10 shows that:
  • In the process of cyclic shear, the silt–steel interface generally presented shear shrinkage, and the shear shrinkage in the first five cycles was the largest. With the progress of the cyclic shear, the shear shrinkage increment presented a decreasing trend, but the overall shear shrinkage showed an increasing trend. This phenomenon can be explained according to the test conclusions drawn by Wang et al. [21] and Yu et al. [22]. In the process of loading and compaction, the soil body undertakes part of the compaction work. During the shearing, due to the displacement of soil particles, the accumulated cohesive potential energy and friction potential energy from compaction are released, resulting in an upward force. When the normal stress is high, the pressure difference between the upward force and the normal stress is negative and the soil particle gap is compressed, and the interface thereby shows shear shrinkage;
  • In the same cycle, shear shrinkage and shear expansion occurred alternately. The shear shrinkage occurred in the loading stage, and shear expansion occurred in the unloading stage. The results show that the shear direction affected the development of the normal displacement, leading to an asymmetry in the volume change law. This phenomenon corresponds to the above conclusion on the anisotropy of shear stress. The reasons for the phenomenon are as follows. In the case of positive shear, the soil particles develop from the initial disordered arrangement to the directional arrangement, and the interface produces an apparent shear directional effect. The particle breakage and the space compression between soil particles produce shear shrinkage. In reverse shear, the stress direction of soil particles near the shear surface changes. On the one hand, the soil particles are gradually evacuated from the compaction state until they make contact again and become stable, showing shear expansion. On the other hand, the directional deformation generated during the positive shear impedes the deformation of the soil in the opposite direction, resulting in the shear expansion being less than the shear shrinkage, and a certain amount of residual deformation (shear shrinkage) occurs at the end of each cycle. When the shear direction changes, the soil particle movement is most active, resulting in apparent volume change and leading to the directivity in the macroscopic volume variation;
  • Based on the comprehensive analysis of the causes of the above phenomena, the overall shear deformation in a complete shear cycle can be divided into reversible shear deformation and irreversible shear deformation. Irreversible deformation is mainly caused by stable normal stress and soil particle crushing, while reversible deformation is mainly caused by changes in the shear direction. At the initial stage of cyclic shear, the soil particles are angular and disorderedly arranged, and the irreversible body becomes dominant. However, as the shear continues, the soil particles at the shear interface slowly reach a stable state, and the amount of soil particle breakage decreases. At this time, the reversible shear deformation formed by the change in the shear direction plays a major role. Therefore, the macroscopic performance is defined by the fact that, with the increase in shear times, the volume deformation curves gradually recombine, which indicates that, during the shear test, the irreversible shear deformation of the sample becomes small, while the reversible shear deformation always exists. Zhao et al. (2019) [23] has reported that this deformation characteristic is related to the shear band.

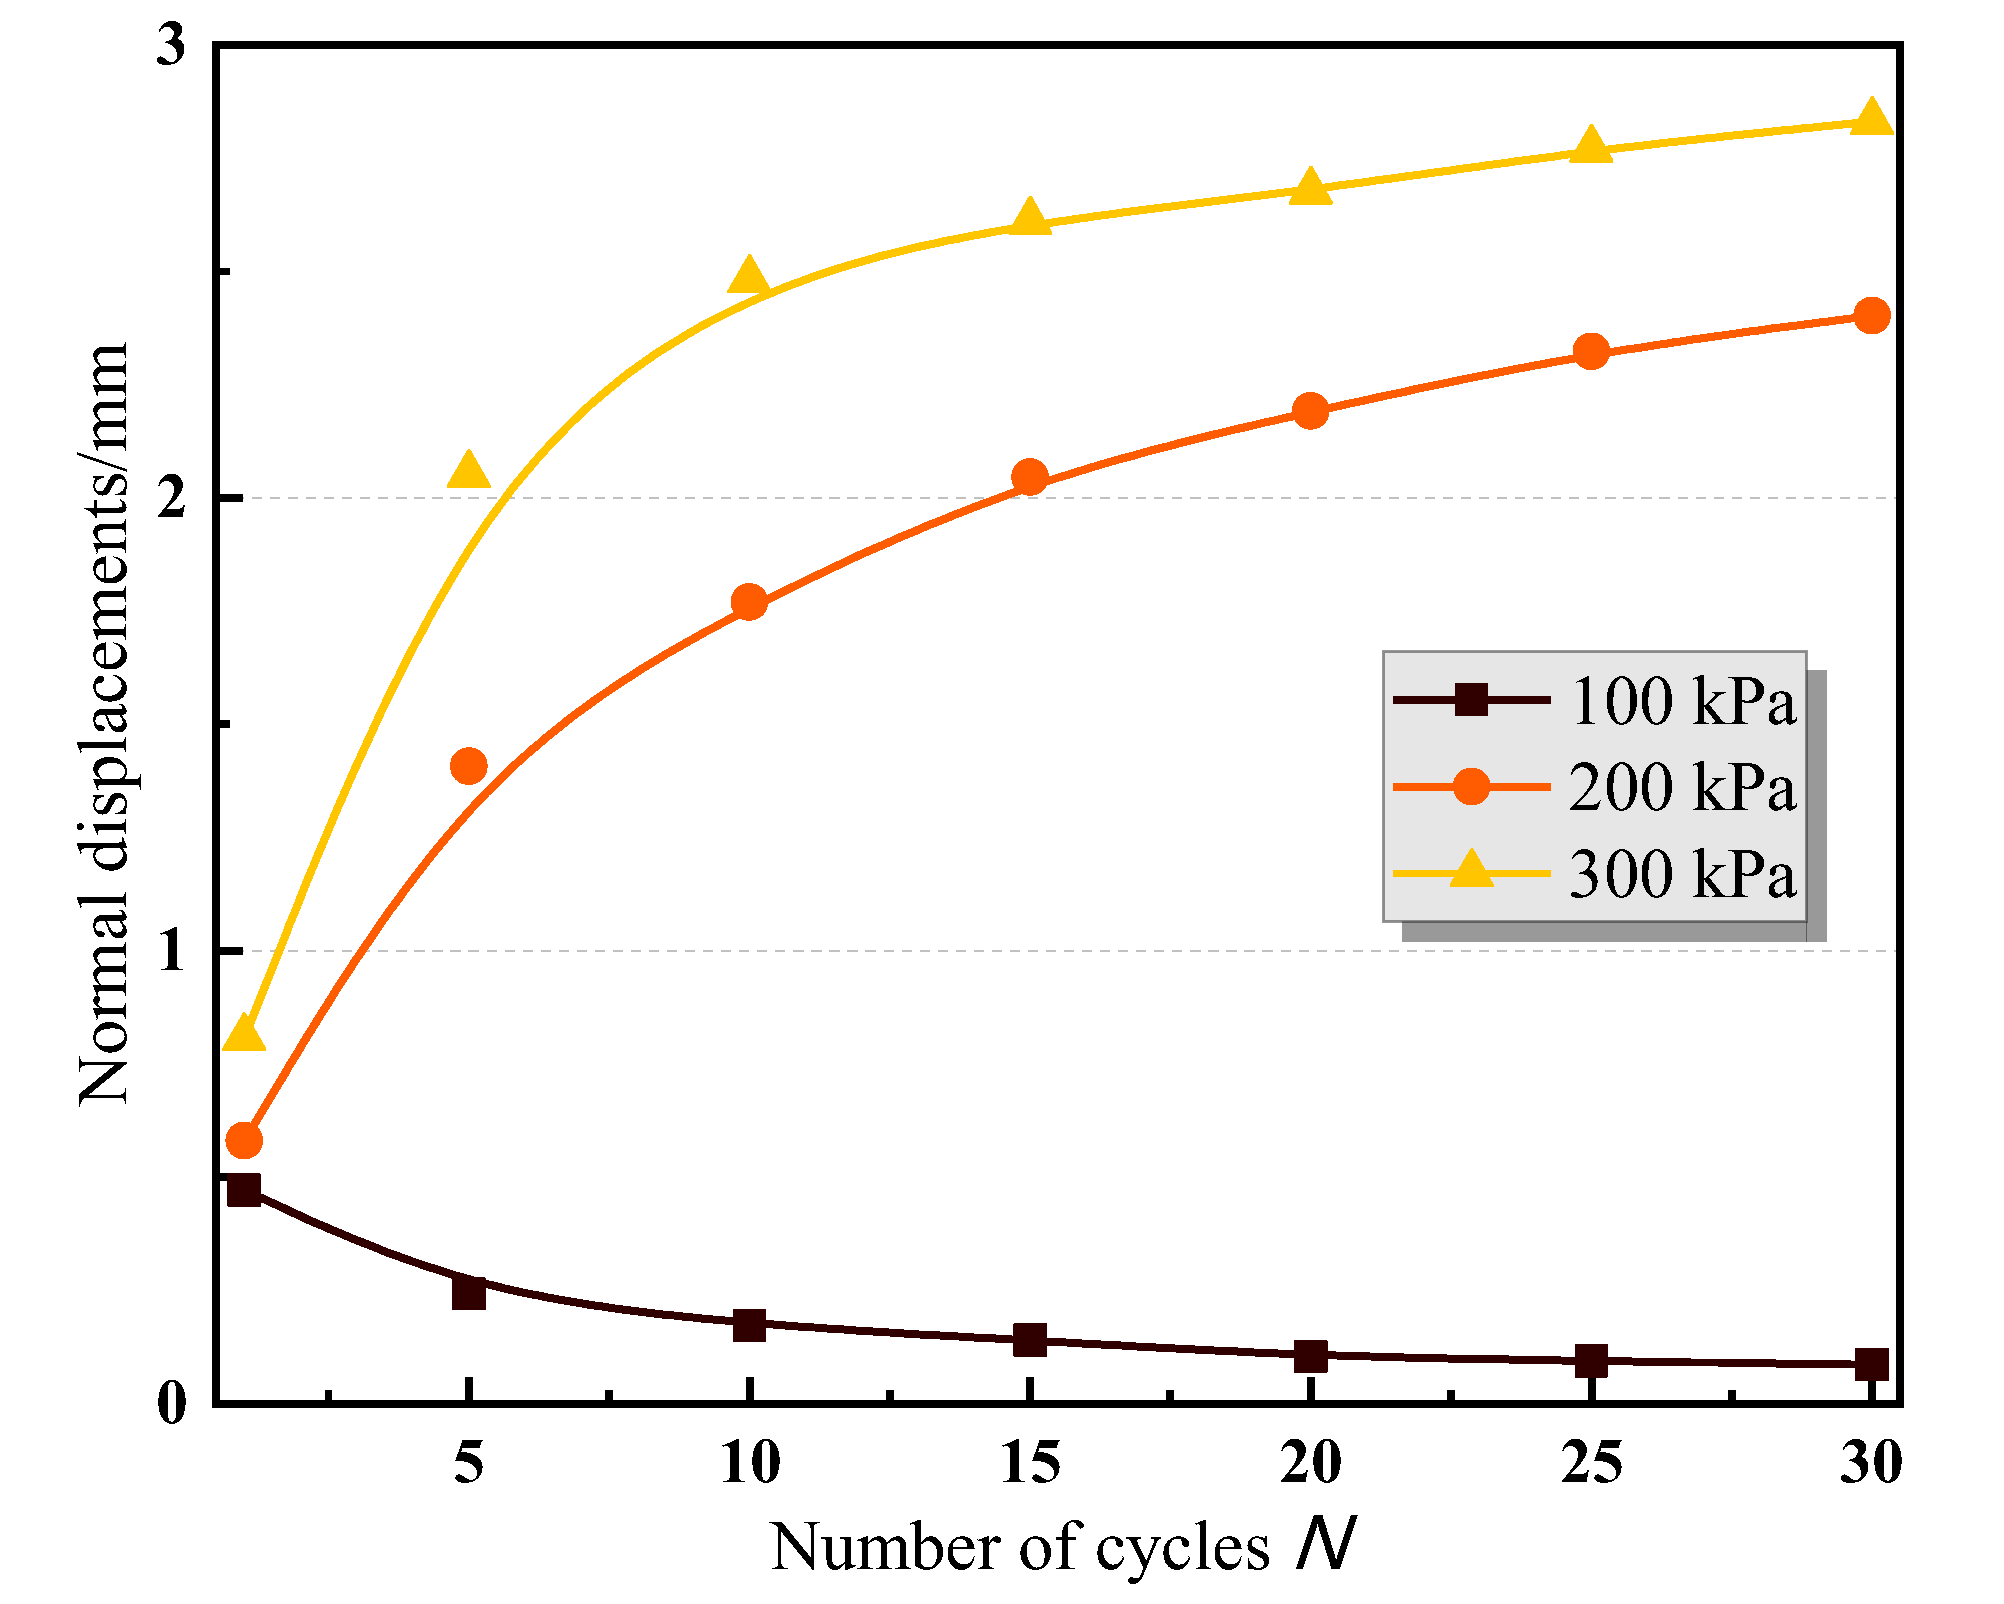
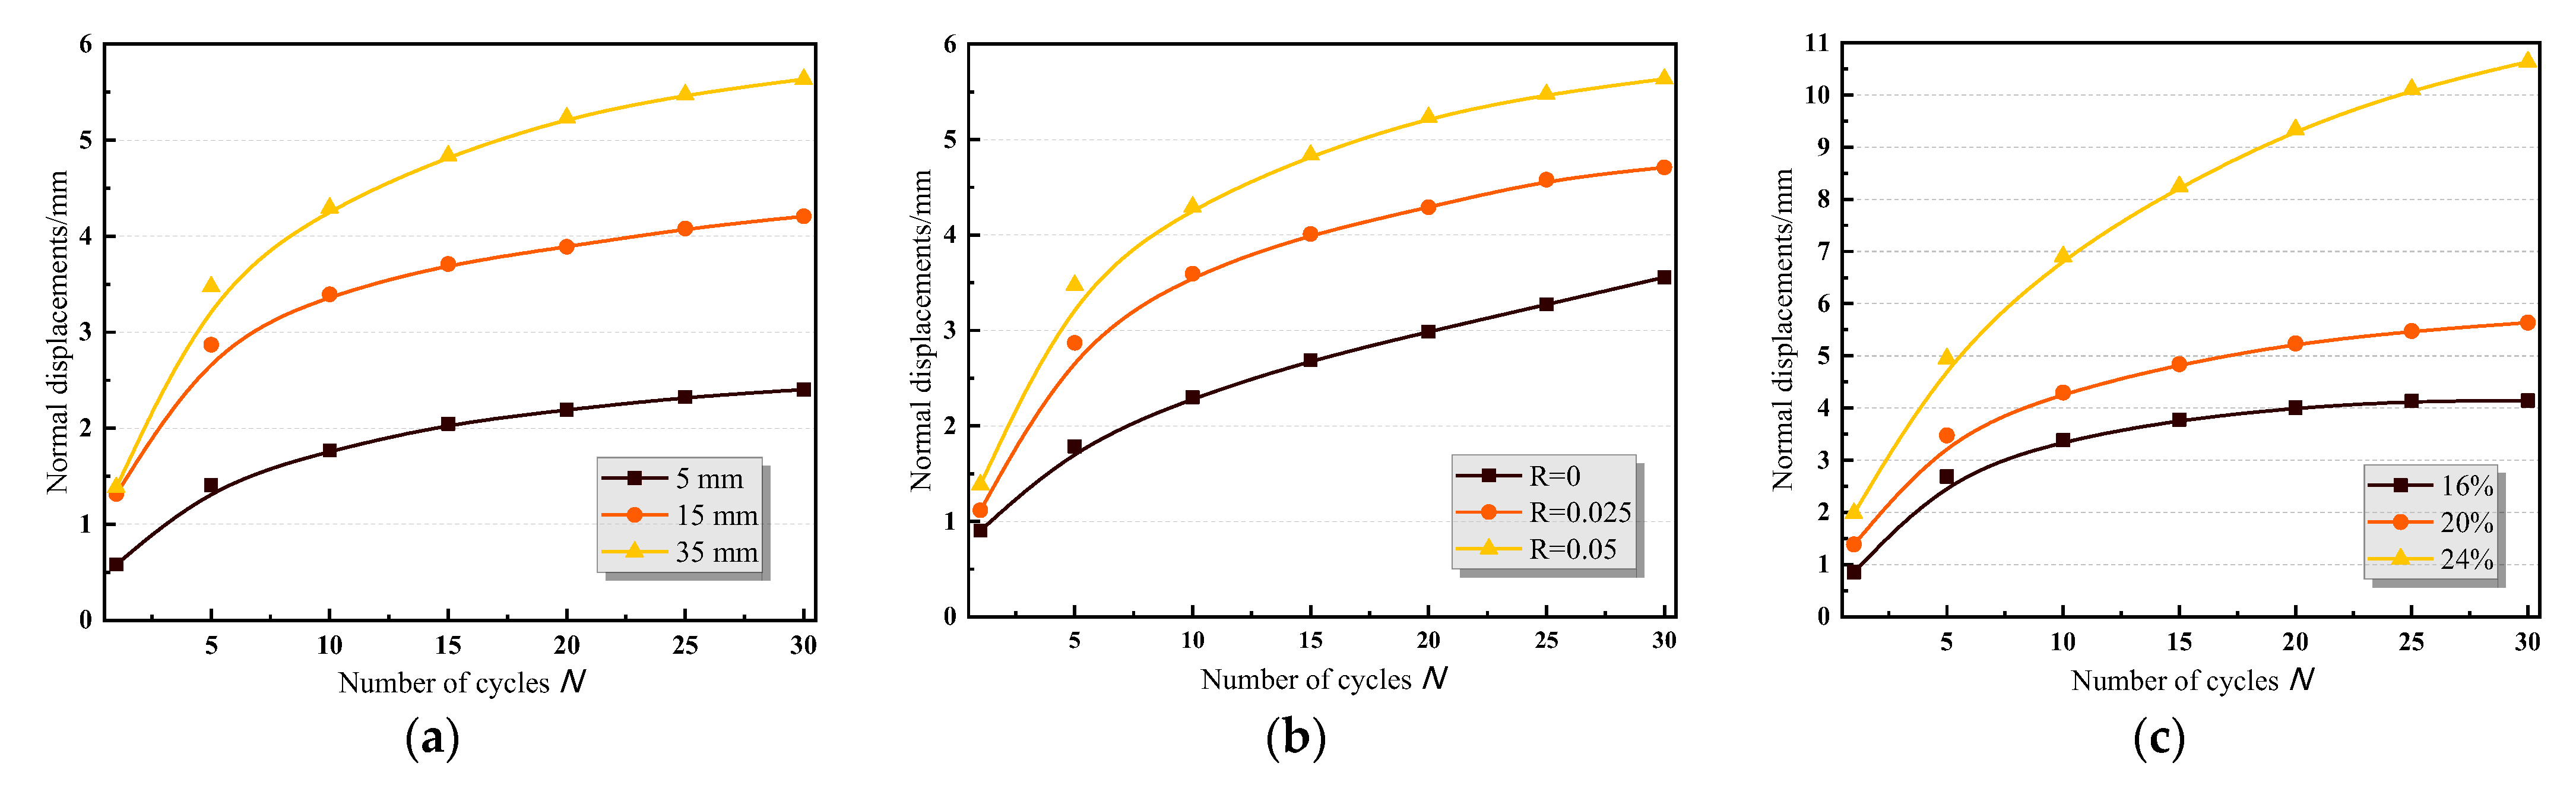
3.2.2. Effect of Normal Stress

In order to more clearly explore the influence of different factors on the volume change, the number of test cycles in each group was selected as N = 1, 5, 10, 15, 20, 25, and 30; the volume variable at the end of each cycle was taken as the volume variable of the cycle; and the curve for the number of normal displacement cycles was drawn.
Figure 11 shows the change curve for the interface body under three different constant normal stress conditions with a fixed shear amplitude of 5 mm, steel plate roughness of 0.05, and water content of 20%. The results were as follows:
  • Under different normal stress conditions, the initial (N = 1) cyclic interface showed shear shrinkage. A larger normal stress means larger initial shear shrinkage;
  • Under the action of low normal stress (100 kPa), the shear shrinkage gradually decreased with the increase in the number of cycles, showing a certain shear expansion trend. Under the action of medium-high normal stress (200 kPa and 300 kPa), with the increase in the normal stress, the effect of the steel plate’s constraint on the soil particles on the interface increased, the rate of the increase in the deformation displacement with the number of cycles grew, and the amplitude increased. The results suggest that greater normal stress indicates greater final shear shrinkage, which is consistent with the volume change rule from the direct shear test [22]. The reason for the result was that the cohesive potential energy and friction potential energy between soil particles were fully released under low normal stress and showed dilatancy characteristics. Dejong et al. (2009) [24] also reported that the increase of normal stress inhibited the shear expansion behavior;
  • The volume variable in the first few shear cycles (N < 5) accounted for more than 70% of the total variation. As the shear cycle continued, the arrangement of soil particles at the interface and the volume change were also stable.

3.2.3. Effect of Other Factors

Figure 12 shows the development curve for the normal displacement of the interface with the number of cyclic shear cycles under different conditions involving other factors (shear amplitude, roughness, and water content) when the fixed normal stress was 200 kPa. The volume deformation law was consistent with the law determining the influence of the various factors on shear strength, indicating that, with the increase in the shear amplitude, the roughness, water content, and volume deformation speed and increment increased. Under the condition of high water content (24%), the increase in shear shrinkage was far greater than that under the condition of 16–20% water content, which may have been because some water was squeezed out of the soil sample with high water content in the process of cyclic shear under nearly saturated conditions.

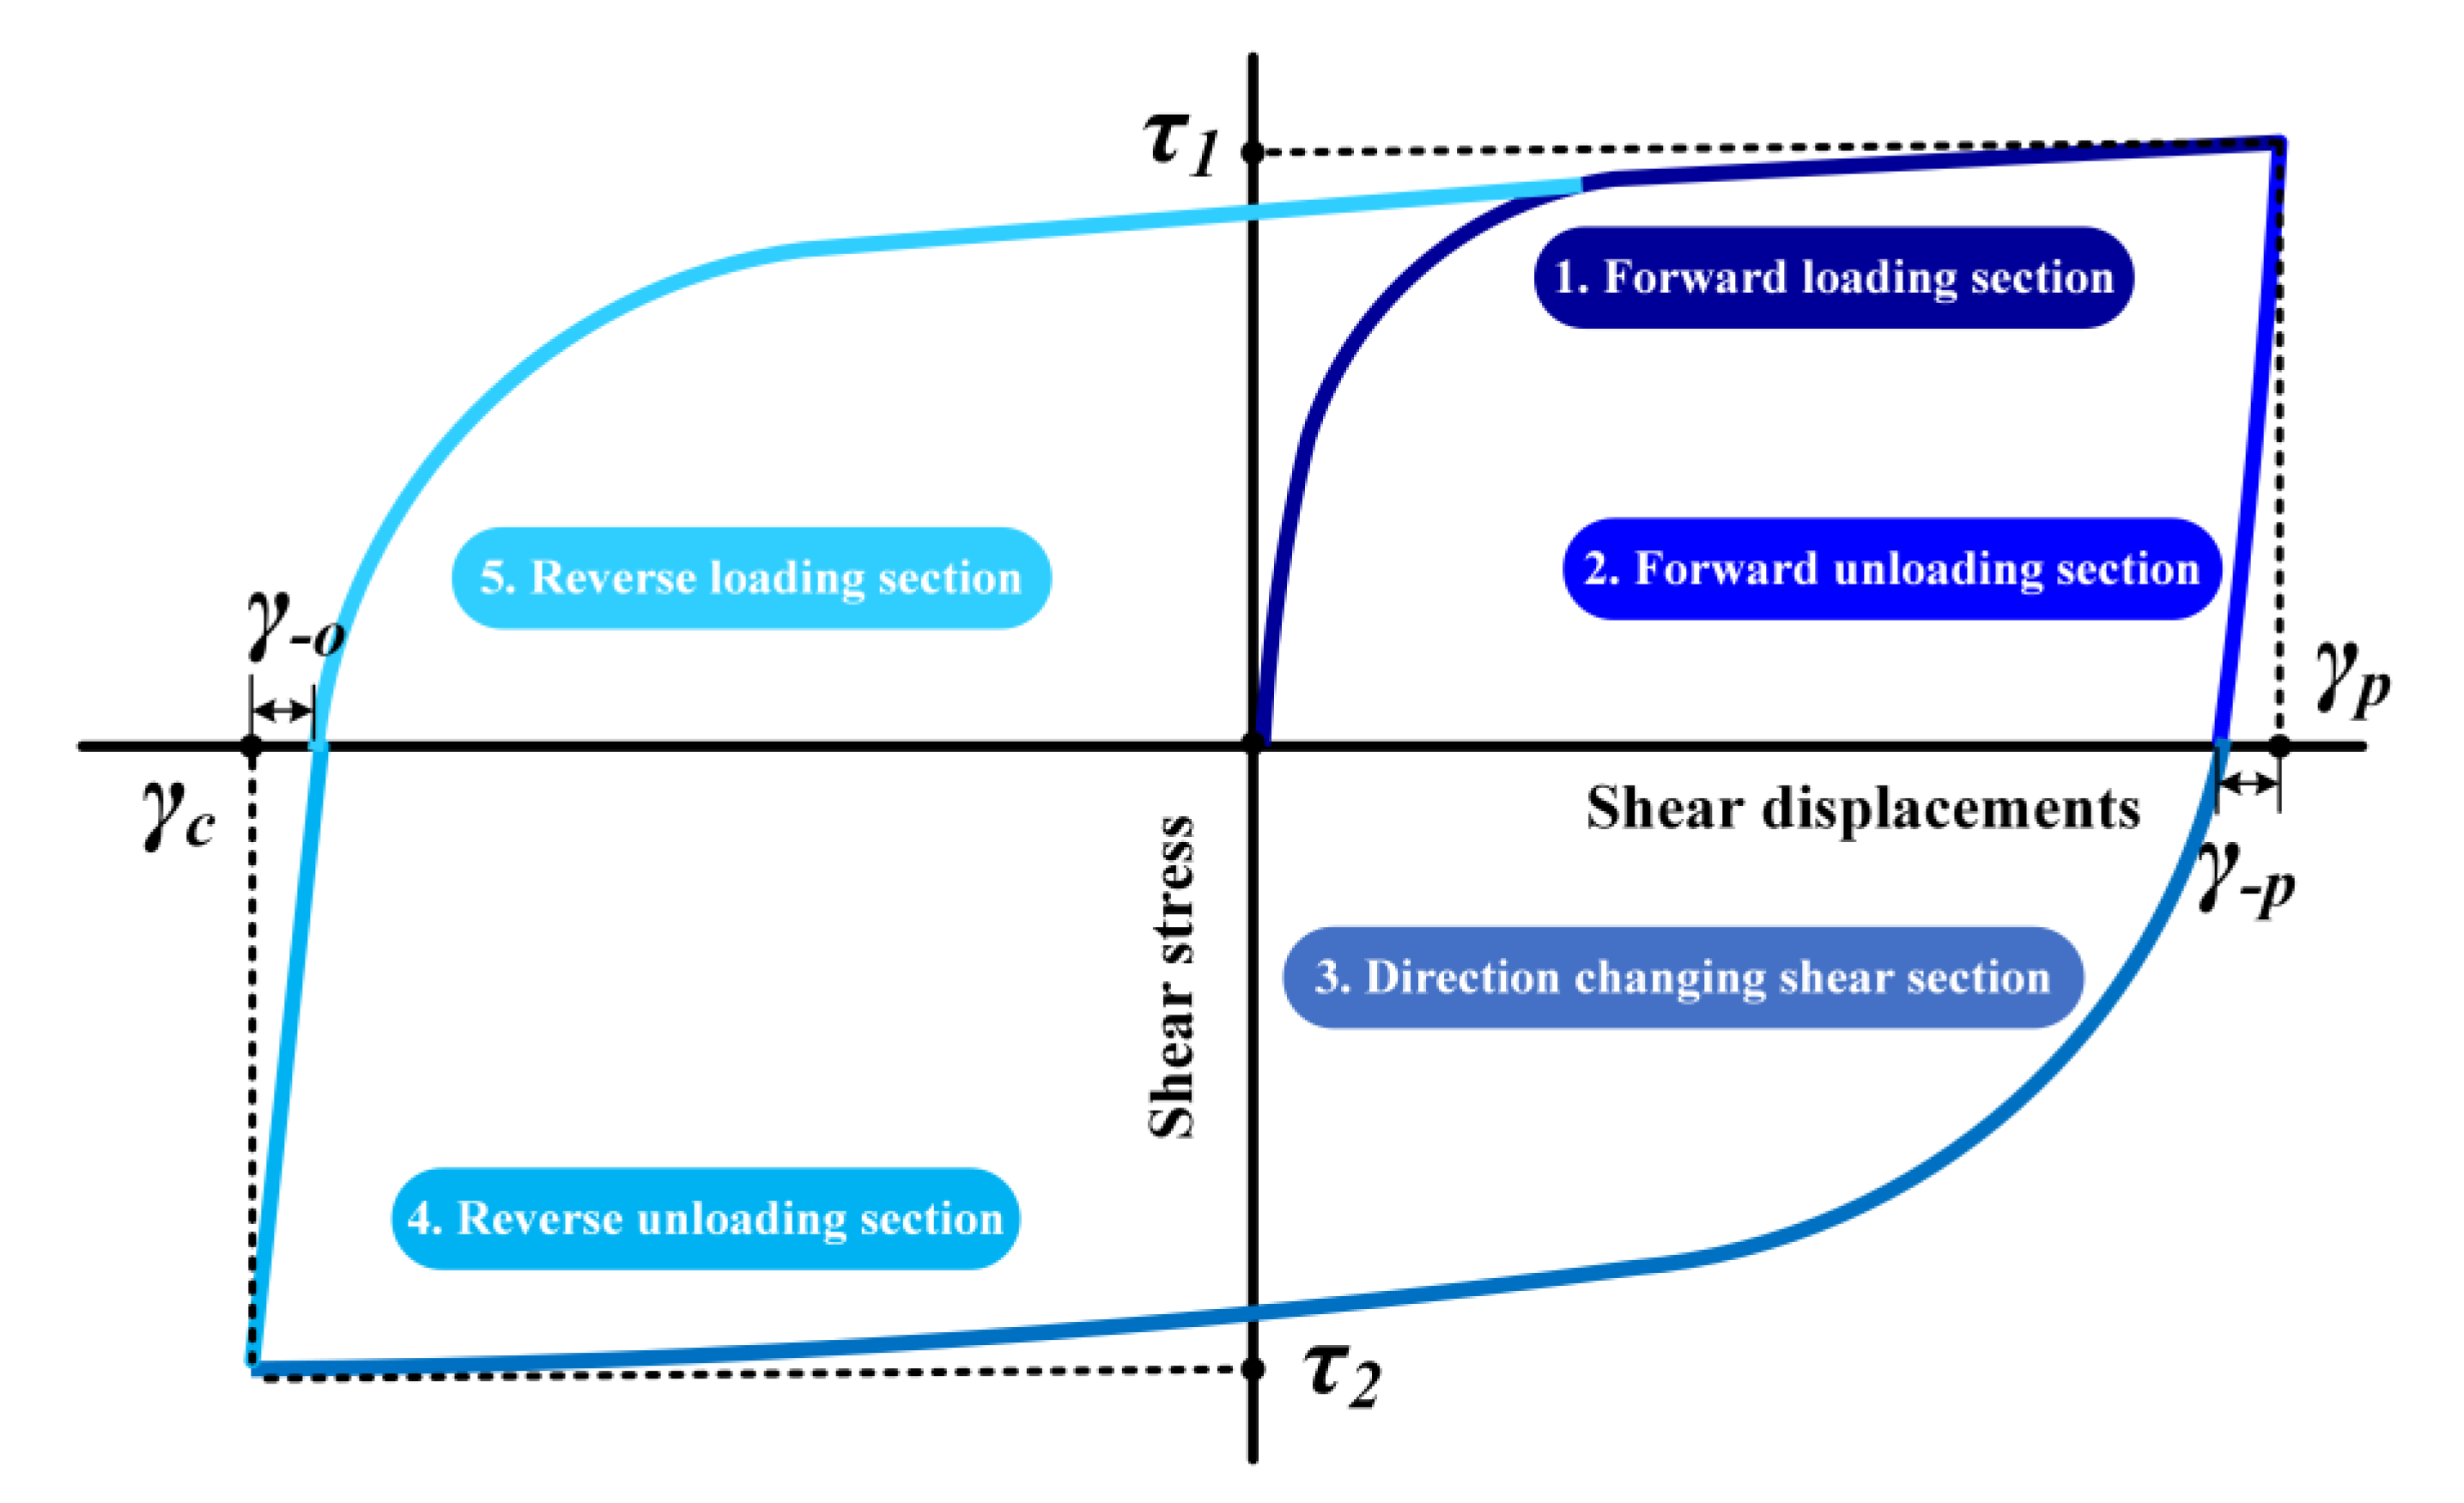
3.3. Stress–Displacement Mathematical Model for Cyclic Shear Silt–Steel interface

3.3.1. Model Derivation

The cyclic test results show that the stress–displacement curve for the silt–steel interface in the Yellow River delta basically presented a “hysteresis loop” shape. Except for the shear amplitude, its different influencing factors, such as normal stress, roughness, water content, and the number of cycles, only affected the extreme values and curve ranges and had little impact on the overall shape of the curve. In order to describe the cyclic shear stress–displacement relationship applicable to the silt–steel interface in the Yellow River delta reasonably and accurately, the stress–displacement curve can be divided into five stages: (1) forward loading section; (2) forward unloading section; (3) direction-changing shear section; (4) reverse unloading section; (5) reverse loading section. A complete set of cyclic shear stress–displacement mathematical models was constructed by describing the curve characteristics of each stage. The phase division diagram is shown in Figure 13.
Figure 13 shows that the shear stress–shear displacement relationship curves of the positive loading section, variable shear section, and reverse loading section were close to the hyperbola. Lu (2015) [25] proved through tests that the hyperbola model for the cyclic shear test is also applicable to the situation under cyclic stress if it is modified based on the Clough classical hyperbola model. Its simplified form is:
τ = γ a + b γ
where a and b are test parameters; 1/a is the initial shear stiffness coefficient ksi of the contact surface, which can be determined from the initial slope of the shear stress–shear displacement curve; and 1/b is the ultimate shear stress τu of the contact surface, which can be determined from the asymptote of the shear stress–shear displacement curve. Referring to the hyperbola correction model published by He et al. (2019) [26], the basic form can finally be obtained:
τ = γ 1 k s i + R f τ m a x γ
Considering the cohesive force of the silty seabed soil in the Yellow River delta, the shear strength conforms to Mohr Coulomb’s law.
According to Figure 12 and Equation (4), the forward loading section can be expressed as follows:
τ p = γ 1 k s i p + R f p τ max p γ     γ γ p
The direction-changing shear section can be expressed as follows:
τ c = γ ( γ p γ p ) 1 k s i c + R f c τ max c ( γ + ( γ p γ p ) )     γ c < γ γ p γ p
The reverse loading section can be expressed as follows:
τ o = γ ( γ c + γ o ) 1 k s i o + R f o τ max o ( γ ( γ c + γ o ) )     γ c + γ o < γ
The parameters in the equation were uniformly characterized. The results are shown in Figure 13. γp and γc are the displacements at the end of the forward loading and direction-changing shear section, respectively; γ-p and γ-o are the displacements required for the forward unloading section and reverse unloading section, respectively; Ksi (p, c, o) indicates the initial shear stiffness values for the forward loading section, direction-changing shear section, and reverse loading section, respectively; and τmax (p, c, o) and Rƒ (p, c, o) are the shear strength and failure ratio corresponding to the three stages.
The forward unloading and reverse unloading sections are represented by straight lines. Furthermore, the forward unloading section can be represented as:
τ p = [ γ ( γ p γ p ) ] γ p τ 1 γ p γ p < γ γ p
The reverse unloading segment can be expressed as:
τ o = [ γ + ( γ c + γ o ) ] γ o τ 2 γ c < γ γ c + γ o
The parameters are shown in Figure 12, where τ1 and τ2 are the shear stress at the end of the forward loading and direction-changing shear sections, respectively.
The simultaneous Equations (4)–(9) were used to obtain the cyclic shear stress–displacement mathematical model of the silt–steel interface in the Yellow River delta.

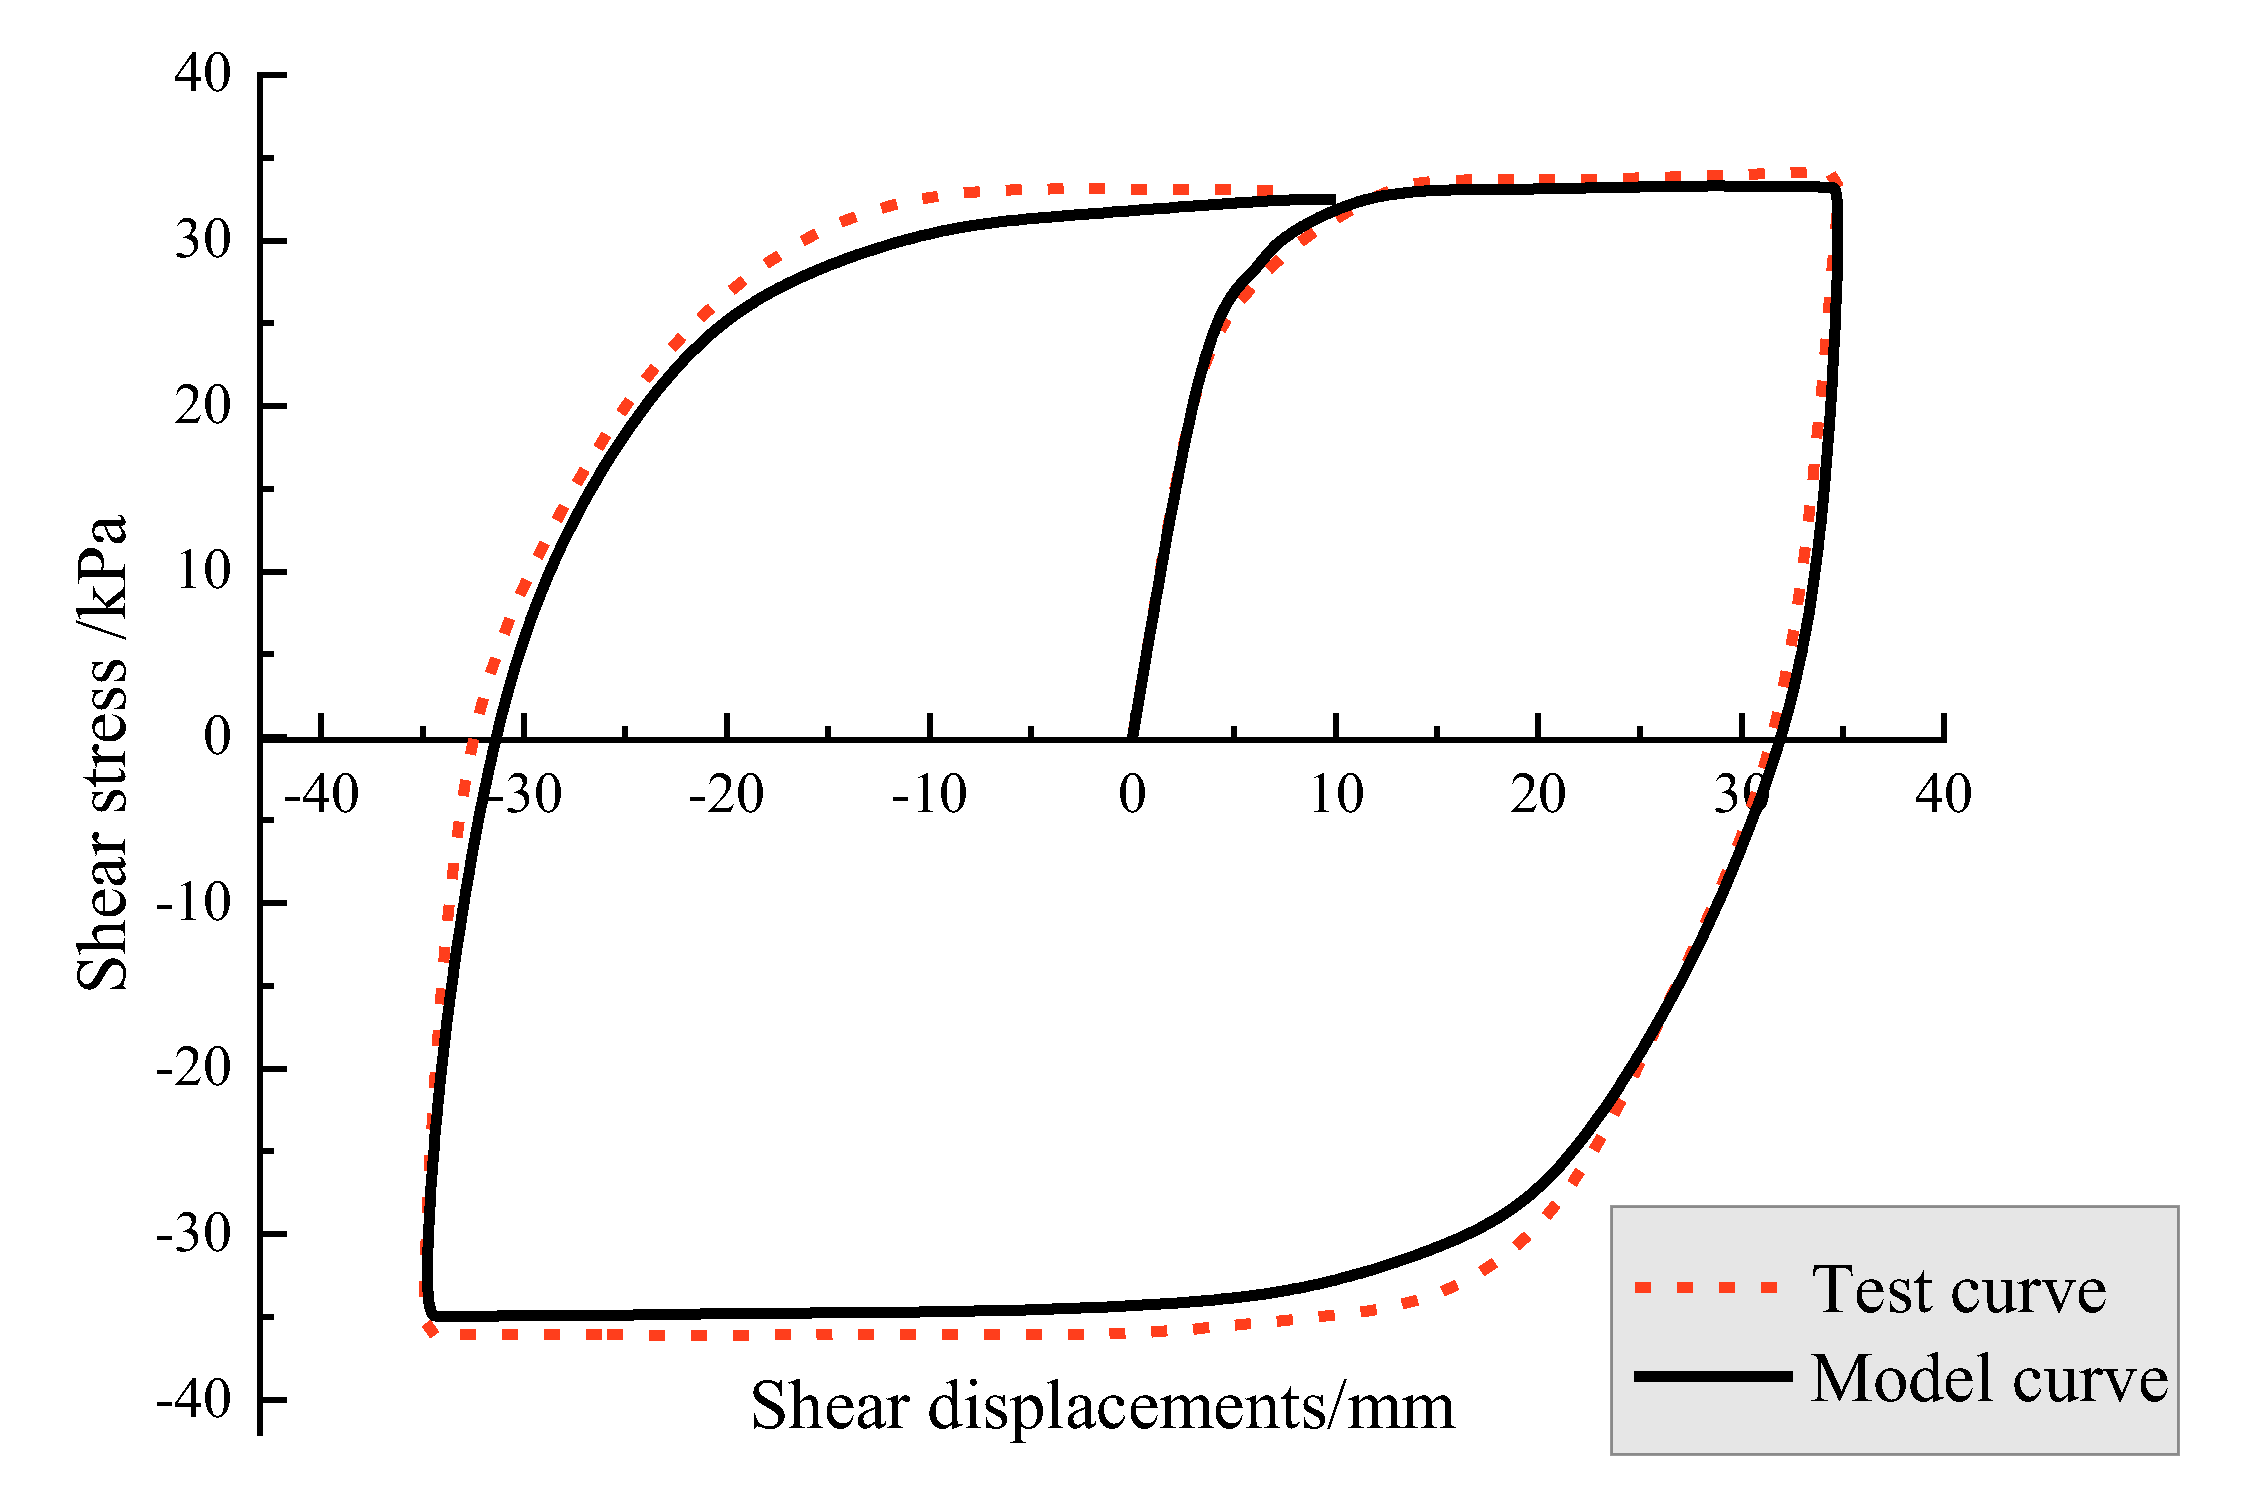
3.3.2. Parameter Determination and Model Verification

For the above stress–displacement mathematical model, the displacement parameters γp, γc, γ-p, and γ-O and the stress parameters τ1, τ2, and τ Max (p, c, o) were statistically obtained from shear test data. The shear stiffness ksi (p, c, o) and failure ratio Rƒ (p, c, o) for the model parameters were obtained by fitting the shear test data. The damage ratio was Rƒ = τmax/τu. By fitting the asymptote of the test data curve, the value range was found to be 0.91–0.96. The initial shear stiffness ksi was the slope of the stress–displacement relationship curve at the tangent line of the origin. The concept of ultimate relative displacement ∆cr can be introduced:
k s i = τ m a x R f Δ c r
In accordance with the suggestion by Fellenius (2006) [27], the ultimate relative displacement ∆cr was taken as 2 mm.
The displacement parameters and stress parameters obtained from the test are shown in Table 5. The cyclic shear test data from the first cycle of group 6 with the constant normal stress of 200 kPa, roughness of R = 0.05, water content of 20%, and shear amplitude of 35 mm are selected for comparison verification. According these cyclic shear test data, the displacement required for the forward unloading section γ-p was 2.1 mm; the failure ratio Rƒc of the direction-changing shear section was 0.93; the displacement required for the reverse unloading section γ-o was approximately 2 mm; and the value of the failure ratio Rƒo for the reverse loading section was 0.95. In addition, the shear strengths of the forward loading section, direction-changing shear section, and reverse loading section were 34.21 kPa, 36.05 kPa, and 33.02 kPa, respectively, and the unified value of ultimate relative displacement ∆cr is 2 mm. Therefore, the initial shear stiffness values ksip, ksic, and ksio of the three stages were 18.39 kPa/mm, 20.03 kPa/mm, and 17.38 kPa/mm, respectively. Figure 14 shows that the stress–displacement mathematical model had a high degree of coincidence with the test curve. Furthermore, the shear strengths of the forward loading section, direction-changing shear section, and reverse loading section showed little difference from the test data. The results prove that the model has good applicability.

4. Conclusions

Using a large-scale shear apparatus, a series of cyclic shear tests were performed on a silt–steel interface in this study. The results can provide a reference for engineering design and safety evaluation in the Yellow River delta. The specific conclusions are as follows:
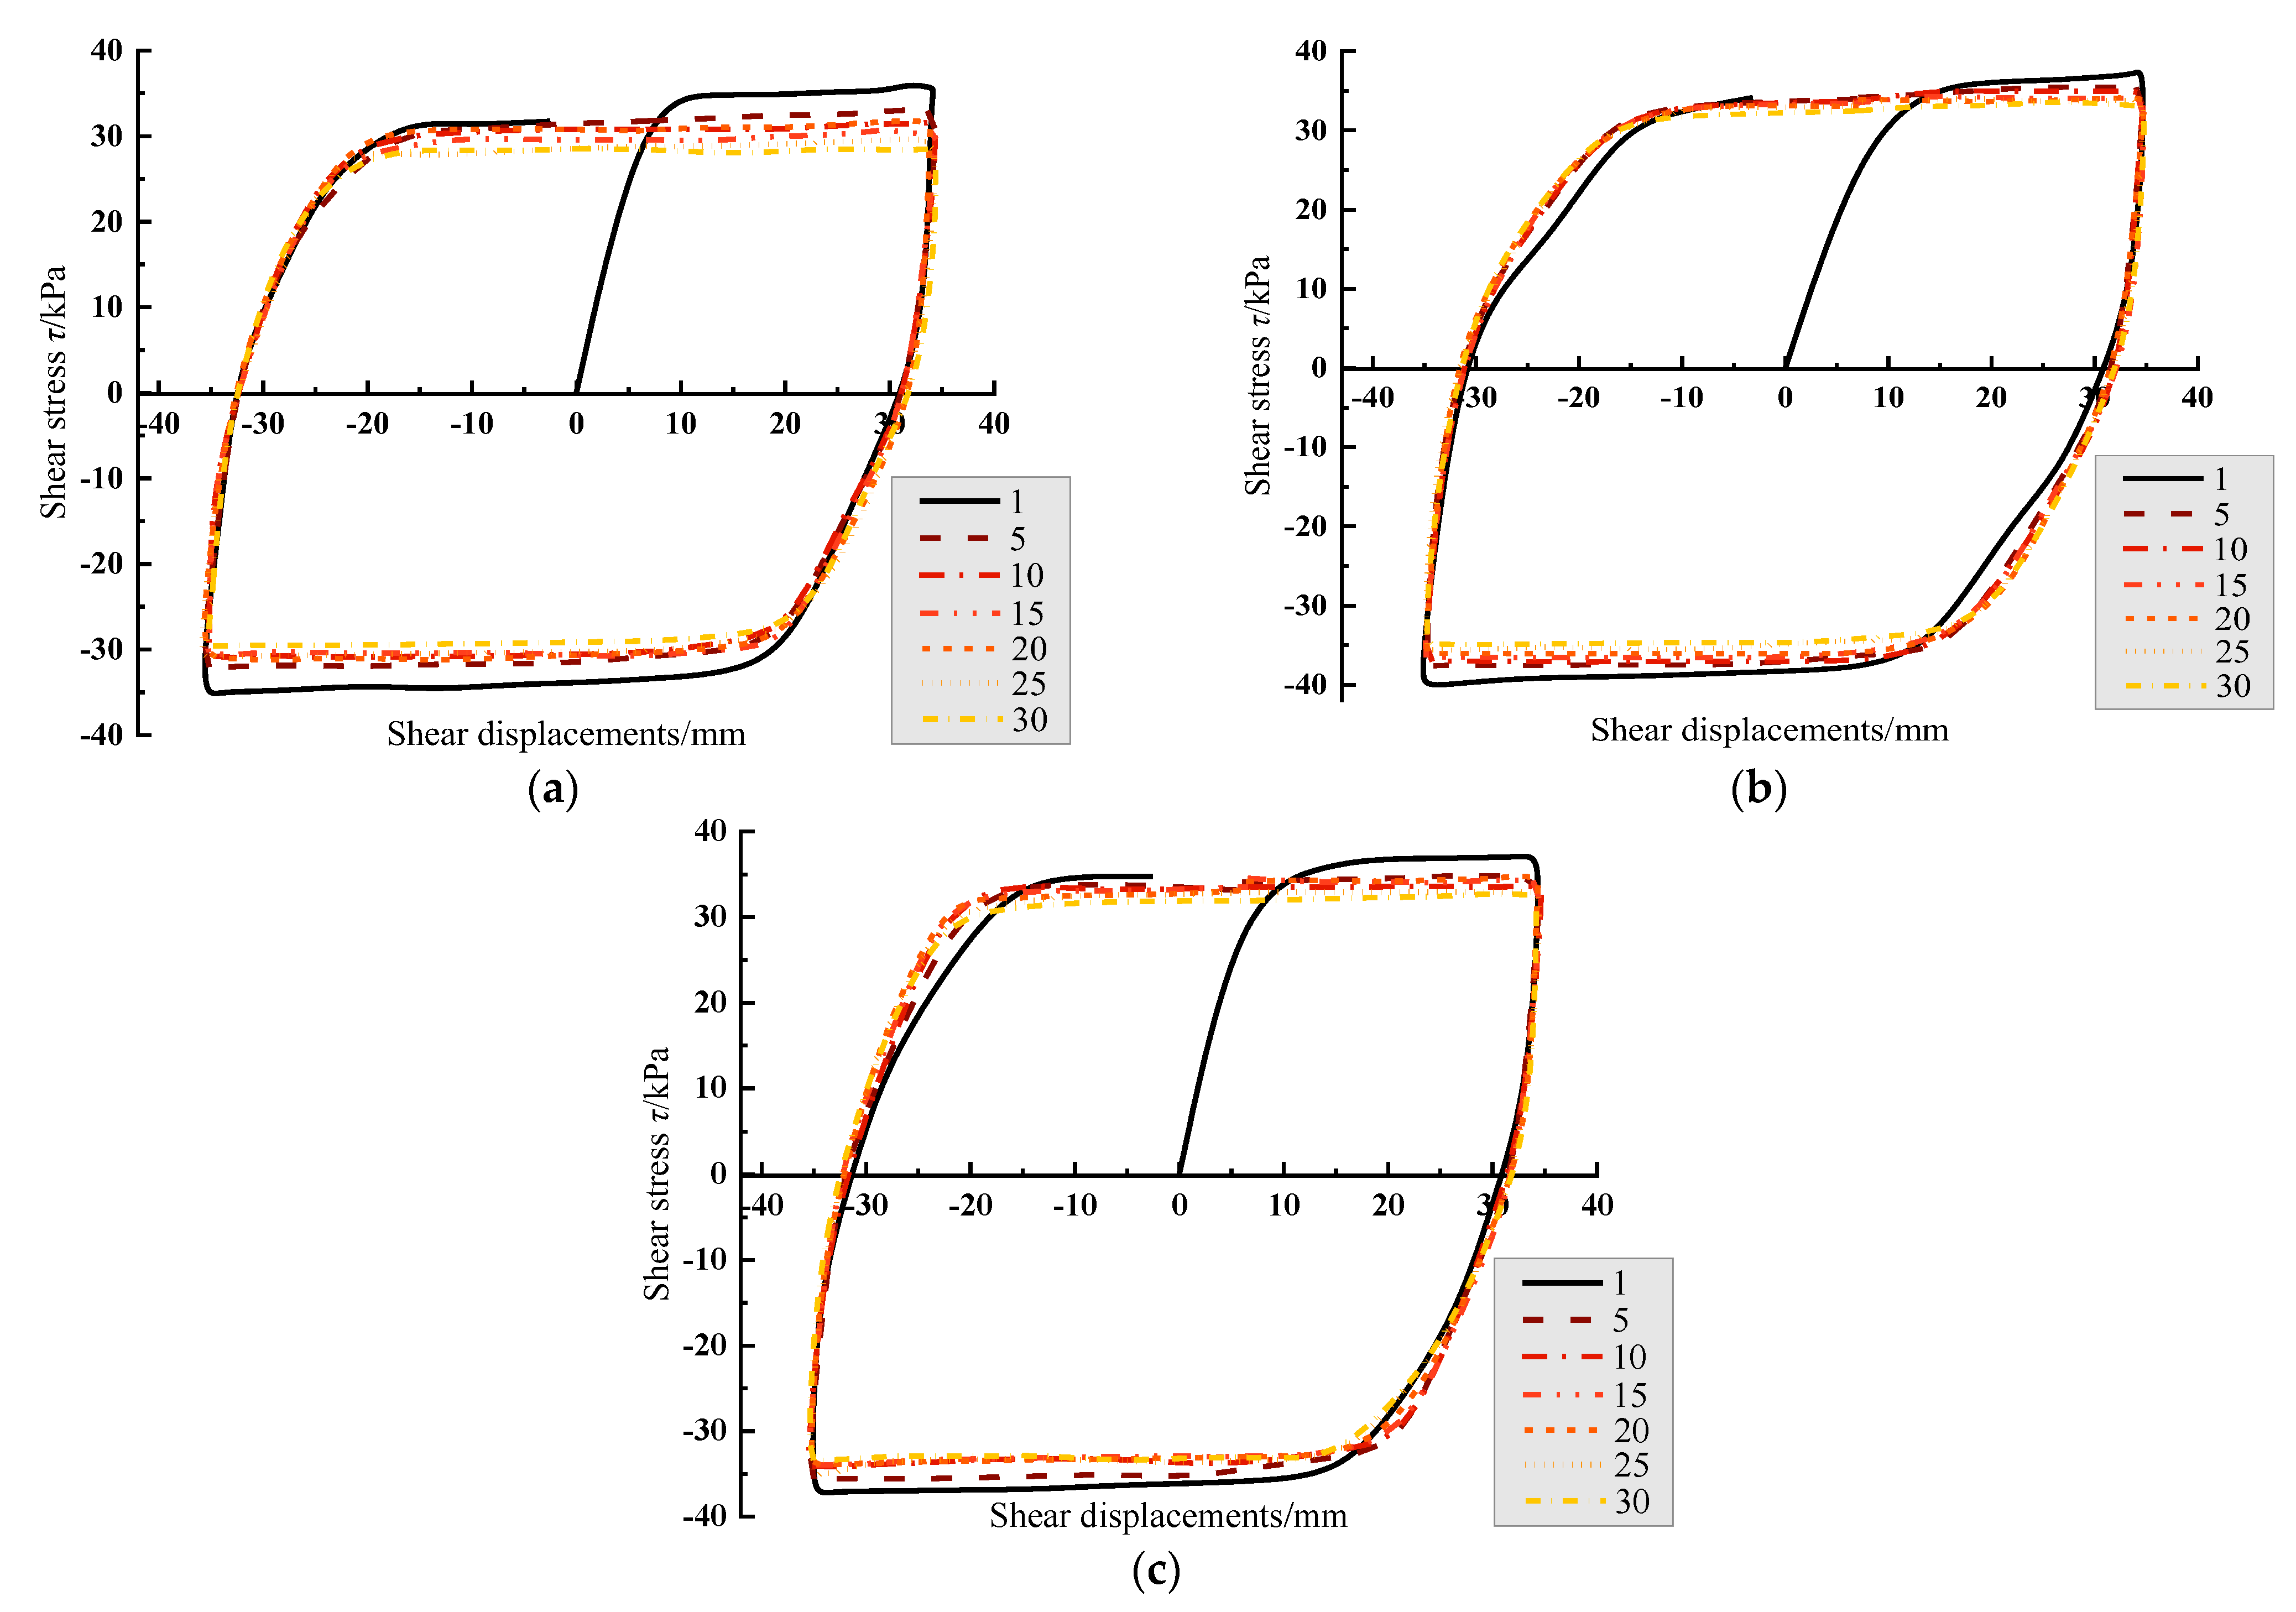
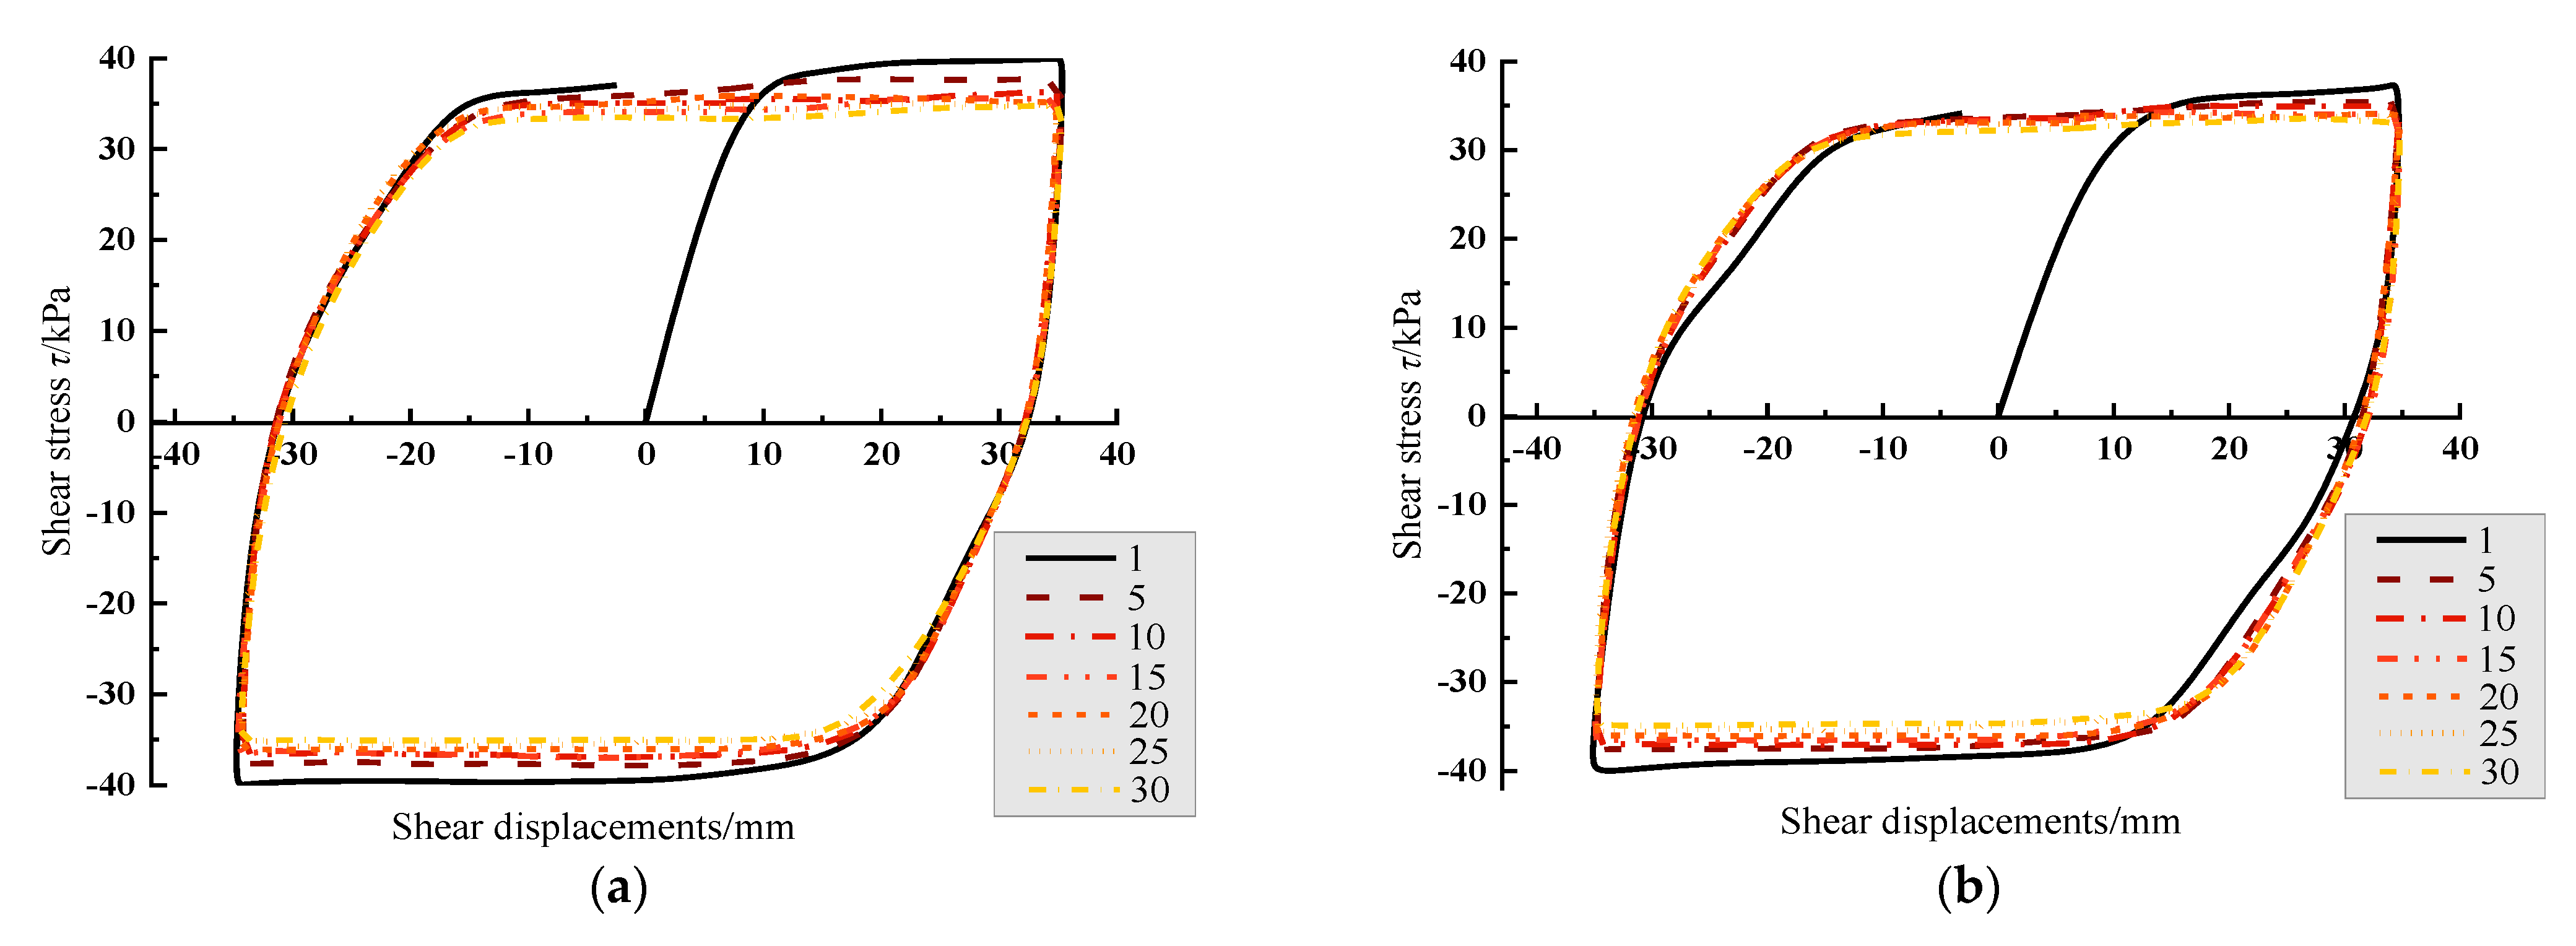
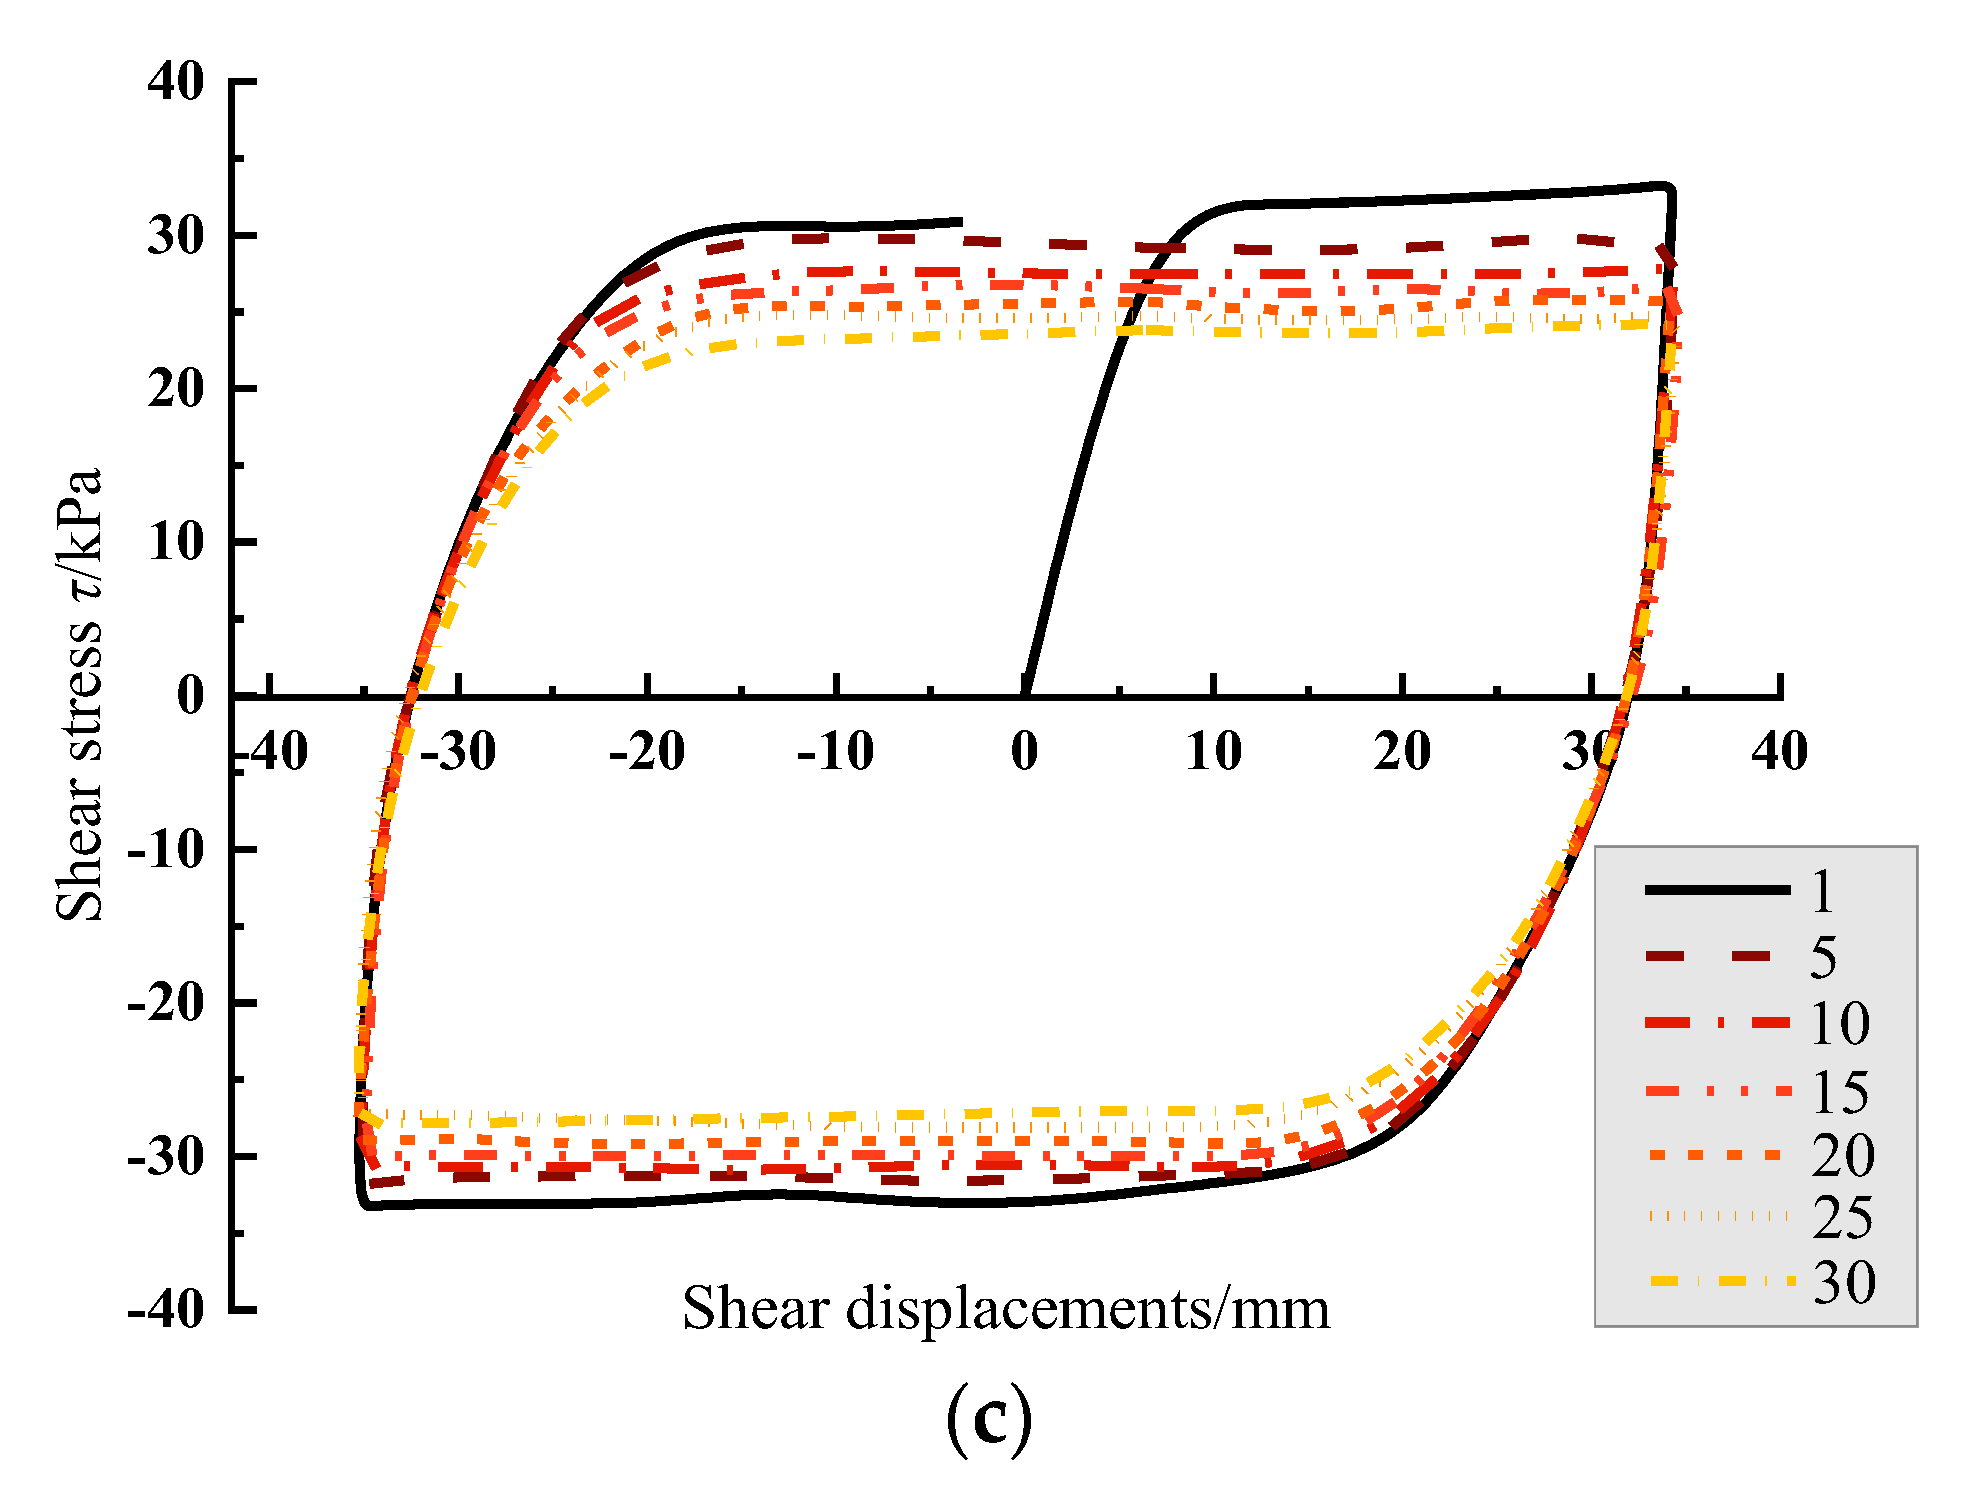
  • With the increase in the the number of cycles, the hysteresis loop shrank inwards, indicating that the interfacial shear stress was softened and that the type of bulk deformation was shear shrinkage. The mechanical properties along different shear directions showed anisotropy in the same cycle;
  • The change in the shear amplitude could change the shape of the hysteresis curve. With the increase in the shear amplitude, the hysteresis curve gradually developed from “parallelogram” to “shuttle” and “hysteresis cake”. At the same time, the shear strength and the volumetric displacements increased;
  • The effects of normal stress, roughness, and water content on shear strength and volume change were similar to those found in the direct shear test. With the increase in the normal stress and roughness and the decrease in the water content, the shear strength, volume displacement growth rate, and growth rate increased;
  • Based on the modified hyperbolic model, the cyclic shear stress–displacement relationship for the silt–steel interface in the Yellow River Delta was described. The model results were in good agreement with the test results.

Author Contributions

Conceptualization, H.L. (Hongjun Liu) and P.Y.; formal analysis, H.L. (Haisong Liu) and R.X.; data curation, R.W. and P.Y.; writing—original draft preparation, P.Y. and H.L. (Haisong Liu); writing—review and editing, H.L. (Hongjun Liu) and P.Y.; visualization, M.X. and P.Y.; project administration, J.D.; funding acquisition, J.D. The final manuscript has been approved by all the authors. All authors have read and agreed to the published version of the manuscript.

Funding

This research was funded by the Shandong Provincial Bureau of Geology and Mineral Resources (grant number KY202223) and the Key Laboratory of Geological Safety of Coastal Urban Underground Space, Ministry of Natural Resources (grant number BHKF2021Z11).

Institutional Review Board Statement

Not applicable.

Informed Consent Statement

Not applicable.

Data Availability Statement

The data presented in this study are available on request from the corresponding author.

Conflicts of Interest

The authors declare no conflict of interest.

References

  1. Zhang, J.M.; Feng, D.K.; Hou, W.J. An automated large-scale apparatus for 3-D cyclic testing of soil-structure interfaces. Geotech. Test. J. 2018, 41, 20170129. [Google Scholar] [CrossRef]
  2. Li, Y.J.; Guo, Z.; Wang, L.Z.; Li, Y.L.; Liu, Z.Y. Shear resistance of MICP cementing material at the interface between calcareous sand and steel. Mater. Lett. 2020, 274, 128009. [Google Scholar] [CrossRef]
  3. Jotisankasa, A.; Rurgchaisri, N. Shear strength of interfaces between unsaturated soils and composite geotextile with polyester yarn reinforcement. Geotext. Geomembr. 2018, 46, 338–353. [Google Scholar] [CrossRef]
  4. Li, M.J.; Fang, H.Y.; Du, M.R.; Zhang, C.; Su, Z.; Wang, F. The behavior of polymer-bentonite interface under shear stress. Constr. Build. Mater. 2020, 248, 118680. [Google Scholar] [CrossRef]
  5. Wang, S.J.; Liu, F.Y.; Wang, P.; Cai, Y.Q. Particle size effects on coarse soil-geogrid interface response in cyclic and post-cyclic direct shear tests. Geotext. Geomembr. 2016, 44, 854–861. [Google Scholar] [CrossRef]
  6. Liu, J.M.; Zou, D.K.; Kong, X.J. A three-dimensional state-dependent model of soil–structure interface for monotonic and cyclic loadings. Comput. Geotech. 2014, 61, 166–177. [Google Scholar] [CrossRef]
  7. Stutz, H.; Mašín, D.; Wuttke, F. Enhancement of a hypoplastic model for granular soil-structure interface behaviour. Acta Geotech. 2016, 11, 1249–1261. [Google Scholar] [CrossRef]
  8. Saberi, M.; Annan, C.; Konrad, J. Three-dimensional constitutive model for cyclic behavior of soil-structure interfaces. Soil Dyn. Earthq. Eng. 2020, 134, 106162. [Google Scholar] [CrossRef]
  9. Feng, X.L.; Wang, F.Y.; Tang, X.; Xiong, Z.H. Effects of shear box size and mean grain size on sandy soil shearing strength. Sci. Technol. Eng. 2017, 17, 1671–1815. (In Chinese) [Google Scholar]
  10. Jia, Y.G.; Zhang, L.P.; Zheng, J.W. Effects of wave-induced seabed liquefaction on sediment re-suspension in the Yellow River Delta. Ocean. Eng. 2014, 89, 146–156. [Google Scholar] [CrossRef]
  11. Zhang, Y.; Feng, X.L.; Ding, C.H.; Liu, Y.N.; Liu, T. Study of cone penetration rate effects in the Yellow River Delta silty soils with different clay contents and state parameters. Ocean. Eng. 2022, 250, 110982. [Google Scholar] [CrossRef]
  12. Liu, X.; Lu, Y.; Yu, H.; Ma, L.; Li, X.; Li, W.; Zhang, H.; Bian, C. In-situ observation of storm-induced wave-supported fluid mud occurrence in the subaqueous Yellow River delta. J. Geophys. Res. Ocean. 2022, 127, e2021JC018190. [Google Scholar] [CrossRef]
  13. Yu, H.; Liu, X.; Lu, Y.; Li, W.; Gao, H.; Wu, R.; Li, X. Characteristics of the sediment gravity flow triggered by wave-induced liquefaction on a sloping silty seabed: An experimental investigation. Front. Earth Sci. 2022, 10, 909605. [Google Scholar] [CrossRef]
  14. Liu, J.W.; Cui, L.; Zhu, N.; Han, B.; Liu, J. Investigation of cyclic pile-sand interface weakening mechanism based on large-scale CNS cyclic direct shear tests. Ocean. Eng. 2019, 194, 106650. [Google Scholar] [CrossRef]
  15. Ren, Y.; Xu, G.; Xu, X.; Zhao, T.; Wang, X. The initial wave induced failure of silty seabed: Liquefaction or shear failure. Ocean. Eng. 2020, 200, 106990. [Google Scholar] [CrossRef]
  16. Wang, Y.; Zhang, M.; Bai, X.; Liu, J. Experimental research on effect of shear rate on shear strength of clayey soil-concrete interface. J. Civ. Environ. Eng. 2019, 41, 48–54. (In Chinese) [Google Scholar]
  17. Zeghal, M.; Edil, T.B.; Plesha, M.E. Discrete element method for sand-structure interaction. In Proceedings of the 3rd International Conference on Discrete Element Methods, Santa Fe, NM, USA, 23–25 September 2010; pp. 317–322. [Google Scholar]
  18. Wang, J.; Ying, M.; Liu, F.; Yuan, G.; Fu, H. Experimental investigation on the stress-dilatancy response of aggregate-geogrid interface using parameterized shapes. Constr. Build. Mater. 2021, 289, 123170. [Google Scholar] [CrossRef]
  19. Rui, S.J.; Zhen, G.; Wang, L.Z.; Zhou, W.J.; Li, Y.J. Experimental study on cyclic shear stiffness and damping ratio of carbonate sand-steel interface. Rock Soil Mech. 2020, 41, 78–86. (In Chinese) [Google Scholar]
  20. Chen, H.; Wang, H.; Zhang, J.S.; Wang, Q.Y. Effects of Roughness on Cyclic Shear Behavior of Red Clay-Concrete Interface. J. South China Univ. Technol. 2018, 46, 146–152. (In Chinese) [Google Scholar]
  21. Wang, T.; Zhang, Z. Experimental studies of cyclic shear behavior of steel—Silt interface under constant normal stiffness condition. Chin. J. Geotech. Eng. 2019, 41, 1921–1927. (In Chinese) [Google Scholar]
  22. Yu, P.; Liu, C.; Liu, H.J. Large—Scale direct shear test study on the silt—Steel interface in the Yellow River Dlta. Period. Ocean. Univ. China 2021, 51, 71–79. (In Chinese) [Google Scholar]
  23. Zhao, C.; Xie, J.F.; Wang, W.D.; Zhou, M. Experimental Study on Shear Behavior of Interface Between Coarse Sand and Structure. J. Tongji Univ. 2019, 47, 1406–1413. (In Chinese) [Google Scholar]
  24. Dejong, J.T.; Westgate, Z.J. Role of initial state material properties and confinement condition on local and global soil-structure interface behavior. J. Geotech. Geoenviron. Eng. 2009, 13, 1646–1660. [Google Scholar] [CrossRef]
  25. Lu, X.Z. Constitutive Model of Steel-Soil Contact Interface and Its Application in the Bearing Behavior Study of Rock-Socketed Filling Pile with Steel Tube. Master’s Thesis, Chongqing Jiaotong University, Chongqing, China, 2015. (In Chinese). [Google Scholar]
  26. He, Z.J.; Mo, H.Q.; Zou, J.F. Research on the parameters of nonlinear hyperbolic model for clay-geogrid interfaces based on large scale direct shear tests. Transp. Geotech. 2019, 18, 39–45. [Google Scholar] [CrossRef]
  27. Fellenius, B.H. Results from long-term measurement in piles of drag load and downdrag. Can. Geotech. J. 2006, 43, 409–430. [Google Scholar] [CrossRef]
Figure 1. Large-scale shear instrument.
Jmse 10 01704 g001
Figure 2. Preparation process for soil samples.
Jmse 10 01704 g002
Figure 3. Steel plates with different roughness levels.
Jmse 10 01704 g003
Figure 4. Process of shear test: (a) completion of filling; (b) compaction process; (c) completion of test.
Jmse 10 01704 g004
Figure 5. Shear stress-shear displacement curves under different constant normal stresses: (a) 100 kPa; (b) 200 kPa; (c) 300 kPa.
Jmse 10 01704 g005
Figure 6. Shear stress-shear displacement curves with different shear amplitudes: (a) 5 mm; (b) 15 mm; (c) 35 mm.
Jmse 10 01704 g006
Figure 7. Shear stress-shear displacement curves with different roughness levels: (a) R0; (b) R1; (c) R2.
Jmse 10 01704 g007
Figure 8. Shear stress-shear displacement curves with different levels of water content: (a) 16%; (b) 20%; (c) 24%.
Jmse 10 01704 g008aJmse 10 01704 g008b
Figure 9. Shear strength of each group.
Jmse 10 01704 g009
Figure 10. Normal displacement–shear displacement curve with different numbers of cycles.
Jmse 10 01704 g010
Figure 11. Curve for normal displacement–number of cycles under different constant normal stress.
Jmse 10 01704 g011
Figure 12. Curve for normal displacement–number of cycles under different conditions: (a) shear amplitude; (b) roughness; (c) water content.
Jmse 10 01704 g012
Figure 13. Cyclic shear hysteresis.
Jmse 10 01704 g013
Figure 14. Comparison of theoretical and experimental results.
Jmse 10 01704 g014
Table 1. Basic physical properties of silt.
Specific Gravity GsOptimum Water Content %Void Ratio
e
Plastic Limit
ωp/%
Liquid Limit
ωL/%
2.719.60%0.6918.330.1
Table 2. Particle size distribution of silt.
Specimen
Numbers
0.25~0.0750.075~0.050.05~0.010.01~0.005<0.005
Percentage6.6%21.6%51.8%5.9%14.1%
Table 3. Different roughness levels of steel plates.
RNL1 (mm)L2 (mm)H (mm)
0\\\\
0.0252000.630.3
0.051001.260.6
Table 4. Test group.
GroupRoughnessWater Content
(%)
Normal Stress
(kPa)
Shear Amplitude
(mm)
10.051620035
20.05201005
30.05202005
40.05203005
50.052020015
60.052020035
70.052420035
802020035
90.0252020035
Table 5. The displacement parameters and stress parameters.
Groupγp
(mm)
γc
(mm)
γ-p
(mm)
γ-o
(mm)
τmaxp
(kPa)
τmaxc
(kPa)
τmaxo
(kPa)
ksip
(kPa/mm)
ksic
(kPa/mm)
ksio
(kPa/mm)
Others
135.6335.063.133.8439.9739.9639.1421.2621.2520.81cr= 2 mm
Rp = 0.91~0.96
25.005.000.981.0716.4721.719.578.7611.545.09
34.985.000.661.1327.9230.6912.3714.8516.326.57
45.074.950.911.1036.5239.8715.1019.4221.208.03
515.0014.971.912.5136.0534.0825.3119.1718.1213.46
635.0035.002.102.0034.2136.0533.0218.3920.0317.38
734.4535.602.433.2133.3933.3731.9017.7617.7516.96
834.5036.213.093.7136.1535.2034.5719.2318.7218.38
934.5135.212.593.4337.2337.4035.2119.8019.8918.72
Publisher’s Note: MDPI stays neutral with regard to jurisdictional claims in published maps and institutional affiliations.

