Abstract
Over the past decades, hydraulic surge generated by dam-break waves has been used to simulate the effects of tsunamis on coastal infrastructure. This study investigates the slope effects on hydrodynamic loading of dam-break waves on structure when propagating over four different inclined beds (0-, 5-, 10-, 15-degree) by experiment and numerical simulation using OpenFOAM and DualSPHysics. Except for small discrepancies in the pressure time-history, numerical results obtained with both OpenFOAM and DualSPHysics agreed closely with the experimental dynamic pressures. The results revealed that the hydrodynamic pressure decreased after an initial impact peak from the lowest transducers in the 5-, 10-, and 15-degree cases when compared with the horizontal case. However, the dynamic pressure of transducers at same corresponding level increased with an increase in the slope. The integrated experimental hydrodynamic forces were similar to the numerical results for the 0- and 5-degree cases, while they were higher for the 10- and 15-degree cases due to insufficient pressure data. By investigating the relation between the force decrease and slopes, a non-dimensional reduction factor was proposed from the linear fitness for slope effects estimation. This experimental and numerical study can provide novel insight on the hydrodynamic force calculation of tsunami-like surges on coastal infrastructures when considering beach slope.
1. Introduction
Since Lauber et al. [1] summarized and concluded the experimental criteria for generating ideal dam break waves, the latter have been widely used to investigate the mechanism of tsunami overland inundation, which, over the past decades have caused significant disasters in coastal areas around the world. Extensive research on dam break wave propagation over horizontal beds and the subsequent hydrodynamic impact on structures has been performed by several researchers [2,3,4,5,6,7,8,9,10].
One of the major aspects to be investigated and which is related to the hydrodynamics of dam break waves is the dynamic pressure during the impact of these waves and structures located in their path. In the highly cited experimental research by Lee et al. [3], the time-history data of hydrodynamic loading of a dam break wave propagating over a horizontal bed and its impact on a tank wall was recorded by several wall mounted pressure transducers. Reasonable agreement was observed between the experimental pressure and numerical results, despite some discrepancies around the peak value. This experimental apparatus was scaled up and reconducted by Lobovsky et al. [4] to provide detailed insights in the form of a statistical analysis with the application of miniaturized pressure transducers. Except for a good agreement between the time-history of the experimental and numerical pressures [3], there were discrepancies that may be introduced by the use of larger-diameter pressure transducers. Overall agreement was observed in the comparison with experimental research by Kleefsman et al. [2] and Wemmenhove et al. [11]. In the study by Nouri et al. [8], the time variation and the vertical distribution of dynamic pressure from a dam break wave onto a cylindrical structure was presented and analyzed. The spatial distribution of the time history of the hydrodynamic pressure was shown to be significantly different from the triangular hydrostatic distribution. Spatial distribution of dynamic pressure can provide detailed insights into the characteristics of dam break flow for important time instances [12,13]. Experimental test demonstrated that pressure transducers were capable of recording the time variation of the dynamic pressure on structures caused by dam break waves.
Compared with the investigation of dynamic pressure fields, the experimental estimation of the force study is a more direct way of evaluating the hydrodynamic loading of dam break waves and has the potential to provide design guidance for coastal infrastructures. With the installation of a 6 degrees of freedom dynamometer at the bottom of a cylindrical column, Nouri et al. [8] obtained the time history of the total force exerted on a circular and square structure due to the surge generated by the reservoir with impoundment depths of 0.5 mm, 0.75 m, 0.85 m and 1.0 m. The experimental study demonstrated that surge force overshot the hydrodynamic force when the impoundment depth increased; this was attributed to the steeper slope and fast-moving surge front. Wuthrich et al. [10] conducted a series of experiments to study the hydrodynamic impact of tsunami-like waves against impervious free-standing buildings by installing a force plate at the bottom of the partially channel-blocking cubic model. Unlike the previously observed gradually decreasing force, after the initial peak value at initial impact of a slender structure, a relatively quasi-steady period (fluctuating at approximately 150 N) was observed during the impact stage from 5–35 s for the case of the dry bed. In the research on the spatiotemporal characteristics of dam break -induced loading on a vertical wall by Shen et al. [13], the interaction process was described as having 3 stages: the initial impact stage from the impact to the highest wave run-up; the reflected stage until the wave fell back and rotated; followed finally by the second impact stage. The study revealed that the surge force mainly came from the bottom impact zone during the initial impact stage and second impact stage, whereas it was contributed to by both the bottom impact zone and upper outer zone during the reflected stage. Recently, Farvizi et al. [14] placed a load cell in the bottom of a pier to quantify the tsunami-induced force on a deck girder section bridge. The force comparison for the 0-degree bed case indicated that the impact horizontal force acting on the pier was mainly caused by the hydrodynamic loading, and to a lesser extent, by the hydrostatic one.
Besides the experimental measurement approach, empirical formulas have been proposed to directly estimate the impact force of tsunami waves on coastal infrastructure. In the widely used Japanese Structural Design Guideline (SMBTR) [15] which is based on the research by Asakura et al. [16] and Okada et al. [15], the maximum pressure was set as three times the hydrostatic pressure and also three times the maximum wave height linearly distributed on the front face of the vertical wall, as indicated in Figure 1.
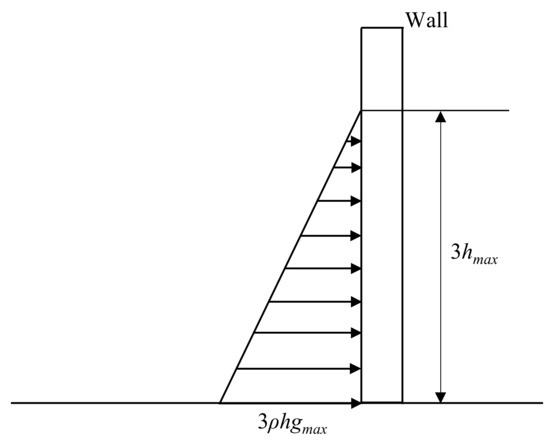
Figure 1.
Tsunami force calculation method in SMBTR.
Thus, the unit horizontal impact force (N/m) was nine times that of the hydrostatic force, a provision which was also adopted in CCH [17], as described in Equation (1):
where is the water density, is the gravitational acceleration, is the maximum wave height. In the research by Okada et al. [15], was defined as the maximum wave elevation measured from the ground up while the wave freely developed. As the dam break wave was completely stopped by the vertical wall in this study, was defined as the maximum wave height while the wave started impacting on the vertical wall, i.e., the wave height at the left wall, approximately 0.13 m in horizontal case.
The calculation of hydrodynamic load by tsunamis on structures was also presented in ACSE-7, Chapter 6. The provisions of this standard were applied in the tsunami loads studies by Stolle et al. [18] and Wuthrich et al. [19]. In this study, equation 6.10(4) from the latest version of ASCE-7 [20] was adopted for the unit hydrodynamic loading calculation, as shown in Equation (2):
where is the water density, is the importance factor which is 1.25, is the drag coefficient which is 2.0 when the wall is normal to flow, is the inundation depth taken as 2/3 of the maximum inundation depth which is 0.07 m, and is the maximum velocity of tsunamic flow in the steady propagation stage before impacting the vertical wall, which is approximately 2.9 m/s in horizontal case, calculated by the analysis method in the study of Liu et al. [21].
To obtain detailed values of the time-history of the hydrodynamic force, numerical modelling was used to elucidate the interaction between infrastructure and tsunami-like inundation. The open-source software OpenFOAM has been widely and successfully applied to solve fluid dynamics problems due to its customized solvers and various models [22,23,24,25,26]. By applying OpenFOAM, Sánchez-Cordero et al. [22] numerically reproduced the physical test of a dam break wave impacting an obstacle [2]. The qualitative analysis showed that numerical results highly matched with the experimental dynamic pressure of certain points on the frontal face, except for tiny temporal variations. Peng et al. [27] performed numerical simulations to investigate the impact of dam break induced flooding on a structure by reproducing the physical test [4] in OpenFOAM. The comparison study between the numerical results and experimental data showed that numerical models can reasonably predict the experimental dynamic pressure exerted onto a structure caused by dam-break flow. Furthermore, this study revealed that the dynamic pressure approaches zero at a level equal to the initial impoundment depth on the structure wall, which can provide evidence for the pressure distribution study.
The Smoothed Particle Hydrodynamics (SPH) method has been increasingly used to deal with large deformations of free surface flows and the complex interactions between waves and structures [28,29,30]. This is mainly due to its benefits, which include being meshfree, and adaptive [31]. The experiment dealing with the dam break flow impacting a column [8] was reproduced using SPHysics by St-Germain et al. [9] who numerically investigated the hydrodynamic loadings of tsunami-induced waves on onshore structures. Except for a very high simulated peak pressure at the lowest transducer calculated using SPHysics and which was attributed to trapped air, the numerically obtained dynamic pressures by SPHysics matched well the experimental results for the 1.15 m impoundment depth case. Good agreement was also observed for the force comparison from the initial impact to the high wave runup on the column at approximately 4.0 s [9,32]. Then, due to the wave breaking and induced strong turbulence and air entrainment, the oscillations observed on the experimental force time-history increased with the impoundment depth. In the most recently released DualSPHysics [33], the dynamic pressure can be calculated more accurately and stably [34] due to the advantage of a new boundary treatment method [35] built in to avoid the oscillation on the pressure field.
By reviewing the existing research and literature, it was found that most of the dam break research focuses on the hydraulic surge propagating over horizontal beds and the subsequent impact on structures. However, beaches along the coastlines are usually sloped in a range of 1:100 to 1:10 degrees or sometimes more. Therefore, in such situations the hydrodynamic loading of tsunami wave will change and it should be investigated. In addition, to record the hydrodynamic pressure, the pressure transducers were mostly installed up to a limited height, i.e., below the level of the initial impoundment depth H. However, the wave runup can rise up to two times the height of H. The distribution of dynamic pressure at higher elevation on the wall is hence of significant research interest. Additionally, in most cases, dynamometers and force load cells were installed at the bottom of structures to measure the impact loading; however, this can be difficult to be applied to the built large-scale structures for monitoring work. Furthermore, the recorded impact force on isolated structural elements (such as columns) exhibited a peak value at the instant of the initial impact which then further decreased gradually, and, later on, exhibited a relatively quasi-steady hydrodynamic forces was observed. However, less attention was paid to the trend of impact force on fully flow blocking structures during the complex wave-structure interaction. Additionally, there is lack of non-dimensional study about the hydrodynamic loading for dam-break research.
This study aimed to investigate slope effects on the hydrodynamic loading caused by tsunami-like dam break flows on vertical walls in terms of the measured dynamic pressure and impact, total force. Numerical models were developed using OpenFOAM and DualSPHysics model. They were used to reproduce the experiments and provide a comparison with experimental data. In addition, this study offers a new perspective on the spatial distribution of impact pressure generated by dam break flows by also investigating the elevation of the maximum runup where the pressure became nil. The force integration method the presentation of the non-dimensional reduction factor can provide a simple approach for quantifying the impact force by using the information provided from the pressure transducers with consideration of the slope effects.
The paper is organized as follows: the Introduction section is followed by the experimental apparatus design and settings. Section 3 focuses on the posting-processing methodology of experimental data and the numerical simulation used to reproduce the physical tests. The results are then analyzed and discussed in Section 4 in terms of dynamic pressure and integrated hydrodynamic force. The discussion is presented in Section 5. Finally, conclusions are presented in Section 6.
2. Experimental Settings
To physically investigate the effects of slope on the hydrodynamic loading of a tsunami-like bore acting on a wall, dam break experiments with an impoundment depth H = 300 mm were conducted at the Water Resources Engineering Laboratory at the University of Ottawa, Canada. The experimental facilities, included a 1.2 m long, 0.44 m wide, 0.5 m high glass tank with gate release system, pressure transducers and data acquisition system Liu et al. [36] to investigate the dynamics of dam-break surges on a horizontal bed, as shown in Figure 2.
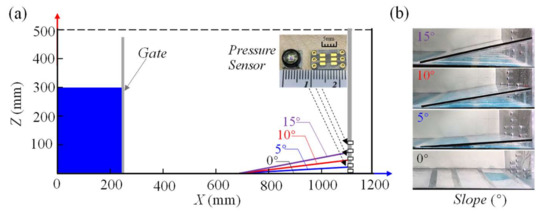
Figure 2.
Experimental setup: (a) apparatus system with side wall equipped with Honeywell Pressure Transducers (HPTs); (b) locations of HPTs and the 4 bed slopes employed: 0-degree, 5-degree, 10-degree, 15-degree.
Honeywell Pressure Transducers (HPT, TBFLPNS001BGUCV, Honeywell Sensing and Productivity Solutions, Charlotte, USA) were mounted along the center line of the right vertical wall, which were at altitudes of 3 mm, 35 mm, 70 mm, 105 mm and 140 mm, numbered as transducers 1 to 5. To model the inclined beach, 4 different smooth plexiglass slopes with 0-degree (horizontal bed), 5-degree, 10-degree, 15-degree, were built and installed starting at X = 0.7 m and leaning against the vertical wall at X = 1.1 m, as shown in Figure 2a, b. The top of the slope was designed to be located just below the lowest transducer in each case for peak impact pressure investigation and comparison, e.g., transducer 3 is the lowest transducer in the 10-degree case. The number of transducers in each case and experimental matrix are listed in Table 1.

Table 1.
Experimental Matrix.
3. Experimental and Numerical Techniques
3.1. Experimental Post-Processing
The time-history of the dynamic pressure was measured by the HPTs to compare and investigate the slope effects. The vertical pressure spatial distribution was also integrated to calculate the impact force. In the numerical investigation by Peng et al. [27], the impact of dam-break induced flooding on the structure and the results of dynamic pressure on the wall demonstrated that the pressure values decreased to zero around the height of the initial impoundment depth. In addition, by setting virtual pressure probes above the top transducer 5 in the numerical simulation of this study, similar results were obtained; as soon as the runup wave reached an elevation above the initial impoundment depth, it became very thin and splashed instead of acting on the vertical wall when the runup was. Thus, a linear interpolation method was proposed to calculate the impact force, based on the assumption that dynamic pressure decreased to 0 when the runup reached the same elevation on the vertical wall as that of the initial impoundment depth H, as shown in Figure 3.
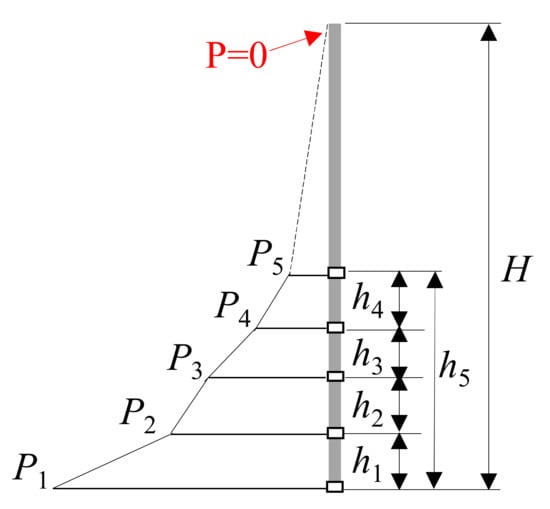
Figure 3.
Schematic of the linear dynamic pressure distribution on the right vertical wall with the assumption that P = 0 at the elevation equal to that of initial impoundment depth h0, h1 = h2 = h3 = h4 = 35 mm, H = 300 mm.
The resultant unit force (N/m) was calculated using the formula below:
where is the pressure of transducer , for the 0-, 5-, 10- and 15-degree beach slope cases separately, is the initial impoundment depth equal to 300 mm, and is the height of transducer 5 located at 140 mm above the origin of the system of coordinates.
3.2. Numerical Modelling Using OpenFOAM and DualSPHysics
To reproduce the physical tests results and to provide a comparison with them, one three-dimensional numerical model both based on open-source VOF based codes-OpenFOAM and SPH based package-DualSPHysics were developed and modified, respectively. For both numerical models, the computational domain was configured to have the same dimensions as the experimental apparatus. The rigid tank walls and bottom were set as non-slip boundary condition, while the top boundary was set open with constant atmospheric pressure. Virtual pressure probes were coded in the numerical model at the corresponding locations with the pressure transducers in the physical tests.
In OpenFOAM simulation, the two-equation SST (Shear Stress Transport) turbulence model [37] was applied as this model combines the advantages of the turbulence model in free flow simulation and the turbulence model in the boundary layer modelling. Thus, this combined turbulence model was successfully used in a wide range of applications [38,39], especially in the study of multi-phase flow [24]. The governing equations for turbulence kinematic energy and specific turbulence dissipation are shown in Equations (4) and (5).
where the default empirical model coefficients are represented by constants , which can be calculated from the constants and , as shown in Equation (6):
where is blending function, thus the coefficients adopted in the numerical model are given in two sets according to and , as indicated in Equation (7):
In post-processing the results of the numerical model, numerical pressure probes were located at the same corresponding position of physical HPTs to capture the calculated dynamic pressure. The horizontal component of dynamic pressure thus could be extracted from the pressure field, which is calculated by Equation (8).
where is the total pressure, is the reference pressure, is the static pressure, is the water density, and is the flow velocity.
The force library was used in the simulation and called to calculate the resultant force acting on the defined patch (i.e., the tank right vertical wall), as indicated in Equation (9). In the post-processing stage, the horizontal impact force component on the vertical wall was obtained from the calculated results.
where represents the number of the cells in the computation area, is water density, is the face area vector, is the pressure and is the reference pressure.
In SPH method, the fluid domain is represented by a collection of individual particles and can thus be discretized [40]. With the application of discrete interpolation and kernel approximation, the governing Navier-Stokes equations are reformulated as shown in Equations (10) and (11).
where, are the density, velocity and pressure of particle , respectively, are the mass and density of neighboring particle , is the gradient operator, is the kernel function, and represents the artificial viscosity term.
In DualSPHysics numerical model, for a given location, the pressure can be computed by using the pressure values of neighboring fluid particles, as shown in Equation (12).
where, is the pressure at a given location, is the pressure of neighboring particles, and is the kernel function.
For boundary particles, acceleration can be numerically computed by solving the particle interactions with the neighboring fluid particles, as shown in Equation (13):
where, , , are the velocity, pressure and density of boundary particle , respectively, , , are the mass, pressure, density of the neighboring particle , respectively, is the kernel function, and is gravitational acceleration.
Furthermore, by calculating the summation of forces on boundary particles, the resultant force acting on the boundary wall can be obtained, as shown in Equation (14).
where, is the number of particles in the computational area, , are the mass and velocity of boundary particle , respectively.
A sensitivity and convergence study was conducted both in OpenFOAM and DualSPHysics, with different meshes and particle numbers employed in the calculation domain, separately. The sensitivity and convergence analysis results for the pressure calculated at transducer 1 are shown in Figure 4.
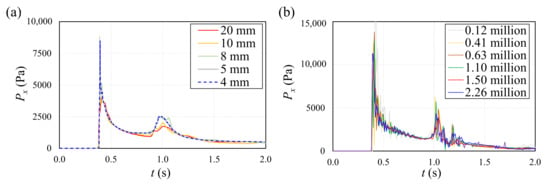
Figure 4.
Numerical sensitivity study of the dynamic pressure for transducer 1 in: (a) OpenFOAM model (b) DualSPHysics model.
In OpenFOAM simulations, different mesh grids of 20 mm, 10 mm, 8 mm, 5 mm and 4 mm were generated for the computational domain in all directions to investigate the convergence separately. As indicated in Figure 4a, the first peak pressure tended to be steady and the pressure curves coincided more closely when the mesh size decreased from 20 mm to 4 mm. The pressure data from models of 5 mm and 4 mm mesh grids were remarkably similar which indicated that convergent results were achieved. Thus, the mesh grid of 4 mm was adopted for the OpenFOAM simulation.
A high first peak pressure and following relatively larger oscillations were observed on the pressure time-history in DualSPHysics simulations with lower particle number, i.e., 0.12 million and 0.41 million, as shown in Figure 4b. With the particle number increasing, the first and second peak pressures got stabilized and the time-history curve became smoother with reduced tiny oscillations. A statistical analysis of the pressure values at first and second peak from Figure 4b revealed that the peak values kept steady and approached convergence with a particle number over 1.50 million. Therefore, a particle number of approximately 2.2 million was applied to all the simulations in DualSPHysics.
4. Results
4.1. Dynamic Pressure on Horizontal Bed
In the experimental study of dam break induced bore propagating over a horizontal bed [36], the time-history of the impact dynamic pressure from the miniaturized transducers 1–5 was measured and these are presented in Figure 5. At initial impact, the pressure quickly reached a first peak value for all transducers except the slightly negative value recorded by transducer 5 due to suction effects caused by the fallback of the tip of the runup wave. After decreasing to a plateau period, a second peak pressure was observed due to the impact of the fallback wave. Afterwards, the time-history of pressure data gradually decreased to zero except for the approximate hydrostatic pressure recorded by transducer 1.
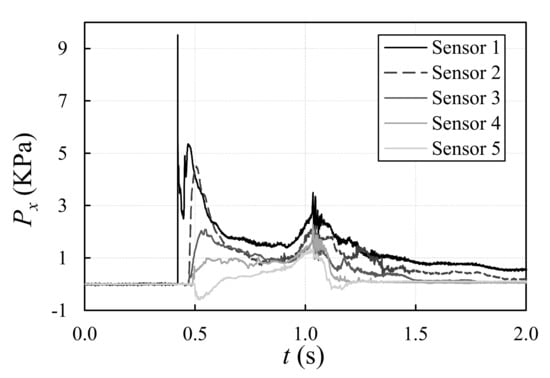
Figure 5.
Time-history of the dynamic pressure of dam break flow on the tank wall by Liu et al. [36], bore generated by the 30 cm impoundment depth propagating on horizontal dry bed; transducers 1 to 5 located at elevations of 3 mm, 35 mm, 70 mm, 105 mm and 140 mm, respectively.
4.2. Pressure Comparison of Experiment and Numerical Simulation
In this study, the dam-break waves propagating over a horizontal bed was reproduced by two models, OpenFOAM and DualSPHysics, to numerically calculate the dynamic pressure at the corresponding transducer 1–5 locations, with the comparison presented in Figure 6. Good agreement was observed except for some slight discrepancies.
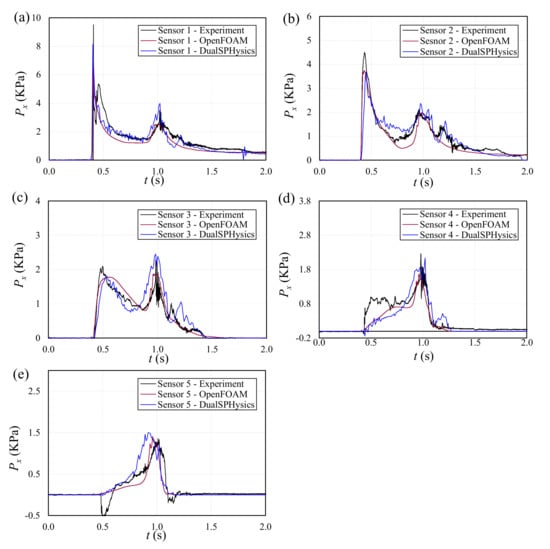
Figure 6.
Time-history of the dynamic pressure comparison of experimental data and numerical results obtained using the OpenFOAM and DualSPHysics models for transducer 1 to 5.
The numerically calculated initial peak pressures at transducers 1 and 2 simulated by both the OpenFOAM and DualSPHysics models had approximately the same magnitude, i.e., approximately 1.26 kPa and 0.70 kPa, lower than the experimental value, respectively, as shown in Figure 6a,b. Except for the pressure spike after the first peak for transducer 1 and the median pressure value during the plateau period between 0.6–0.9 s for transducer 2, the dynamic pressures recorded by transducers 1 and 2 fit well with the results computed by OpenFOAM and DualSPHysics. For transducer 3, in Figure 6c, it can be observed that the experimental dynamic pressure was closer to the experimental results obtained by OpenFOAM. The dynamic pressure calculated by DualSPHysics was 1.06 kPa lower at the first peak than the experiment and fluctuated in the range of 0.9 kPa during the plateau period between 0.7 s and 0.9 s. Meanwhile, the pressure duration around the second peak in DualSPHysics was approximately 0.15 s wider than the experiment and OpenFOAM. The experimental dynamic pressure of transducer 4 increased relatively sharply from the initial impact and then further fluctuated at approximately 0.8 kPa from 0.5–0.8 s, which was not observed in the results of OpenFOAM and DualSPHysics. For transducer 4, both OpenFOAM and DualSPHysics demonstrated better agreement with experimental data. After 0.9 s, the time-history of the experimental and numerical pressures of transducer 4 matched well except the fluctuation observed in the pressure simulated by DualSPHysics. Neither OpenFOAM nor DualSPHysics exhibited the negative experimental pressure values at transducer 5. The dynamic pressure calculated by DualSPHysics matched well with the experimental data before 0.8 s; further, both the OpenFOAM and DualSPHysics models generated results closer to the experimental ones for the period from 0.9 s onwards, as exhibited in Figure 6e.
The duration of pressure crest around the second peak from experiment and numerical simulations matched perfectly for lower placed transducers 1 and 2. However, for transducers 3, 4, and 5, longer duration was observed for the time-histories of the pressure curves by DualSPHysics. OpenFOAM however demonstrated perfect match with experimental results in term of peak duration for the three top transducers (3, 4 and 5).
By comparing and evaluating the experimental dynamic pressure and numerical simulation results, it can be summarized that, except for some small discrepancies, both the OpenFOAM and DualSPHysics models can satisfactorily reproduce the impact of a dam break wave on a wall.
4.3. Dynamic Pressure in Lowest Transducers
The dam-break experiments were conducted with different bed slopes, showing good repeatability in spite of data noises due to measurement errors which were filtered adequately, i.e., for the instantaneous and sudden small spike on the pressure time-history. During the impact between the vertical wall and dam-break induced bores, the lowest placed transducer will experience the most violent impacts. Figure 7 exhibits the time-history of dynamic pressure from the lowest placed transducers 1 which is located at the bottom in the 0-degree case; transducers 2, 3, and 4 became the lowest placed ones for the 5-, 10-, and 15-degree cases, respectively, as in the schematic showing the experimental apparatus in Figure 2.
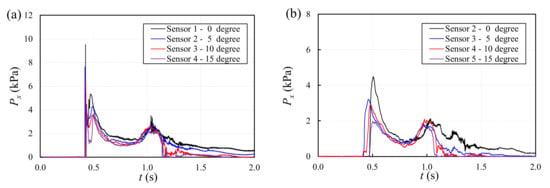
Figure 7.
Time- history of the dynamic pressure recorded by the: (a) first transducer, (b) second transducer when counted from the bed in each slope case.
Due to the slope effects, it can be observed that peak pressure at the initial impact from lowest transducers decreased when the slope increased, with peak value of 9.36 kPa, 7.62 kPa, 6.15 kPa, and 4.48 kPa in the horizontal, 5-, 10- and 15-degree cases separately. For the inclined slopes, the initial impact time on the wall was slower than recorded the horizontal case and was delayed by 0.01 s, 0.017 s and 0.025 s in sequence. The pressure difference in the second spike after the first peak also decreased due to the slope effect, and dropped from 6.74 kPa in the horizontal bed case to 4.93 kPa, 3.623 kPa and 3.24 kPa in the 5-, 10-, and 15-degree cases, respectively. During the relatively steady plateau period between 0.6 s–0.9 s, the dynamic pressure from the horizontal bed case was slightly higher than that recorded for the inclined cases. However, for the second peak recorded at approximately 1.05 s, when the runup wave was falling back onto the slope, the dynamic pressures for all slope cases were within a small range from each other, except for a few higher values in the horizontal case, with a difference of approximately 0.6 kPa. After the second peak, the dynamic pressure gradually approached the value of the hydrostatic pressure of 0.43 kPa for the horizontal case and further decreased to a lesser value of 0.23 kPa for the 5-degree slope. Meanwhile, the pressure value finally decreased to zero for the 10- and 15-degree slopes as no water remained on these two slopes.
The time-history of the dynamic pressure from the second lowest transducers, i.e., transducers 2, 3, 4 and 5 in the 0-, 5-, 10-, and 15-degree cases, respectively, are shown in Figure 7b. The pressure value reached its maximum at the initial impact, with 4.41 kPa in the horizontal bed case, 3.32 kPa, 2.79 kPa, and 1.98 kPa in the 5-, 10- and 15-degree bed slope cases, in sequence. Although the slope deaccelerated the wave propagation, the arrival time of the first peak pressure at the second lowest transducer in the 5- and 10-degree case was 0.05 s and 0.02 s shorter than that measured in horizontal bed case, respectively; the initial impact occurred at a similar time as the 15-degree case, that is, approximately 0.5 s. Similar to the lowest transducers, the pressure values at the second peak were close to each other, varying in a small range from 1.93 kPa to 2.03 kPa. After the second peak, the pressure time-history of the horizontal bed case decreased gradually from 1.04 s to 1.45 s, then varied for some time around the hydrostatic pressure. However, the pressure for the cases of the inclined beds dropped quickly after the second peak, then approached zero until 2.0 s.
4.4. Dynamic Pressure in Transducers at Same Level
Due to the bed elevation, dynamic pressure from the transducers located at the same level with respect to the horizontal bed resulted in discrepancies both the horizontal and inclined cases, as shown in Figure 8.
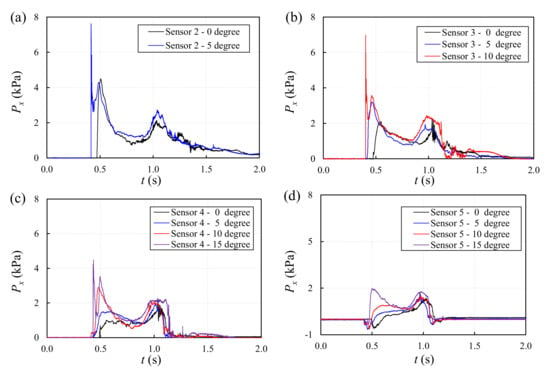
Figure 8.
Comparison of the dynamic pressure from transducers at same level: (a) transducer 2 in 0- and 5-degree cases; (b) transducer 3 in 0-, 5-and 10-degree cases; (c) transducer 4 in 0-, 5-, 10- and 15-degree cases; (d) transducer 5 in 0-, 5-, 10- and 15-degree cases.
To begin with, the transducer lowest to the slope exhibited a higher pressure than in other cases, i.e., transducer 3 in the 10-degree case exhibited higher pressure values than the corresponding transducer in the 0-and 5-degree cases, as indicated in Figure 8b. Furthermore, the initial impact on the transducer located at the same level occurred earlier in the steeper case, which demonstrated that the steeper slope could lead to a faster wave arrival at a certain location. For instance, the initial impact on transducer 3 in the 10-degree case was 0.02 s and 0.06 s ahead of the impact time in the 5- and 0-degree cases, respectively, as demonstrated in Figure 8b. Due to a greater volume of water accumulating onto the slope instead of running up higher, the duration of pressure peak around the second peak was longer in the steeper slope case, i.e., the pressure peaks which occurred at approximately 1.05 s in the 15-degree case was wider than the peaks for the 10-, 5-degree and horizontal bed cases.
Negative pressure was registered by the top transducer 5 at approximately 0.5 s in all cases, as illustrated in Figure 8d. It should be noticed that the maximum amplitude of negative pressure in the 5- and 10-degree cases were larger than the one observed for the horizontal case, −0.65 kPa and −0.62 kPa, respectively, when compared with 0.59 kPa, while a smaller negative pressure peak was observed in the 15-degree slope: −0.39 kPa. A reasonable explanation could be given that the wave propagated faster along the location of transducer 5 in the steeper bed slopes, which resulted in stronger suction effects that that observed in the 5- and 10-degree slopes.
4.5. Comparison of Impact Force by Experiments and Numerical Simulation
The estimated experimental impact forces were obtained by integrating the time history of the dynamic pressure for the 0-, 5-, 10- and 15-degree cases. The experimental force time-histories are presented in Figure 9, where they are compared with the results numerically calculated by OpenFOAM and DualSPHysics. Overall, the OpenFOAM better reproduced the force in horizontal case, whereas DualSPHysics returned better force time-history results for the sloped beds.
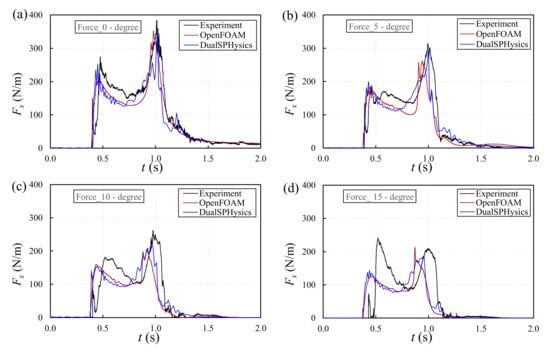
Figure 9.
Comparison of the time-history of the impact force on the vertical wall from experiment and numerical simulations using the OpenFOAM and DualSPHysics models: (a) 0-degree case; (b) 5-degree case; (c) 10-degree case; (d) 15-degree case.
In the horizontal bed case, the dynamic pressure of all five transducers were used in the calculation of the force. Good agreement was observed between the integrated experimental force and the numerically simulated forces, as shown in Figure 9a. Due to the pressure spike after initial impact, the overall integrated force in the horizontal bed case was lower than the numerical simulation results for the segment at approximately 0.4–0.5 s, and then increased and was 30 N/m higher than results of both OpenFOAM and DualSPHysics models from 0.5 s to 0.7 s. Next, good agreement was observed between the experimental data and numerical simulation before the second peak until the surge fell during 0.7 s to 1.2 s.
From the initial impact until the second force peak in the inclined cases, a similar trend can be observed on the time history of the hydrodynamic force obtained from the experimental tests and numerical simulations, but with discrepancies due to insufficient experimental pressure data involved in the calculation, as shown in Figure 9b–d. In the force calculation from experiments, higher values were obtained after the initial impact in the 5-degree slope, approximately 25 N/m larger than the numerical results. As the slope increased, the first force peak in the 10- and 15-degree cases became sharp and much higher than the numerical simulation, i.e., 50 N/m and 120N/m higher, respectively. Afterwards, the force decreased and reached a short plateau period at approximately 0.8 s, with approximate values of 145 N/m, 100 N/m and 84 N/m in the 5-, 10- and 15-degree cases separately.
The force comparison presented in Figure 9 revealed that the maximum experimental impact force generated by the dam break wave occurred during the second peak at approximately 1.0 s when the surge fell back along the wall [36] instead of at the initial impact, with maximum values of 383.7 N/m, 314.5 N/m, 262.23 N/m in the 0-, 5-, and 10-degree slope, respectively.
To summarize, both OpenFOAM and DualSPHysics models could predict the impact force of a dam break wave with reasonable accuracy in terms of the time history data and particularly of its maximum values which is crucial from a practical point of view.
4.6. Comparison of Experimental Impact Force
The time-history of the resultant impact forces obtained by integrating experimental dynamic pressures for all cases are presented together in Figure 10.
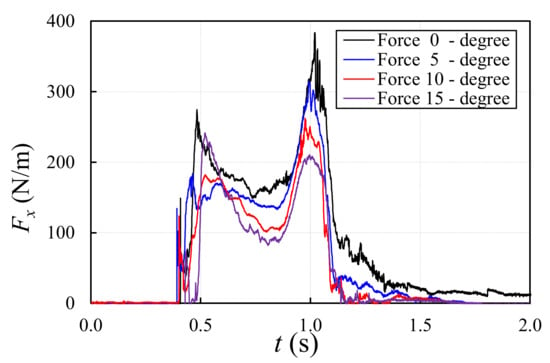
Figure 10.
Time-history of the impact force obtained from the integration of the experimental dynamic pressure.
Overall, the magnitude of the impact force decreased in steeper slope cases, except the overestimated first peak force at approximately 0.5 s for the 15-degree slope. Considering the numerical simulated force as 150 N/m at the first peak for the 15-degree slope, the maximum impact force at the first peak was 91.38 N/m, 104.4 N/m and 130.82 N/m lower than the horizontal case for the 5-, 10- and 15-degree slopes, respectively. The maximum impact force of the dam break wave occurring at approximately 1.0 s decreased by 18.04%, 31.66% and 45.19% in the 5-, 10- and 15-degree cases, respectively, when compared with the value of 383.73 N/m for the horizontal bed case. There was also a decrease in the force for the sloped beach cases during the plateau period between the first and second peak at approximately 1.0 s, which dropped by an average of 20 N/m, 50 N/m and 65 N/m from the 5- to 15-degree cases when compared with the horizontal bed case. In addition to the numerical comparison, the integrated force in the horizontal bed case was also compared with the forces calculated using the provisions of SMBTR [15] and ASCE-7/22 [20] to evaluate the applicability of the simplified estimation method, as indicated in Figure 11.
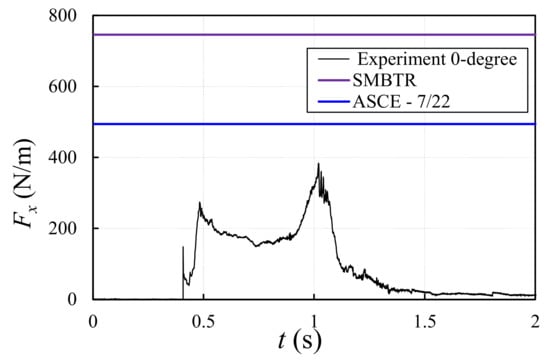
Figure 11.
Force Comparison between experimental time-history of the force and the value calculated using the provisions of ASCE-7/22 and SMBTR.
4.7. Force Reduction Factor
To investigate the relation between force, decrease and bed slope, the decrease ratio in Section 4.6 was defined as a dimensionless reduction factor , together with the tangent values of bed slope presented in Figure 12.
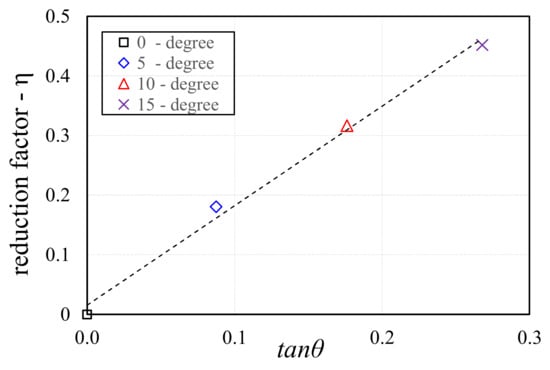
Figure 12.
Relation of impact force reduction factor and tangent value of bed slopes.
A perfect linear fitness can be obtained between the reduction factor and the tangent values of bed slopes, which demonstrated that the reduction factor can be calculated by the formula of slope. In order to involve the scale effects, the dimensionless reduction factor, can be expressed by equation:
where is the length between the reservoir and the vertical wall, is the initial impoundment depth, is the bed slope.
5. Discussion
The present study was conducted to investigate the slope effects on the hydrodynamic loading generated by a dam break flow impact on a vertical wall in terms of dynamic pressure and integrated impact force, using an experimental approach and numerical modeling. In previous experimental work on the dam-break flow on a horizontal bed, the time history of the dynamic pressure was shown to be similar and consistent with the previous physical tests [4,13,41]. Unlike the previous experimental research [4] and the numerical study in this paper, negative pressure was qualitatively monitored by transducer 5 in all tests. This is attributed to the negative pressure (“suction”) effects of the rapidly running up surge.
In the previous research on tsunami-like waves on structures, the horizontal impact force initially increased to a peak value then gradually decreased for the case of slender structures [8], while further steadily fluctuating since the impact was observed for the partially-blocking structure [10,42]. However, in this study, the horizontal impact force first increased to the first smaller peak value, then further decreased and held steady in a short plateau area, followed by the s second peak, and finally decreased to zero along with the wave after it receded. This observation revealed that the pattern of the interaction between the dam break wave and fully-blocking structure was different than that observed for the case of slender structures [8] or of the partially-blocking ones [10,42].
The hydrodynamic force comparison study proved that the simplified force -integrated formula could predict the peak value of the impact force, for both the propagation of the bore over the horizontal and inclined beach slopes. When compared with the maximum impact force prescribed by the provisions of SMBTR and ASCE-7/22, it was shown that both the SMNTR and ASCE-7/22 return a conservative force calculation. By comparison, ASCE-7/22 exhibited a maximum force closer to the maximum experimental force in this study, while the force calculated using the SMBTR was almost twice as large as the experimentally-determined force.
To consider the scale effects, the dimensionless factor, was proposed and presented with its calculation equation, which is similar to the surf similarity parameter [43,44]. This reduction factor was first presented in dam-break research to estimate the slope effects on the maximum impact force. It should be noted that the equation was derived based on the experimental data with limited number of slopes and one bed length. Future study should be carried out to consider different bed lengths and slopes to further investigate and develop a potential equation to be adapted to wider situations, i.e., consider the bed and slope roughness caused by amors [43,44].
This study provided a simplified methodology to predict the impact force on a fully-flow blocking fixed structure wall by using experimental observations and numerical modeling. It should be noticed that the discrepancies between the force determined from experiments and that from the numerical simulations were mainly caused by insufficient spatially distributed pressure data, a fact more obvious in the sloped beach cases. Thus, the experiments can be improved by installing more closely spaced pressure transducers on the wall, something which would lead to more detailed spatial distribution of the dynamic pressure. To better validate the force calculation method in current research, a specifically designed force load cell can be installed at the wall bottom to measure and record more components of hydrodynamic loading, i.e., force and moments in all directions [10,42,45]. Furthermore, regarding the current experiment, conducting it in a longer tank, employing beaches with different slopes and bed roughness, as well as investigating the scale effects on the experimental results should be taken into consideration in future studies.
6. Conclusions
Beach slope effects on the hydrodynamic loading generated by a tsunami-like bore onto a fully-blocking flow wall was investigated in this study via both experimental monitoring and numerical simulations using two models: OpenFOAM and DualSPHysics. The experimental dynamic pressure and the integrated impact force were compared with the numerical simulation, and two of the existing design codes for the latter. A dimensionless reduction factor was first presented to estimate the slope effects on the impact force of dam-break flow. The conclusions are summarized as follows:
- Good agreement between the experimental dynamic pressure and the numerically-calculated using by OpenFOAM and DualSPHysics was observed. This demonstrated that the recorded pressure data by miniatured transducers was reliable. The pressure comparison between the first and second lowest transducers showed that the slope decreased the maximum value of the first peak pressure whereas the pressure values around the second peak were close in magnitude. Furthermore, the slope increased the dynamic pressure of the transducers located at the same level when compared with the gentler slope cases;
- The force comparison between the experimental data and the numerical results demonstrated that the proposed simplified force estimation method and formula can adequately predict the impact force exerted over the entire wall area by integrating the dynamic pressure data;
- The experimental force comparison revealed that the slope reduced the impact force of exerted on the vertical wall. Furthermore, the experimental results exhibited that dynamic pressure exerted at lower levels plays a significant role on the magnitude of the peak impact force. Thus, it can be feasible to predict the impact force of dam-break wave by installing limited pressure transducers on the lower area of the infrastructure wall;
- Regarding the trends and maximum values of impact force between experiments and numerical simulation, the good agreement demonstrated the feasibility of the simplified calculation methodology for the calculation of horizontal resultant force. However, it was shown that the maximum design forces prescribed by the provisions of ASCE-7/22 and SMBTR are conservative;
- A linear fitness was demonstrated between the force reduction ratios and tangent values of bed slopes, which demonstrated to be a reasonable method for developing an equation for the reduction factor. The dimensionless reduction factor and its formula obtained in this study demonstrated a new approach in the hydrodynamic loading study of dam-break flow, which could be extended to other different situations.
The experimental results, numerical simulation and findings of this study can be of assistance to coastal engineering in the case where the estimation of impact force due to tsunami inundation on infrastructure and slope effects needs to be taken into consideration.
Author Contributions
Funding acquisition, I.N. and A.M.; project concept: I.N., A.M., S.L. and A.H.A.; writing—original draft preparation, S.L.; writing—review and editing, I.N., A.M. and A.H.A. All authors have read and agreed to the published version of the manuscript.
Funding
This work was funded by the Natural Science and Engineering Research Council of Canada (NSERC Discovery Grants) of Ioan Nistor (210282) and Majid Mohammadian (210717). The first author received a scholarship from the China Scholarship Council (CSC, 201606060131), which is gratefully acknowledged.
Institutional Review Board Statement
Not applicable.
Informed Consent Statement
Not applicable.
Data Availability Statement
The data presented in this study are available on request from the corresponding author.
Conflicts of Interest
The authors declare no conflict of interest.
References
- Lauber, G.; Hager, W.H. Experiments to dambreak wave: Horizontal channel. J. Hydraul. Res. 1998, 36, 291–307. [Google Scholar] [CrossRef]
- Kleefsman, K.M.T.; Fekken, G.; Veldman, A.E.P.; Iwanowski, B.; Buchner, B. A Volume-of-Fluid based simulation method for wave impact problems. J. Comput. Phys. 2005, 206, 363–393. [Google Scholar] [CrossRef]
- Lee, T.H.; Zhou, Z.Q.; Cao, Y.S. Numerical simulations of hydraulic jumps in water sloshing and water impact. J. Fluids Eng. 2002, 124, 215–226. [Google Scholar] [CrossRef]
- Lobovsky, L.; Botia-Vera, E.; Castellana, F.; Mas-Soler, J.; Souto-Iglesias, A. Experimental investigation of dynamic pressure loads during dam break. J. Fluids Struct. 2014, 48, 407–434. [Google Scholar] [CrossRef]
- Zhou, Z.Q.; Kat, J.O.D.; Buchner, B. A nonlinear 3D approach to simulate green water dynamics on deck. In Proceedings of the 7th International Conference on Numerical Ship Hydrodynamics, Nantes, France, 31 December 1998. [Google Scholar]
- Lu, S.X.; Liu, H.J.; Deng, X.H. An Experimental Study of the Run-Up Process of Breaking Bores Generated by Dam-Break Under Dry- and Wet-Bed Conditions. J. Earthq. Tsunami 2018, 12, 1840005. [Google Scholar] [CrossRef]
- Hu, C.H.; Sueyoshi, M. Numerical Simulation and Experiment on Dam Break Problem. J. Mar. Sci. Appl. 2010, 9, 109–114. [Google Scholar] [CrossRef]
- Nouri, Y.; Nistor, I.; Palermo, D.; Cornett, A. Experimental Investigation of Tsunami Impact on Free Standing Structures. Coast. Eng. J. 2010, 52, 43–70. [Google Scholar] [CrossRef]
- St-Germain, P.; Nistor, I.; Townsend, R. Numerical modeling of tsunami-induced hydrodynamic forces on onshore structures using SPH. In Proceedings of the 33rd International Conference on Coastal Engineering, Santander, Spain, 1–6 July 2012; ASCE: Reston, VA, USA, 2012. [Google Scholar]
- Wuthrich, D.; Pfister, M.; Nistor, I.; Schleiss, A.J. Experimental study on the hydrodynamic impact of tsunami-like waves against impervious free-standing buildings. Coast. Eng. J. 2018, 60, 180–199. [Google Scholar] [CrossRef]
- Wemmenhove, R.; Gladsø, R.; Iwanowski, B.; Lefranc, M. Comparison of CFD Calculations and Experiment For the Dambreak Experiment With One Flexible Wall. In Proceedings of the 20th International Offshore and Polar Engineering Conference, Beijing, China, 20–25 June 2010; International Society of Offshore and Polar Engineers: Mountain View, CA, USA, 2010. [Google Scholar]
- Kihara, N.; Niida, Y.; Takabatake, D.; Kaida, H.; Shibayama, A.; Miyagawa, Y. Large-scale experiments on tsunami-induced pressure on a vertical tide wall. Coast. Eng. 2015, 99, 46–63. [Google Scholar] [CrossRef]
- Shen, J.; Wei, L.; Wu, D.; Liu, H.; Huangfu, J. Spatiotemporal characteristics of the dam-break induced surge pressure on a vertical wall. Coast. Eng. J. 2020, 62, 566–581. [Google Scholar] [CrossRef]
- Farvizi, F.; Melville, B.W.; Shamseldin, A.Y.; Shafiei, S. Experimental Investigation of Tsunami Bore-Induced Forces on Skewed Deck Girder Section Bridges. J. Hydraul. Eng. 2021, 147, 04021027. [Google Scholar] [CrossRef]
- Okada, T.; Sugano, T.; Ishikawa, T.; Ohgi, T.; Takai, S.; Hamabe, C. Structural Design Method of Buildings for Tsunami Resistance (SMBTR); The Building Center of Japan: Tokyo, Japan, 2005. [Google Scholar]
- Asakura, R.; Iwase, K.; Ikeya, T.; Takao, M.; Kaneto, K.; Fujii, N.; Omori, M. An Experimental Study on Wave Force Acting on On-Shore Structures due to Overflowing Tsunamis. In Proceedings of the 28th International Conference on Coastal Engineering, Cardiff, UK, 7–12 July 2002. [Google Scholar]
- City and County of Honolulu Building Code (CCH); Department of Planning and Permitting of Honolulu Hawaii: Honolulu, HI, USA, 2000; Chapter 16, Article 11.
- Stolle, J.; Takabatake, T.; Nistor, I.; Mikami, T.; Nishizaki, S.; Hamano, G.; Ishii, H.; Shibayama, T.; Goseberg, N.; Petriu, E. Experimental investigation of debris damming loads under transient supercritical flow conditions. Coast. Eng. 2018, 139, 16–31. [Google Scholar] [CrossRef]
- Wuthrich, D.; Pfister, M.; Schleiss, A.J. Effect of bed roughness on tsunami-like waves and induced loads on buildings. Coast. Eng. 2019, 152, 103508. [Google Scholar] [CrossRef]
- ASCE. Minimum Design Loads and Associated Criteria for Buildings and Other Structures; ASCE/SEI 7-16; American Society of Civil Engineers: Reston, VA, USA, 2022; Chapter 6. [Google Scholar]
- Liu, S.; Nistor, I.; Mohammadian, M.; Azimi, A. Experimental Investigation of Beach Slope Effects on the Kinemactic Behaviors of Dam Break Flow. In Proceedings of the 39th IAHR World Congress, Granada, Spain, 19–24 June 2022. [Google Scholar]
- Sánchez-Cordero, E.; Gómez, M.; Bladé, E. Three-dimensional numerical analysis of a dam-break using OpenFOAM. Proc. Inst. Syst. Program. RAS 2017, 29, 311–320. [Google Scholar] [CrossRef][Green Version]
- Xie, P.; Chu, V.H. The forces of tsunami waves on a vertical wall and on a structure of finite width. Coast. Eng. 2019, 149, 65–80. [Google Scholar] [CrossRef]
- Nguyen, V.-B.; Do, Q.-V.; Pham, V.-S. An OpenFOAM solver for multiphase and turbulent flow. Phy. Fluids 2020, 32, 043303. [Google Scholar] [CrossRef]
- Larocque, L.A.; Imran, J.; Chaudhry, M.H. 3D numerical simulation of partial breach dam-break flow using the LES andk–ϵ turbulence models. J. Hydraul. Res. 2013, 51, 145–157. [Google Scholar] [CrossRef]
- Evtushok, G.Y.; Boiko, A.V.; Yakovenko, S.N.; Yakovenko, E.E.; Chang, K.C. Modification and verification of numerical algorithms for dam-break flow over a horizontal bed. J. Appl. Mech. Tech. Phys. 2021, 62, 255–265. [Google Scholar] [CrossRef]
- Peng, L.; Zhang, T.; Rong, Y.; Hu, C.; Feng, P. Numerical investigation of the impact of a dam-break induced flood on a structure. Ocean. Eng. 2021, 223, 108669. [Google Scholar] [CrossRef]
- Ming, F.R.; Zhang, A.M.; Cheng, H.; Sun, P.N. Numerical simulation of a damaged ship cabin flooding in transversal waves with Smoothed Particle Hydrodynamics method. Ocean. Eng. 2018, 165, 336–352. [Google Scholar] [CrossRef]
- Gomez-Gesteira, M.; Rogers, B.D.; Crespo, A.J.C.; Dalrymple, R.A.; Narayanaswamy, M.; Dominguez, J.M. SPHysics—Development of a free-surface fluid solver—Part 1: Theory and formulations. Comput. Geosci. 2012, 48, 289–299. [Google Scholar] [CrossRef]
- Altomare, C.; Crespo, A.J.C.; Domínguez, J.M.; Gómez-Gesteira, M.; Suzuki, T.; Verwaest, T. Applicability of Smoothed Particle Hydrodynamics for estimation of sea wave impact on coastal structures. Coast. Eng. 2015, 96, 1–12. [Google Scholar] [CrossRef]
- Lind, S.J.; Rogers, B.D.; Stansby, P.K. Review of smoothed particle hydrodynamics: Towards converged Lagrangian flow modelling. Proc. R. Soc. A 2020, 476, 20190801. [Google Scholar] [CrossRef]
- St-Germain, P.; Nistor, I.; Townsend, R.; Shibayama, T. Smoothed-Particle Hydrodynamics Numerical Modeling of Structures Impacted by Tsunami Bores. J. Waterw. Port Coast. Ocean. Eng. 2014, 140, 66–81. [Google Scholar] [CrossRef]
- Crespo, A.J.C.; Domínguez, J.M.; Rogers, B.D.; Gómez-Gesteira, M.; Longshaw, S.; Canelas, R.; Vacondio, R.; Barreiro, A.; García-Feal, O. DualSPHysics: Open-source parallel CFD solver based on Smoothed Particle Hydrodynamics (SPH). Comput. Phys. Commun. 2015, 187, 204–216. [Google Scholar] [CrossRef]
- English, A.; Domínguez, J.M.; Vacondio, R.; Crespo, A.J.C.; Stansby, P.K.; Lind, S.J.; Chiapponi, L.; Gómez-Gesteira, M. Modified dynamic boundary conditions (mDBC) for general-purpose smoothed particle hydrodynamics (SPH): Application to tank sloshing, dam break and fish pass problems. Comput. Part. Mech. 2021, 9, 911–925. [Google Scholar] [CrossRef]
- English, A.; Domínguez, J.M.; Vacondio, R.; Crespo, A.J.C.; Stansby, P.K.; Lind, S.J.; Gómez-Gesteira, M. Correction for Dynamic Boundary Conditions. In Proceedings of the 14th SPHERIC International Workshop, Exeter, UK, 25–27 June 2019. [Google Scholar]
- Liu, S.; Nistor, I.; Mohammadian, M.; Azimi, A. Experimental Investigation on the Impact of Dam-break Induced Surges on a Vertical Wall. Fluids 2022, 7, 258. [Google Scholar]
- Menter, F.R. Two-equation eddy-viscosity turbulence models for engineering applications. AIAA J. 1994, 32, 1598–1605. [Google Scholar] [CrossRef]
- Lopez-Jimenez, P.A.; Bayon-Barrachina, A. Numerical analysis of hydraulic jumps using OpenFOAM. J. Hydroinf. 2015, 17, 662–678. [Google Scholar]
- Romanova, D.; Ivanov, O.; Trifonov, V.; Ginzburg, N.; Korovina, D.; Ginzburg, B.; Koltunov, N.; Eglit, M.; Strijhak, S. Calibration of the k-ω SST Turbulence Model for Free Surface Flows on Mountain Slopes Using an Experiment. Fluids 2022, 7, 111. [Google Scholar] [CrossRef]
- Monaghan, J.J. Simulating Free-Surface Flows with SPH. J. Comput. Phys. 1994, 110, 399–406. [Google Scholar] [CrossRef]
- Kamra, M.M.; Mohd, N.; Liu, C.; Sueyoshi, M.; Hu, C.H. Numerical and experimental investigation of three-dimensionality in the dam-break flow against a vertical wall. J. Hydrodyn. 2018, 30, 682–693. [Google Scholar] [CrossRef]
- Wuthrich, D.; Pfister, M.; Nistor, I.; Schleiss, A.J. Experimental study on forces exerted on buildings with openings due to extreme hydrodynamic events. Coast. Eng. 2018, 140, 72–86. [Google Scholar] [CrossRef]
- Safari Ghaleh, R.; Aminoroayaie Yamini, O.; Mousavi, S.H.; Kavianpour, M.R. Numerical Modeling of Failure Mechanisms in Articulated Concrete Block Mattress as a Sustainable Coastal Protection Structure. Sustainability 2021, 13, 12794. [Google Scholar] [CrossRef]
- Yamini, O.A.; Kavianpour, M.R.; Mousavi, S.H. Wave run-up and rundown on ACB Mats under granular and geotextile filters’ condition. Mar. Georesour. Geotechnol. 2017, 36, 895–906. [Google Scholar] [CrossRef]
- Wuthrich, D.; Pfister, M.; Nistor, I.; Schleiss, A.J. Effect of building overtopping on induced loads during extreme hydrodynamic events. J. Hydraul. Res. 2019, 58, 289–304. [Google Scholar] [CrossRef]
Publisher’s Note: MDPI stays neutral with regard to jurisdictional claims in published maps and institutional affiliations. |
© 2022 by the authors. Licensee MDPI, Basel, Switzerland. This article is an open access article distributed under the terms and conditions of the Creative Commons Attribution (CC BY) license (https://creativecommons.org/licenses/by/4.0/).