Article

Research on an All-Flow Velocity Control Strategy for a 120 kW Variable-Pitch Horizontal Axis Tidal Current Turbine

National Ocean Technology Center, Tianjin 300110, China
*
Author to whom correspondence should be addressed.
J. Mar. Sci. Eng. 2022, 10(11), 1578; https://doi.org/10.3390/jmse10111578
Submission received: 14 September 2022 / Revised: 11 October 2022 / Accepted: 21 October 2022 / Published: 25 October 2022
(This article belongs to the Topic Wind, Wave and Tidal Energy Technologies in China)

Abstract

:
Horizontal-axis tidal current turbines have considerable potential to harvest renewable energy from ocean tides. The pitch control system is a critical part of variable-pitch tidal turbines. Existing control strategies for tidal turbines mainly rely on flow measurement devices to obtain tidal velocities, which are costly and subject to many limitations in practical applications, making them unsuitable for small off-grid tidal turbines. In this paper, we propose a pitch control strategy for a 120 kW horizontal-axis tidal current turbine based on the output power of the generator. The torque of the turbine was calculated based on the blade element momentum theory, and a dynamic model of the tidal turbine was established. The dynamic characteristics of the turbine and generator were studied under various flow rates and pitch angles. On the basis of the characteristic analysis, the generating efficiency of the unit was improved under a low flow rate, and the output power was limited to a rated value under high-current velocity by regulating the pitch angle. Furthermore, a novel protection and start up strategy is proposed to protect the unit and make full use of the tidal energy when the tidal current velocity exceeds the limit value. We performed simulations, the obtained results of which demonstrate the effectiveness and advantages of the designed control strategies.

1. Introduction

Due to the excessive use of fossil fuels, the energy crisis and environmental problems have become increasingly prominent, threatening the survival and development of mankind [1]. In order to alleviate energy shortages and reduce environmental pollution, access to and utilization of renewable energy resources have been studied widely for decades. It is estimated that renewable energy can supply two-thirds of the total global energy demand [2]. As a type of clean and renewable energy, the development and utilization of marine energy have attracted increasing attention. At present, there are four main ways to obtain energy from the ocean for use by human beings, namely wind energy, tidal energy, wave energy, and ocean thermal energy [3,4,5,6]. Compared with other renewable energy sources, tidal current energy is considered to be one of the most promising energy sources, owing to its high predictability and reliability [7,8,9,10]. A tidal current turbine (TCT) is a power generation device that converts the kinetic energy of ocean currents into mechanical energy and then into electrical energy [11,12]. Among various tidal current energy devices, horizontal axis tidal current turbines (HATCTs) are the most common and promising concept, with principles is similar to those of wind power generation devices [13,14,15]. Because the density of sea water is much higher than that of air, tidal currents also have a higher energy density than that of wind. In other words, HATCTs can provide the same power generation at lower flow rates, so generation devices can be much smaller and weigh less than wind turbines [7].
The power generation ability of TCTs is closely related to the tidal current velocity. Turbines need to be controlled according to the flow velocity to achieve efficient power generation and to protect the device under conditions of high flow velocity [16,17,18]. At present, variable-speed operation is commonly used to achieve power control and maximum power point tracking (MPPT) [19]. Classic PI speed controllers have been widely used for MPPT control and power regulation due to their simple structure and reliability [20]. Variable-speed, variable-pitch (VSVP) tidal current turbines can change the lift on the blade by adjusting the pitch angle of the turbine blade, thereby changing the power generation efficiency of the generator and capturing bidirectional tides [21]. Compared with the fixed-pitch concept, tidal current turbines implementing the VSVP concept can realize low-flow velocity startup, expanding the working velocity range of the tidal current turbine and improving the energy capture performance. Moreover, the dynamic characteristics of fixed-pitch, stall-regulated TCTs generally require a more complex control system than TCTs implementing the VSVP concept. Ben Whitby developed controllers for a VSVP concept and a fixed-pitch, stall-regulated TCT and compared the performance of the two setups, reporting differences in dynamic stability. The variable-pitch TCT was stable, whereas the stall-regulated TCT exhibited unstable dynamics. For variable-pitch turbines, the selection of an appropriate pitch control strategy is very important and has therefore been the focus of many studies on tidal turbines [22]. Chen Zhen et al. designed a variable-pitch control system using the incremental PI control algorithm, which can adapt to bidirectional power flow and protect the power flow turbine [23]. Doubly fed induction generators (DFIGs) using integer-order PI(IOPI) controllers have been widely used in wind energy conversion systems and are considered suitable candidates for tidal current turbines. However, IOPI controllers performs poorly under complex operating conditions. Chen Hao et al. designed a fractional-order controller to solve the problems caused by parameter variations and achieve improved robustness and static error [24]. In addition to the control strategy, the geometric design of the turbine is also critical to TCTs. Most researchers have focused on the maximum power coefficient and the torque extracted from the turbines. However, the rigidity of blades and their fatigue durability, which are very important in practical applications, have received less attention. Ramin Alipour et al. introduced a parameter called the superiority of maximum power coefficient (SCPmax) to assess the usefulness of employing each airfoil based on the maximum power coefficient (CPmax), thrust coefficient, and the percentage of airfoil thickness to exhibit the utility of maximum performance against the probability of fatigue hazard [25].
Tidal flow velocity is a key input to the tidal turbine control system. Most tidal current turbines currently rely on flow measurement devices to obtain the tidal flow velocity [26]. J. Thomson et al. used an acoustic Doppler current profiler (ADCP) to analyze and obtain accurate current velocity information in a tidal current turbine [27]. However, the use of ADCP is much more costly than single-point flow velocity measurement, and it is difficult to guarantee the accuracy of the measured flow velocity when the sediment concentration of the sea current is high [28]. In addition, the traditional measurement method can only measure the flow velocity at a certain distance from the turbine, so it is difficult to reflect the accurate flow velocity at the impeller. Gu et al. proposed a tidal velocity preview (CVP) method to obtain accurate flow velocity values at the turbine and accordingly designed a pitch control strategy that can reduce the pitching action of the paddle and thus the mechanical wear of the sealing structure [28]. Considering the cost and the complexity of the system, neither self-capacitating nor stand-alone flow measurement devices are suitable for small and medium-sized tidal generators.
In this paper, we propose a pitch control strategy based on the power parameters of the generator output to avoid the difficulty associated with measuring flow velocity, achieving efficient energy capture of bidirectional tidal currents. An improved unit protection and startup strategy is adopted to improve the efficiency of the generator set when utilizing the high-velocity tidal current.
The remainder of this paper is organized as follows. In Section 2, a detailed description of a 120 kW two-blade HATCT is presented, and the mechanical structure and electrical parameters are described in detail. In Section 3, a dynamic computing model of the power generator is calculated based on the blade element momentum theory (BEMT). Furthermore, we establish a simulation model for HATCT performance analysis using BEMT. Then, the characteristics of the permanent magnet alternator are analyzed via a generator performance test. In Section 4, control characteristics of the turbine are analyzed, and the pitch control strategy is specified. Additionally, we propose a protection strategy for periods of strong flows based on the dynamic characteristics of the turbine. In Section 5, the control process of the generating unit is presented as a control flow chart. In Section 6, we report on the simulation of the control process and analyze the results. Finally, conclusions are presented in Section 7.

2. Tidal Current Generation System

The research object is a two-blade HATCT with a rated working flow velocity of 2.0 m/s. The power generation system includes three parts: a mechanical system, power system, and control system. The mechanical system of the device includes components such as the impeller, transmission, and generator. The diameter of the turbine is 10 m. The optimal tip speed ratio is 6.5, and the rated speed is 24.637 rpm. The transmission system adopts an increasing speed transmission scheme, with a speed increase ratio of 60.884. A planetary gear accelerator is adopted, and the transmission chain is a two-stage 2K-H planetary gear transmission with one-stage parallel shaft helical gear transmission. A 120 kW permanent magnet alternator is equipped, with a rated speed of 1500 rpm and a rated voltage of 690 V. The generator is connected with the output shaft of the transmission system through an elastic coupling. The composition of the tidal energy converting device is shown in Figure 1.
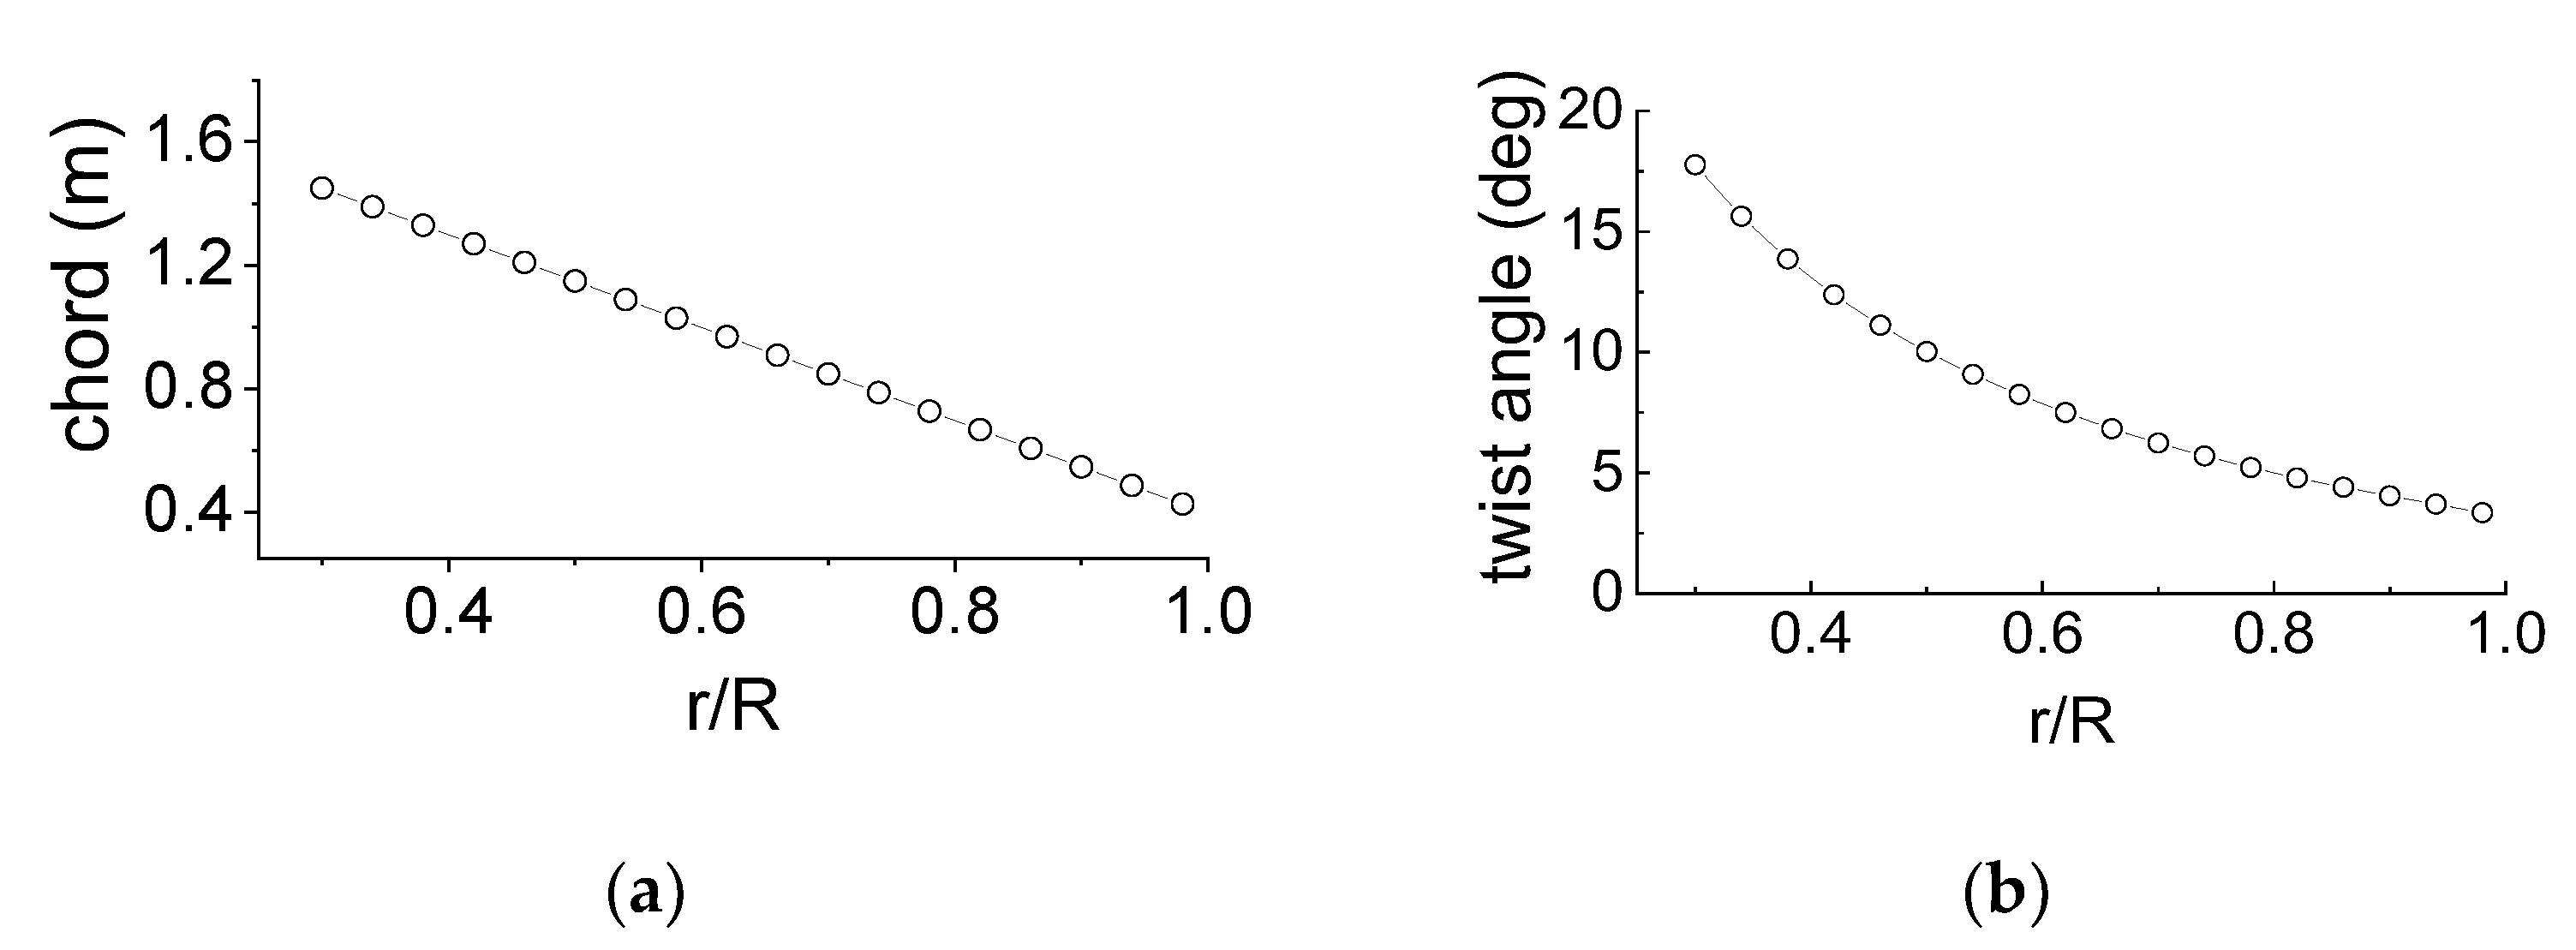
NACA63 series airfoils delay stall and are less sensitive to leading-edge roughness than the most other airfoil series [29]. The two-blade HATCT is based on the NACA63-424. Similar to the design of wind blades, the chord of each section of blades of four tidal turbines is linearized. The geometric parameters of the turbine’s blades are shown in Figure 2.

3. Computational Model

3.1. Dynamic Model

The HATCT is a single-degree-of-freedom rotating system, the driving torque is the torque of water flow acting on the impeller, and the working resistance torque is the friction resistance torque and the reaction torque of the generator. The torque of the turbine is calculated by the BEMT method, and the working resistance of the generator is obtained based on its resistance characteristic test curve. The dynamic calculation model of the generation device can be described as:
J + J a ε = T T z
T z = T w i + T f
n g = n i
where J is the moment of inertia of the unit, ε is the angular acceleration of the impeller, T is the torque of the turbine, Tz is the working resistance torque, Tw is the working resistance torque of the generator, Tf is the friction torque of the transmission system, I is the transmission ratio of the speed increaser (60.884), n is the rotating speed of the turbine, and ng is the generator speed. The moment of inertia of the unit includes the moment of inertia of the impeller, speed increaser, and generator. The moment of inertia converted to the impeller shaft is 23,750 kg·m2. Tf is approximately 0.65 kNm. Ja is the added mass of the blade, and its estimated value is 2.102 × 10⁵ kg·m2.

3.2. Simulation Model of the Turbine

Blade element momentum theory is widely used to design and predict the performance of HATCTs, which is based on a combination of momentum theory and blade element theory [30]. The simulation model for HATCT performance analysis was established using the BEMT method. The aerodynamic characteristics data of airfoil were calculated using Xfoil open 2D software. Based on the tidal speed, the pitch angle and the rotational speed of turbine, as well as the axial and tangential flow induction factor, can be calculated by iterative method according to Equations (4)–(12).
ϕ = arctan V n r 1 a 1 + b + θ + β
F t i p = 2 π cos 1 exp B 2 sin φ 1 x x
F h u b = 2 π cos 1 exp B 2 sin φ x x h u b x ,   F = F t i p F h u b
x = r R
σ r = B c 2 π r
C x = C L cos φ + C D sin φ
C y = C L sin ϕ C D cos ϕ
a F 1 a = σ r 4 sin 2 φ C x σ r C y 2 4 sin 2 φ
b F 1 + b = σ r C y 4 sin φ cos φ
where a is the axial flow induction factor; b is the tangential flow induction factor; φ is the inflow angle; θ is the mounting angle of the leaf element; β is the pitch angle of the blade; V is the tidal current speed; n is the rotation speed of the turbine; F is the loss coefficient; B is the number of blades; r is the radius of the local blade element; R is the rotor radius; σr is the local solidity; c is the local blade chord length; and CL and CD are the lift and drag coefficients, respectively.
According to a and b, the power coefficient and output torque of turbine can be obtained as:
C P = 8 λ 2 λ 0 λ b 1 a F λ r 3 d λ r
T = B j = 1 m 1 2 ρ V 2 1 a 2 s j C y 1 sin 2 ϕ
where Cp is the power coefficient, λ is the tip speed ratio (TSR), λr is the local tip speed ratio, ρ is the density of sea water, sj (=cjdr) is the local area of the blade element, and T is the torque of the rotor.

3.3. Experimental Verification

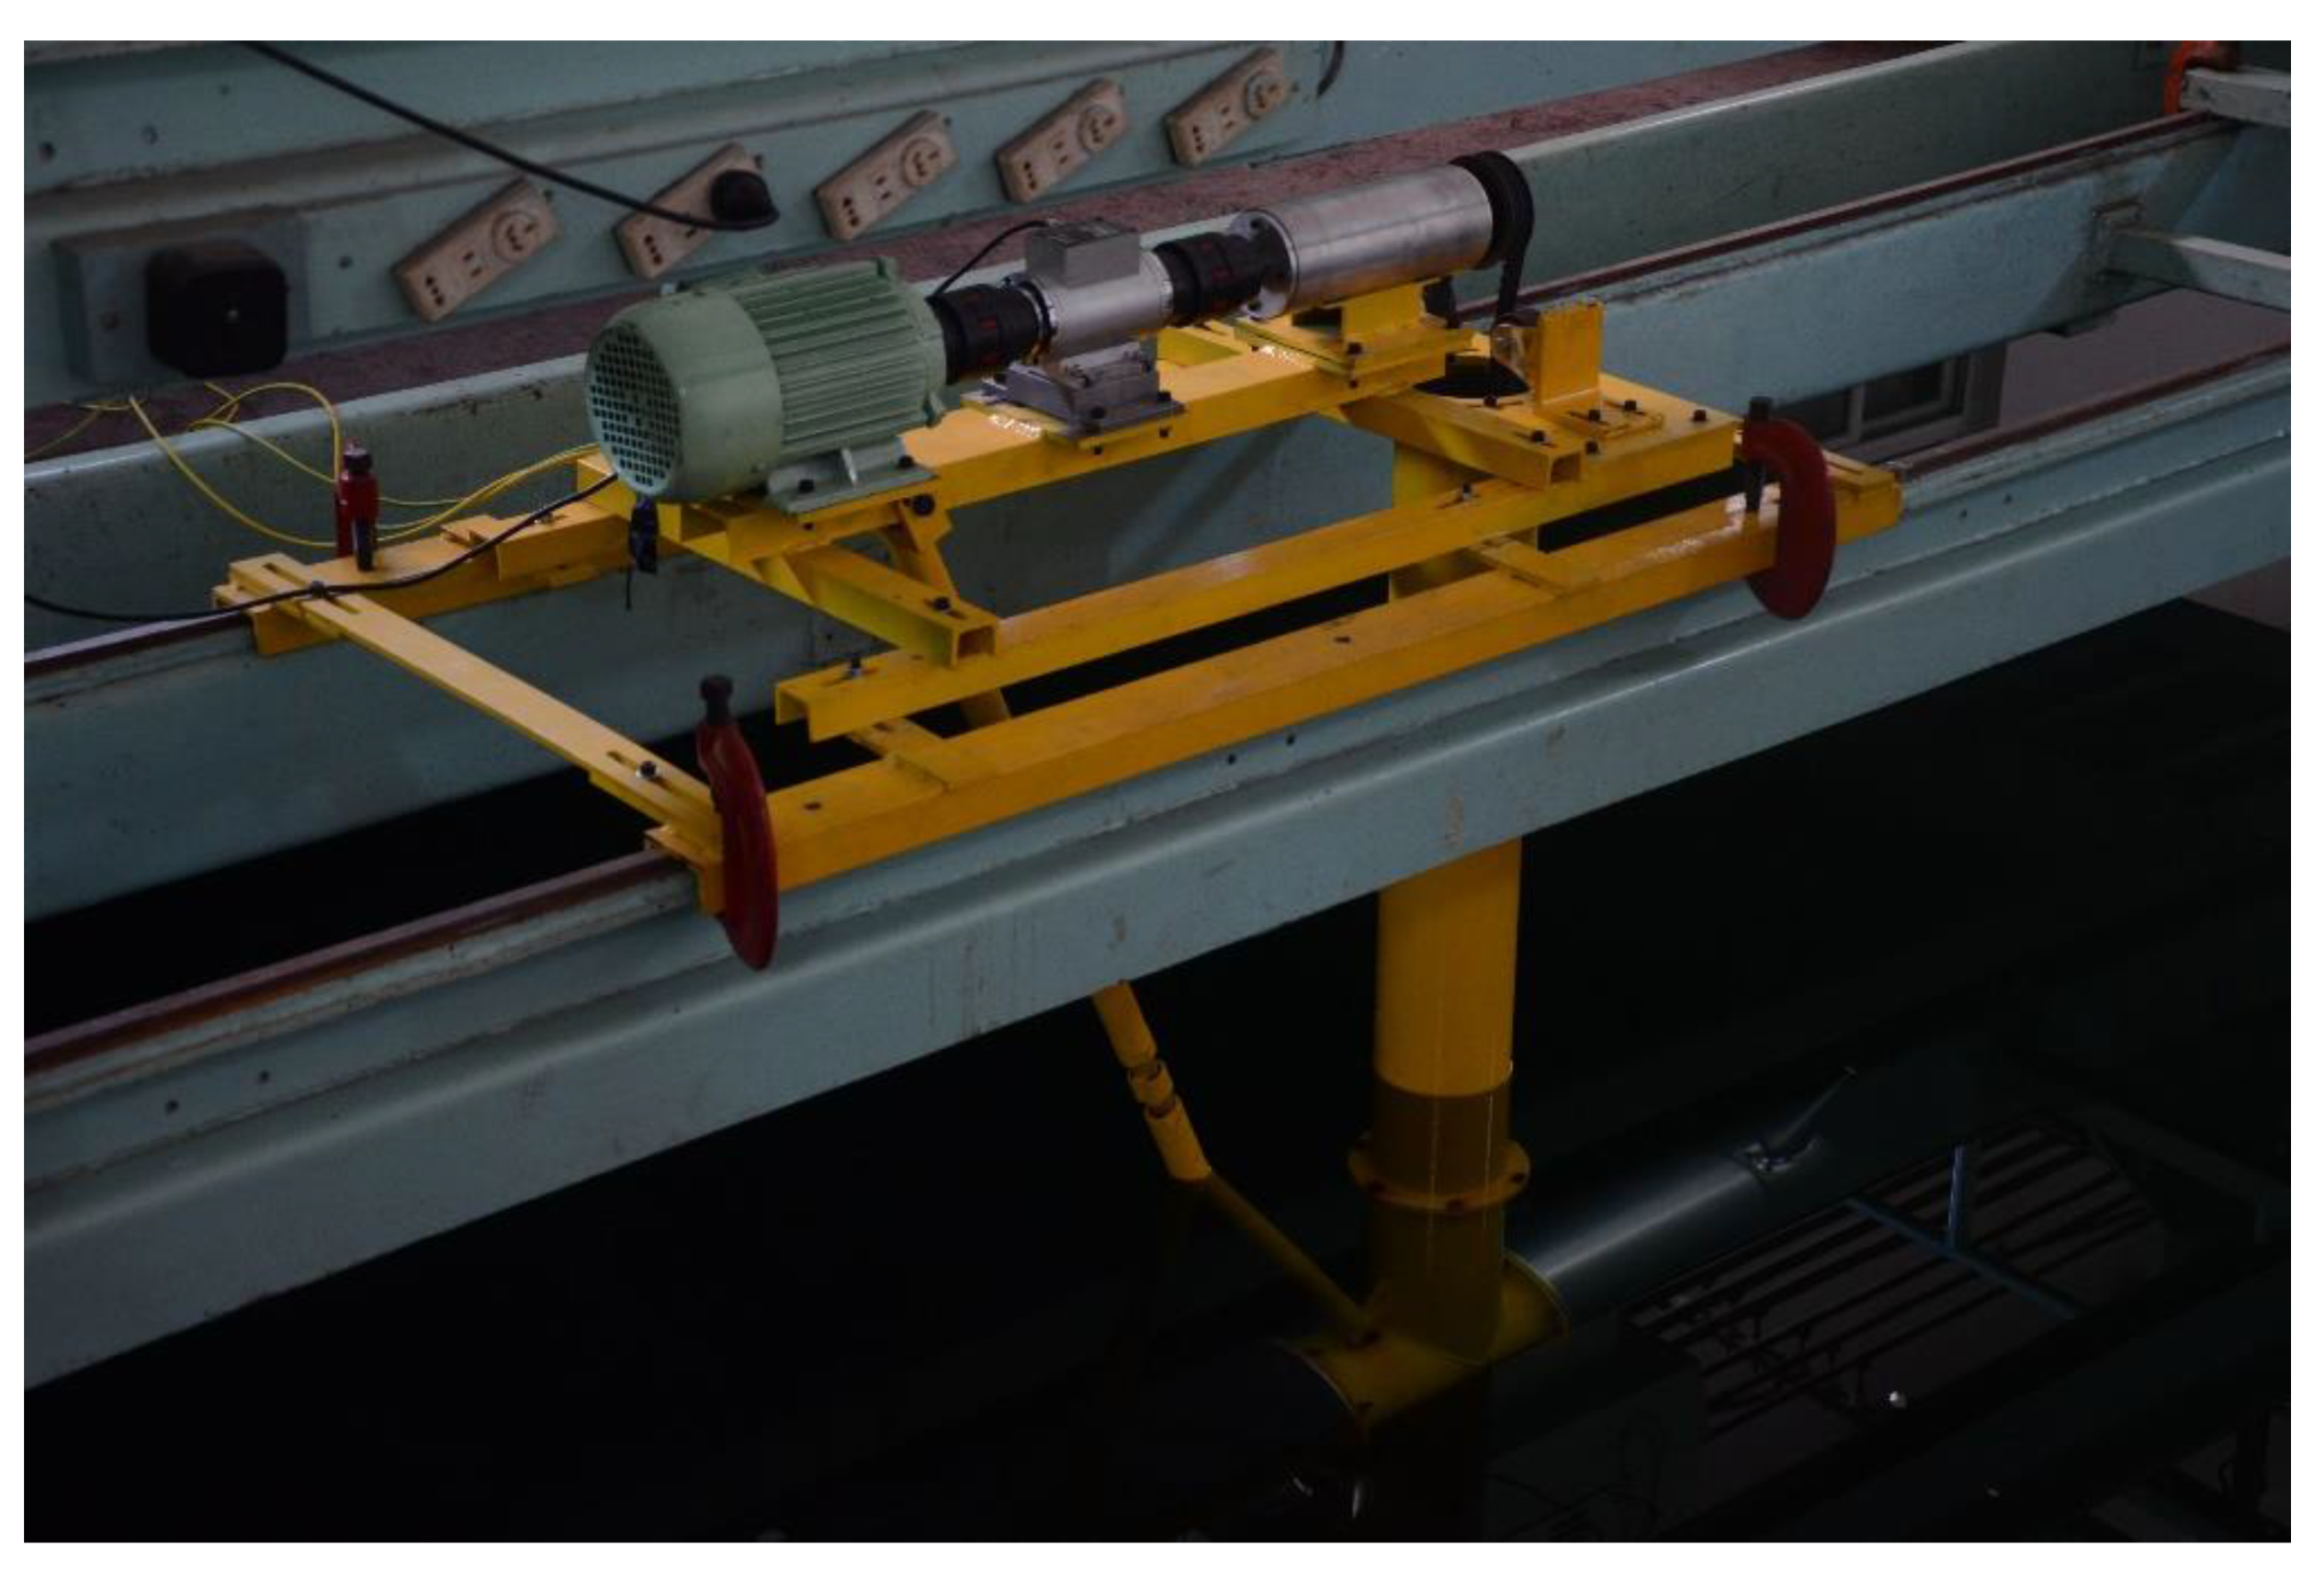
Measurements of the dynamic characteristics of an 800 mm rotor were carried out in a towing test tank with dimensions of 140.0 m × 7.0 m × 3.0 m (length × width × depth). The size ratio between the model and the prototype is 1:12.5. The experimental device is shown in Figure 3. The torque and rotational speed of the rotor were measured when the carriage was moving at a speed of 2.0 m/s.
The rotor was attached to a drive shaft which installed inside the hub, and the hub was fixed at the base of a vertical support tube. The diameter of the hub is 120 mm, and that of the vertical support tube is 150 mm. The diameter of the hub is about 15% of that of the rotor. An 800 W permanent magnet alternator was used as the load of the turbine, which was driven by a belt drive mechanism. Between the rotor and the generator, a torque sensor (ZH07-50B) was installed to measure the torque and revolution speed of the rotor. The maximal measuring range and torque of the sensor are 50 Nm and 5000 rpm, respectively. Through a rectifier, the alternating current output of the generator is converted to direct current, which is absorbed with 50 Ω rheostats. By adjusting the resistance value of the rheostat, the working torque of the generator can be changed to regulate the rotation rate of the turbine.
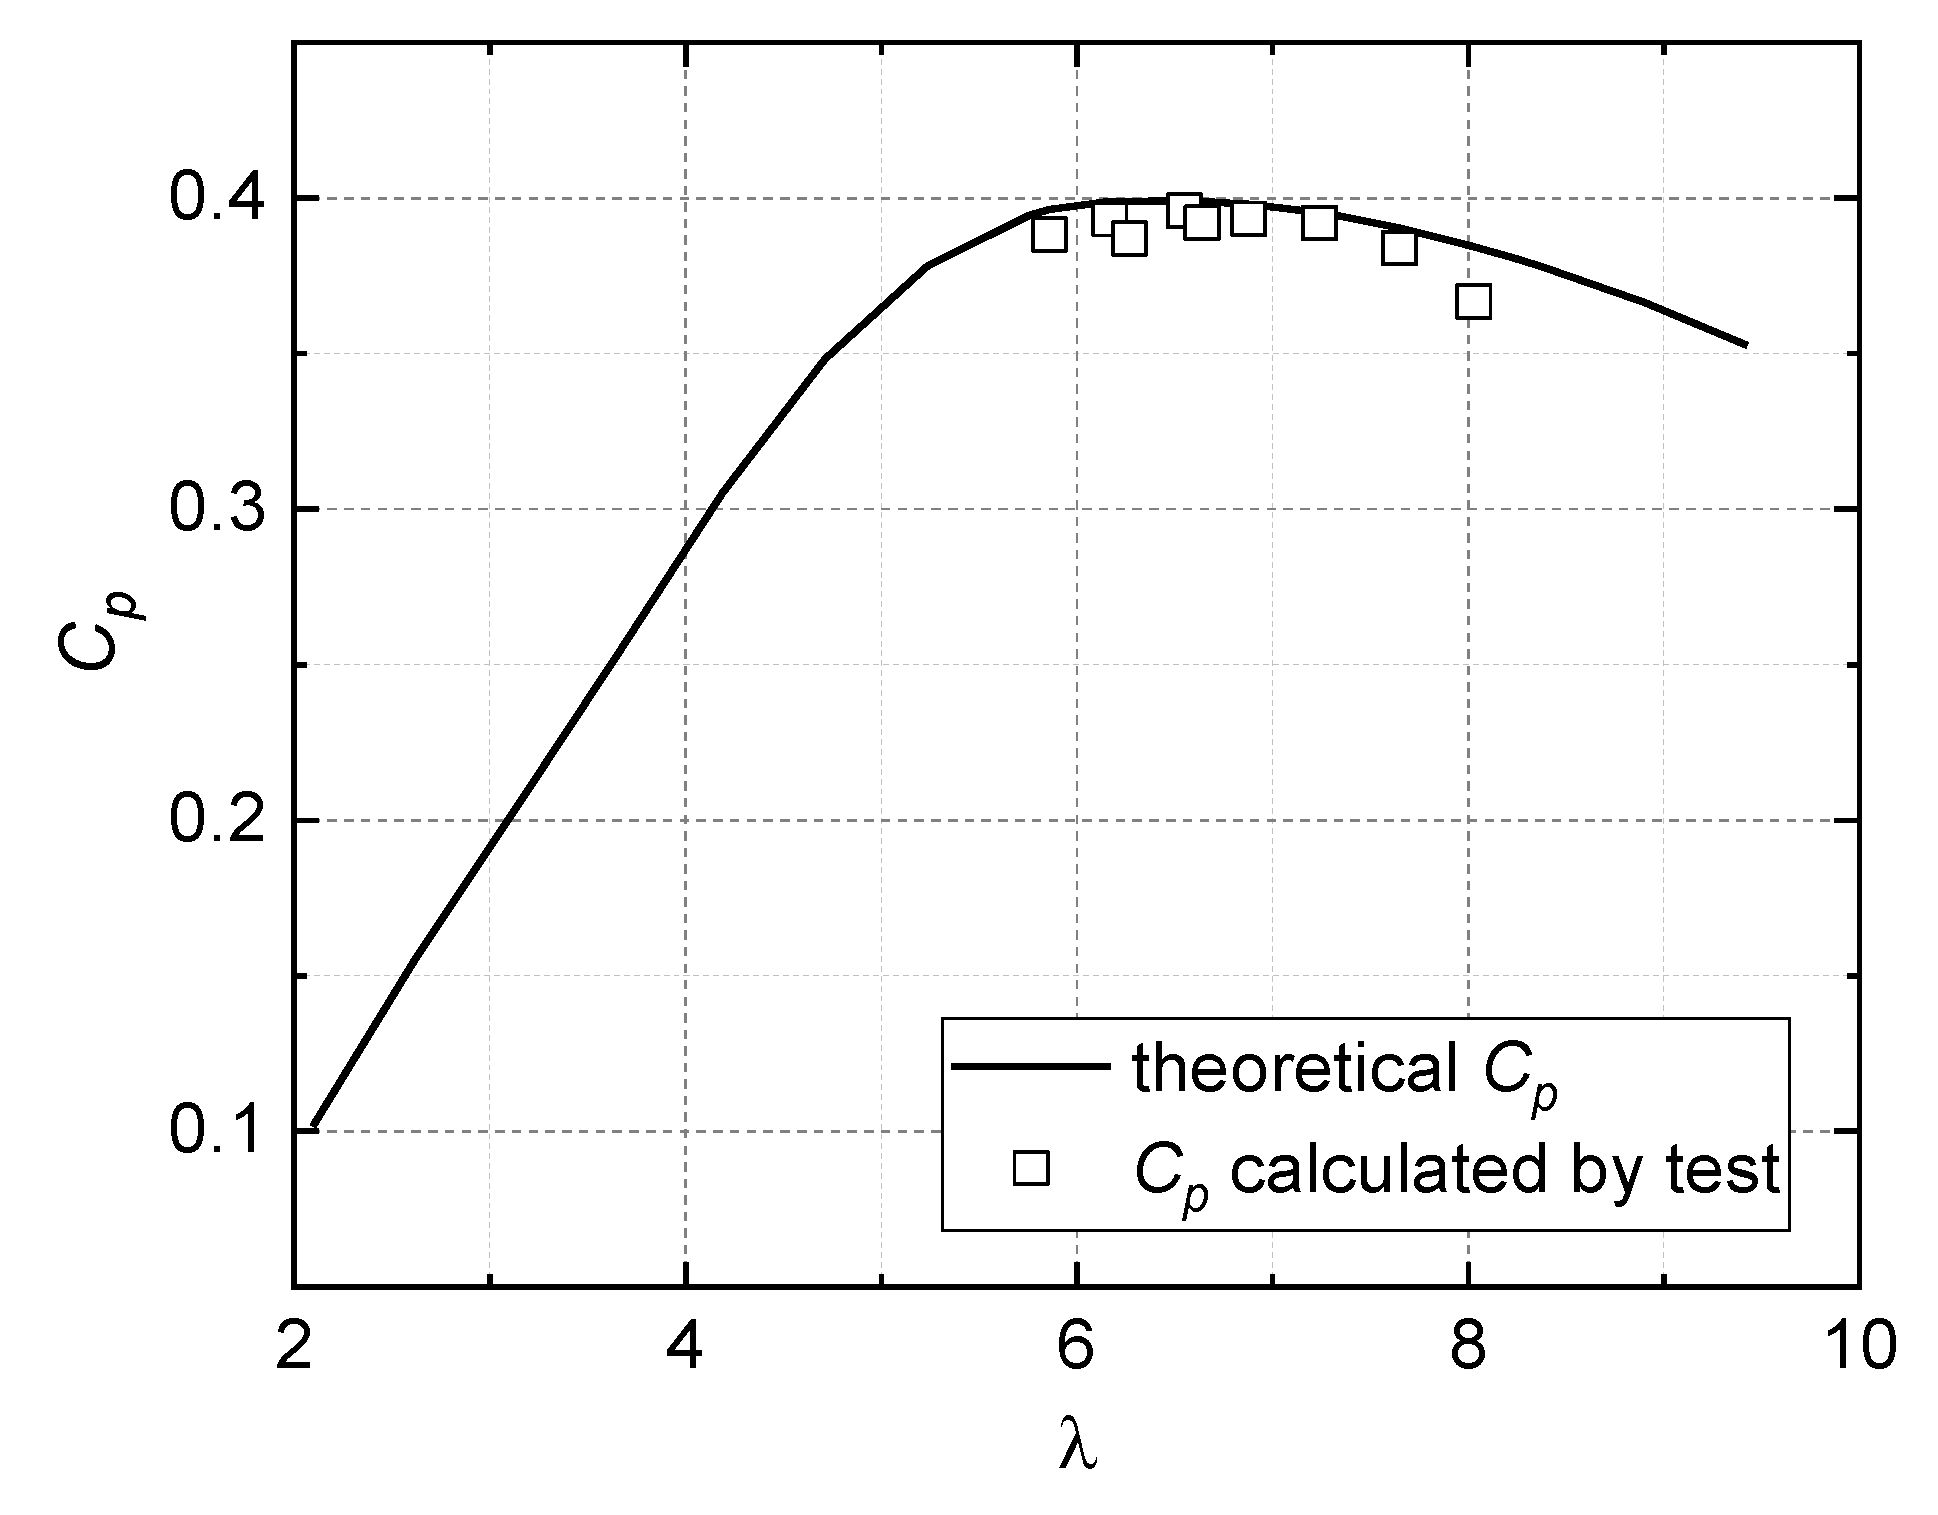
The computational results and measured data of Cp of the tested turbine are presented in Figure 4. At a design tip speed ratio of TSR = 6.5, the theoretical power coefficients Cp of the turbines is about 0.4, and the measured value of Cp is about 0.392. For TSR in the range of 5.5–7.5, the theoretical value of Cp is consistent with the measured value. The relative error falls in the range of 0.83~2.98%, whereas when TSR = 8, the computational model tends to overpredict, with a relative error of 4.58%.

3.4. Generator Characteristics

A driving test of the permanent magnet generator was carried out to measure the input–output characteristics. The driving test device is shown in Figure 5. A JY4-1000 torque sensor is set at the input end of the generator, and the data acquisition system comprises a DP900 AC variable-frequency power feedback dynamometer and an 8962C1 power analyzer.
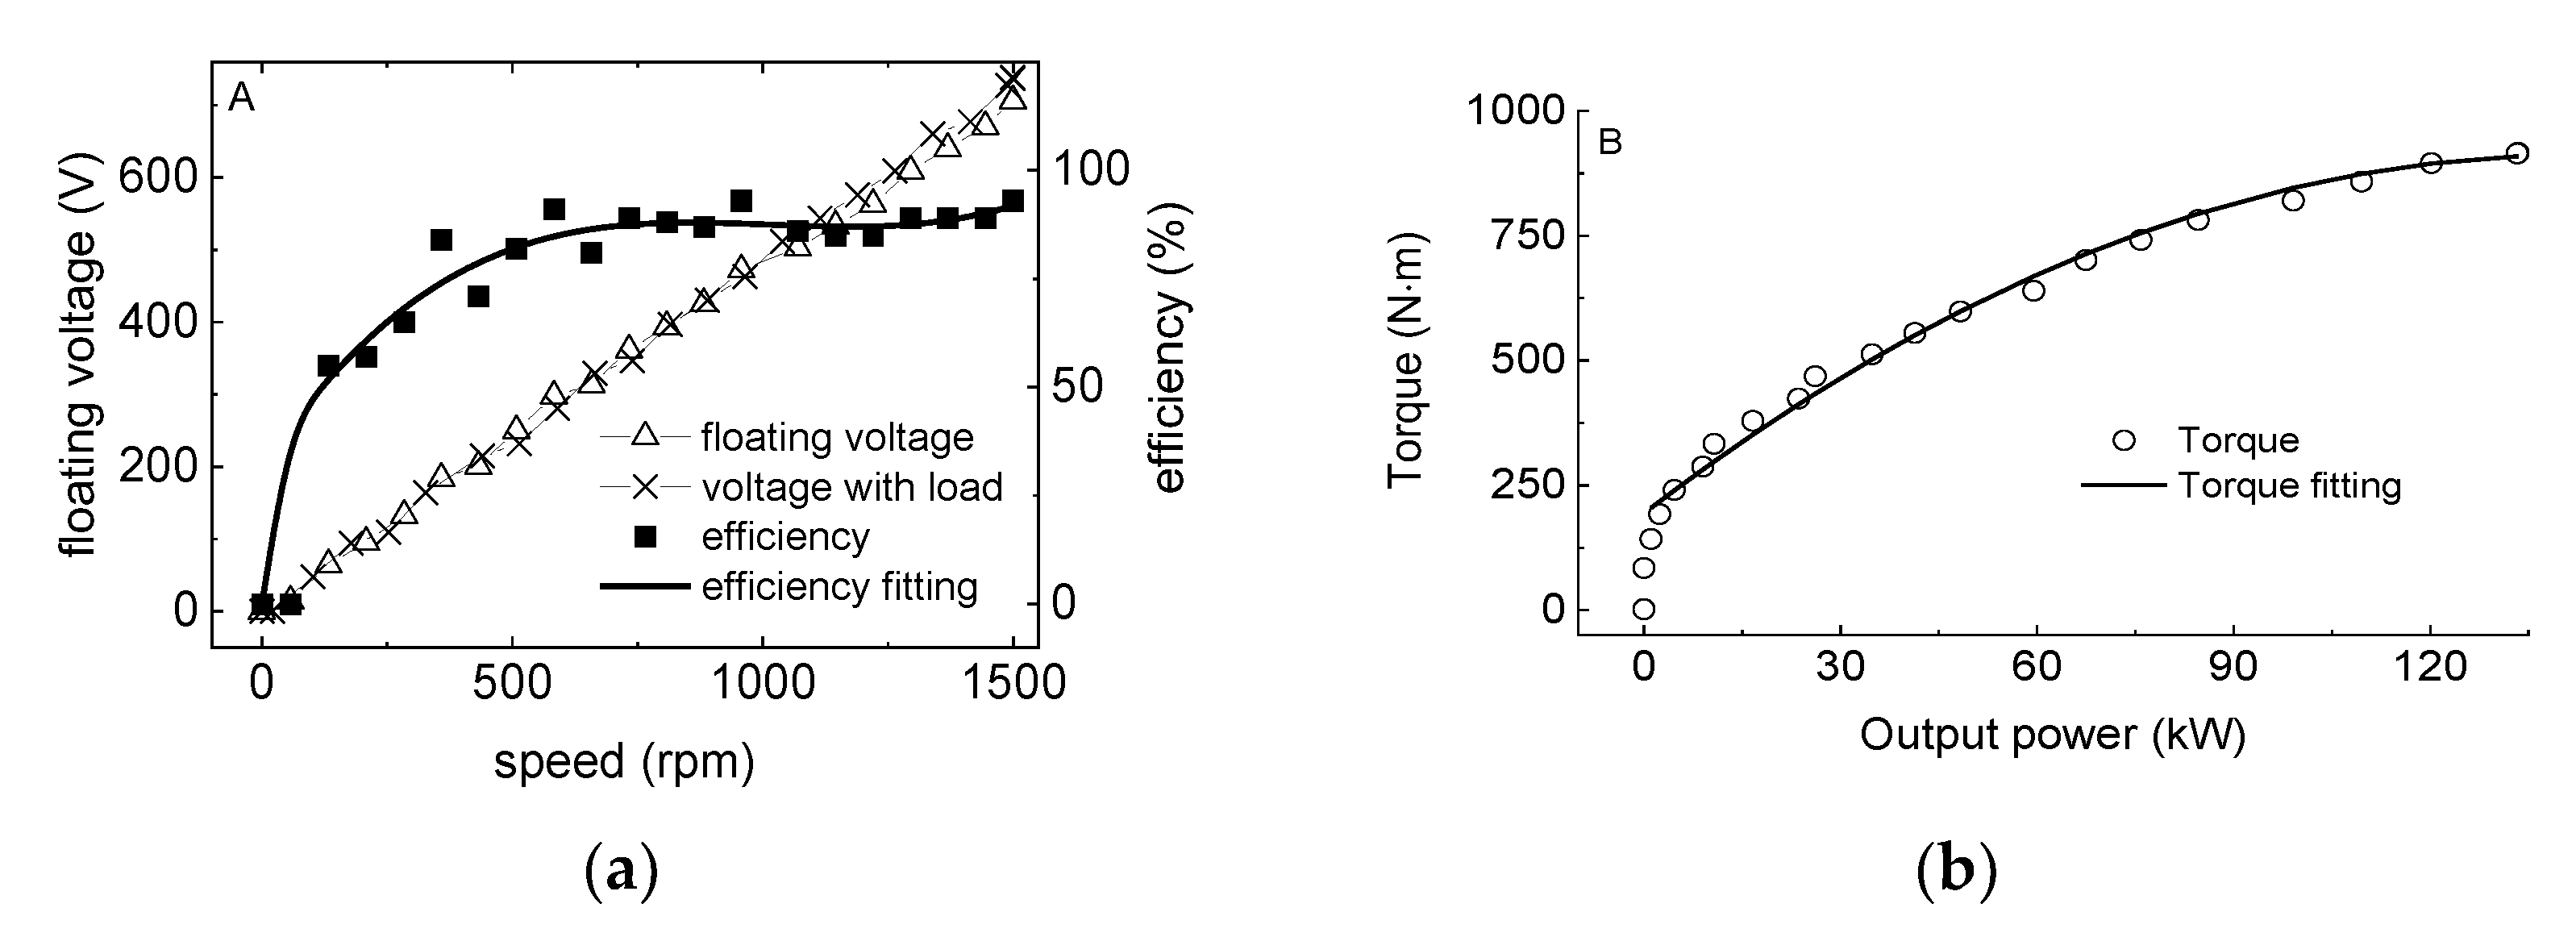
The results of the test are shown in Figure 6. Figure 6a shows the characteristic curves of generator speed vs. working efficiency and speed vs. voltage. Figure 6b shows the characteristic curves of generator output power vs. input torque. The output voltage of the generator shows a linear relationship with the speed. The floating voltage characteristic of the generator is very close to that of the voltage with load. When the speed exceeds 1000 rpm, the value of the floating voltage is slightly higher than that of voltage with load. The former can reach 738.3 v, and the later can reach 706.4 v at rated speed. The relationship between voltage and speed can be expressed as:
V o = 0.468 n g , V o = 0.49 n g
where Vo is the voltage of the generator with load, and V o is the floating voltage of the generator.
The working efficiency characteristic curve of the generator represents the maximum efficiency that the motor can achieve under each speed condition, and the characteristic curve presents severe nonlinearity. The working efficiency of the generator is about 57% at a speed of 200 rpm. When the rotating speed is lower than 200 rpm, the working efficiency of the generator decreases sharply with decreased speed. When the speed of the generator exceeds 500 rpm, the working efficiency of the generator is relatively high, and the average value is more than 85%. The working efficiency can reach 93% when working at rated speed. The relationship between the working efficiency of the generator and the speed can be expressed as:
η = 5.8 × 10 8 n g 3 0.00017635 n g 2 + 0.174 n g + 31.88
There is also a strong nonlinear relationship between the input torque and the optimal output power of the generator. According to the test results, their relationship can be expressed as:
T w = 0.0355 P 2 + 10.1 P + 193.7
where Tw is the working resistance moment of the generator, ng is the generator speed, and P is the output power of the generator.
The characteristics of the generator are used to establish the dynamic behavior of the turbine and the generator in the dynamic calculation model of the unit. When generating effective power output, the generator speed is determined by the rotating speed of the turbine, and the working efficiency of the generator is determined by the speed–efficiency characteristic relationship expressed by Equation (16). On this basis, the effective output power of the generator is determined by the output power of the turbine, the working efficiency of the transmission system, and the working efficiency of the generator.

4. Control Characteristic Analysis

4.1. Control Strategy for Low-Flow Stage

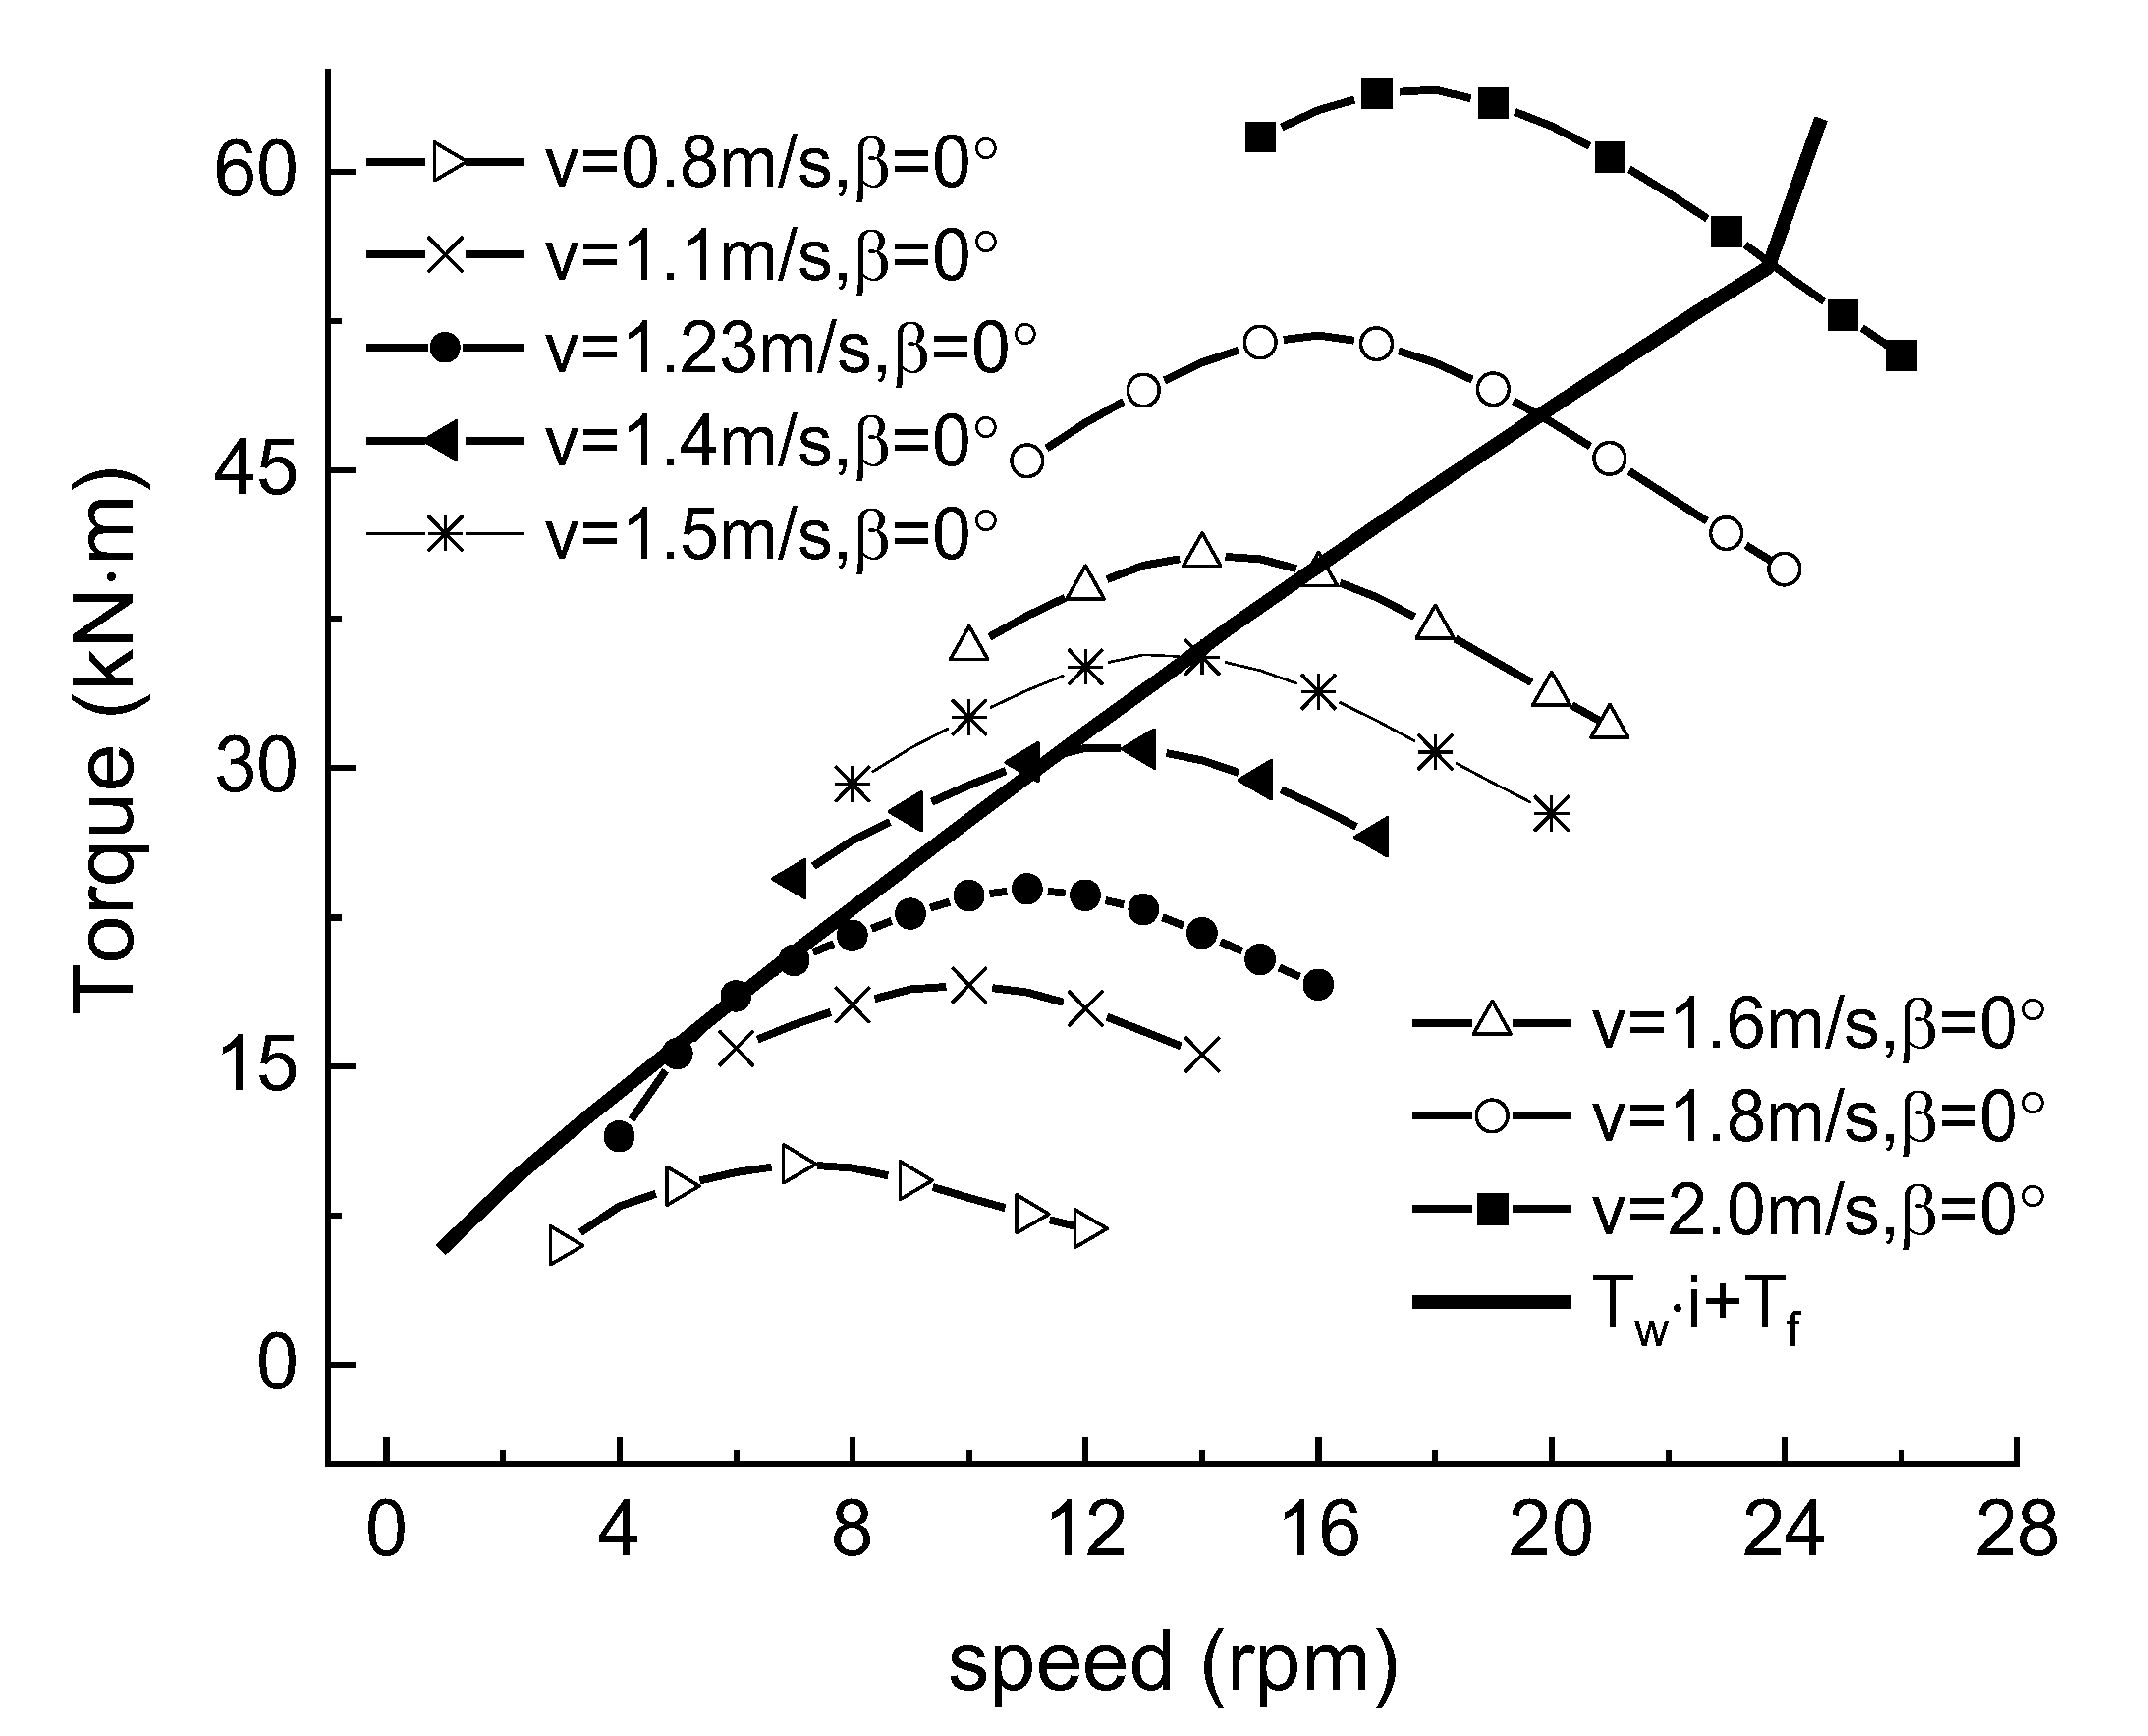
The dynamic characteristics of the generator need to match the dynamic characteristics of the turbine in order to achieve the best working state during operation. The torque versus rotational speed characteristics of the turbine for each flow velocity condition were calculated and compared with the optimum torque characteristic curve of the generator, as shown in Figure 7. Tr is the reaction torque to the turbine calculated based on the optimal torque of the generator under each rotational speed condition, and the other curves are the torque under the conditions of the corresponding flow velocity and pitch angle. As shown in Figure 7, when the flow velocity is lower than 1.2 m/s, the torque curve of the impeller does not intersect with the optimal torque curve of the generator. In the low-flow speed stage, the dynamic characteristics of the turbine and generator do not match, and the load of the generator needs to be controlled so that the working point of the generator falls within the power output range of the turbine.
At present, there are two methods to match the dynamic characteristics of the turbine and generator. One is to change the dynamic characteristics of the turbine by regulating the pitch angle to adapt to the torque characteristics of the generator, and the other is to adjust the output current of the generator through the control circuit, thereby changing the generator torque characteristics.
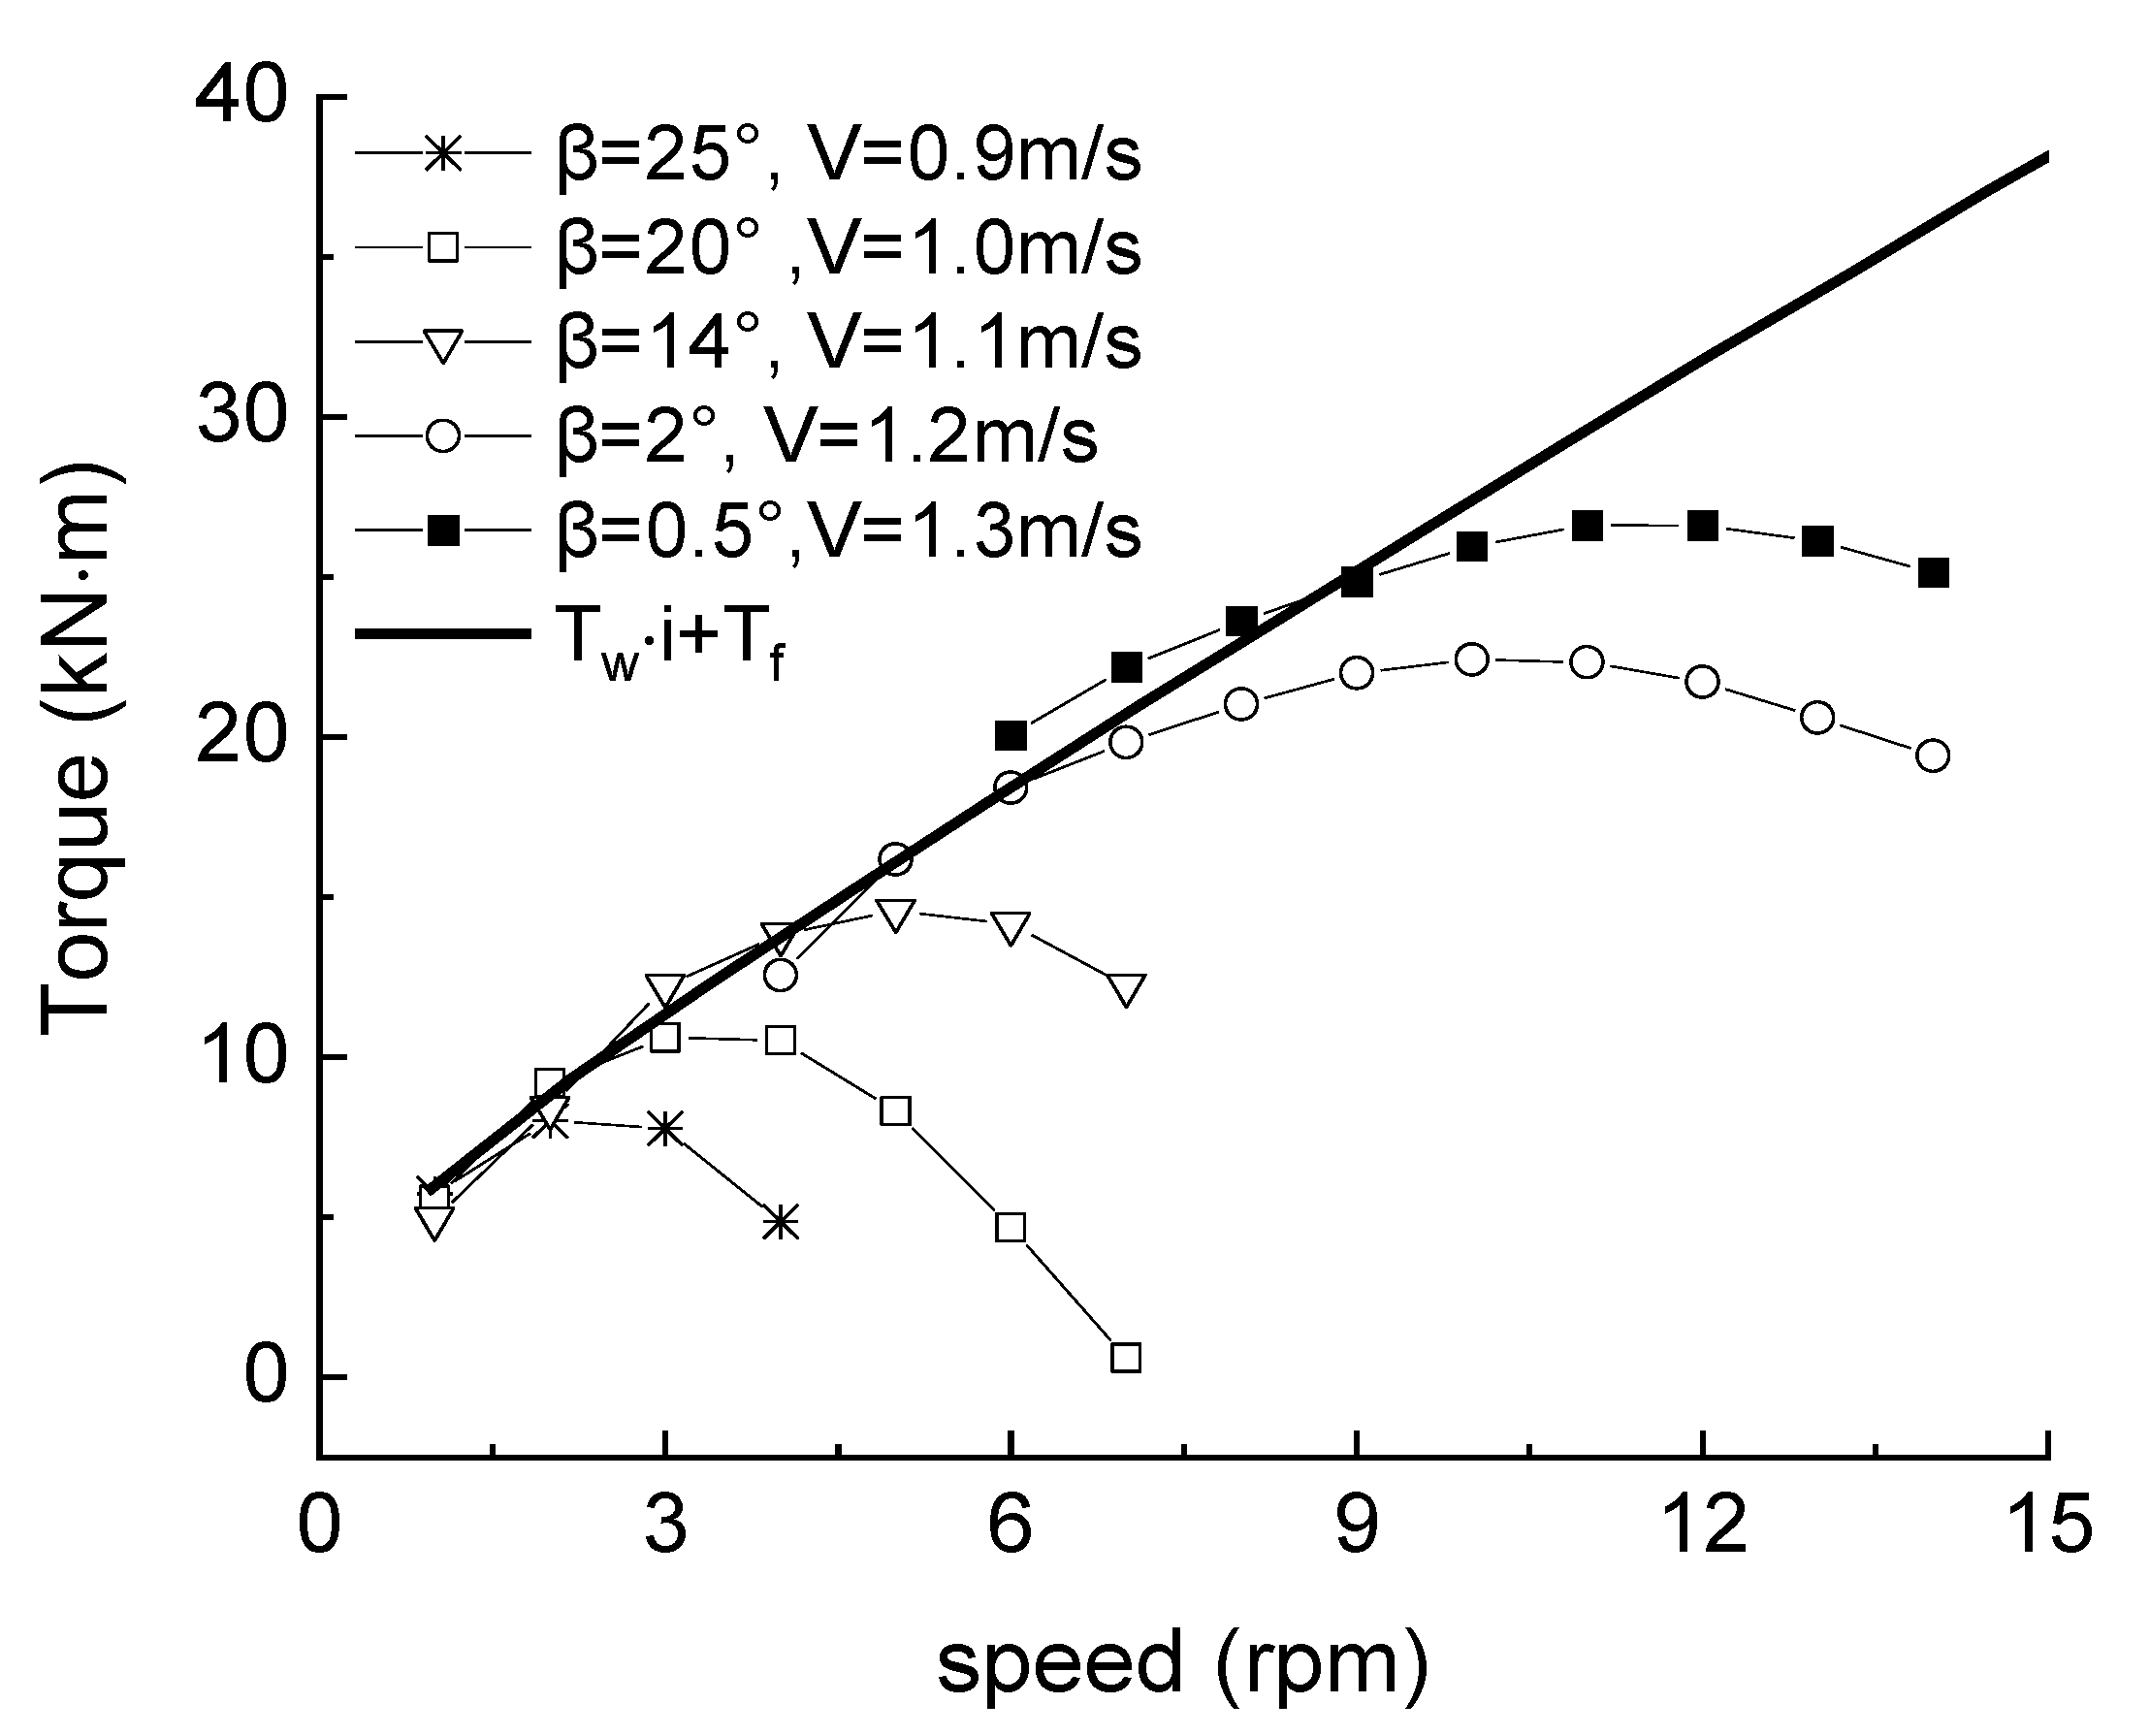
For the pitch-regulating method, the torque characteristics of the turbine under different pitch angles are analyzed, as shown in Figure 8. When the flow velocity exceeds 0.9 m/s, the torque curve of the turbine can intersect with that of the generator, and the turbine can generate enough driving torque to drive the generator. The torque characteristics of the turbine can be effectively improved by adjusting the pitch angle. A comparison of Figure 7 and Figure 8 shows that although pitching can improve the torque characteristics of the turbine, the optimal speed of the turbine is considerably reduced. For a flow velocity of 1.1 m/s, the optimal speed of the turbine is about 10 rpm when the pitch angle is 0°, whereas the optimal speed is about 5 rpm when the pitch angle is 14°. In addition, in the low-flow stage, the speed corresponding to the intersection of the torque characteristic curve of the turbine and the reaction torque characteristic curve of the generator is relatively low. Therefore, the generator operates in the low-speed range, and the overall working efficiency should be relatively low.
According to the torque characteristics of the turbine, the initial value of the pitch angle is 25°, and the pitch control strategy in the low flow rate stage is formulated as follows:
β k = β k 1 d β , i f 0.2 > P > 2.0 a n d β > 20
β k = β k 1 d β , i f 4 > P 2.0 a n d β > 14
β k = β k d β , i f 4 > P 8 a n d β > 2
β k = 0 , i f P 8
where is the step size for pitch angle adjustment (0.8° in this case).
When the output current of the generator is controlled to change the generator characteristics, the torque characteristics of the generator become soft in the low-power stage, and the dynamic characteristics of the generator and the impeller can also be matched. The developed power generation device is an off-grid, independent power generation system with a battery pack with a rated voltage of 400 V acting as the energy storage unit. The power conversion system between the generator and the battery is based on the boost circuit. When the generator voltage is lower than the charging voltage, the generator voltage is increased to the charging voltage through the boost circuit, and power is provided for the battery and load. During the boosting process, the output current of the generator can be regulated. The working current of the generator is linear with the working torque when using zero d-axis current control [31]. Here, it is assumed that the working current of the generator during the boosting process is regulated by the control circuit as follows:
D I = D 0 + 1 D 0 U u p U q U U q
T w = T w D I
where DI is the duty cycle coefficient; D0 is the initial value of duty cycle (0.4), Uup is the upper-limit voltage of the boost (490 V), Uq is the starting voltage and is set to 80.5 V, and T′w is the corrected working resistance torque.
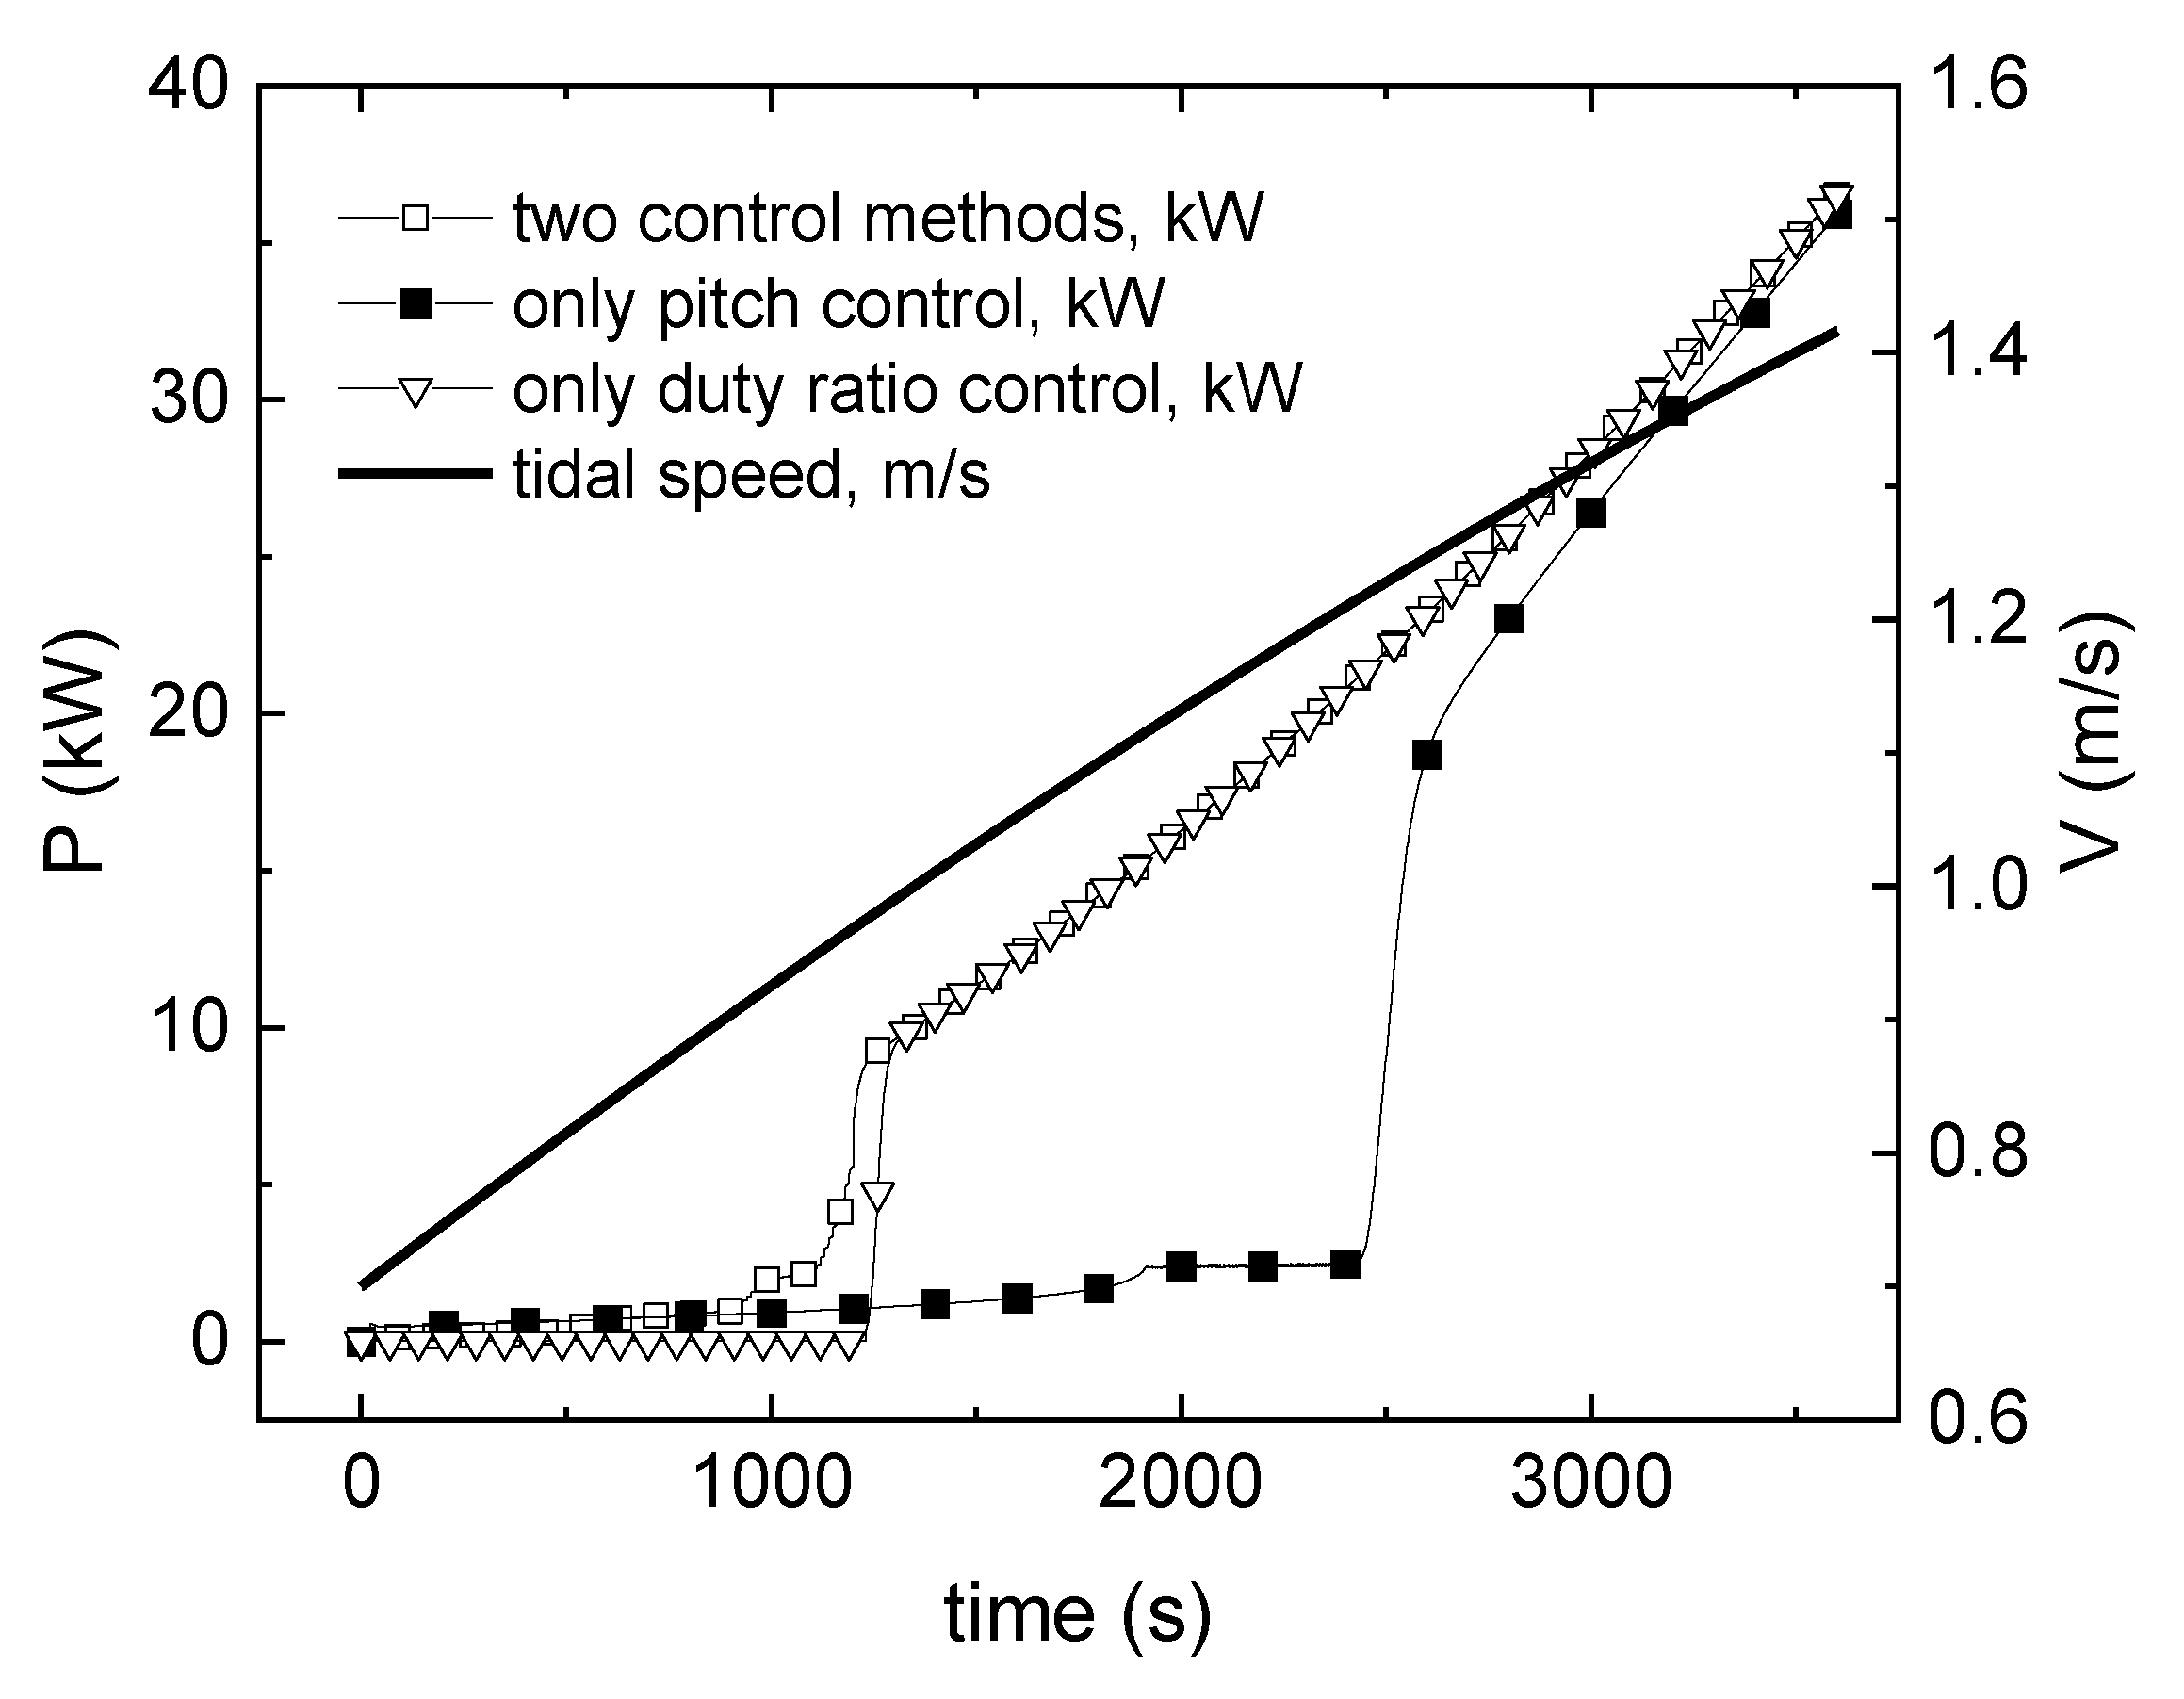
The simulation analysis of the two control strategies in the low flow rate stage is carried out according to the characteristic curve, and the simultaneous use of the two control methods is also analyzed. The simulation results are shown in Figure 9. It can be seen from the figure that the method of comprehensively using the two control strategies has the best effect, followed by the scheme of regulating the torque characteristics of the generator, and the scheme of only using the pitch control strategy achieves the worst performance. When the flow velocity reaches 0.82 m/s, the output power of the generator reaches 0.5 kW when the two methods are used comprehensively or only the torque characteristics are adjusted. The motor produces a valid output slightly earlier than when the only the torque characteristic is adjusted. When only the pitch angle is adjusted, the output power of the generator does not reach 0.5 kW until the flow velocity reaches 0.97 m/s. When the flow velocity exceeds 1.35 m/s, the control effects of the three schemes are basically the same.

4.2. Power Limit Control and Working Limit Point

4.2.1. Power Limit Control Strategy

When the current velocity exceeds the rated value, it is necessary to adjust the pitch angle to control the output power of the unit, i.e., the power limitation problem. Many studies have been conducted with respect to the power limitation of horizontal axis tidal current generating units, and many power limitation algorithms have been proposed. For the developed HATCT, the proportional integral controller is selected to realize power limit control, and the input parameter of the controller is the output power of the generator. The pitch angle control increment (Δβ) of the proportional controller is calculated as:
Δ β = K p P P e
where P is the output power of the unit, Pe is the limited power set by the unit, and Kp is the proportional coefficient.
The pitch angle control increment (Δβ) of the proportional integral controller is calculated as:
Δ β = K p P i P e + K I k = 1 m P i k P e
where Pi is the current output power of the unit, Pe is the rated power of the unit, Kp is the proportional coefficient, KI is the integral coefficient, Pi-k is the output power of the unit at the adjacent k-th sampling time, and k is the serial number.

4.2.2. Limit Working Point

When the flow velocity exceeds the rated value, the principle of pitch control is used to determine the optimal pitch angle so that the power output of the unit is controlled at the rated value. However, with a synchronous increase in flow velocity and pitch angle, the effect of pitch control may cause some problems.
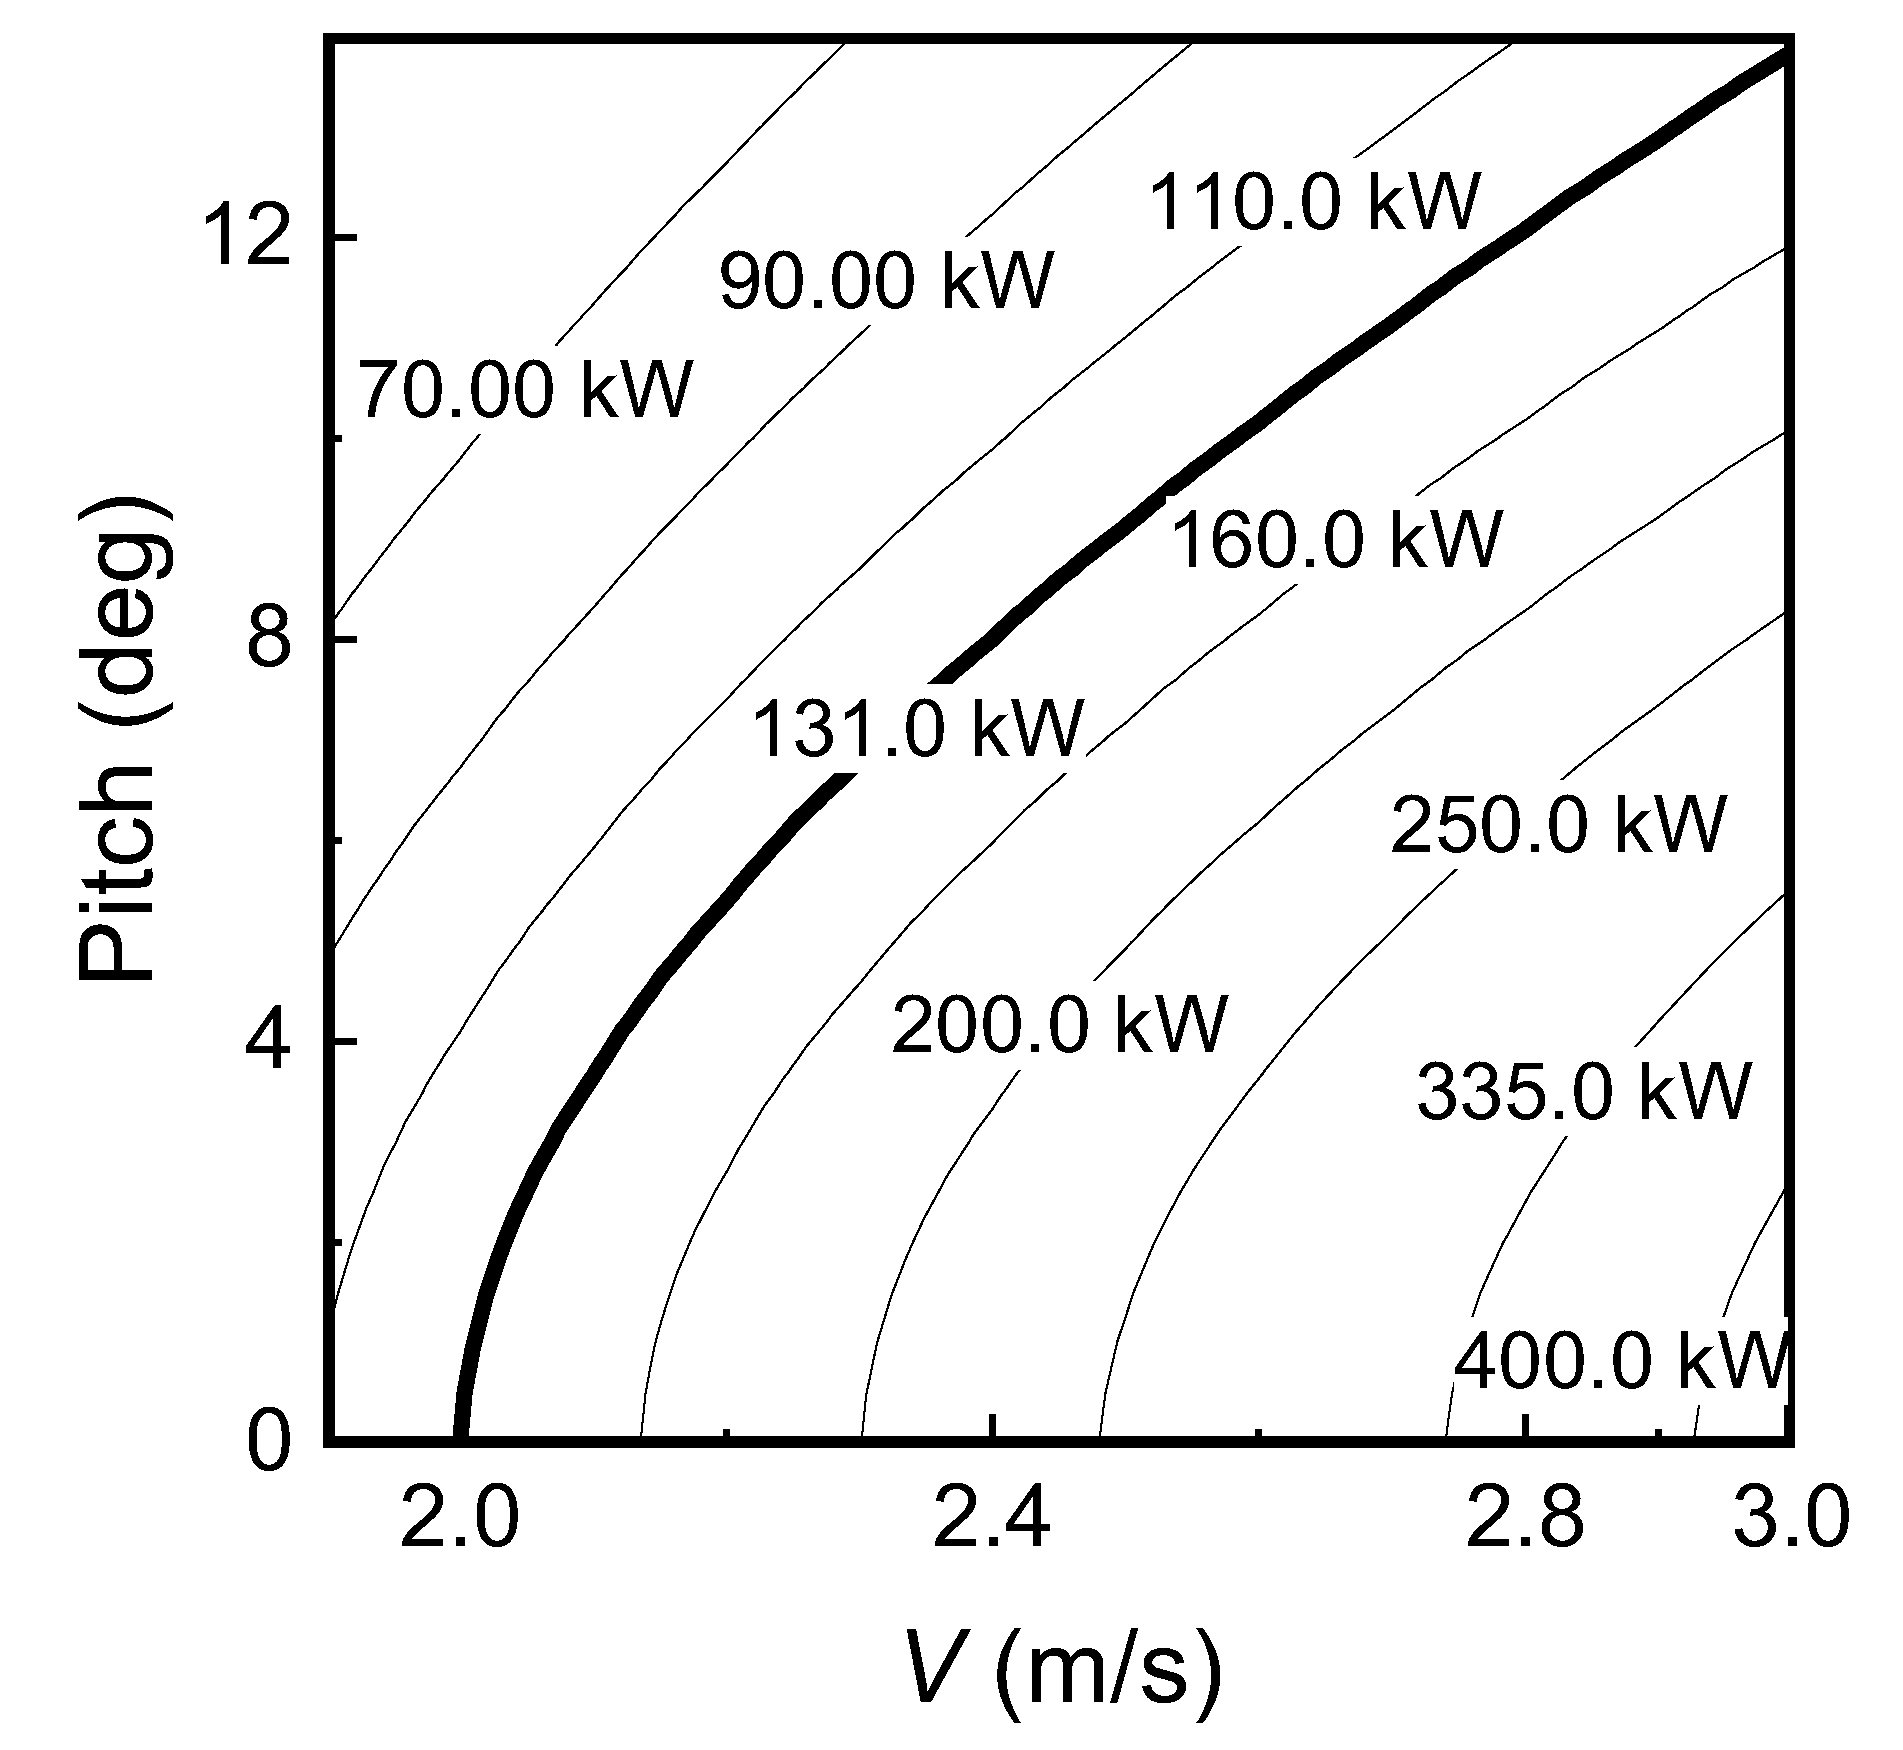
The pitch angle has a considerable influence on the output power of the HATCT. The relationship between the pitch angle and the output power at varying velocities is calculated using the calculation model, as shown in Figure 10. The equipotential line in the figure is the output power of the turbine. When the tidal velocity reaches the rated value of 2.0 m/s, the output power of each turbine reaches the rated value. The rated power of the turbine is about 131.0 kW. The output power of the turbine could considerably exceed the rated value when the tidal velocity is higher than 2.0 m/s, as shown in the figure. With the pitch angle maintained at 0°, the output power could exceed 400 kW when the tidal velocity reaches 3.0 m/s. However, by increasing the value of the pitch angle, the output power of the turbine can be effectively controlled.
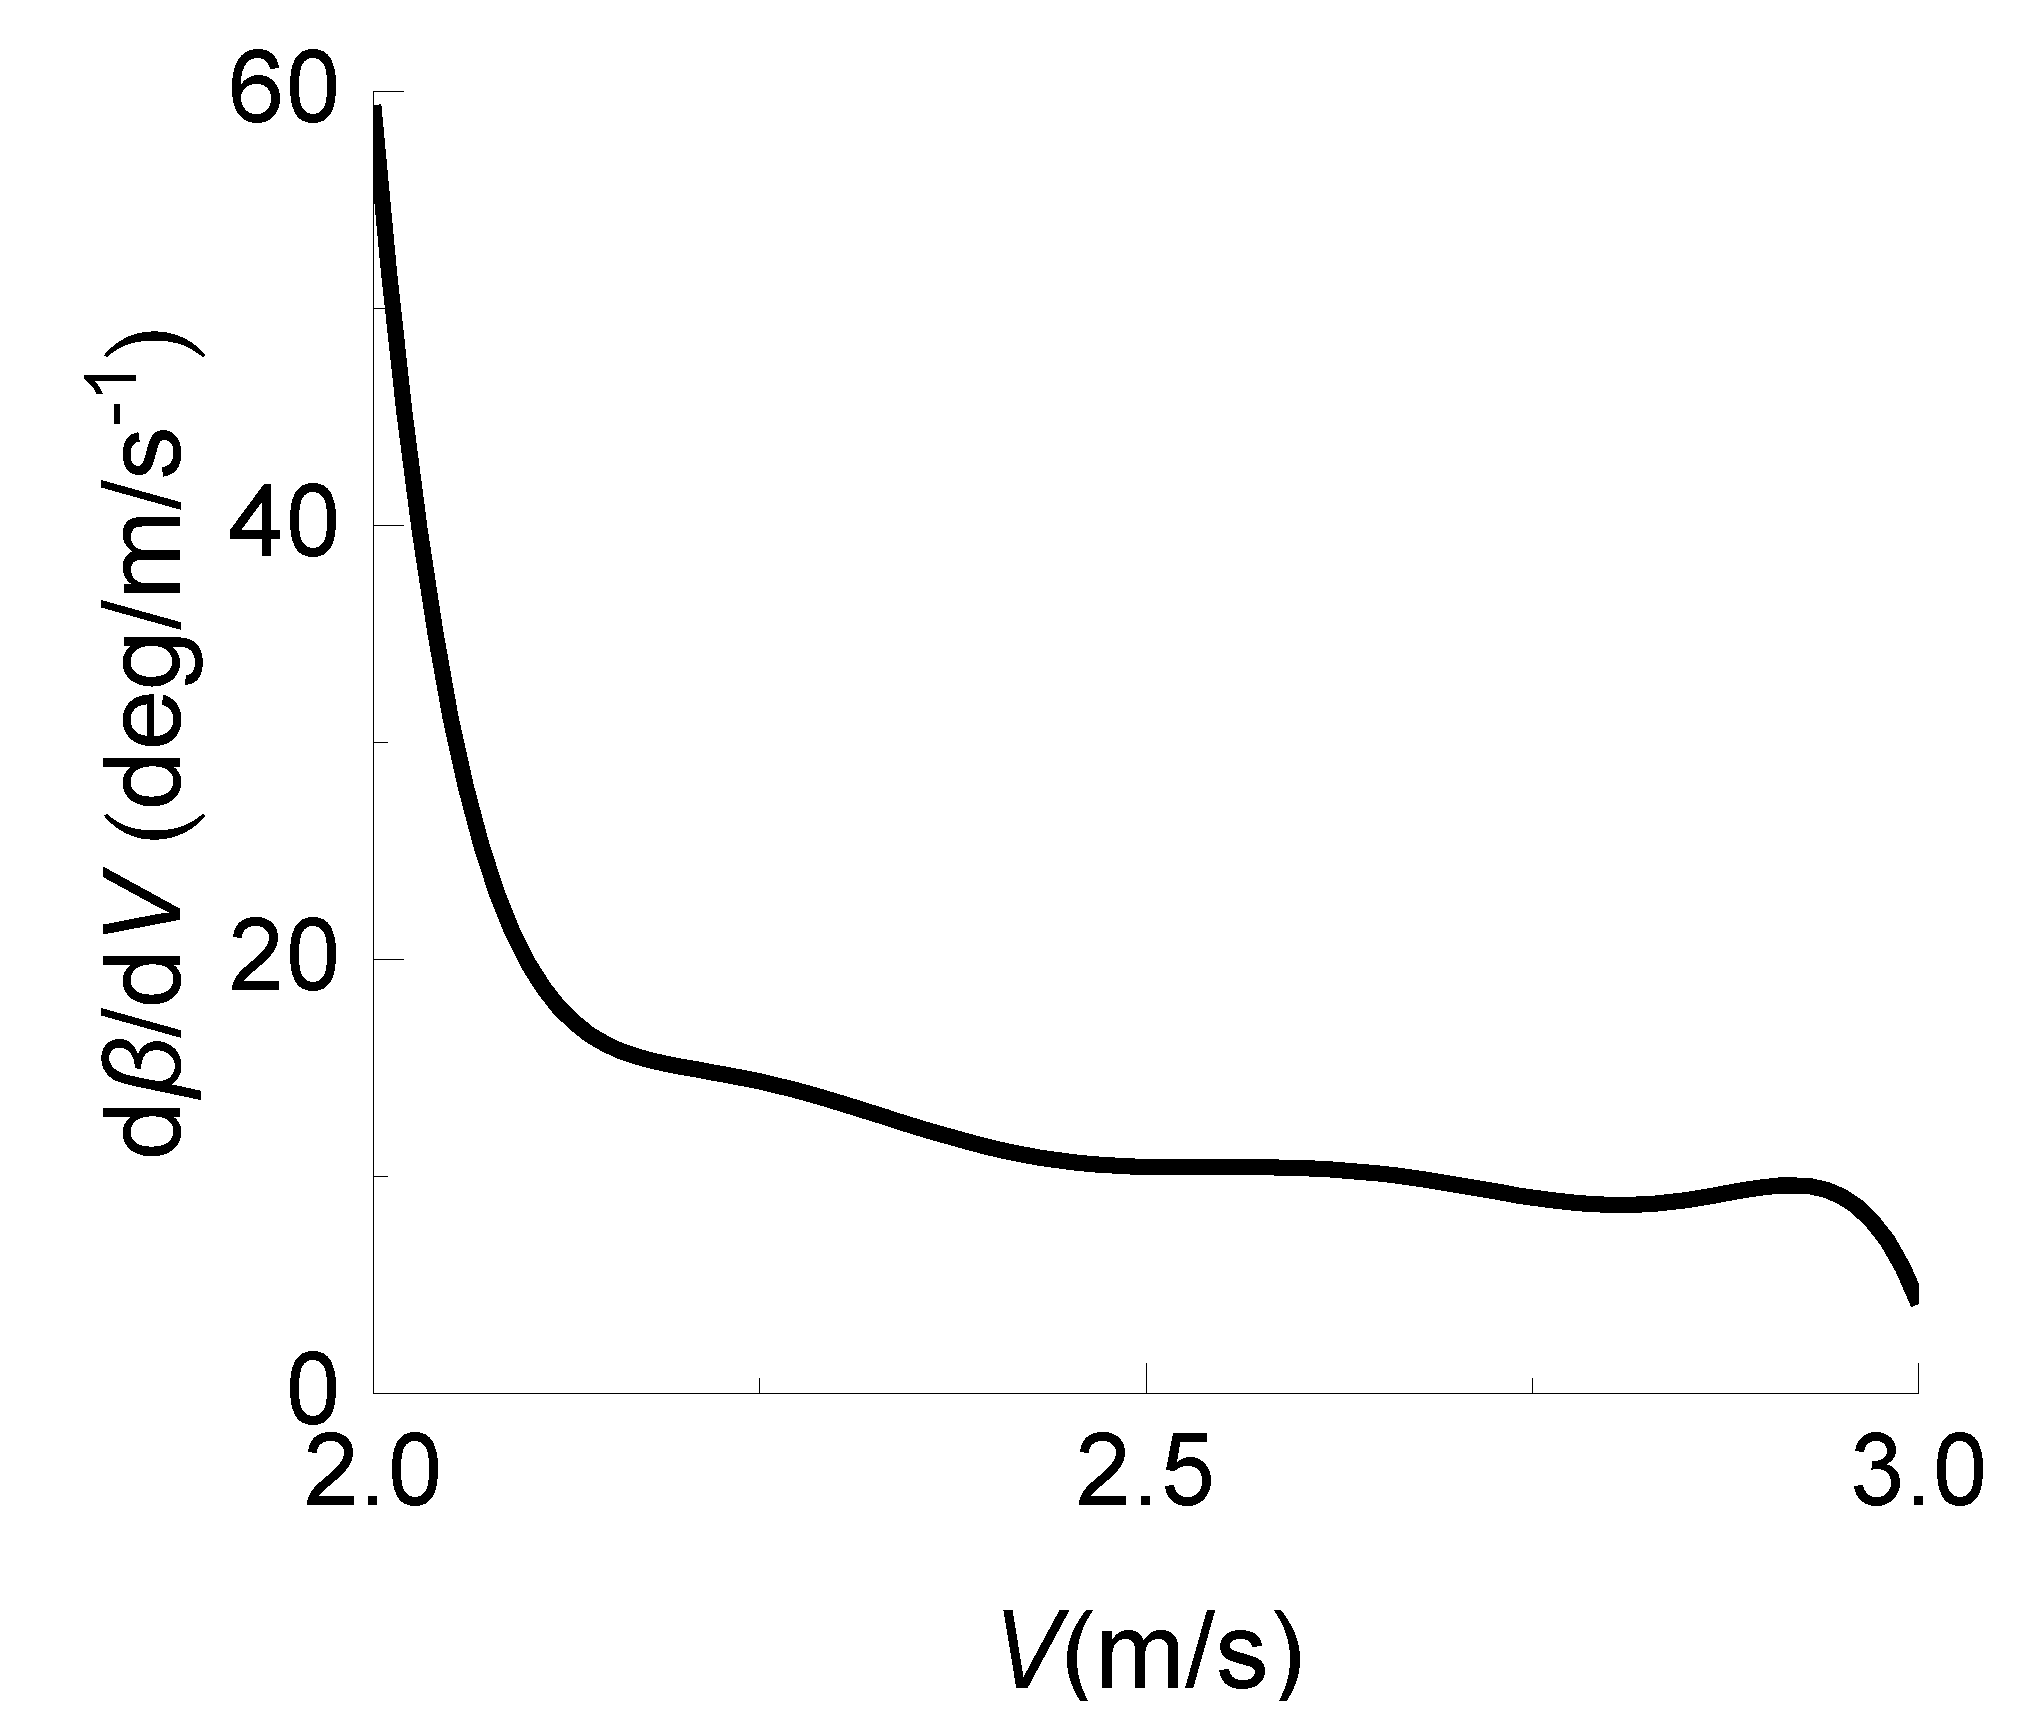
For each tidal velocity greater than 2.0 m/s, there is an optimal pitch position to maintain the output power of the turbine at the rated value. The optimal pitch angles of the turbine corresponding to varying tidal velocities are shown in Figure 10. The optimum pitch angle has a significant nonlinear relationship with the tidal velocity. By fitting the relationship between the optimal pitch angle (β) and the tidal velocity (V) with the eight-degree polynomial, the change rate of the optimal pitch angle relative to the tidal velocity can be obtained, which is described as dβ/dV, as shown in Figure 11. When the tidal velocity is in the range of 2~2.125 m/s, the optimal pitch angle increases rapidly with increased velocity, and the maximum value of dβ/dV is approximately 55 deg/(m/s). The rate of the optimal pitch angle versus velocity decreases when V exceeds 2.125 m/s, and the value of dβ/dV is approximately 15~10 deg/(m/s).
When the flow velocity exceeds 2.4 m/s, the dβ/dV curve is close to a horizontal line, which shows that under this condition, the pitch angle needs to be adjusted in a very small step according to the change in the tidal velocity to meet the requirements of power limitation. This corresponds to increased requirements for the servo system. In order to improve the robustness of the pitch angle servo adjustment system, the upper limit of the power-limited working range is set to a flow velocity of 2.4 m/s, and the corresponding optimal pitch angle is approximately 8°.
The pitch angle is monitored in real time during power limit control. When the pitch angle reaches 8° and the output power of the generator still exceeds the set value, the HATCT will enter the overcurrent protection state.

4.3. Overcurrent Protection

4.3.1. Dynamic Characteristics of Turbine with Large Pitch Angle under High Flow Velocity

When the flow velocity exceeds the working limit point, it is necessary to control the generator set so that the generator set enters the protection state and no longer produces effective power output. According to the torque characteristic, when the blade maintains a high pitch angle, the turbine has a high torque at a low speed, which decreases sharply with increased flow velocity. We studied the dynamic characteristics of a turbine with a high pitch angle an a flow velocity exceeding the limited value of 2.4 m/s; the simulation results are shown in Figure 12.
In this case, the resistance torque of the turbine is the friction resistance torque (Tf) of the transmission system when there is no load at the generator output (approximately 0.6 kN·m). In Figure 12, the rotation speed of the turbine corresponding to Tf is approximately the maximum speed under various working conditions, that is, the intersection of each torque characteristic curve and the abscissa axis. Even under no-load conditions, the rotating speed of the impeller with a high pitch angle is considerably restricted.
When the flow velocity exceeds the limit working point, the maximum rotating speed of the turbine with a pitch angle of more than 50° is less than 6 rpm, and the rotating speed does not exceed 7 rpm, even when the flow velocity reaches 3.0 m/s. The speed range and open-circuit voltage of the generator corresponding to a 50° blade pitch angle are:
n g = 60.884 × 6 7 = 365.3 426.2 rpm
V o = 0.49 × 365.3 426.2 = 179.0 208.8 V
When the pitch angle is 50°, the floating voltage change amplitude of the generator is about 29.8 V in the range of 2.45~3.0 m/s. Under the condition of a 60° pitch angle, the speed range of the no-load generator is about 274.0~334.9 rpm, the corresponding generator voltage is 134.2~164.1 V, and the variation amplitude of the generator no-load voltage is about 29.9 V.
When the pitch angle is 50° and the flow velocity is within the range of 2.45~3.0 m/s, the floating voltage variation amplitude of the generator is about 29.8 V. Under the condition of a 60° pitch angle, the speed range of the no-load generator is about 274.0~334.9 rpm, the corresponding generator voltage range is 134.2~164.1 V, and the variation amplitude of the generator no-load voltage is about 29.9 V.
For a turbine with a pitch angle of 30°, the maximum speed can be controlled within 12 rpm when the flow velocity is less than 2.6 m/s, but when the flow velocity reaches 3.0 m/s, the rotating speed exceeds 12 rpm. In the case of a 40° pitch angle, when the flow velocity is in the range of 2.45~3.0 m/s, the speed range is 487.1~608.8 rpm, the corresponding generator floating voltage is 238.7~298.3 V, and the variation amplitude is 59.6 V.

4.3.2. Overcurrent Protection Strategy

The tidal current velocity has strong regularity, specifically from small to large and then to small in a tidal cycle. For HATCTs, when the current speed exceeds the limit working point, a reasonable control strategy is to maintain the pitch angle at a given value under the no-load condition, and the rotating speed of the tidal turbine will change synchronously with the change in the tidal current velocity. Under the driving action of the turbine, the no-load generator speed will also change synchronously with the tidal current, corresponding to the change process “from small to large and then small”. By monitoring the no-load voltage of the generator, the change in the flow velocity can be inferred to determine whether the flow velocity is less than the limit working point and the time point to restart the unit.
In the overcurrent protection state, the HATCT must maintain a low speed under the no-load condition. Within the same flow rate variation range, the generator no-load voltage variation amplitude should be as large as possible, that is, the voltage variation rate for the flow rate should be relatively large, which is beneficial to the resolution of the control system, requiring a lower pitch angle to be set for overcurrent protection. However, the no-load speed should not be excessive; otherwise, it may cause considerable vibration and wear. In summary, the pitch angle for overcurrent protection is set to 40°, and the corresponding overcurrent protection response voltage (Up) is set to 240 V.
In the process of switching from the power limit state to the overcurrent protection state, the following measures are taken to avoid large vibrations and shocks when cutting off the load. When the pitch angle reaches 8° and the generator output power is still greater than the set value, the pitch angle is adjusted to 40°, the generator voltage is monitored in real time. When the output voltage decreases to the overcurrent protection response voltage, the generator load is cut-off, and the unit enters the overcurrent protection state.
In the overcurrent protection state, the unit maintains low-speed and no-load operation, and the control system monitors the generator voltage in real time. When the floating voltage of the generator remains lower than the “overcurrent protection response voltage” for 1 min, it means that the tidal flow rate has dropped below the limit operating point. The pitch angle of the blade is adjusted from 40° to 0° by the pitch system, and the unit enters the power limit state again.

5. Control Process Design

The control process of the HATCT was designed based on the pitch control method. The control process takes the output voltage or power of the generator as the control input variable and covers the entire working process of the unit, such as low-speed standby, startup, power limit, and overcurrent protection. The control flow is shown in Figure 13. In the figure, θ is the pitch angle, P is the generator output power, Pm is the set power, and U is the generator voltage.
The control process is divided into four parts: initialization, state measurement, regulation, and state judgment. In the initialization phase, some parameters of the control system are set. The state measurement phase involves the measurement the parameters of the prototype. The control phase controls the unit according to the condition of the unit. The state analysis phase involves analysis and judgement of whether the working state of the prototype is reasonable. In the operation process, the program cycles through three phases: state measurement, regulation, and state analysis.
In the regulation stage, the generator output voltage or power is analyzed to determine whether it is necessary to regulate the pitch angle. It is divided into the startup stage, operating below the rated power, operating at the rated power, and the protection mode when it exceeds the limit flow velocity.
The startup of the unit is mainly based on the generator output voltage. If the generator is in the no-load state or the initial pitch angle is 25° (205°), when the generator output voltage reaches the starting voltage, the pitch device is activated, and the pitch angle is regulated from 25° to 0° (or from 205° to 180°); then, the unit enters the operating mode. In Figure 13, Uq is the starting voltage, which is set to 80.5 V.
After entering the operating state, the generator output is connected to the load, and the system starts to generate electricity. The measurement and control system monitors the generator output power in real time and determines whether to regulate the pitch angle. If the output power is less than the rated power and the pitch angle is 0° or 180°, the power-generating state will be maintained. When the generator output power exceeds the rated power, the PI controller determines the amount of pitch angle adjustment required and performs pitch control. If the output power is still greater than the rated power after the pitch angle exceeds 8.0° or 188.0°, the pitch angle will be adjusted to 40° or 220°, respectively. The generator voltage is monitored in real time, and when the output voltage decreases to the overcurrent protection response voltage (Up), the generator load is cut off, and the unit enters the overcurrent protection state.
If the pitch angle is 0° or 180°, if the generator output power is continuously 0, the tidal cycle is over. In this case, the unit will be reverse-pitched, adjusting the pitch angle from 0° to 205° (or from 180° to 25°), and all loads are cut off, entering the standby state and waiting for the reverse tidal cycle.
In the overcurrent protection state, the unit maintains low-speed, no-load operation, and the control system monitors the generator voltage in real time. If the floating voltage is greater than Up, the pitch angle (40°) and no-load state remain unchanged. When the voltage keeps ΔUp lower than Up for longer than 1 min, indicating that the current flow velocity has dropped below the limit working point, the pitch system will adjust the pitch angle from 40° back to 0°, and the unit will enter power-limiting operating mode again, and ΔUp is set to 20 V.

6. Control Process Simulation Analysis

6.1. Tidal Current Calculation Model

Most tides and currents in China’s coastal waters are regular semidiurnal tides. For regular semidiurnal tides, the variation of tidal velocity in a tidal cycle can be simplified as [32]:
V = V m sin 2 π T c t
where V is the flow velocity of the tide, Tc is the tidal period (here, 12 h, 25 min, and 14.1 s), Vm is the maximum flow velocity in the tidal cycle, and t is the time.

6.2. Power Generation Process Simulation

We investigated the working conditions of the unit under three flow velocities, namely the maximum flow rate below the rated value, the maximum flow velocity below the limit value, and the maximum flow velocity exceeding the limit value. The simulation time step is assumed to be 1.0 s for calculation.

6.2.1. Power Generation at Low Flow Rate

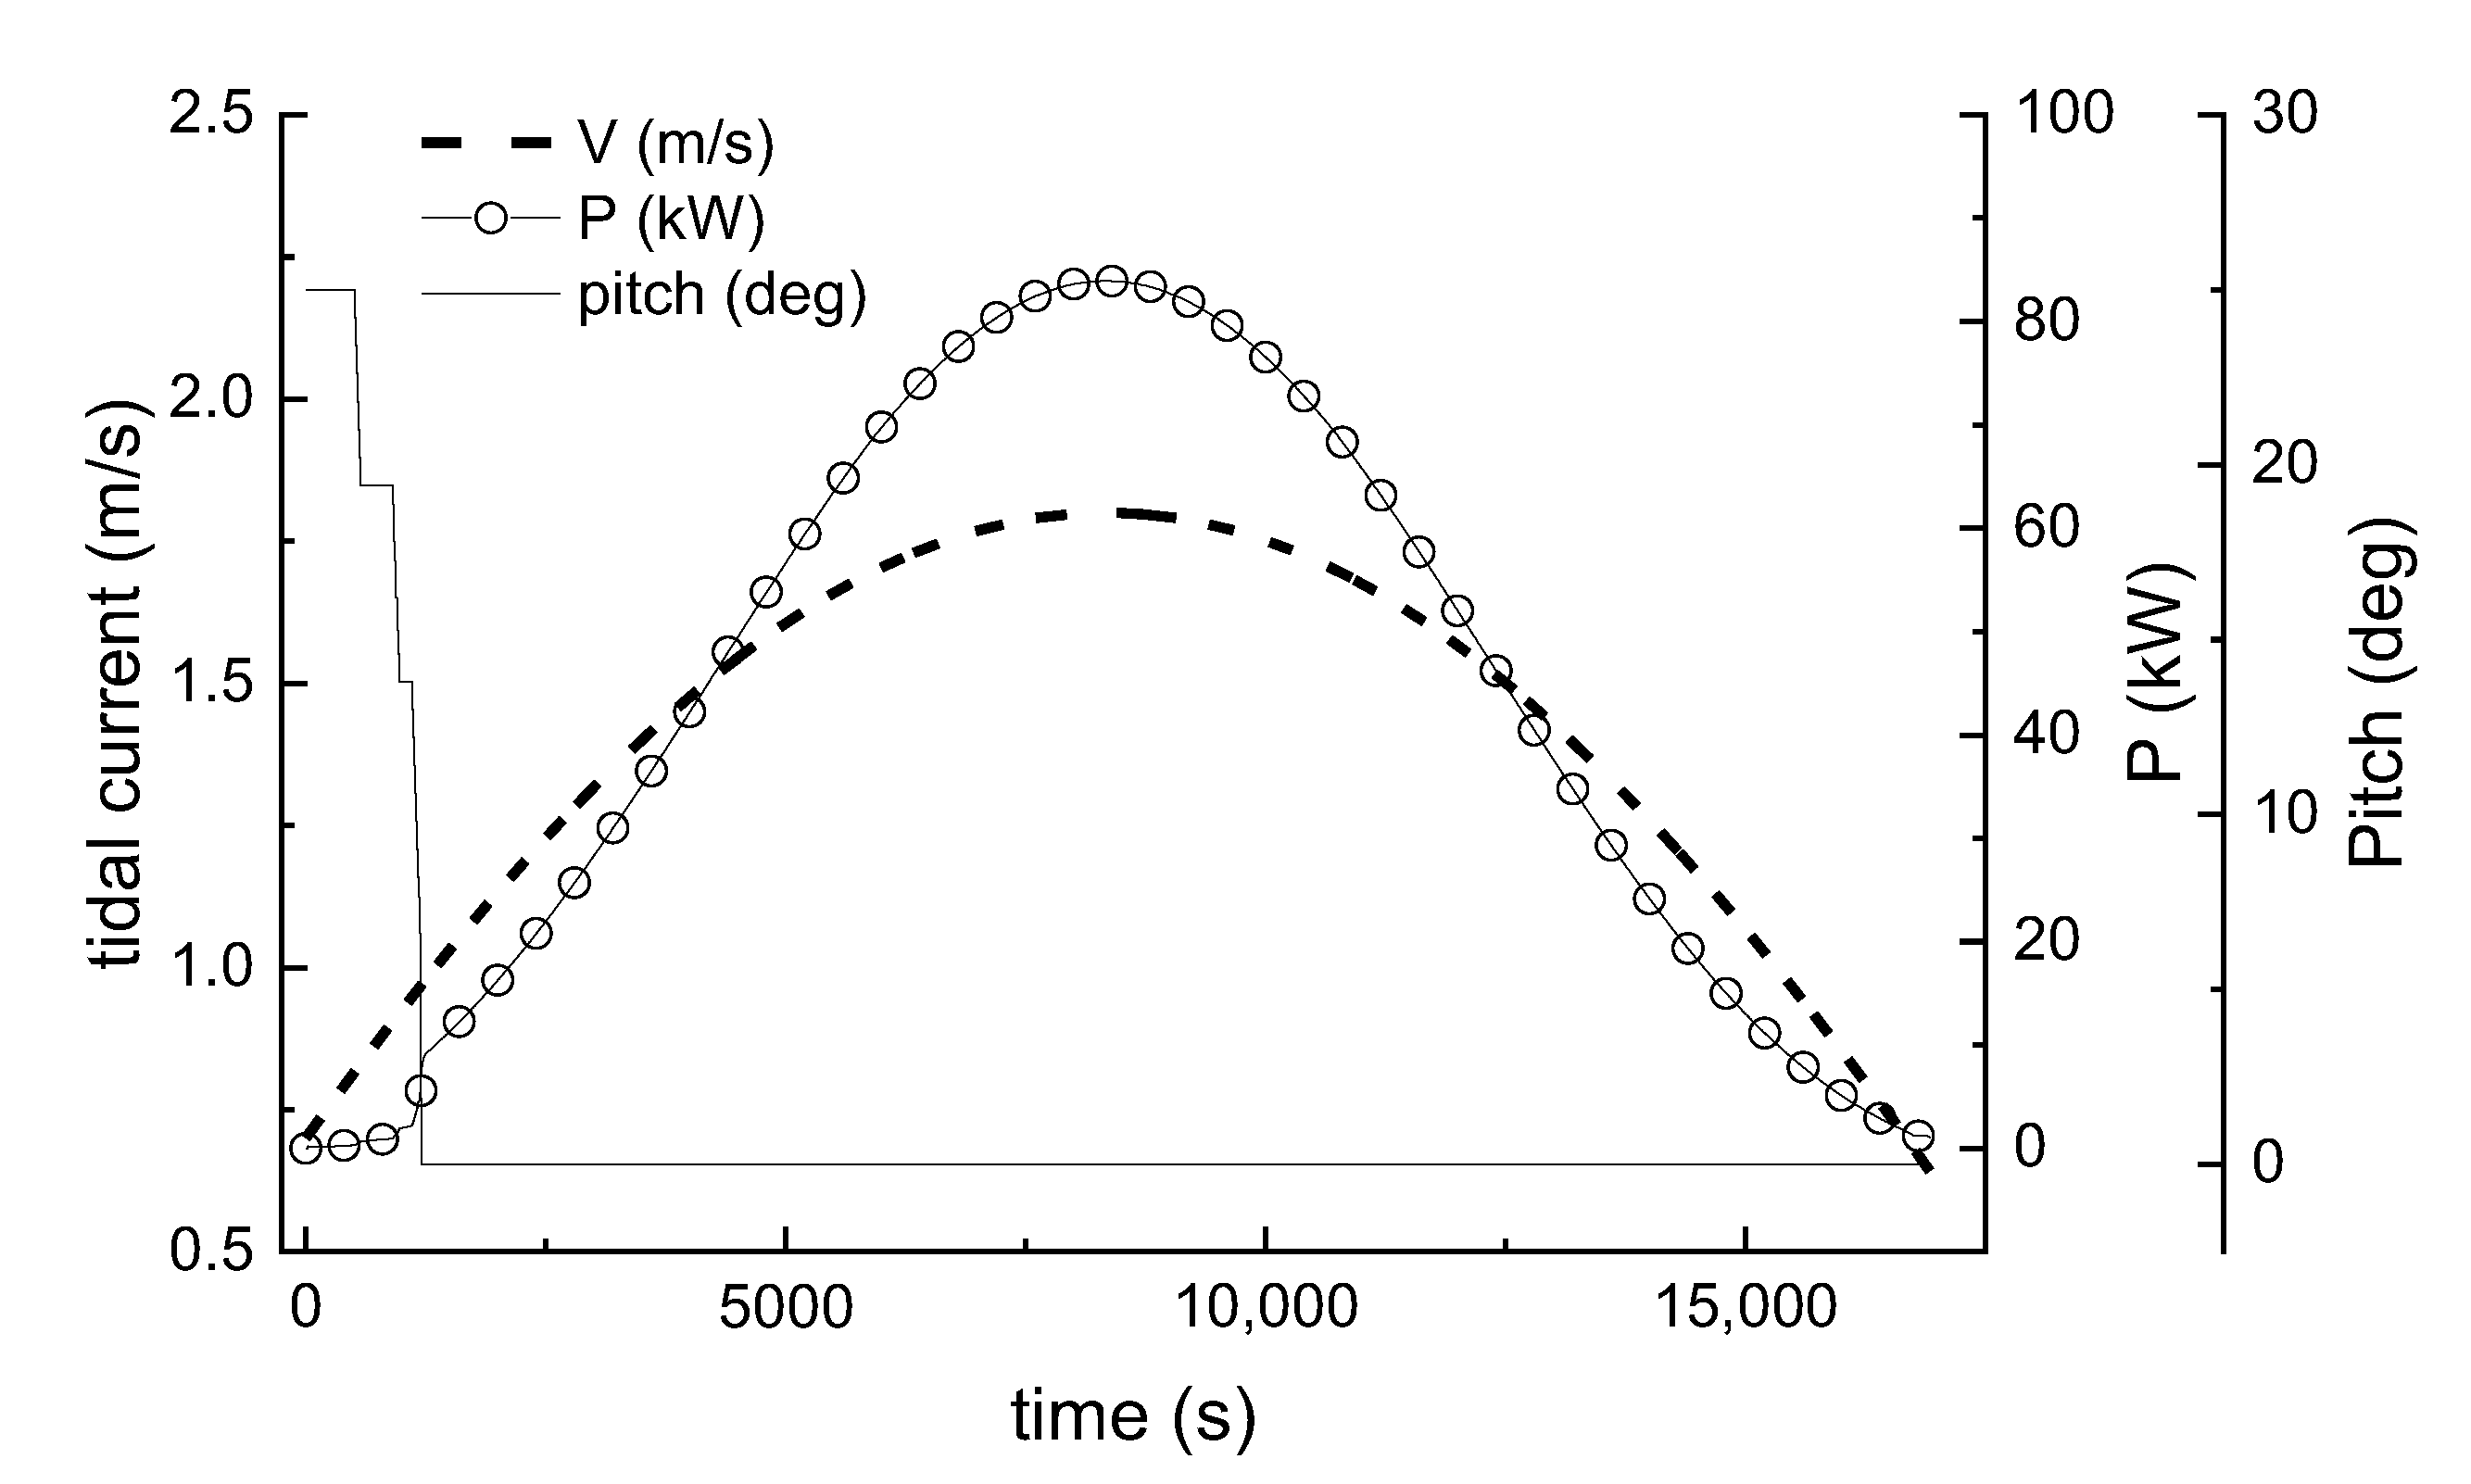
We conducted an analysis for a case in which the maximum flow velocity is lower than the rated value. During the calculation, the maximum flow velocity is assumed to be 1.8 m/s. The simulation results are shown in Figure 14. The control procedure works normally, the prototype starts smoothly at the low flow velocity stage, and the output power increases increased flow velocity. When the flow velocity reaches the maximum value of 1.8 m/s, the output power of the generator reaches the maximum value of 83.9 kW.
The variation in the pitch angle coincides with the power generation situation. Before the startup, the tidal flow is positive, the initial value of the pitch angle is 25°, the turbine does not start working, and the prototype is in standby mode. When the flow rate increases to the starting flow rate, the turbine drives the generator. and the measurement and control system starts the prototype to generate electricity, adjusting the pitch angle to 0°. During the power generation process, the maximum output power and voltage do not exceed the limits, so no pitch adjustment is made, and the pitch angle is maintained at 0°.

6.2.2. Power Generation at High Flow Rate

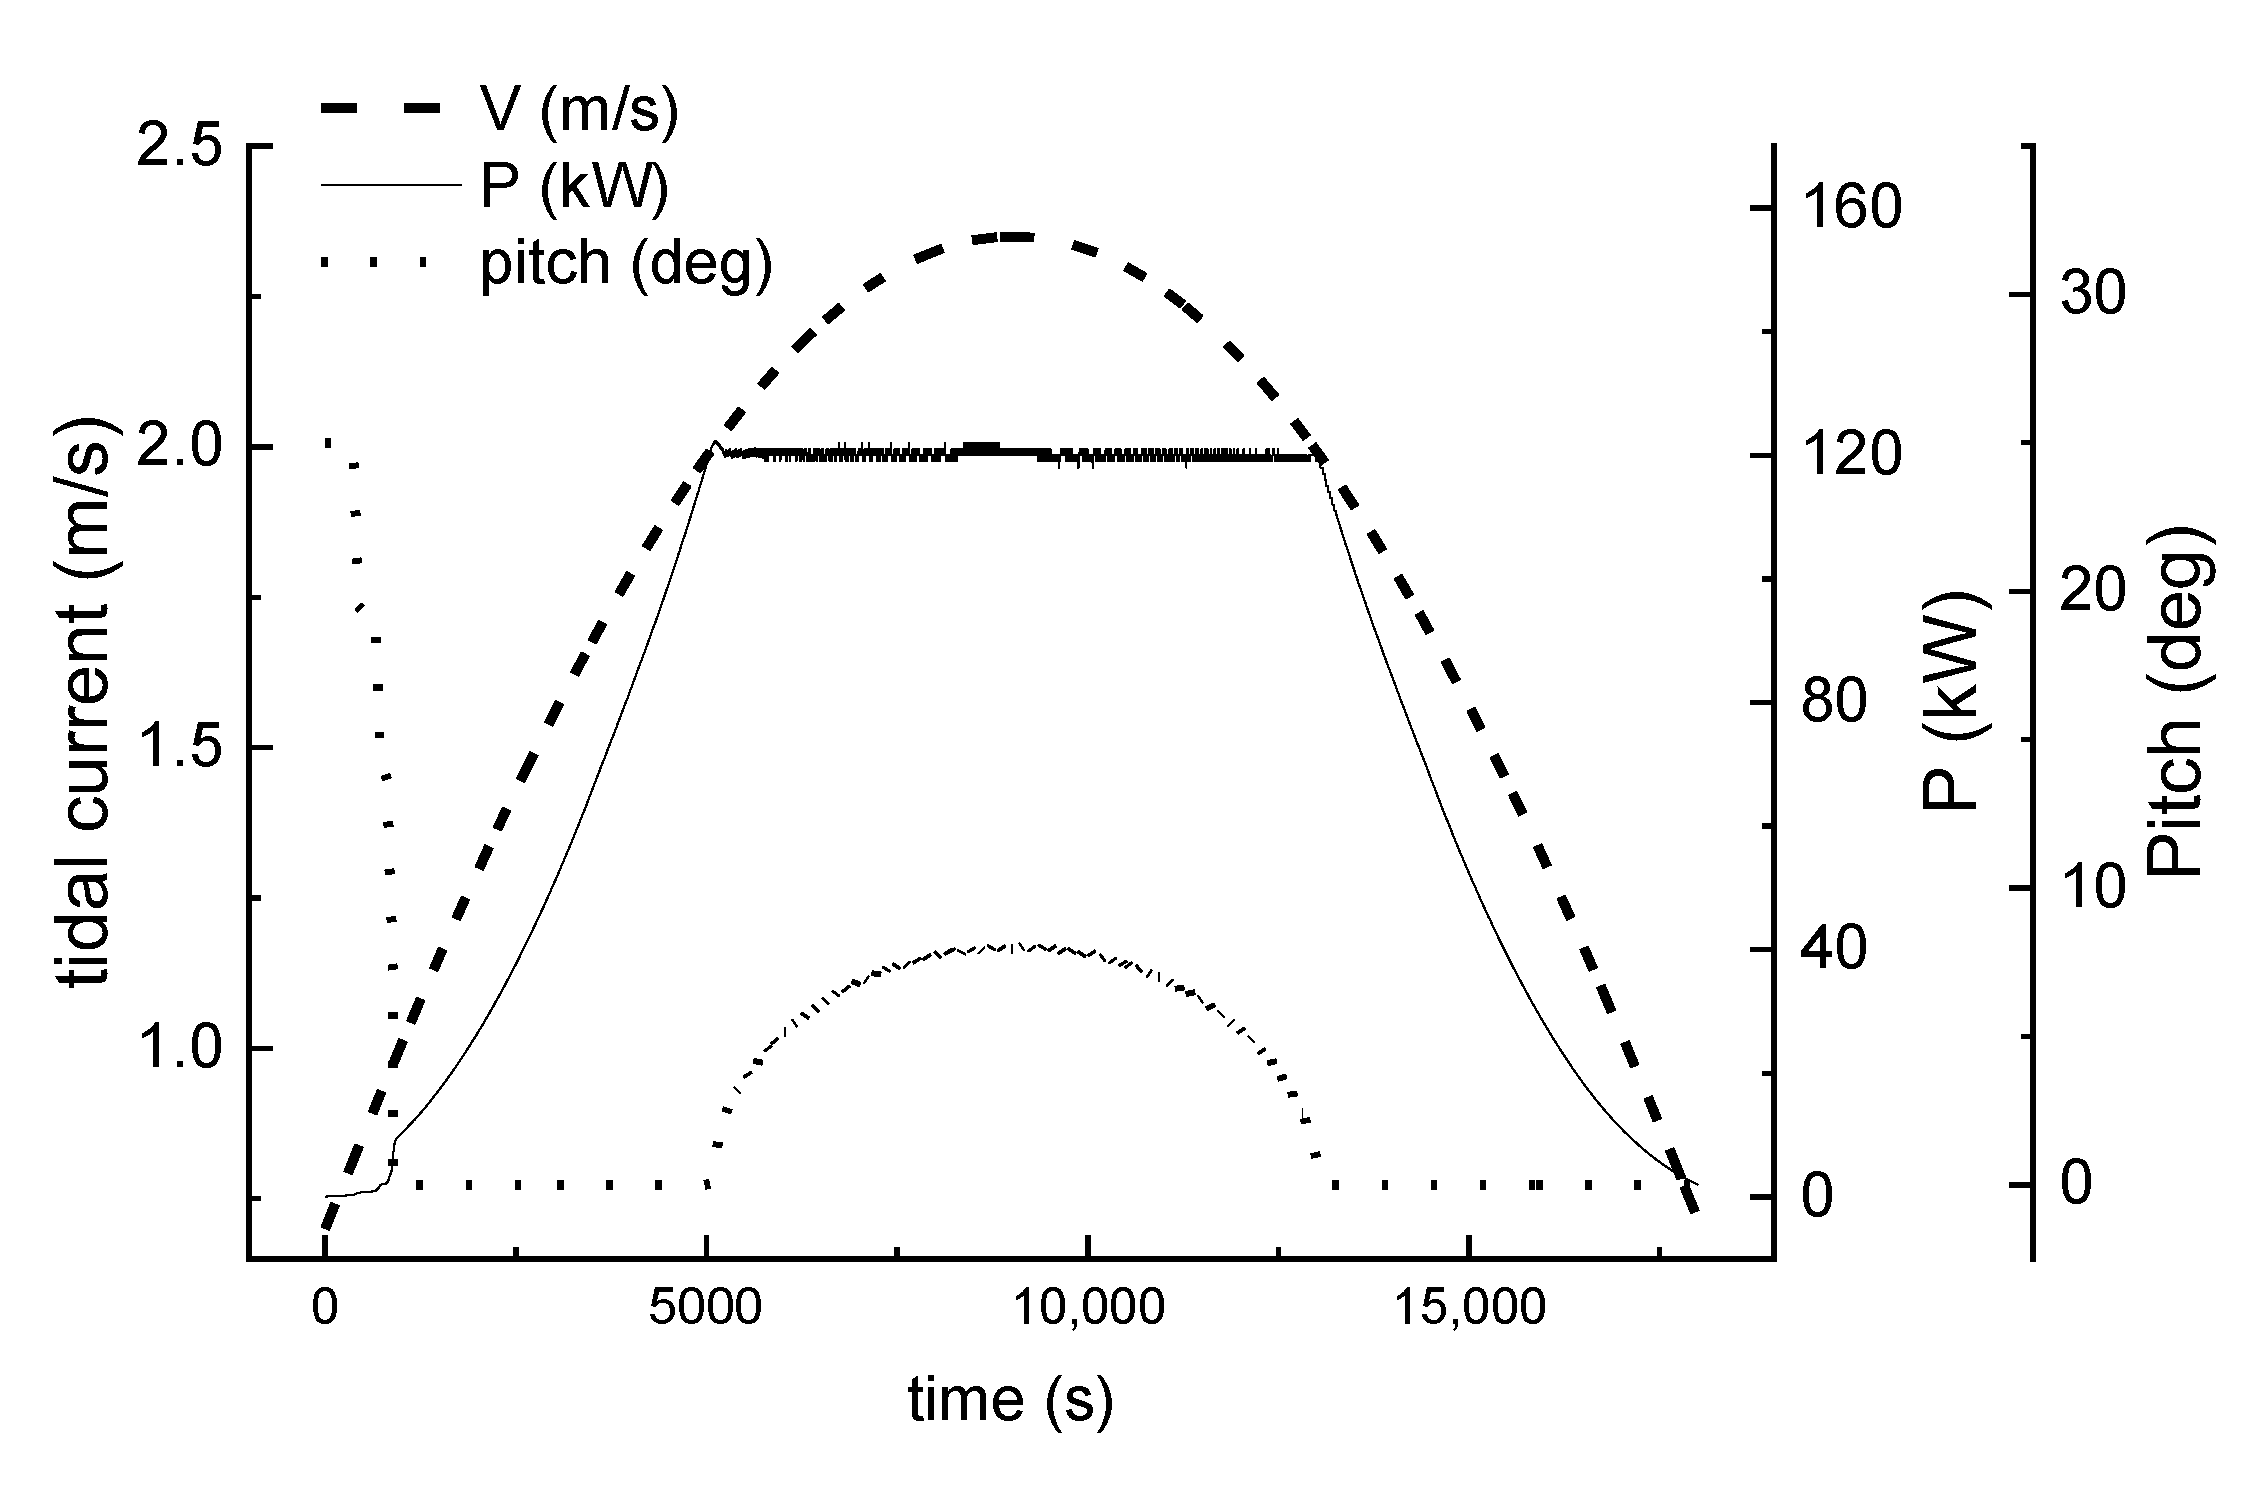
We conducted an analysis for conditions under which the maximum flow rate exceeds the rated flow rate and is lower than the limit operating flow rate. During the calculation, the maximum flow velocity is 2.35 m/s. The simulation results are shown in Figure 15. After the maximum flow rate has exceeded the rated value, the measurement and control system limit the maximum output power by means of pitch control. The top of the power generation curve is flattened, and the output power of the flattened section of the generator set is controlled within the range of 120 ± 2.4 kW. The pitch angle corresponding to the power generation curve of the flattening section no longer remains 0°, but a control angle appears, the change of the pitch angle sum is consistent with the power generation situation, and the maximum pitch angle is approximately 8°.

6.2.3. Maximum Flow Rate Exceeding the Limit Value

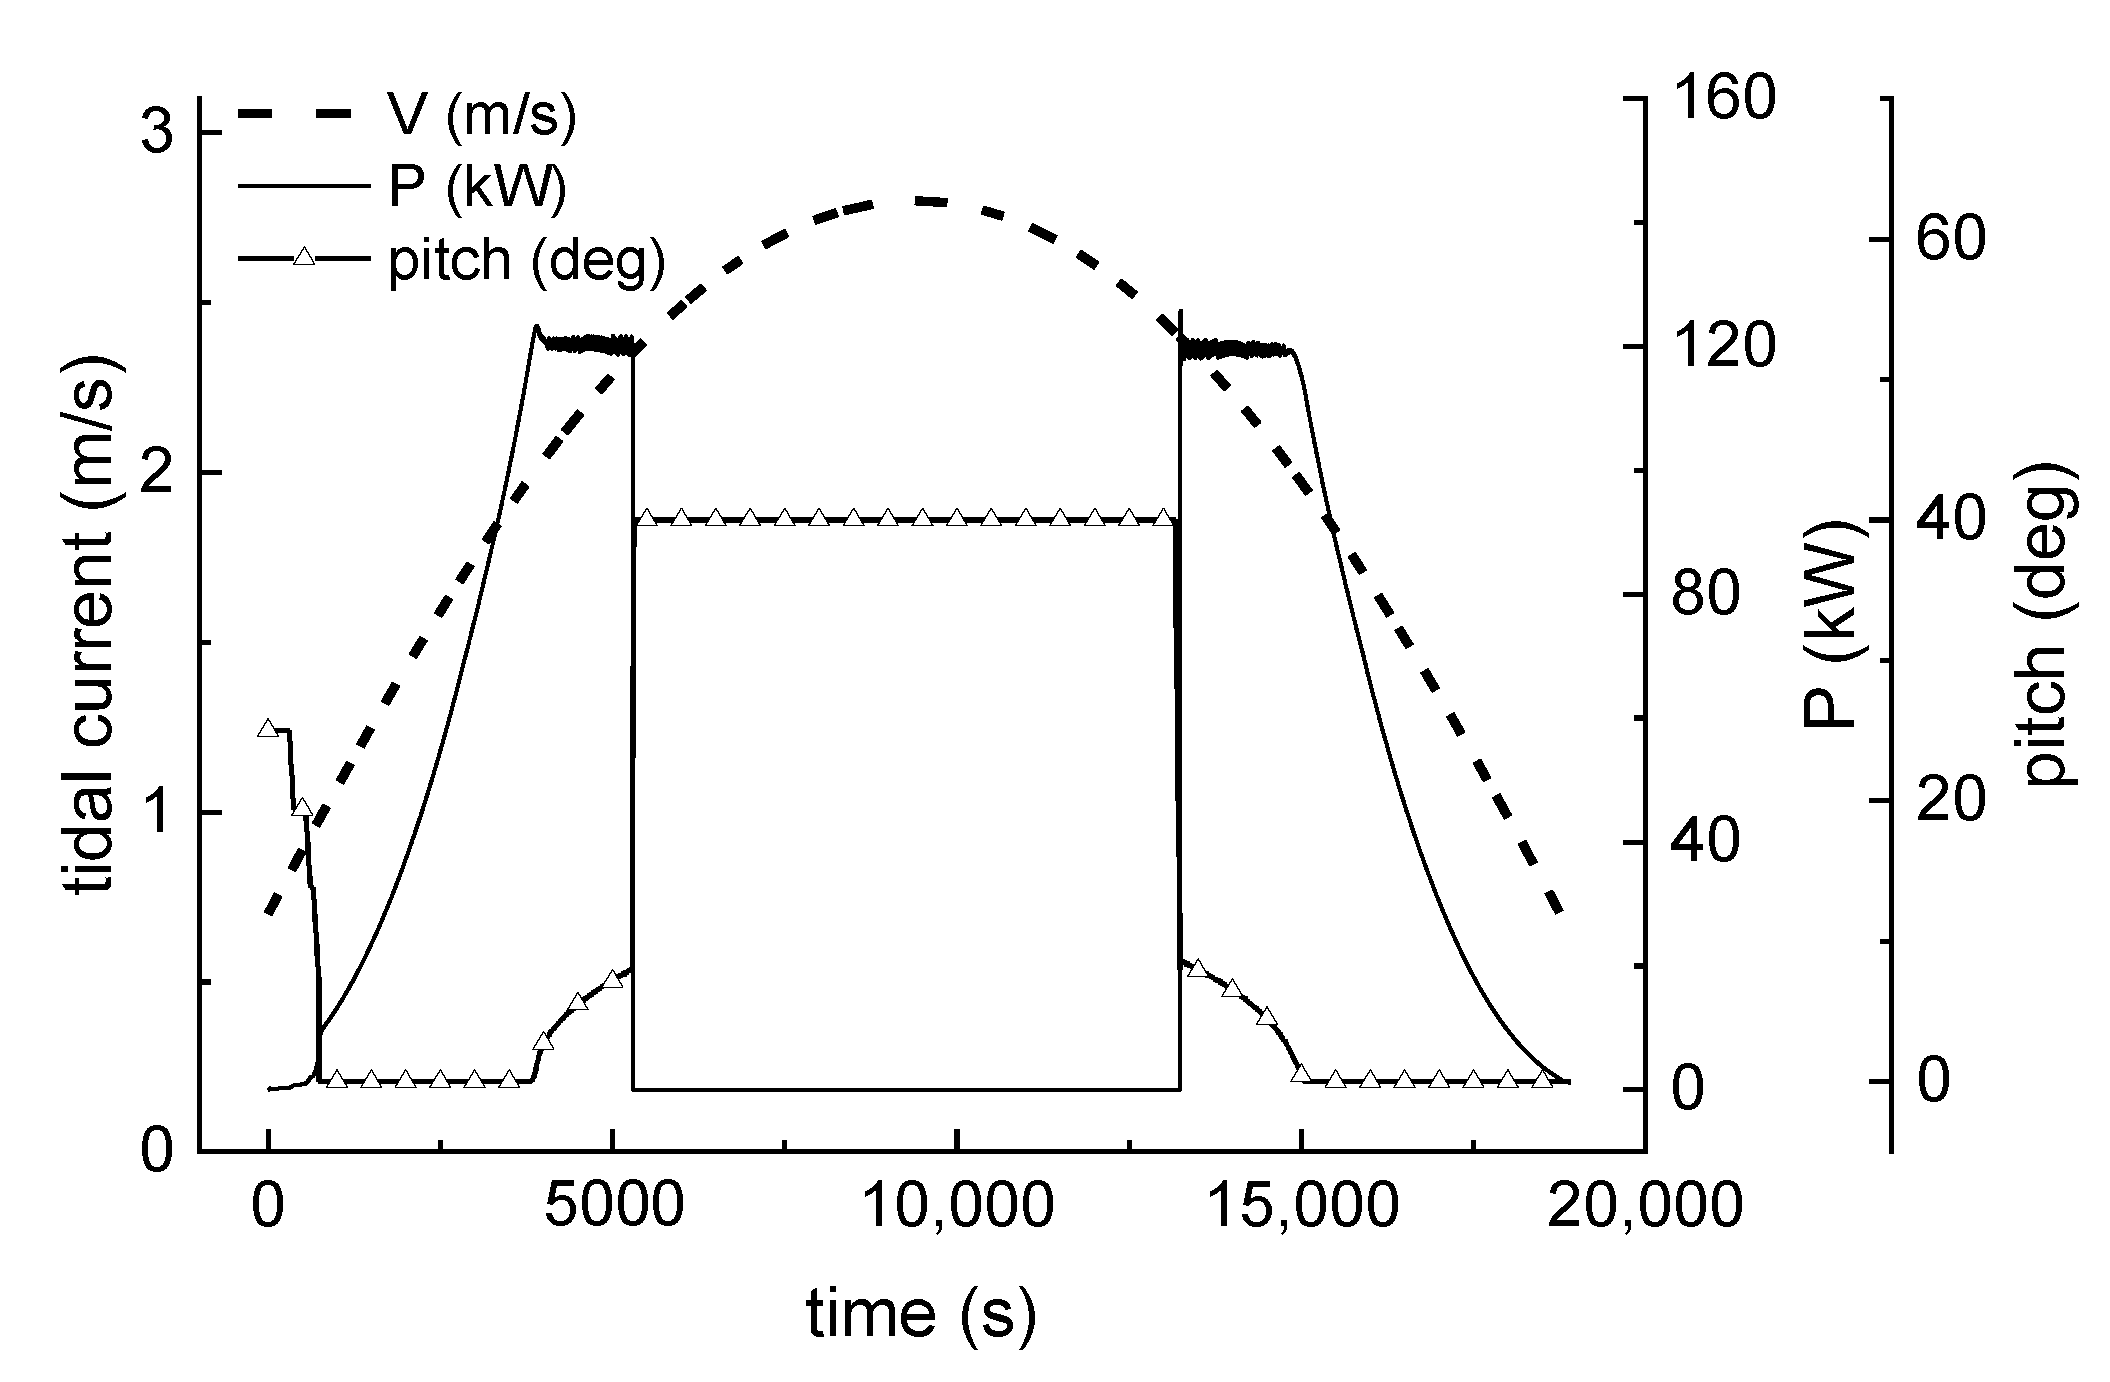
We conducted an analysis for a case in which the maximum flow rate exceeds the limit working flow rate. During the calculation, the maximum flow velocity is assumed to be 2.8 m/s. The simulation results are shown in Figure 16. The control process is effective, and the change in the pitch angle sum is consistent with the power generation. In the power generation process, when the flow rate exceeds the rated flow rate, the measurement and control system limit the maximum output power. After the flow rate exceeds the maximum working flow velocity of 2.4 m/s, the measurement and control system take protective action. The corresponding pitch angle is adjusted to 40°, the output power is 0, and the power generation curve becomes concave.

7. Conclusions

In this study, we developed a control strategy for a 120 kW variable-pitch HATCT based on the output voltage and power of the generator. The power-based control scheme solves the problem of inaccurate and costly flow measurement and avoids integration with flow measuring equipment, thus reducing the complexity of the system. Based on this method, a novel power-limiting protection and startup strategy is proposed, which can protect the turbine and fully utilize the tidal energy under strong tidal current.
A simulation model of the turbine was established based on BEMT and tested and verified by a generator test. The torque characteristics of the impeller were calculated under varying flow rates, compared with the optimal torque characteristic curve of the generator, and matched. A pitch control strategy below the rated flow velocity was accordingly formulated to achieve increased energy capture efficiency.
When the flow velocity exceeds the rated value, the unit is switched to power-limiting state. Under this operating state, the pitch angle is regulated according to the flow velocity to limit the output power at the rated value using a PI controller.
When the flow rate exceeds the limit working point, the pitch angle is adjusted to a higher value (set as 40°). Then, the generating unit enters protection mode. The generator load is removed, and in contrast to other existing protection strategies, the unit maintains low-speed, no-load operation instead of being stopped completely. The floating voltage of the generator is monitored in real time. When the voltage is below the set value for a given time, indicating that the tidal current velocity has fallen below the rated value, the unit starts up again and enters the operating mode. We conducted a simulation, with results showing that the proposed protection and startup method performs well and can guarantee a longer working time for the HATCT under high flow velocity, consequently capturing more energy from tidal currents.

Author Contributions

Conceptualization, B.W.; methodology, B.W.; formal analysis, B.W., Y.Z. and W.K.; software, B.W., Y.Z. and Y.D.; investigation, W.K.; resources, B.W.; data curation, B.W.; writing—original draft preparation, B.W. and W.K.; writing—review and editing, B.W. and W.K.; visualization, B.W., Y.D. and Y.Z.; supervision, B.W.; project administration, B.W.; funding acquisition, B.W. All authors have read and agreed to the published version of the manuscript.

Funding

This paper was financially supported by the Special Funds for Scientific Research in Marine Public Welfare Industry (grant no. 201205019-3).

Institutional Review Board Statement

Not applicable.

Informed Consent Statement

Not applicable.

Data Availability Statement

No new data were created or analyzed in this study. Data sharing is not applicable to this article.

Conflicts of Interest

The authors declare no conflict of interest.

Nomenclature

TCTTidal current turbine
HATCTHorizontal axis tidal current turbine
BEMTBlade element momentum theory
MPPTMaximum power point tracking
VSVPVariable-speed, variable-pitch
DFIGDoubly fed induction generator
IOPIInteger-order PI
ADCPAcoustic Doppler current profiler
JMoment of inertia of the unit (kg*m2)
εAngular acceleration of the rotor
TTorque of the turbine (Nm)
TzResistance torque (Nm)
TfFriction torque of the transmission system (Nm)
TwEffective resistance torque from the generator (Nm)
TwCorrected working resistance torque (Nm)
nRotation speed of the impeller (rpm)
ngRotation speed of the generator (rpm)
iSpeed ratio of the gearbox
JaAdded mass of the blade (kg*m2)
a, bAxial and tangential flow induction factors, respectively
φInflow angle (degree)
θMounting angle of the leaf element (degree)
βPitch angle of the blade (degree)
VTidal current speed (m/s)
FLoss coefficient
BNumber of blades
rRadius of the local blade element (m)
RRotor radius (m)
σrLocal solidity
cChord length of the local blade (m)
CL, CDLift and drag coefficient
CpPower coefficient
λTip speed ratio (TSR)
λrLocal tip speed ratio
ρSeawater density (kg/m3)
sj (=cj∙dr)Local area of the blade element
VoVoltage with load of the generator (V)
VoFloating voltage of the generator (V)
ηWorking efficiency of the generator
P, PeOutput power and limited power of the unit (kW)
DI, D0Duty cycle coefficient and initial value of the duty cycle, respectively
UupUpper-limit voltage (V)
UqStarting voltage of the unit (V)
Kp, KIProportional control factor and integral coefficient, respectively
Pi, Pi-kCurrent output power and output power at the adjacent k-th sampling time (kW), respectively
TcTidal period
VmMaximum flow velocity in the tidal cycle (m/s)

References

  1. Chu, S.; Majumdar, A. Opportunities and challenges for a sustainable energy future. Nature 2012, 488, 294–303. [Google Scholar] [CrossRef] [PubMed]
  2. Gielen, D.; Boshell, F.; Saygin, D.; Bazilian, M.D.; Wagner, N.; Gorini, R. The role of renewable energy in the global energy transformation. Energy Strategy Rev. 2019, 24, 38–50. [Google Scholar] [CrossRef]
  3. Ng, K.W.; Lam, W.-H.; Ng, K.C. 2002–2012: 10 Years of Research Progress in Horizontal-Axis Marine Current Turbines. Energies 2013, 6, 1497–1526. [Google Scholar] [CrossRef] [Green Version]
  4. Chowdhury, M.S.; Rahman, K.S.; Selvanathan, V.; Nuthammachot, N.; Suklueng, M.; Mostafaeipour, A.; Habib, A.; Akhtaruzzaman, M.; Amin, N.; Techato, K. Current trends and prospects of tidal energy technology. Environ. Dev. Sustain. 2020, 23, 8179–8194. [Google Scholar] [CrossRef]
  5. Bahaj, A.S. Generating electricity from the oceans. Renew. Sustain. Energy Rev. 2011, 15, 3399–3416. [Google Scholar] [CrossRef]
  6. Ben Elghali, S.; Benbouzid, M.E.H.; Charpentier, J.F. Marine Tidal Current Electric Power Generation Technology: State of the Art and Current Status. In Proceedings of the 2007 IEEE International Electric Machines & Drives Conference, Antalya, Turkey, 16 July 2007; pp. 1407–1412. [Google Scholar]
  7. Chen, H.; Tang, T.-h.; Aït-Ahmed, N.; Benbouzid, M.E.H.; Machmoum, M.; Zaïm, M.E. Attraction, Challenge and Current Status of Marine Current Energy. IEEE Access 2018, 6, 12665–12685. [Google Scholar] [CrossRef]
  8. Melikoğlu, M. Current status and future of ocean energy sources: A global review. Ocean Eng. 2018, 148, 563–573. [Google Scholar] [CrossRef]
  9. Liu, X.; Chen, Z.; Si, Y.; Qian, P.-F.; Wu, H.; Cui, L.; Zhang, D. A review of tidal current energy resource assessment in China. Renew. Sustain. Energy Rev. 2021, 145, 111012. [Google Scholar] [CrossRef]
  10. Tawil, T.E.; Charpentier, J.F.; Benbouzid, M.E.H. Tidal energy site characterization for marine turbine optimal installation: Case of the Ouessant Island in France. Int. J. Mar. Energy 2017, 18, 57–64. [Google Scholar] [CrossRef]
  11. Benbouzid, M.E.H.; Astolfi, J.A.; Bacha, S.; Charpentier, J.F.; Machmoum, M.; Maître, T.; Roye, D. Concepts, Modeling and Control of Tidal Turbines; John Wiley & Sons: Hoboken, NJ, USA, 2013. [Google Scholar]
  12. Khan, M.Z.A.; Khan, H.A.; Aziz, M. Harvesting Energy from Ocean: Technologies and Perspectives. Energies 2022, 15, 3456. [Google Scholar] [CrossRef]
  13. Roberts, A.K.; Thomas, B.M.; Sewell, P.; Khan, Z.A.; Balmain, S.; Gillman, J. Current tidal power technologies and their suitability for applications in coastal and marine areas. J. Ocean. Eng. Mar. Energy 2016, 2, 227–245. [Google Scholar] [CrossRef] [Green Version]
  14. Xu, Q.; Li, W.; Lin, Y.; Liu, H.; Gu, Y.-j. Investigation of the performance of a stand-alone horizontal axis tidal current turbine based on in situ experiment. Ocean Eng. 2016, 113, 111–120. [Google Scholar] [CrossRef]
  15. Zhang, J.; Moreau, L.; Machmoum, M.; Guillerm, P.E. State of the art in tidal current energy extracting technologies. In Proceedings of the First International Conference on Green Energy ICGE, Sfax, Tunisia, 25–27 March 2014; pp. 1–7. [Google Scholar]
  16. Ghefiri, K.; Bouallègue, S.; Garrido, I.; Garrido, A.J.; Haggège, J. Complementary Power Control for Doubly Fed Induction Generator-Based Tidal Stream Turbine Generation Plants. Energies 2017, 10, 862. [Google Scholar] [CrossRef] [Green Version]
  17. Gu, Y.-j.; Liu, H.; Li, W.; Lin, Y.; Yangjian, L. Integrated design and implementation of 120-kW horizontal-axis tidal current energy conversion system. Ocean Eng. 2018, 158, 338–349. [Google Scholar] [CrossRef]
  18. Wang, Y.; Wei, X.; Zhu, W.; Chen, J.; Dong, Y.; Guo, J. Research on Maximum Power Tracking Control of Tidal Power Generation System. In Proceedings of the 12th International Conference on Measuring Technology and Mechatronics Automation (ICMTMA), Phuket, Thailand, 28–29 February 2020; pp. 450–454. [Google Scholar]
  19. Saihi, L.; Boutera, A. Robust Control of a Variable-Speed Wind Turbine with Fixed Pitch Angle and Strategy MPPT Control Associated on a PMSG. In Proceedings of the 8th International Conference on Modelling, Identification and Control (ICMIC), Algiers, Algeria, 5 January 2017; pp. 326–331. [Google Scholar]
  20. Boukhezzar, B.; Lupu, L.; Siguerdidjane, H.; Hand, M.M. Multivariable control strategy for variable speed, variable pitch wind turbines. Renew. Energy 2007, 32, 1273–1287. [Google Scholar] [CrossRef]
  21. Qian, P.; Feng, B.; Liu, H.; Tian, X.; Si, Y.; Zhang, D. Review on configuration and control methods of tidal current turbines. Renew. Sustain. Energy Rev. 2019, 108, 125–139. [Google Scholar] [CrossRef]
  22. Whitby, B.; Ugalde-Loo, C.E. Performance of Pitch and Stall Regulated Tidal Stream Turbines. IEEE Trans. Sustain. Energy 2014, 5, 64–72. [Google Scholar] [CrossRef]
  23. Zhen, C.; Shukai, C.; Ming, L.; Jianguo, W. Design and Implementation of the Pitch Control System for Horizontal Axis Tidal Turbines. In Proceedings of the 27th Chinese Control and Decision Conference (2015 CCDC), Qingdao, China, 20 July 2015; pp. 4078–4082. [Google Scholar]
  24. Chen, H.; Xie, W.; Chen, X.; Han, J.; Aït-Ahmed, N.; Zhou, Z.; Tang, T.-h.; Benbouzid, M.E.H. Fractional-Order PI Control of DFIG-Based Tidal Stream Turbine. J. Mar. Sci. Eng. 2020, 8, 309. [Google Scholar] [CrossRef]
  25. Alipour, R.; Alipour, R.; Fardian, F.; Hossein Tahan, M. Optimum performance of a horizontal axis tidal current turbine: A numerical parametric study and experimental validation. Energy Convers. Manag. 2022, 258, 115533. [Google Scholar] [CrossRef]
  26. Moon, S.-H.; Park, B.-G.; Kim, J.-W.; Kim, J.-M. Maximum Power-Point Tracking Control Using Perturb and Observe Algorithm for Tidal Current Generation System. Int. J. Precis. Eng. Manuf. Green Technol. 2019, 7, 849–858. [Google Scholar] [CrossRef]
  27. Thomson, J.; Polagye, B.L.; Durgesh, V.; Richmond, M.C. Measurements of Turbulence at Two Tidal Energy Sites in Puget Sound, WA. IEEE J. Ocean. Eng. 2012, 37, 363–374. [Google Scholar] [CrossRef]
  28. Gu, Y.-j.; Lin, Y.; Xu, Q.; Liu, H.; Li, W. Blade-pitch system for tidal current turbines with reduced variation pitch control strategy based on tidal current velocity preview. Renew. Energy 2018, 115, 149–158. [Google Scholar] [CrossRef]
  29. Bir, G.S.; Lawson, M.J.; Li, Y. Structural Design of a Horizontal-Axis Tidal Current Turbine Composite Blade. In Proceedings of the ASME 2011 30th International Conference on Ocean, Offshore and Arctic Engineering, Rotterdam, The Netherlands, 19–24 June 2011. [Google Scholar]
  30. Ledoux, J.; Riffo, S.; Salomon, J. Analysis of the Blade Element Momentum Theory. SIAM J. Appl. Math. 2021, 81, 2596–2621. [Google Scholar] [CrossRef]
  31. Porate, D.K.; Gawande, S.P.; Porate, K.B.; Nagpure, R.N.; Waghmare, M.A.; Kadwane, S.G. Performance of PMSG Based Variable Speed WECS with Parallel Back-to-Back Converters Using Separate Zero d-axis Current Control. In Proceedings of the 2018 IEEE International Conference on Power Electronics, Drives and Energy Systems (PEDES), Chennai, India, 18–21 December 2018; pp. 1–6. [Google Scholar]
  32. Zheng, Z. The Estimation of Ocean Tidal Current Energy. Mar. Sci. Bull. 1987, 6, 70–75. [Google Scholar]
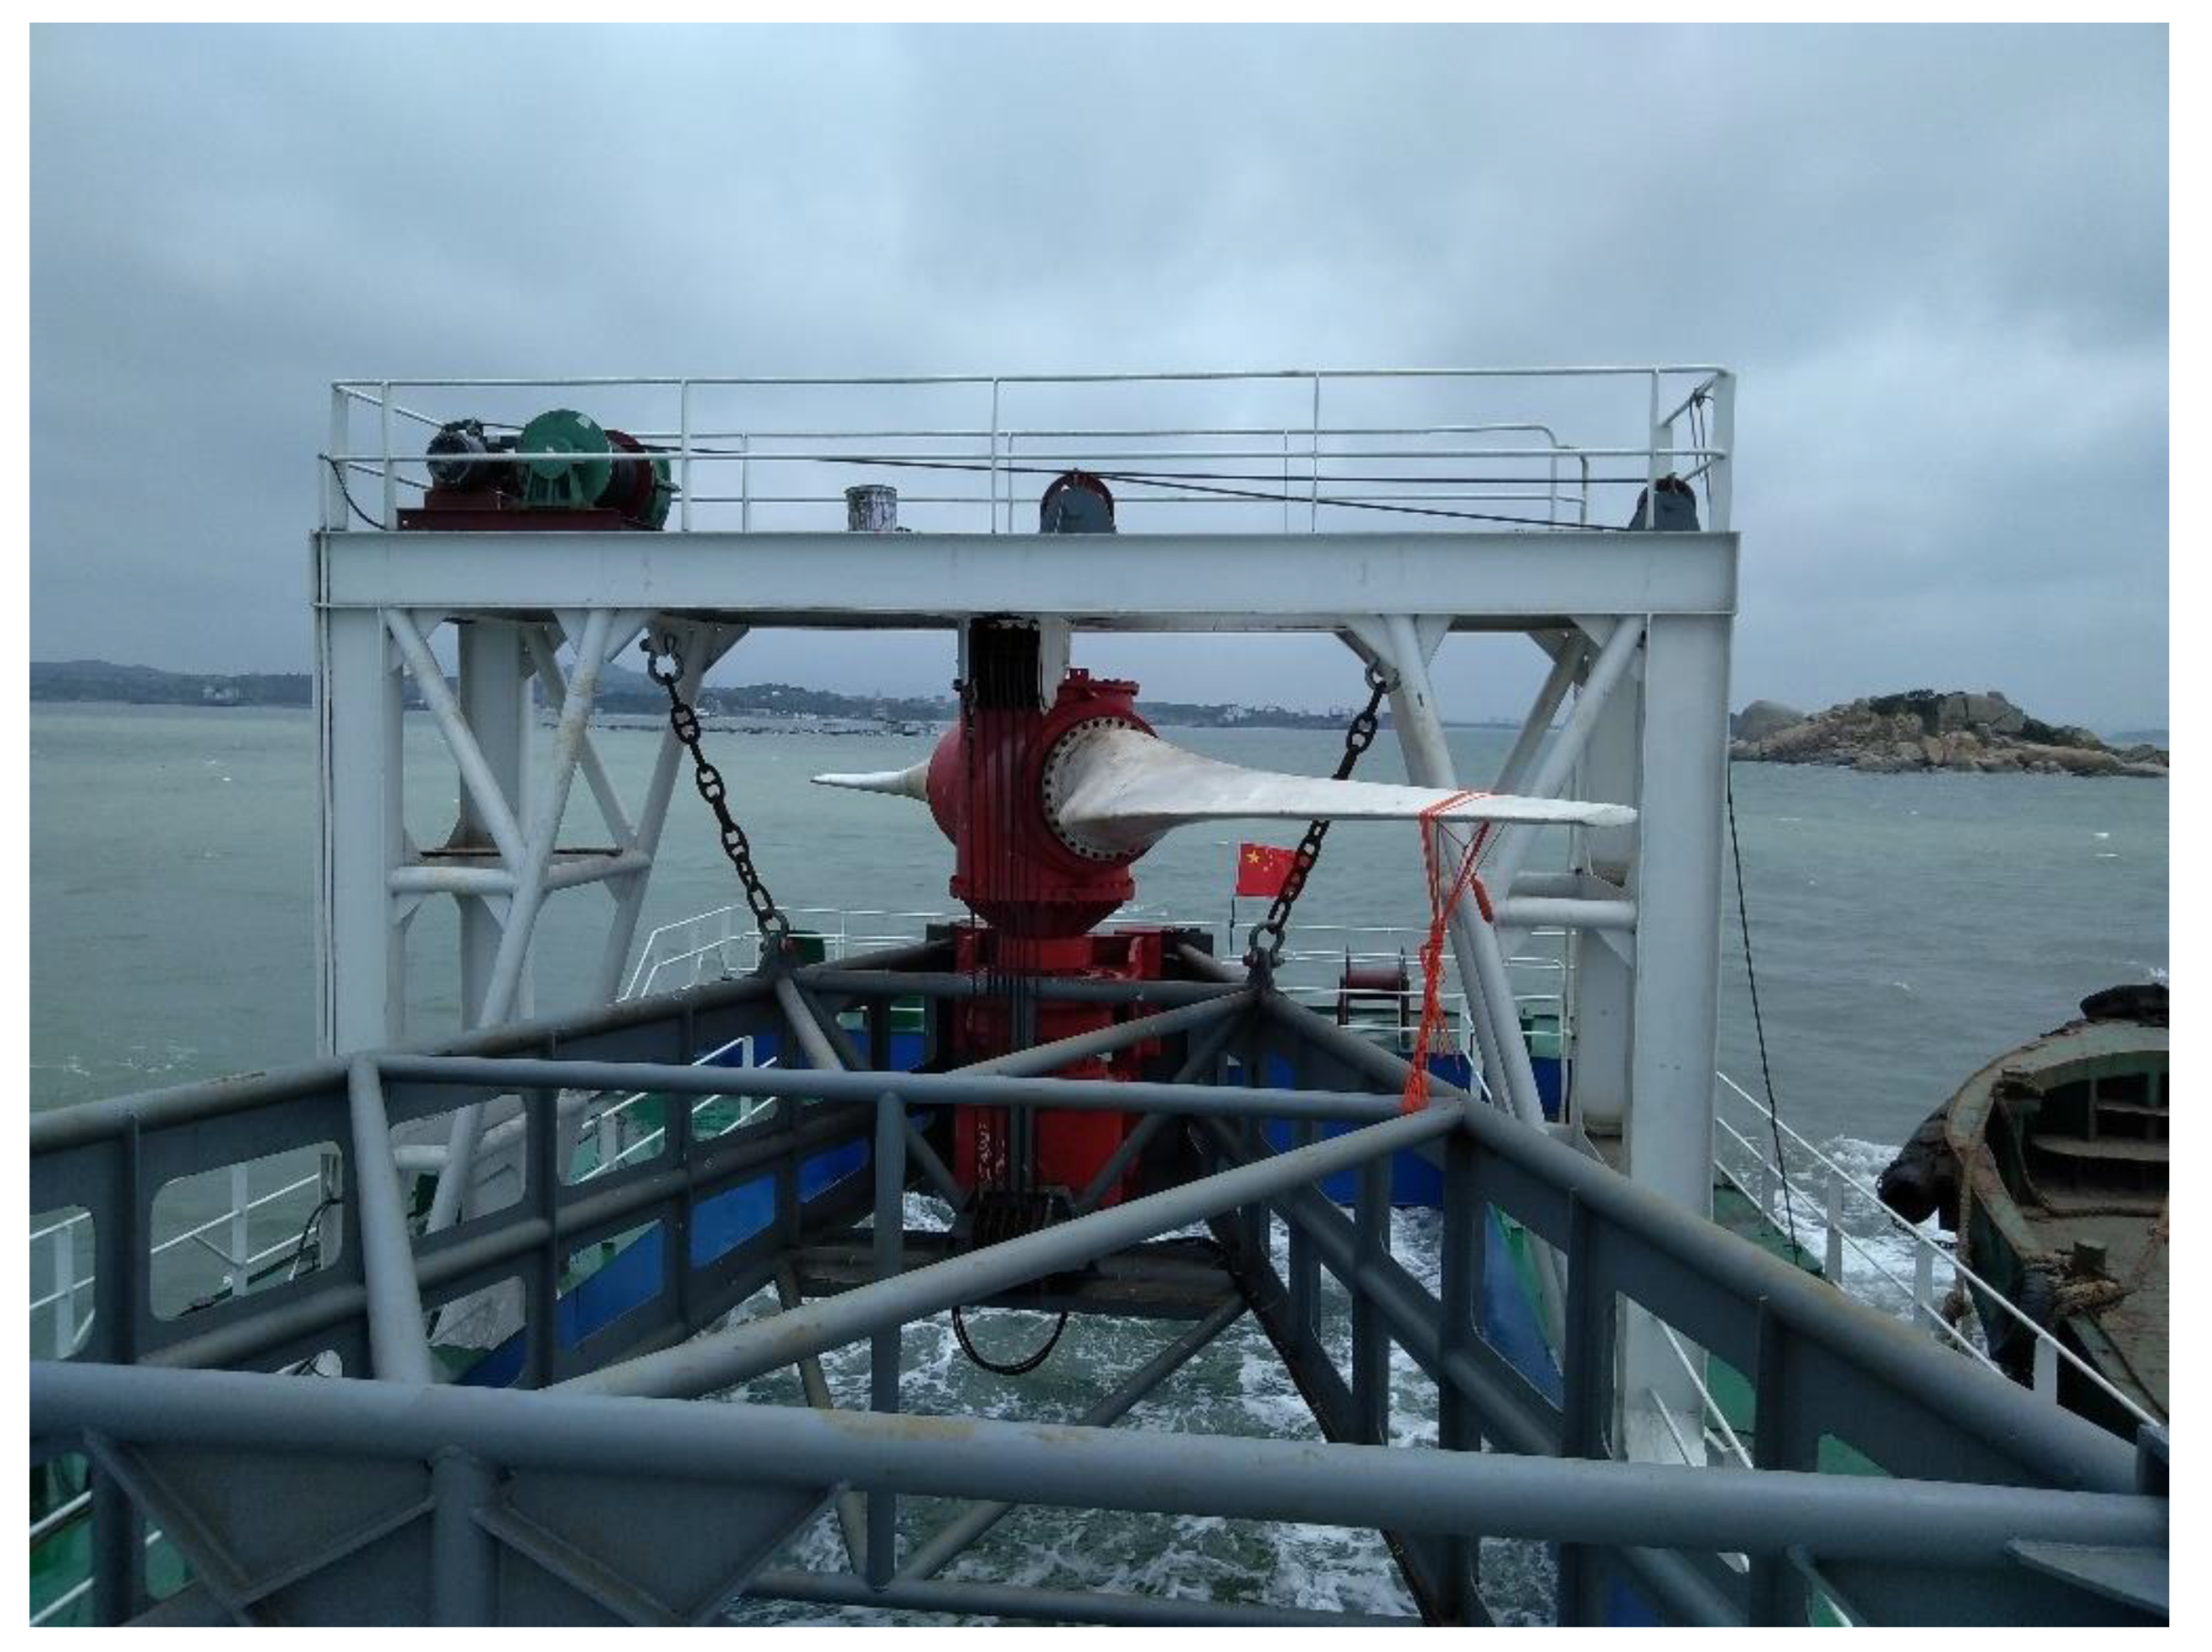
Figure 1. Prototype of the 120 kW HATCT.
Jmse 10 01578 g001
Figure 2. Geometric parameters of the blades: (a) chord; (b) twist angle.
Jmse 10 01578 g002
Figure 3. The test device.
Jmse 10 01578 g003
Figure 4. Cp calculated by test versus theoretical value.
Jmse 10 01578 g004
Figure 5. Generator performance test device.
Jmse 10 01578 g005
Figure 6. Results of the generator performance test: (a) speed; (b) output power.
Jmse 10 01578 g006
Figure 7. Comparison of torque characteristics between the generator and impeller.
Jmse 10 01578 g007
Figure 8. Torque characteristics of the impeller with different pitch angles under the low-flow velocity condition.
Jmse 10 01578 g008
Figure 9. Control results in the low flow rate stage.
Jmse 10 01578 g009
Figure 10. Output power of the turbine with varying pitch angles under various tidal velocities.
Jmse 10 01578 g010
Figure 11. Rate of the optimal pitch angle relative to the tidal velocity.
Jmse 10 01578 g011
Figure 12. Dynamic characteristics of an impeller with a high pitch angle under high flow velocity.
Jmse 10 01578 g012
Figure 13. Control flow chart.
Jmse 10 01578 g013
Figure 14. Simulation results of power generation when the maximum flow rate is 1.8 m/s.
Jmse 10 01578 g014
Figure 15. Simulation results of power generation when the maximum flow rate is 2.35 m/s.
Jmse 10 01578 g015
Figure 16. Simulation result of power generation when the maximum flow rate is 2.6 m/s.
Jmse 10 01578 g016
Publisher’s Note: MDPI stays neutral with regard to jurisdictional claims in published maps and institutional affiliations.