1. Introduction
Shipping is an important part of the global economy and trade, and international cooperation increasingly relies on ports. With the continuous development of ports, how to create a sustainable, green and safe port has become a hot spot in current research [
1]. In recent years, the smart port, which is the highest level of port development, represents the future development trend of ports. The smart port takes technological innovation as the means, takes the information network as the support, addresses key areas such as the wharf, the channel, the yard, operations and management, promotes its integration into new technologies, senses new information, incorporates new functions, realizes intelligent upgrading, green transformation, integration and innovation, creates an infrastructure system that meets the requirements of high-quality port development, strongly promotes the transformation of the new and old dynamic energy of the port and high-quality development, and realizes the digital transformation of the port and intelligent upgrading [
2]. With the guidance of national policies and the rapid development of ports, the construction of automated ports and intelligent port information systems is becoming increasingly important. How to objectively and accurately evaluate the development status of port wisdom and informatization holds great significance for promoting the transformation of new and old dynamics and high-quality port development and for realizing the intelligent upgrading and sustainable development of ports.
Starting in the 2010s, ports and terminals entered a fifth phase of development, characterized by their digital transformation and alignment with Industry 4.0 practices [
3]. Although the development of smart ports requires the use of new technologies such as the Internet of Things, 5G, and digital twins, according to [
4], smart port development projects around the world vary greatly in variability and complexity, depending on the port environment and policy reasons, which makes it difficult to use one evaluation system to assess smart port development in all developed and developing countries. At the same time, most current studies on evaluation systems for smart ports focus on the infrastructure construction evaluation of smart ports themselves [
5], green security evaluation [
6], and port competitiveness evaluation [
7]. However, for many developing smart ports, such an evaluation method does not seem to be “fair” because the construction of smart ports does not happen overnight and the final effect is composed of a variety of information systems. Even if the construction of one system is completed, it does not significantly reflect the effect on competitiveness, green security, or other aspects of the effect. Therefore, ports, especially port enterprises, are eager to know what kind of improvement each information system built brings to ports.
The smart port construction process includes the construction of many information systems. Information systems have become indispensable to the competitiveness of ports, facilitating communication and decision making for enhancing the visibility, efficiency, reliability, and security in port operations under various conditions [
8]. The types of information systems are complicated, and the development of a smart port may require the construction of more than thirty information systems with different functions. It is difficult to obtain the development status of the whole automated port through a set of index systems covering all information systems. How to scientifically measure and evaluate the scientific developments of port logistics is an urgent problem that needs to be solved in the future smart port development process [
9]. Therefore, providing value-added information services and analytics for information systems is increasingly important to maintain a competitive edge and to fulfill regulatory requirements [
8]. This paper explores an evaluation scheme for port construction performance by studying an evaluation system for an information system in the construction of smart ports.
Playing an important role in the information systems that need to be built in a smart port, the container terminal operation system (CTOS) serves as the “brain” of the container operation module of a smart port terminal, and it is also the way for many ports in China and elsewhere to realize “wisdom” and “automation”. Many ports in China and elsewhere must take the path of automation [
10]. However, there are few studies on evaluation schemes for CTOS construction performance, and the indexes are relatively rough, which makes it difficult to quantify the improvement in each dimension brought by CTOS construction to ports and causes great trouble for port decision makers. Then, it extends the evaluation scheme for a single system to all information systems of the whole port in the future to obtain a quantitative evaluation of the construction performance of the whole smart port.
Research on smart ports explores all aspects of such ports, and Ignacio’s literature review on ports and the maritime industry in the context of Industry 4.0 introduced in some detail the development trend of smart ports and various new technologies [
3]. Min further researched the future sustainable development of smart ports and the succession of digital automation in light of previous studies [
11]. Taewon et al. designed various types of evaluation systems for smart ports [
5,
11,
12,
13]. In contrast to the establishment scheme for smart port evaluation systems, the factors influencing the performance of port information system construction are complex and nonlinear, including new technologies, port conditions, green security, the social environment, and other factors [
2]. The current literature on smart port index design and evaluation mostly focuses on smart port infrastructure construction [
12] and competitiveness [
14]. Othman et al. argued that the economic, environmental, and social dimensions together constitute the evaluation model for smart ports [
4,
15]. However, as an information system in the construction of smart ports, the evaluation of the CTOS is not exactly the same as the evaluation scheme of smart ports, and it should be more closely related to the actual situation of ports to design construction performance indicators that can truly fit CTOS development [
16]. The objective of this paper is to study the information system of the smart port under construction and to understand what kind of improvement in service quality and efficiency is brought to Beibu Gulf Port, especially Qinzhou Container Terminal, by the enormous manpower, financial resources, and time spent by the company in the process of developing the terminal operating system from scratch.
There are many evaluation schemes for port construction performance. In the latest publication from 2022, Zhang evaluated the efficiency of shoreline resource use by employing a combination of the analytic hierarchy process (AHP) and information entropy subjective–objective schemes [
17]. Lin used a combination of Bouda counting and fuzzy hierarchical analysis to analyze and compare the variability of indicators in smart port development and studied the reasons for the variability of indicators [
14]. Wang relied on DEC evaluation criteria and used a fuzzy multicriteria decision analysis scheme combined with the technique for order of preference by similarity to the ideal solution (TOPSIS) to effectively evaluate the performance of port services [
9]. The literature above shows that most of the latest port evaluation articles have adopted a combination of subjective and objective indicator evaluation schemes to derive valid evaluation results, and this paper also draws on such a combination of subjective and objective evaluation schemes.
In terms of subjective evaluation, Wang used the ANP to describe the network relationship between indicators and proposed a fuzzy analytic network process (FANP) comprehensive evaluation model to determine the construction performance of wind energy projects [
18]. Hua used a fuzzy importance–performance analysis (FIPA) scheme to determine the performance of green ports in the green evaluation scheme and proposed that Z ports should focus on monitoring energy consumption and pollutant emissions [
19]. John proposed a Bayesian network to model impact variables for the complexity of coastal system evaluation and used a fuzzy analytic hierarchy process (FAHP) scheme to determine the weights [
20]. Regarding objective evaluation schemes, Mandal et al. used interpretive structural modeling (ISM) to assess the key criteria of sustainable supply chain practices and the importance of the supply chain [
21,
22]. Wang used a cross-impact analysis (CIA)-ISM scheme to analyze the critical time for outbreak prevention and control under the impact of COVID-19 and proposed an effective emergency management scheme [
23]. Zhang used the idea of a game to integrate ISM to identify the factors that affect the heritage of kite traditional art [
24]. In summary, ISM identifies indicators and has good scalability and visibility in determining the relationship of indicators in objective evaluation schemes. Furthermore, as a widely used analysis method for subjective evaluation, the ANP has been used several times in recent papers.
In the study of quantitative evaluation models, Ha used the decision-making trial and evaluation laboratory (DEMATEL) and the ANP to propose a port performance measurement (PPM) hybrid quantitative evaluation model and demonstrated it in four major Korean container ports to derive the quantitative impact of each stakeholder group on port performance evaluation [
25]. Duman conducted quantitative ranking evaluation based on the indicator weights derived from a DEMATEL-ANP scheme together with an artificial neural network approach, using criteria and models instead of the relational data between indicators [
26].
In summary, the innovations of this paper are mainly as follows.
A quantitative evaluation model for the port CTOS construction performance evaluation system is built using the GCM to evaluate and validate the CTOS of the Port B Qinzhou Collection Division, proving that the performance evaluation method has a high degree of credibility and objectivity. A visualized quantitative analysis and evaluation method for smart port construction performance is proposed.
The combination of the improved AISM model using the rotation extraction method and the traditional ANP model deals with the inconsistent and missing database of the expert judgment matrix in the ANP method and compensates for the subjective difficulty of experts in determining the relationship of importance between factors. This method makes the calculation of the CTOS construction performance evaluation index weights more reasonable and the quantitative results more consistent with the actual situation. A combined subjective and objective evaluation idea is proposed.
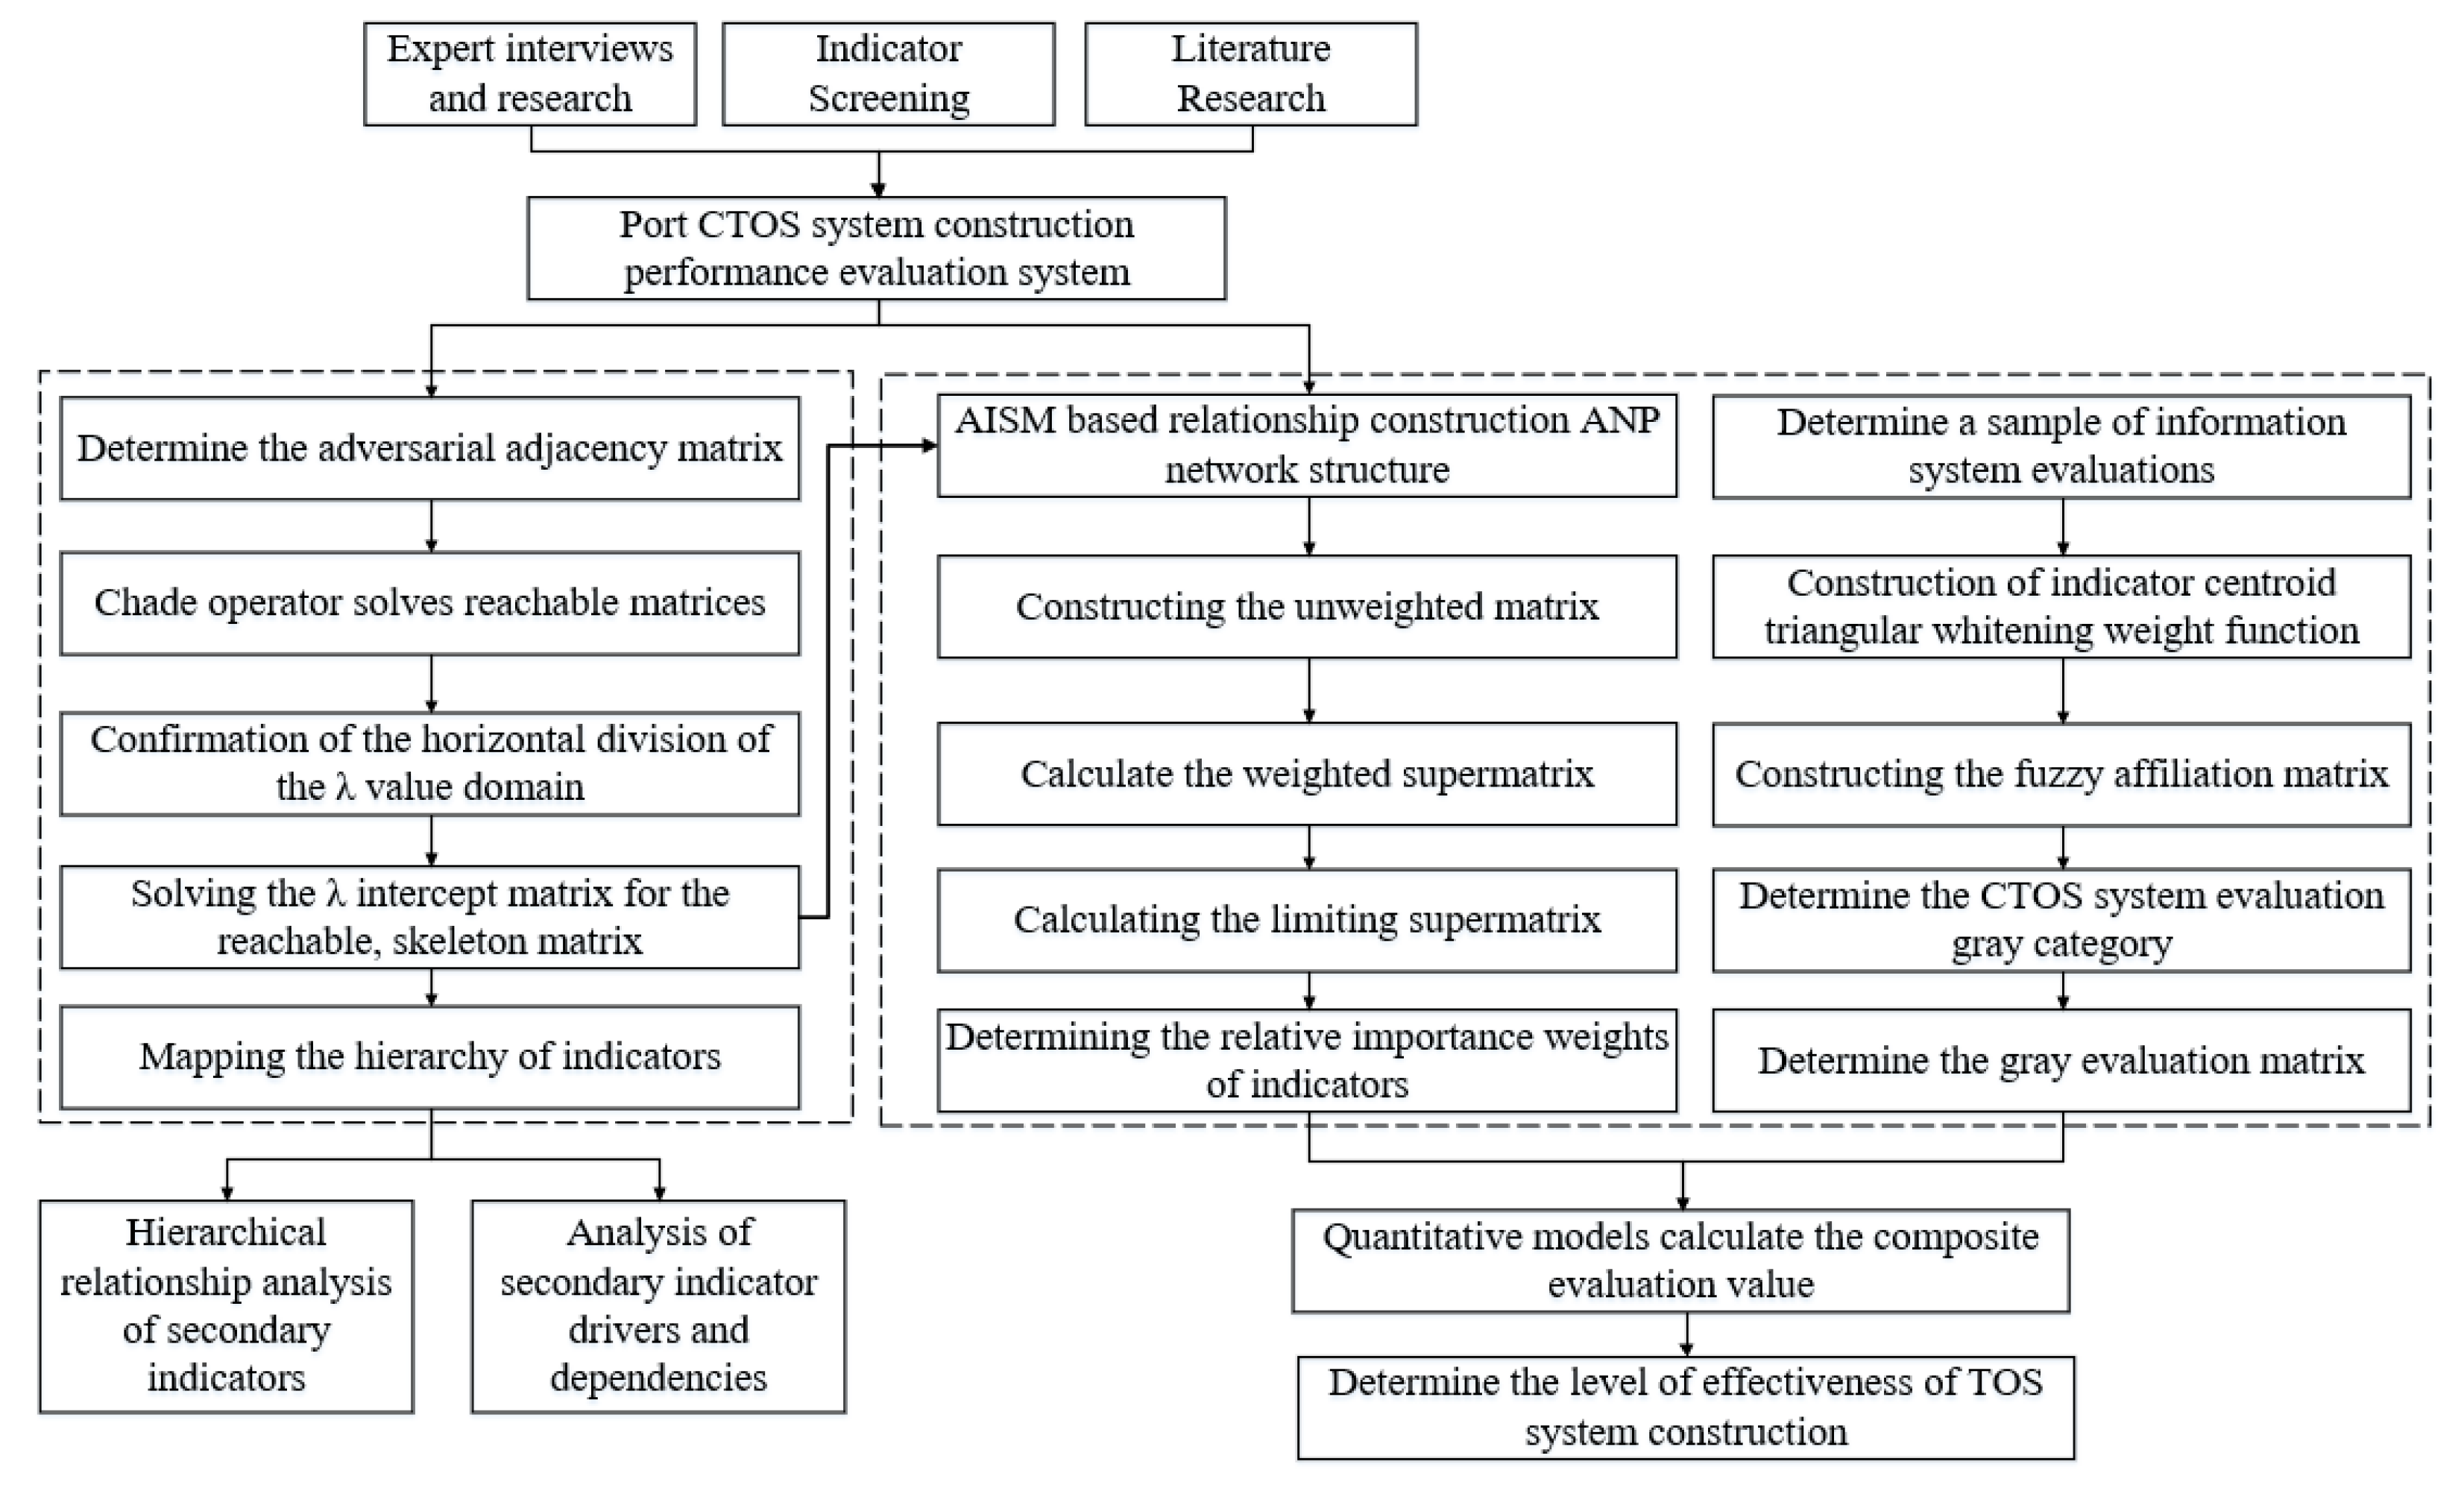
The evaluation model and scheme for the CTOS were determined through literature research and background research on the Port B CTOS. First, the CTOS construction performance evaluation system is constructed, the model is analyzed using AISM, and the recursive structure hierarchy topology of factors affecting the CTOS is drawn based on the AISM results and the steps are illustrated graphically in the leftmost column of
Figure 1. Second, the indicator influence relationship output by the element group of AISM is used as the input of the ANP network structure relationship, the indicator weight results of the evaluation model are derived by applying the AISM-ANP, and the steps are illustrated graphically in the middle column of
Figure 1. Finally, the GCM is used to construct a quantitative evaluation model to evaluate the CTOS of the Port B Qinzhou set and are illustrated graphically in the rightmost column of
Figure 1.
The most critical steps related to AISM are shown below.
Step 1: The degree of direct relationship between the identified indicators is established by expert judgment. According to the statistical results, the initial fuzzy relationship adjacency matrix A0 between the risk factors is obtained.
Step 2: Choose the maximum–minimum fuzzy operator to find the fuzzy reachable matrix A by matrix power multiplication.
Step 3: Count the set of value domains λ in the fuzzy reachable matrix, i.e., all values that are not 0 or 1.
Step 4: Find the value domain set λ intercept array Aλi respectively, i.e., the operation that is transformed into AISM.
Step 5: Calculate the reachable matrix and skeleton matrix of all λi, reduce the edges, and perform the hierarchy division to draw the hierarchy diagram.
This paper is organized as follows: in
Section 1, a literature review on the adversarial interpretive structural modeling (AISM) and analytic network process (ANP) methods is conducted, and a joint AISM-ANP solution is proposed.
Section 2 constructs a construction performance evaluation model for the CTOS.
Section 3 introduces the improvement scheme of the two algorithms and the joint application of the solution method. The case study in
Section 4 introduces the gray clustering method (GCM) quantitative evaluation model to quantitatively evaluate the CTOS of the Qinzhou Collective Division.
Section 5 concludes and discusses using the proposed quantitative evaluation extension scheme for all information systems in smart ports.
2. CTOS Construction Performance Evaluation System Design
From existing studies on the port CTOS, some indicators are more concise, but the indicators are more subjective. Other indicators are more objective, but the indicators contain a complicated content system, and the operability of evaluation is not strong. The common defect is that the theoretical basis of evaluation index system research for the CTOS is relatively weak and there is no systematic evaluation scheme. Exploring an objective and concise evaluation system for enterprise knowledge competitiveness with solid theoretical support is obviously a problem that needs to be solved in the future. It is also the key point that this paper wants to explore and in regard to which it hopes to achieve a breakthrough.
As the core information system in the whole of smart port construction, the CTOS contains container operations, the container yard station, container intelligent cargo handling, intelligent planning and scheduling, chokepoint operations, and other systems. The CTOS is mainly responsible for collecting and integrating port berths, production planning, the loading and unloading situation, vehicle positioning, equipment monitoring, access gates, operation automation, and other information. It provides comprehensive information support for the internal operation of the terminal; thus, the functions of all aspects of the CTOS should be considered in the evaluation process.
In the process of evaluating the performance of CTOS construction, the secondary indicators are not only intricate, but also have influential relationships with many specific criteria indicators. To ensure the rationality of the CTOS evaluation index system and the objectivity and reliability of the performance evaluation results, this paper deconstructs the CTOS. Based on the relevant research literature and combined with the inspection and interview records at the dock site in previous research, the initial index form was established by using questionnaires to extract three dimensions, i.e., management capability, the business level, and economic efficiency. Subsequently, the Delphi method was used to investigate the reasonableness of the screening judgment of the indicators, and 37 factors affecting the performance of CTOS construction were initially identified. On this basis, following the principles of hierarchy, system completeness, and concise science, this paper took the connotation and basic characteristics of the CTOS in Port B, the research results of authoritative institutions and scholars in China and elsewhere, and the information system situation of field construction as the reference basis. Through field research and interviews, this paper finds that this is a very urgent issue in the process of the scientific management of ports and enterprises.
Six academic researchers, two terminal managers, and four terminal technical staff members were invited to form an expert team for scoring and evaluating the questionnaire. After the research team’s discussion and expert consultation, the original system of indicators was developed and is shown in the table below. We selected a total of 47 indicators related to the construction of the CTOS from the questionnaire survey and the indicators mentioned in the official data released by each port. The three dimensions are presented in
Table 1.
Operational level: The operational level index is the key index used to measure whether the CTOS can play its role after construction, i.e., the index used to measure the impact of the system on port operation capability. Most of the literature focuses on indicators of smart port infrastructure construction and competitiveness, but the evaluation of the CTOS as an information system in smart port construction is not exactly the same as the evaluation scheme of smart ports. In this paper, through fieldwork, we draw on [
13,
27] for the port production and operation system indexes used in this paper, and smart port operation indexes to design two secondary indexes—port operation and chokepoint operation—using the CTOS system. The following eight tertiary indexes are used to reflect the improvement in the port’s services to users: the subordinate average station time efficiency of the shore bridge, the average container ship berthing time per thousand tons of cargo loaded and unloaded in the port, the average container liner ship time efficiency, the container 100 m shoreline utilization rate, the average time spent for vehicle crossing gates, the accuracy of image recognition of vehicle license plate crossing gates, the proportion of electronic vehicle pass documents, and the one-time pass rate of vehicles passing through the gates.
Management capability: The management capability index is an important indicator for measuring the performance of the CTOS, that is, for measuring whether the system itself is built to meet the requirements of wisdom and informatization. In this paper, based on [
13,
28], smart port energy and environment indicators and safety and security evaluation system and evaluation rules are adopted. Based on [
29,
30], port operation indicators in the design of the ease of operation, the business realization degree, and other indicators are adopted. Based on [
9], the service performance evaluation system and the service efficiency evaluation module are added as management indexes. Integrating the above literature and expert deliberations, this paper divides the management capability indicators into three secondary indicators, i.e., service capability, green security, and system flexibility. To evaluate the operational performance of the information system in the port, the subordinate indicators are terminal coverage, the human-machine control ratio, the business realization degree, operation simplicity, the container operating system billion-ton throughput mortality rate, the pollutant emission level, the CTOS energy consumption level, disaster recovery capability, exploitability, hardware compatibility, visualization performance, and business exception handling capability.
Economic efficiency: The establishment of economic level indicators is an indispensable part of an enterprise when measuring almost all of its own construction. The economic issues in the development of smart ports are not the focus of research at present, but the ultimate purpose of smart port construction for port enterprises is for ports to better reduce costs and increase efficiency. For the future index system to have a broader application scenario, this paper, after reading the relevant literature and after expert deliberations, decided to add economic indicators to measure CTOS construction performance. The selection of indicators draws on [
31,
32,
33] to adopt port financial and trade service indicators and related design schemes, and three three-level indicators are established, including the system construction cost, system maintenance cost, and system future revenue.
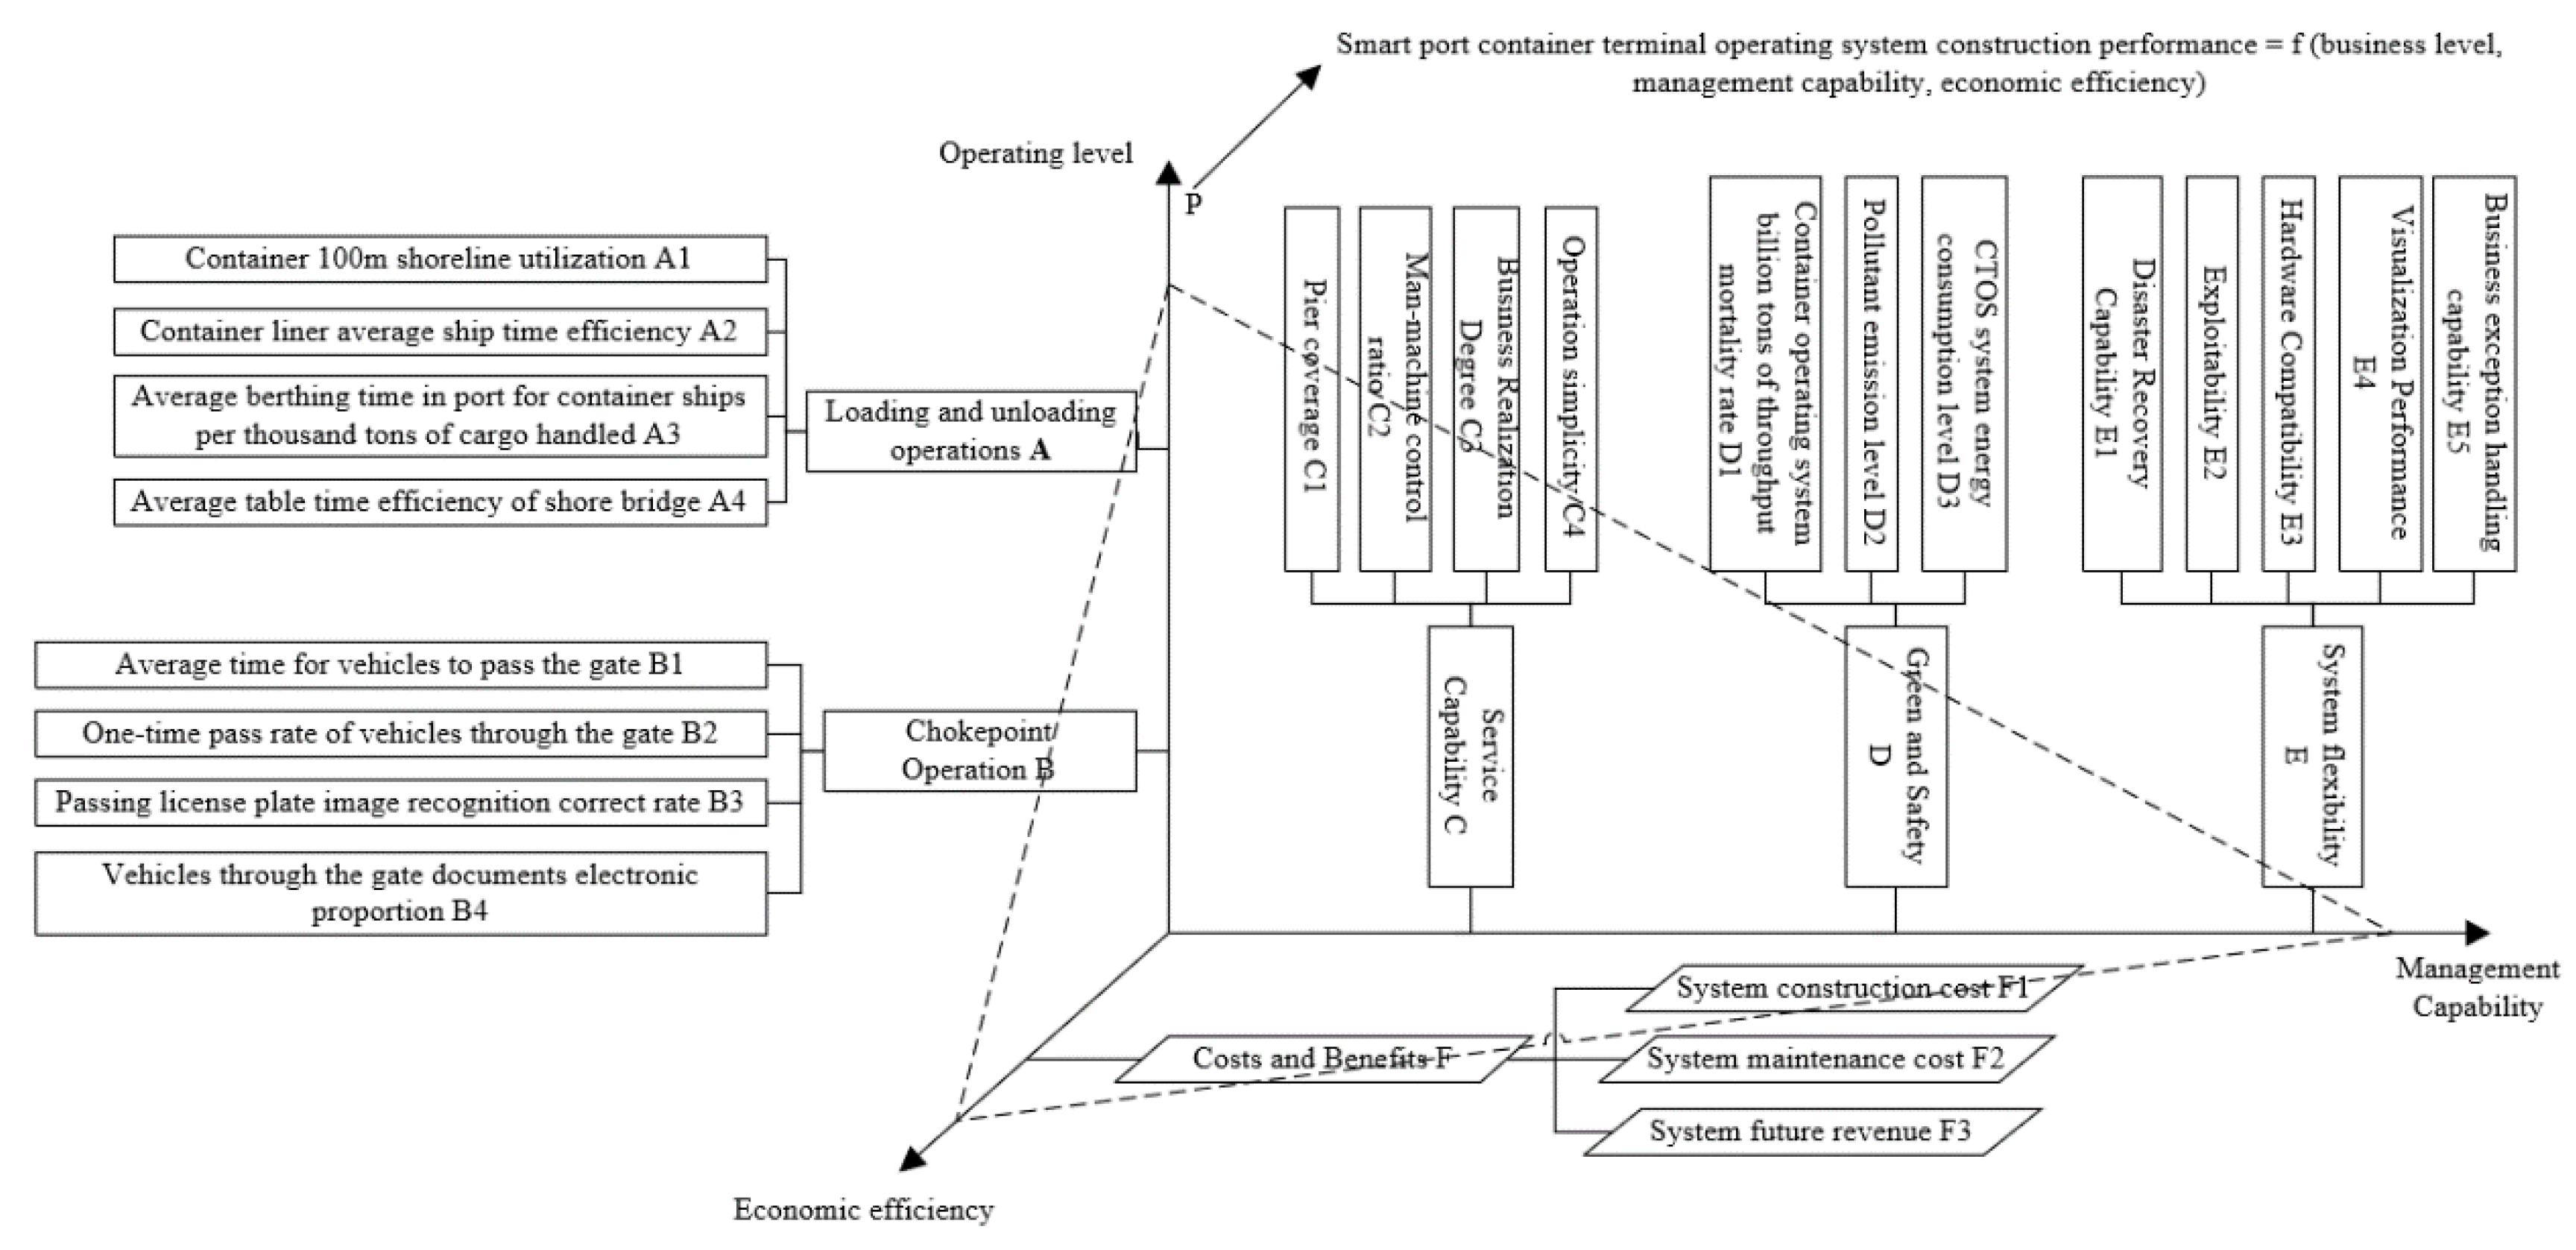
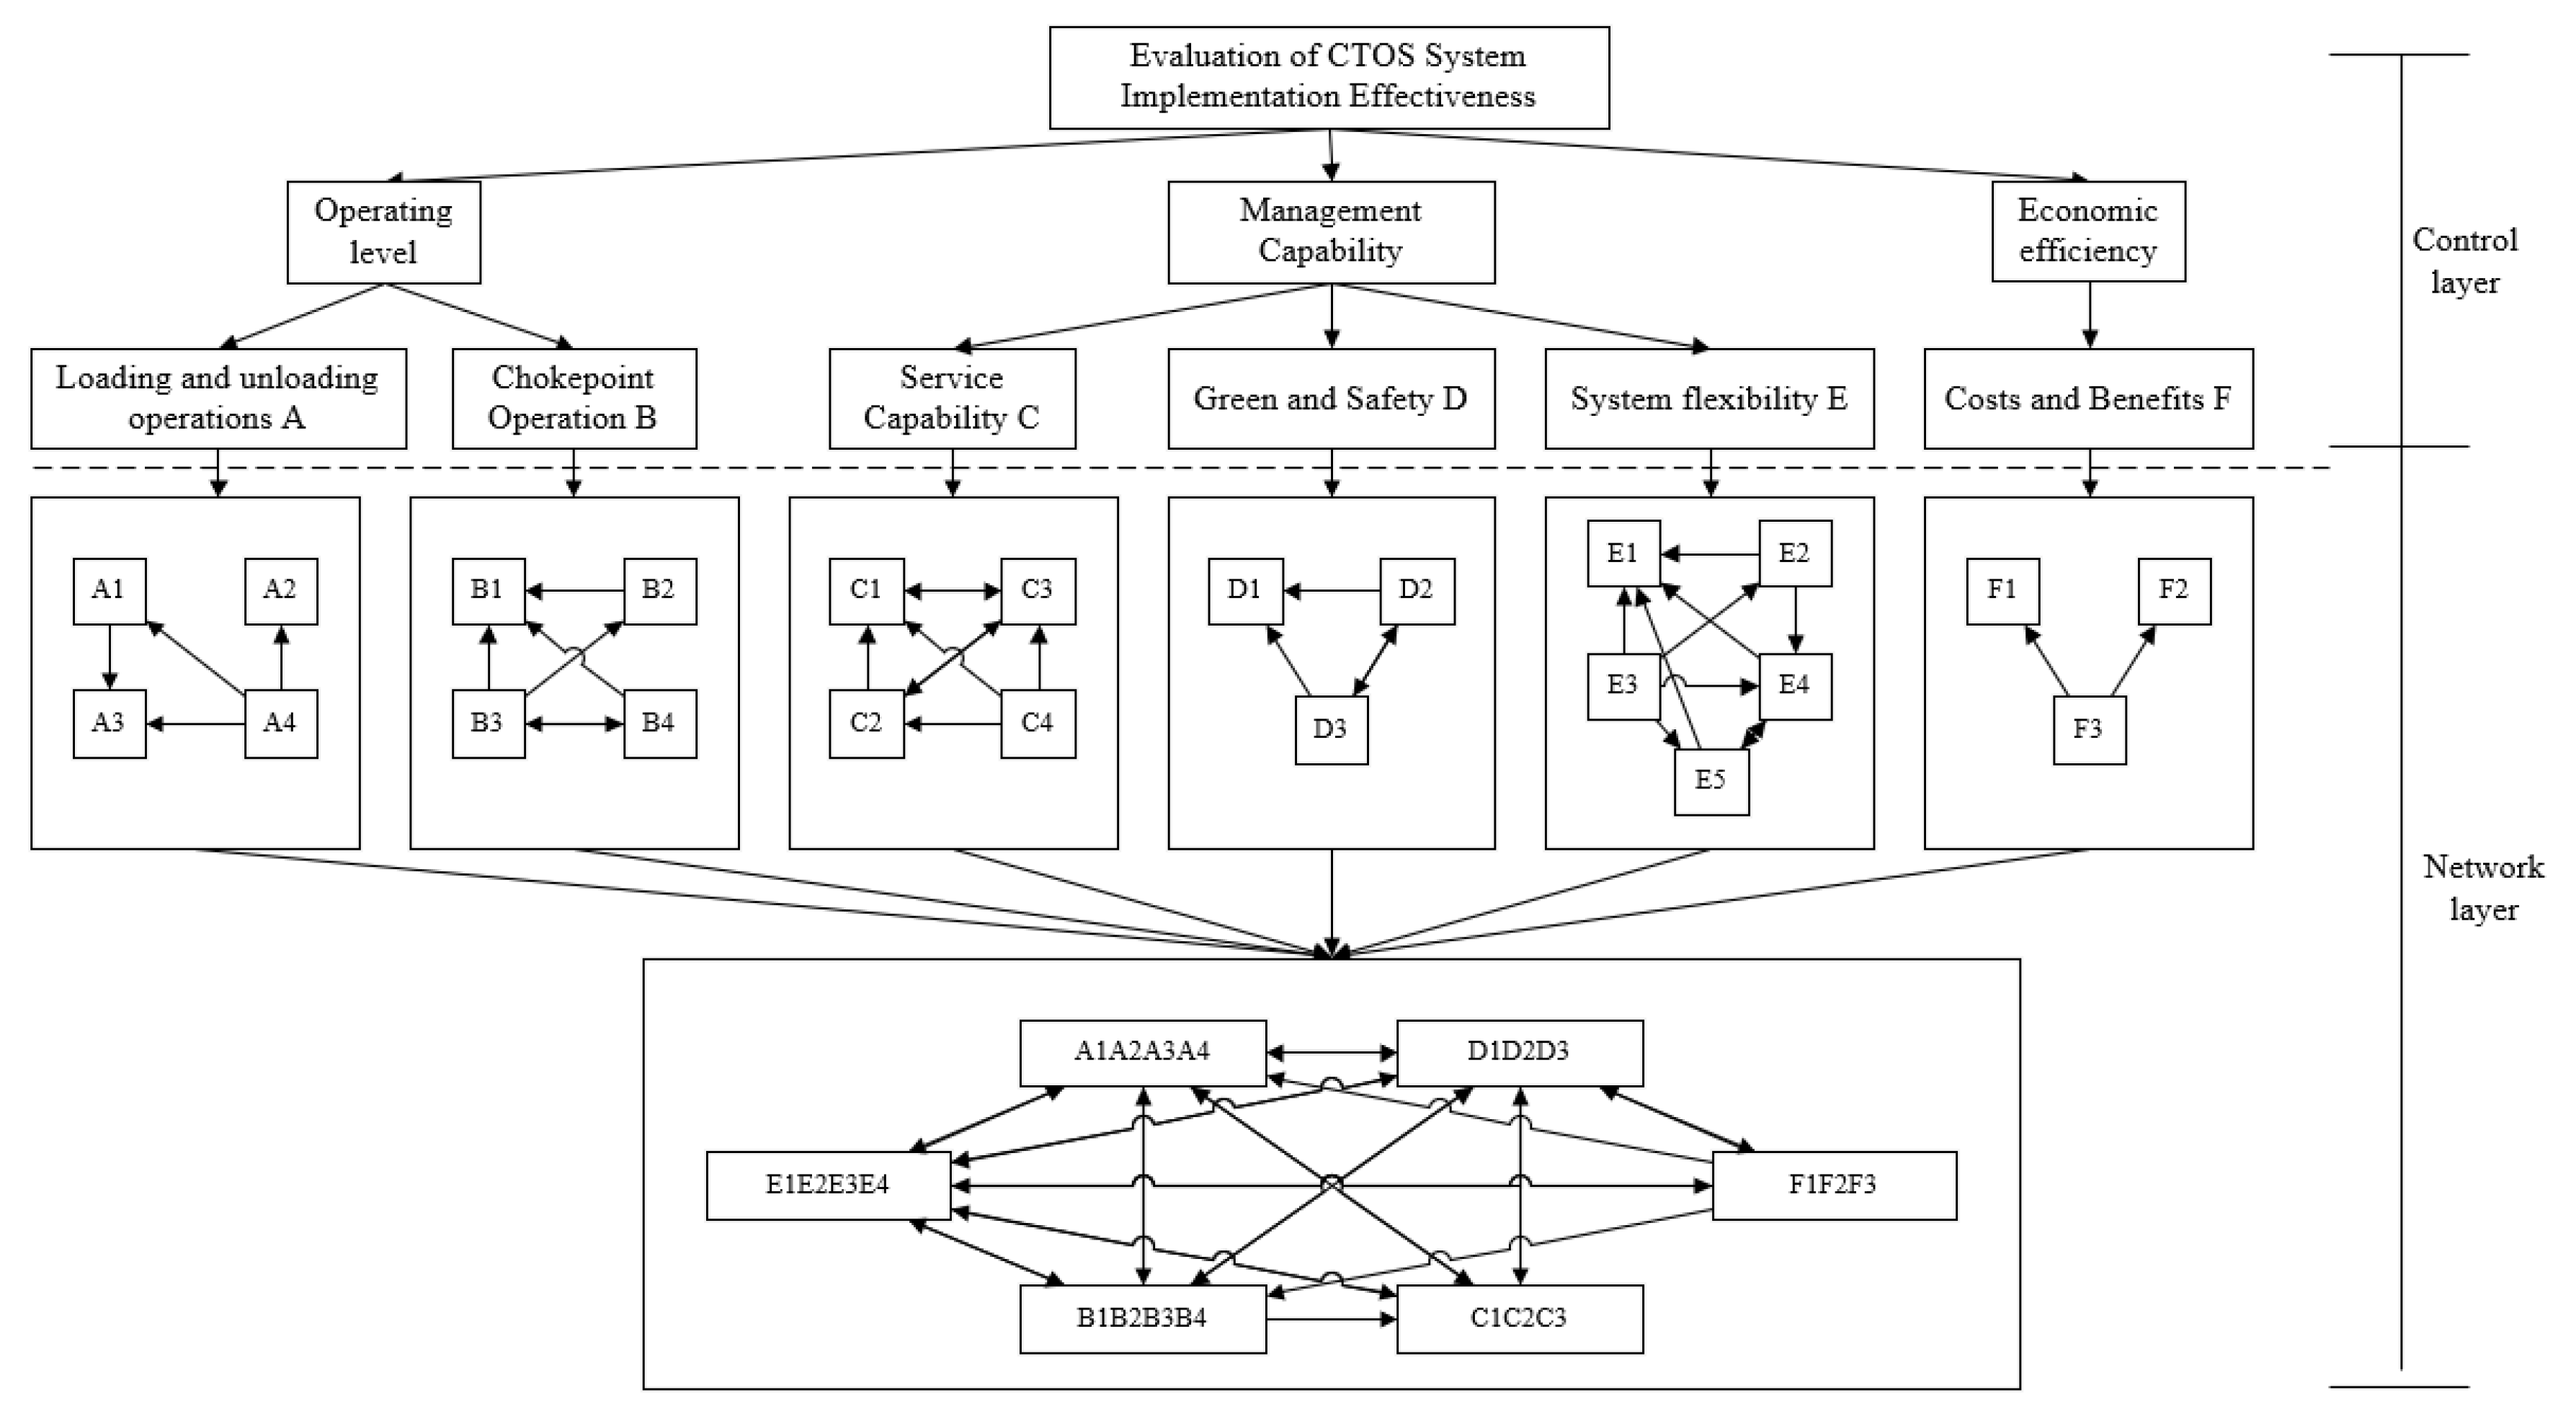
The indicator construction model is shown in
Figure 2.
4. Results and Discussion
4.1. Port Information System Construction Performance Evaluation Modeling
Based on the existing index system, after expert evaluation, the economic indicators, due to the policy influence and the variability between different information systems, will greatly affect the results of other indicators when added to the AIM equation in which the relationship between the elements of the indicators is causal.
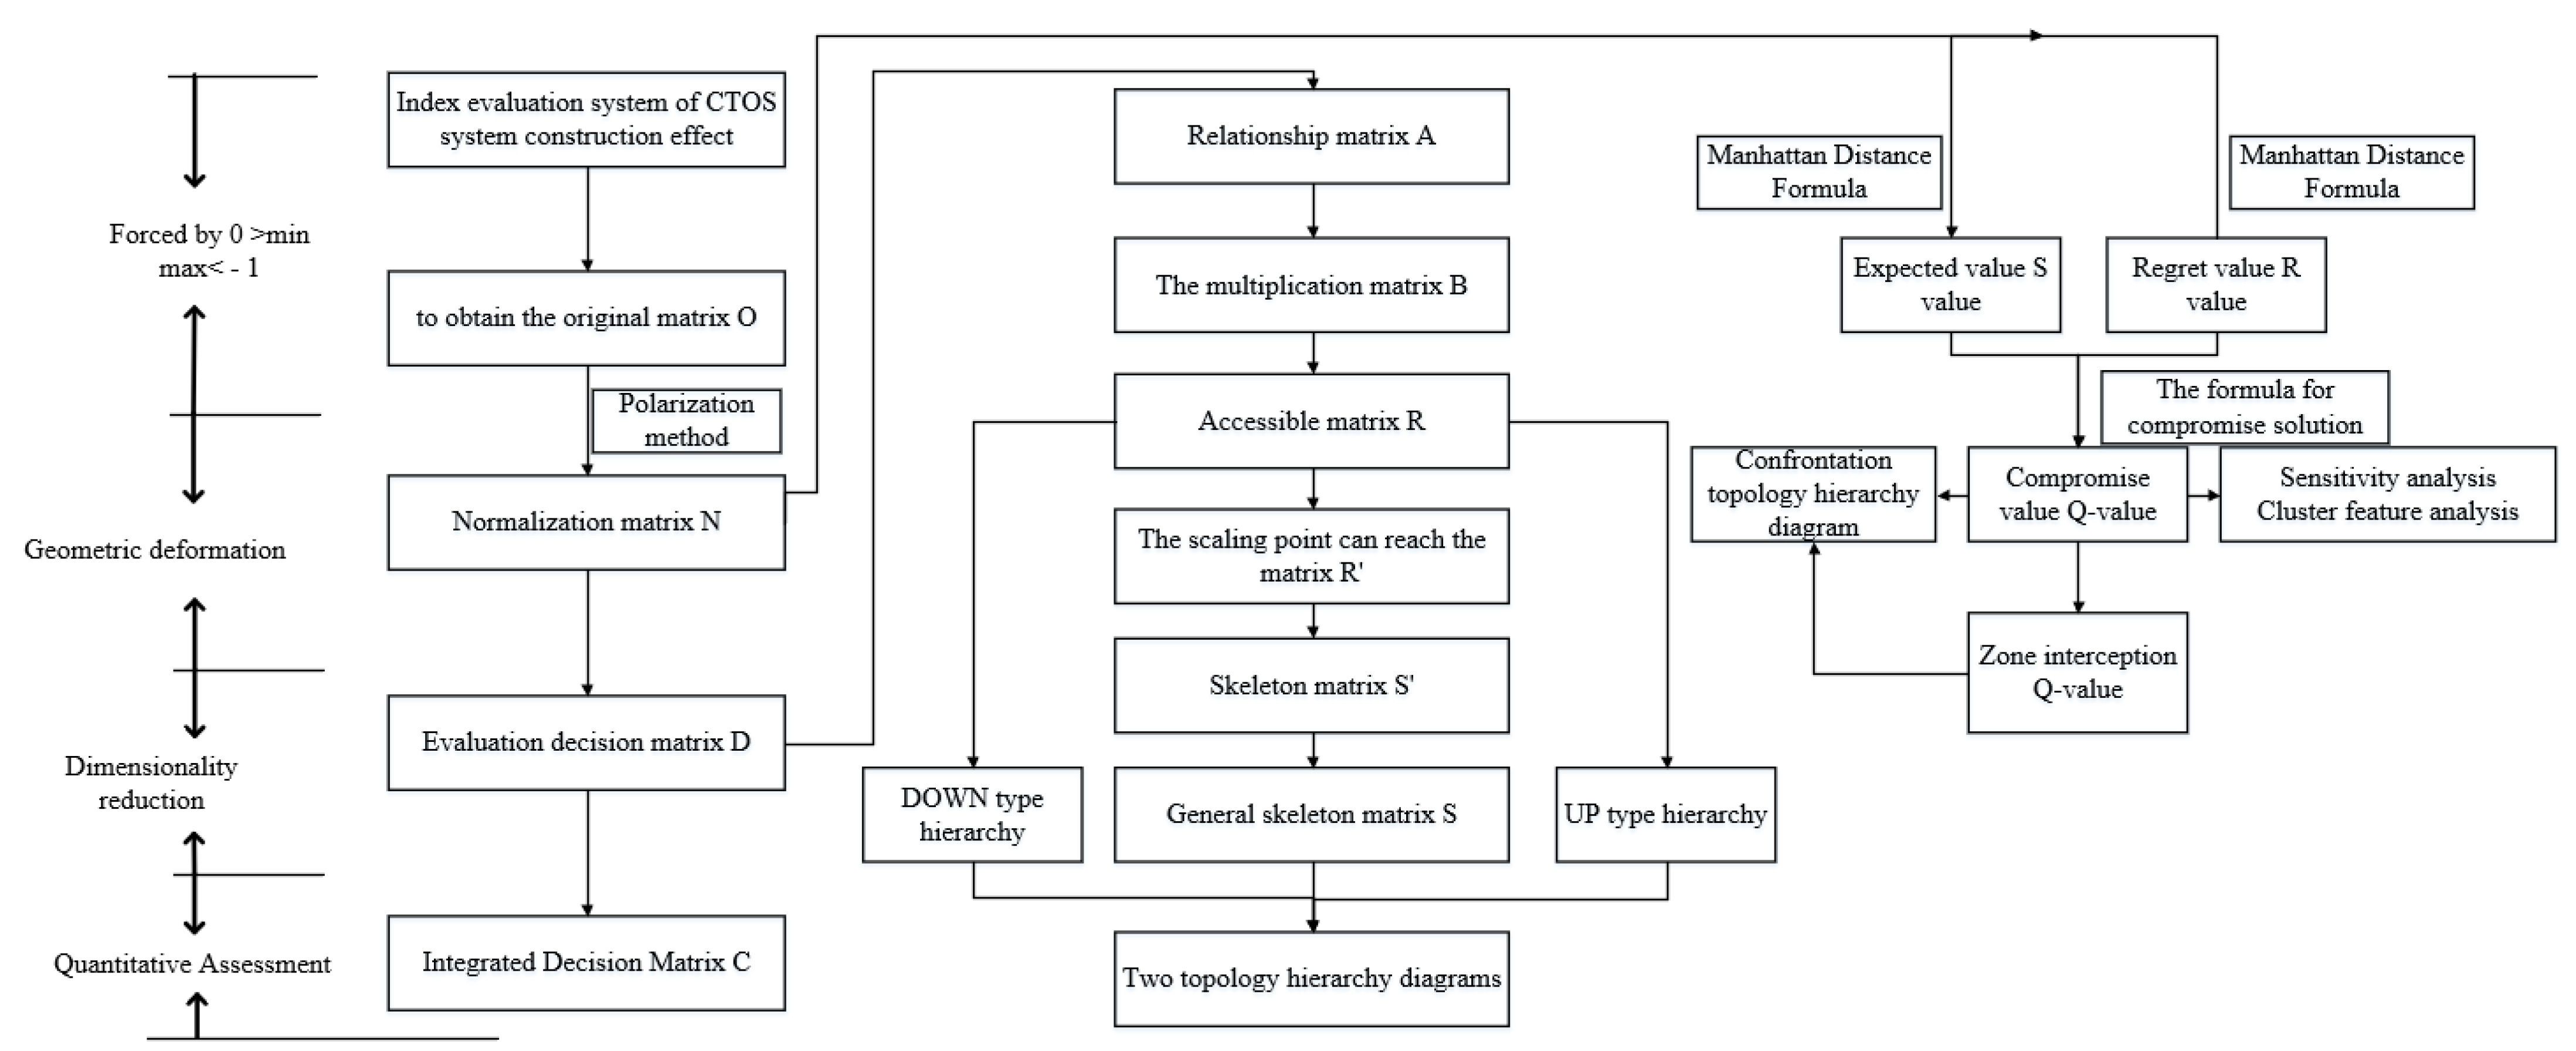
(1) UP type. The UP-type hierarchical diagram, i.e., result-first hierarchical division, has the extraction rule T(ei) = R(ei). For DAG diagrams without loops, the operation can be performed with matrix A + I, i.e., the skeleton matrix in which the main diagonal is filled with one repetitive reachable set and the common set are the same on the extraction of elements, where I is the unit matrix. The essence is to extract the elements of the final result in the system, place them at the top, and then extract them by analogy, placing the extracted elements in a top-down manner.
(2) DOWN type. The DOWN-type hierarchy diagram, i.e., the cause priority hierarchy, has the extraction rule T(e
i) = Q(e
i). The elements of the extraction system that are the root causes are placed at the bottom of the hierarchy, and the extracted elements are placed in a bottom-up manner. The extraction process is shown in
Figure 4.
The internal relationship between the influencing factors is determined by expert scoring. Based on this assignment rule, an adjacency matrix A is constructed, and the phase multiplication matrix B is obtained using the unit matrix I. The reachability matrix R is obtained by concatenating the multiplication of B. The loops in the reachability matrix R are regarded as points, i.e., shrinkage points, and the shrinkage point reachability matrix R′ can be obtained. Then, the shrinkage operation is expanded to remove all repeated paths, and the loop factors are substituted to obtain the general skeleton matrix S, as shown in
Appendix A Table A1,
Table A2 and
Table A3 for full trans.
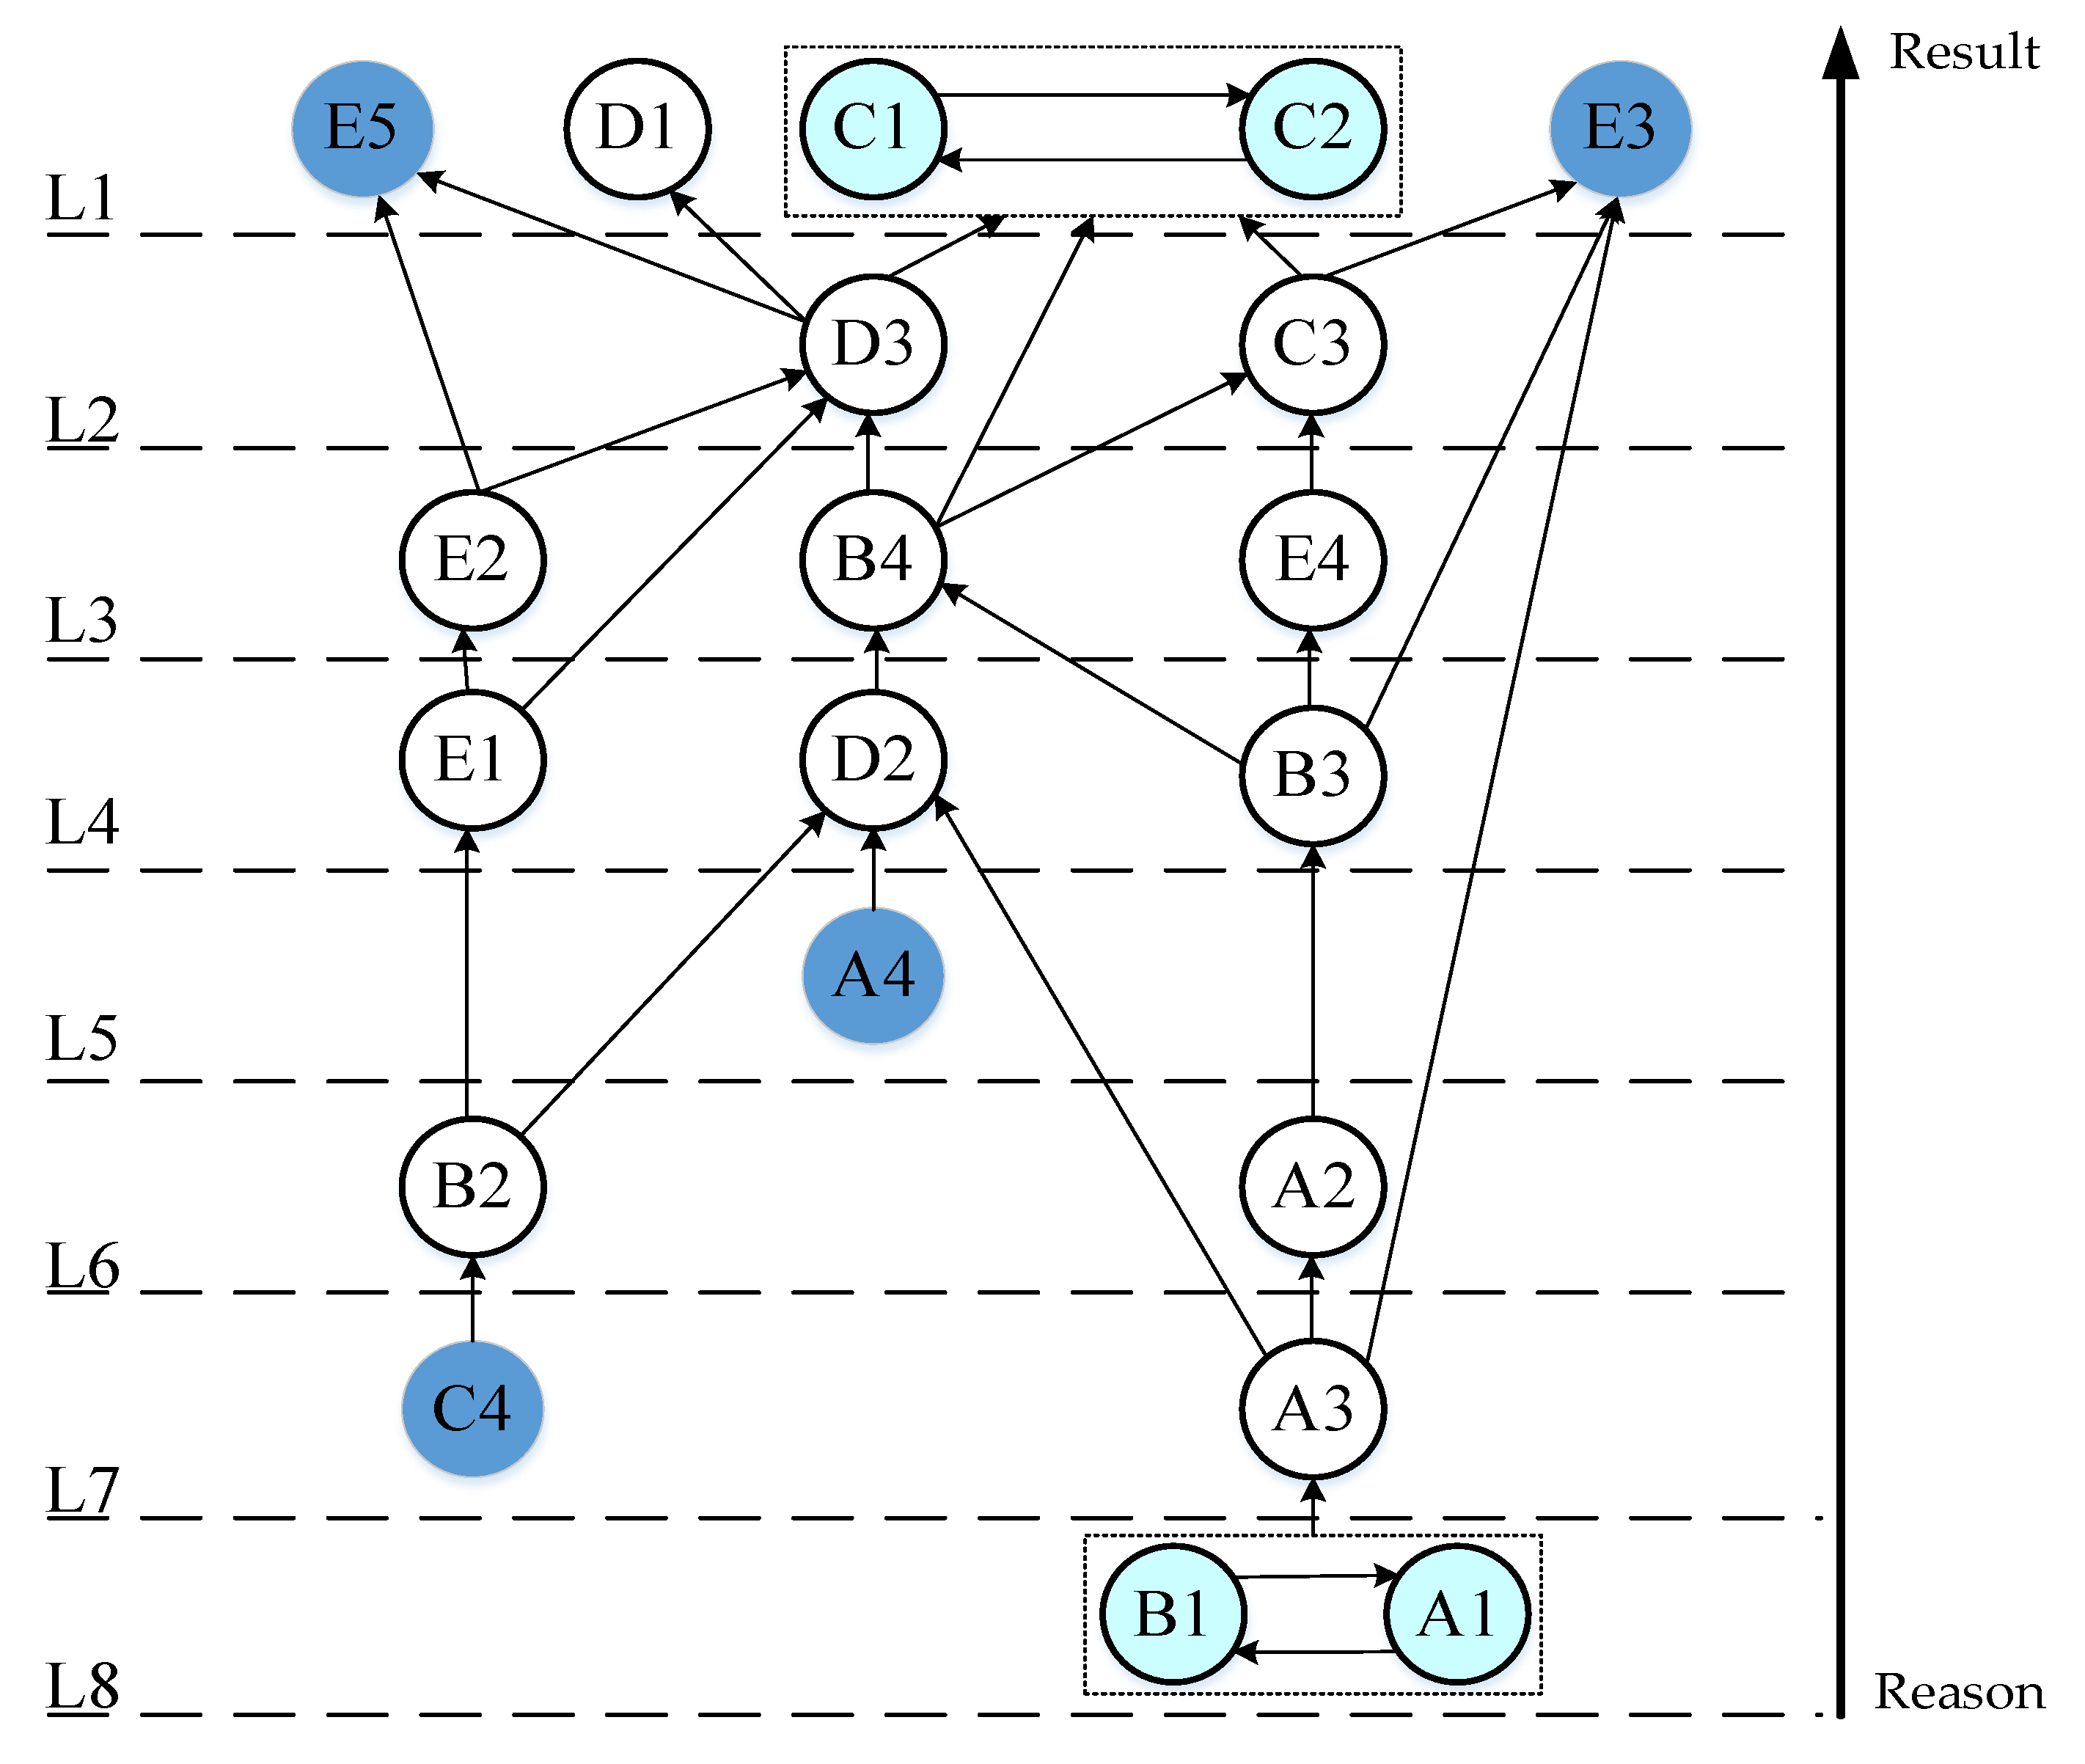
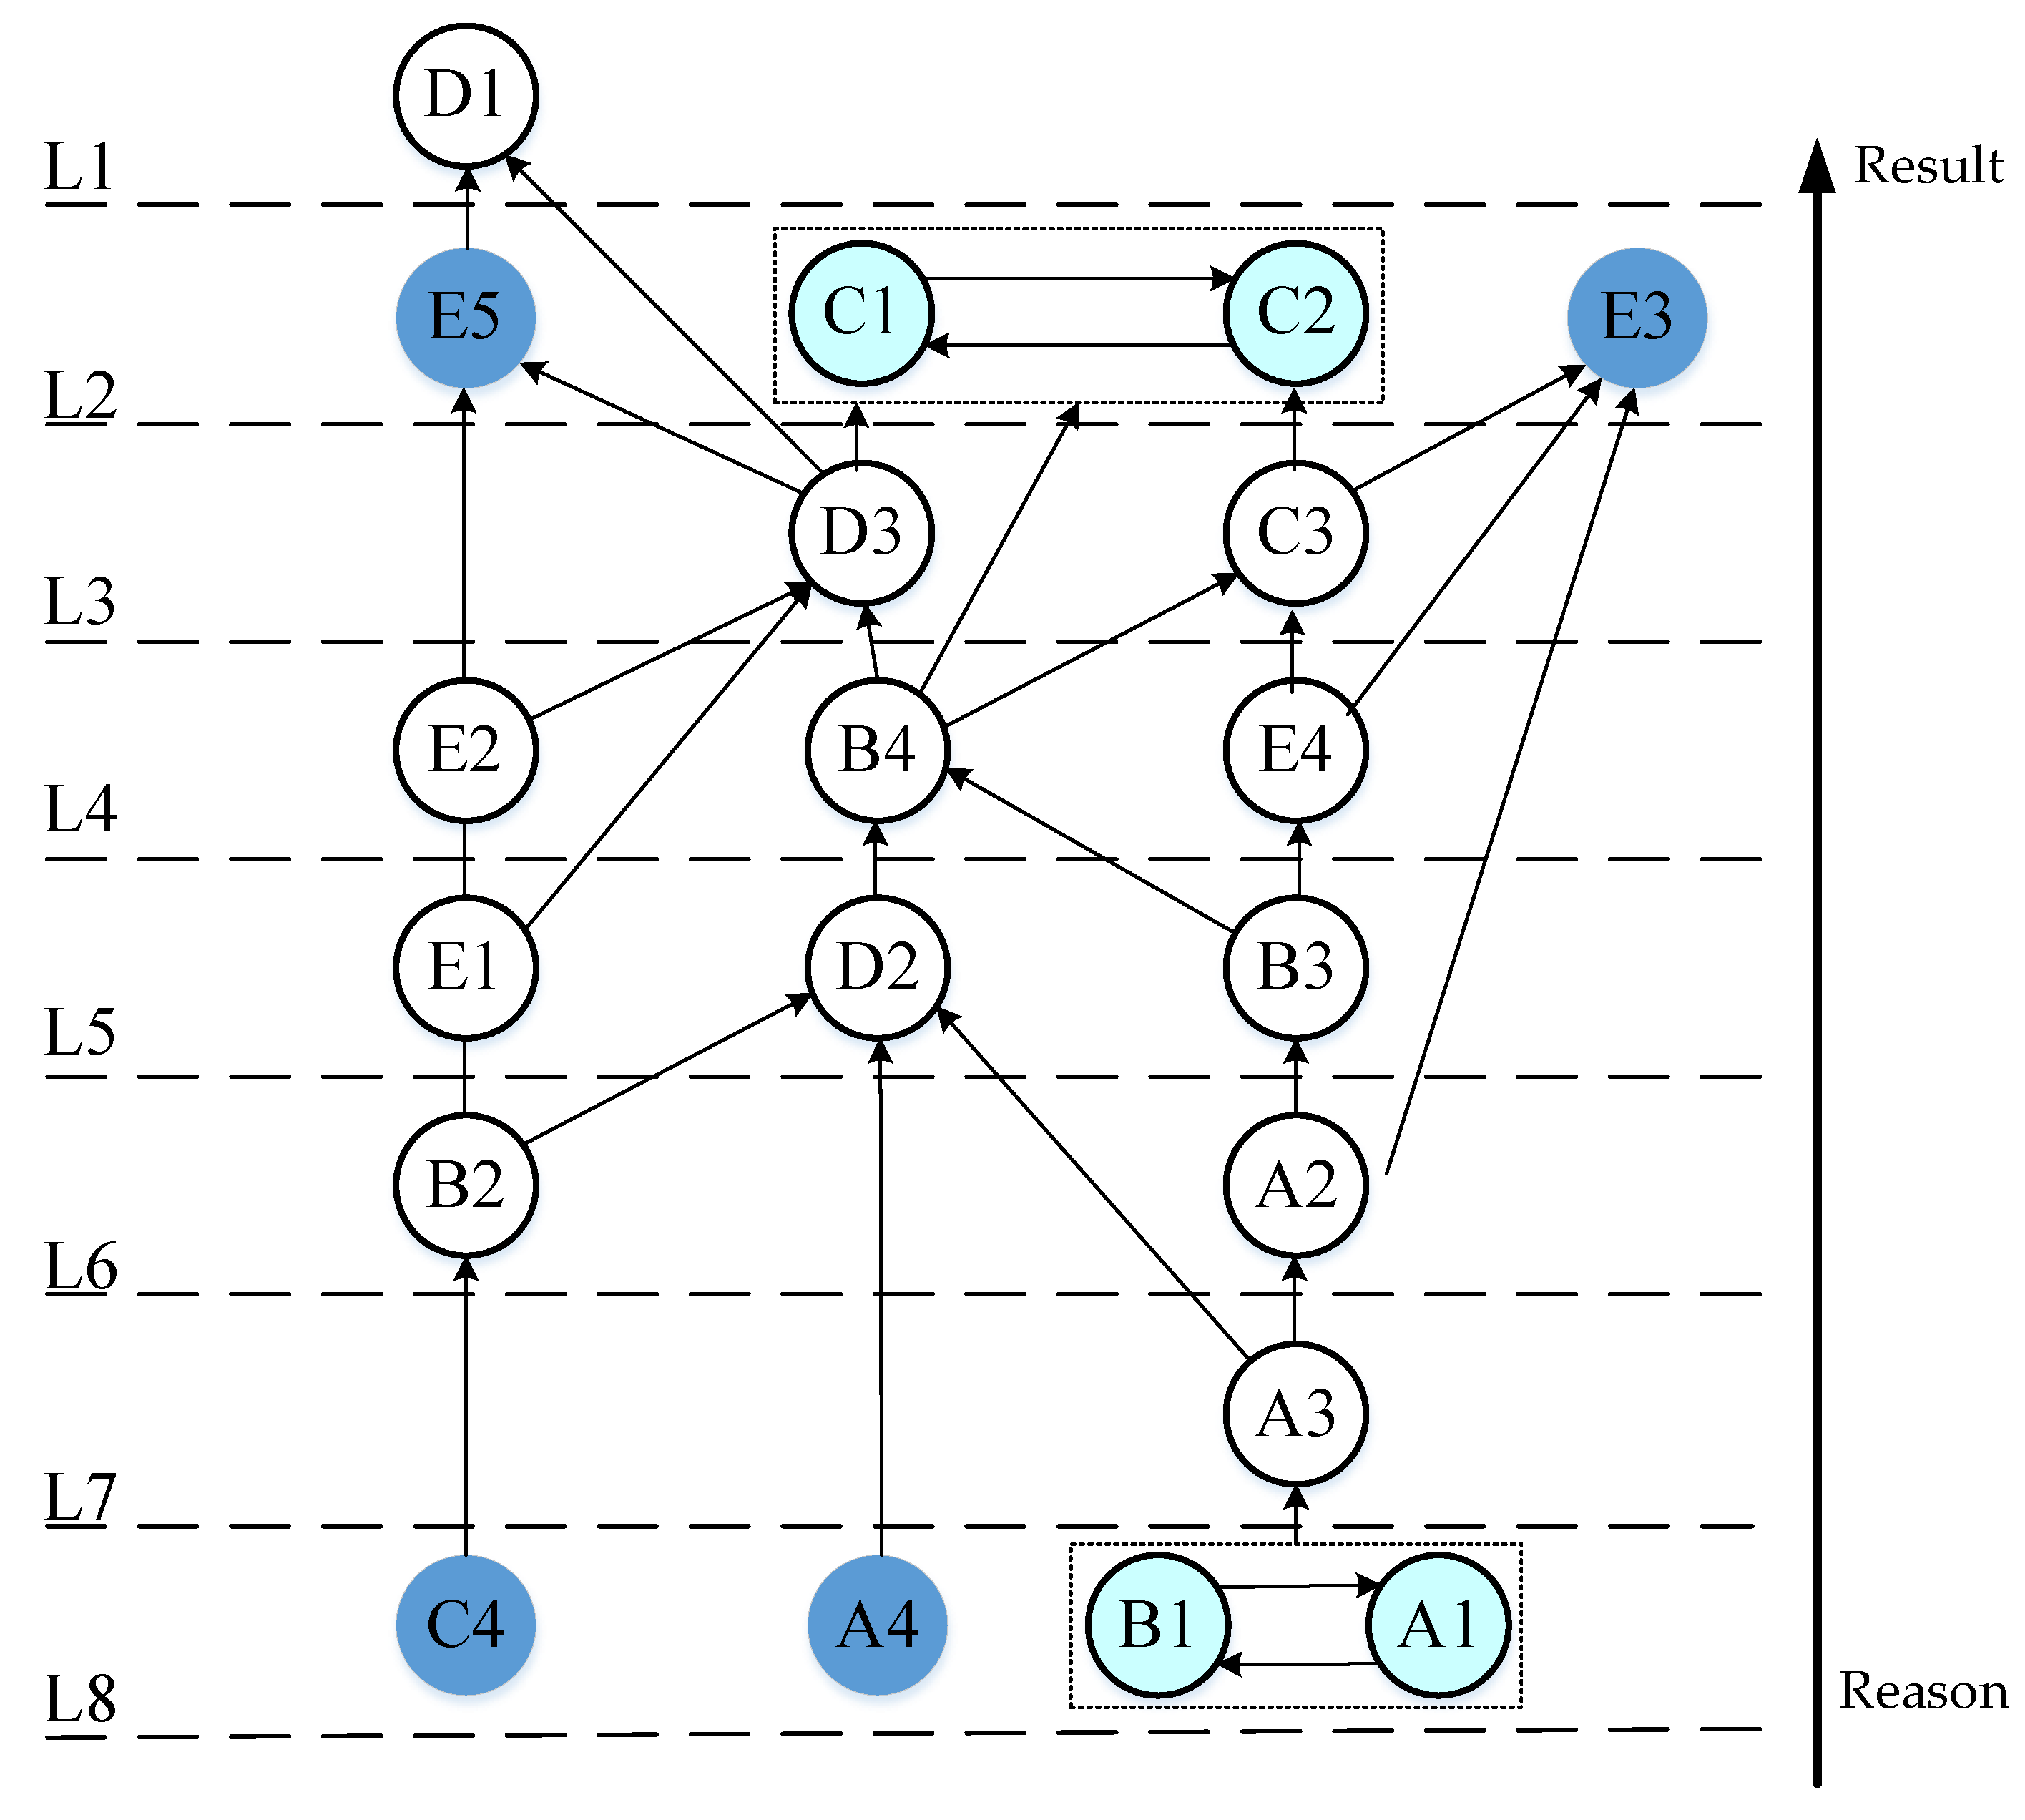
According to the relationship between the elements and the results of confrontation level extraction, a directed topological hierarchy diagram can be drawn. The reachable relationships between the influencing factors are represented by directed line segments, and the bidirectional arrows in the diagram indicate the formation of loops, i.e., mutually reachable relationships, with the lower level indicating that the influencing factors have roots and the upper-level factors indicating the results, as
Figure 5 and
Figure 6 show.
Based on the indicator relationships affecting the CTOS construction performance index system, the UP-type and DOWN-type hierarchical topology diagrams of eight levels can be obtained, and the two series are not consistent, indicating that the system is a topologically variable and active system, where (B1,A1) and (C1,C2) are two pairs of loop elements.
(1) Surface direct causes. That is, the apparent causes that show the construction performance of CTOS, whose good or bad effects directly on the evaluation results of construction performance, are governed by other indicators. This paper finds that D1 (container operating system)’s billion-ton throughput mortality rate appears as a safety indicator, which proves that this indicator is caused by the variation of some factors at the lower level, so the weight of such indicators in the final determination will be reduced appropriately.
(2) Middle-tier indirect causes. This layer of risk factors is both influenced by the underlying factors and the direct cause of the surface risk, including the relevant indicators of L2–L7, where the C1 (pier coverage) and C2 (man–machine control) ratio indicators that become loops indicate a strong link between the two sides, i.e., the lower the ratio of man–machine control, the wider the coverage of the system in the automated terminal, and vice versa. By continuing the inference, we can know that the terminal is now in the development stage, the new CTOS has just been built, and the number of personnel to adapt to the system still needs to be improved.
(3) Deeper root cause. It can be clearly seen that A1 (container 10 m shoreline utilization) and B1 (average time for vehicles to pass the gate) are the two indicators that are the key to evaluating the construction of CTOS, because this system is mainly responsible for two types of work, i.e., loading and unloading operations and chokepoint operations.
4.2. Determination of CTOS Evaluation Index Weights Based on the ANP
4.2.1. Constructing the CTOS Evaluation Index ANP Model
The relationship of indicators derived from AISM is used as the basis of evaluation, and the topological hierarchy diagram is explained so that experts have global thinking about the important relationship between elements when compared to each other and experts can give more accurate decisions more quickly in their familiar fields. The Delphi method is adopted, combined with a field survey and a Port B empirical analysis and then the evaluation criteria and network nodes are determined, i.e., the interrelationship between indicators, and the ANP network structure model of CTOS construction performance evaluation is created, as shown in
Figure 7.
4.2.2. Determination of the Index Weights
The 1–9 scale method is used to input the relationship matrix corresponding to each level 1 evaluation index and level 2 evaluation index. After passing the consistency test, the unweighted supermatrix, weighted supermatrix, and limit supermatrix are calculated, and when the limits converge and are unique, the weights of each CTOS evaluation primary, secondary, and tertiary indicator are obtained, as shown in
Table 3.
4.3. Construction of a Quantitative Model of the Comprehensive Evaluation Results
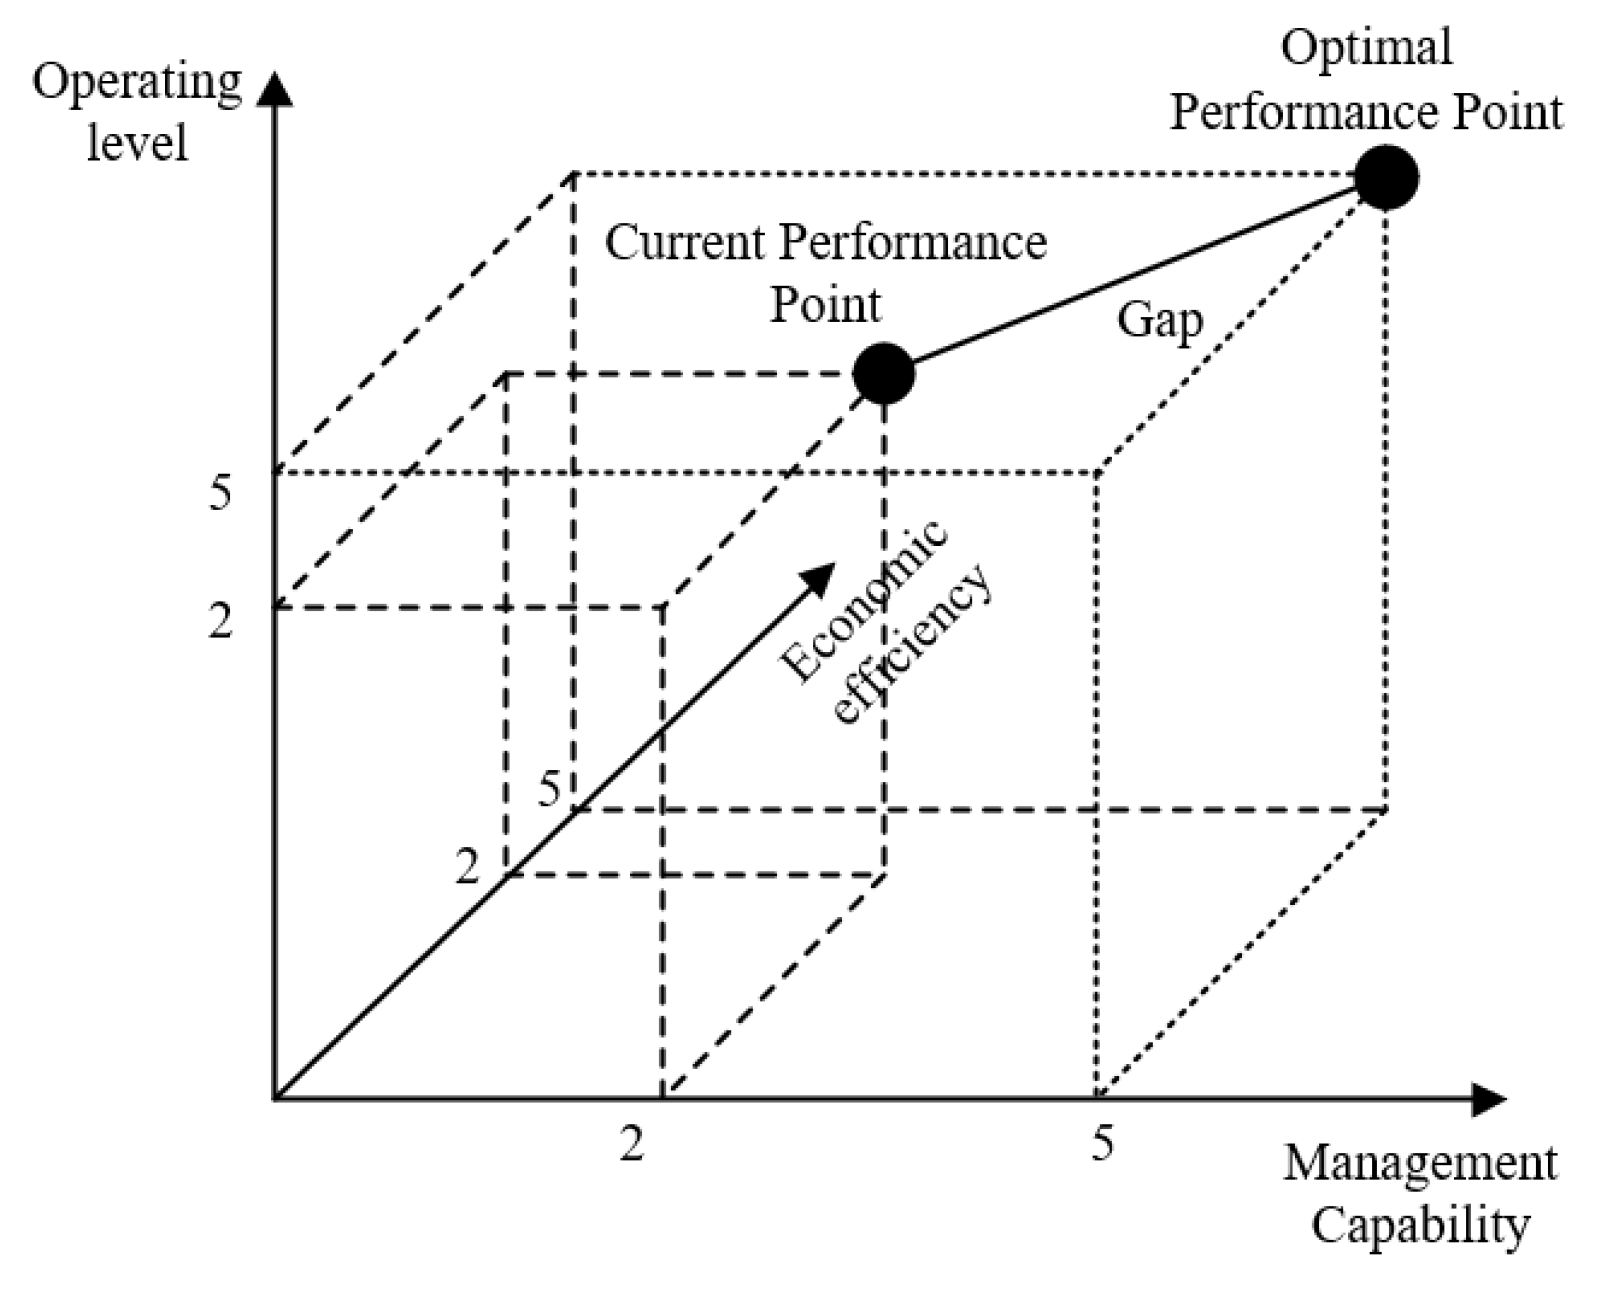
After obtaining the index system and index weights, to conduct a specific quantitative evaluation of the progress of the enterprise information system and enhance the scientific validity of the evaluation, the solution is designed for the terminal operation system to make the evaluated unit clear about its current state and to determine the gap with the optimal state to clarify its own development direction and space and perform the test of quantitative evaluation validity.
First, we use the GCM to construct an index evaluation space based on the indicators and use the points in the space to indicate the optimal performance points and the current performance points of the system (i.e., to evaluate the similarity between the current performance state and the optimal state).
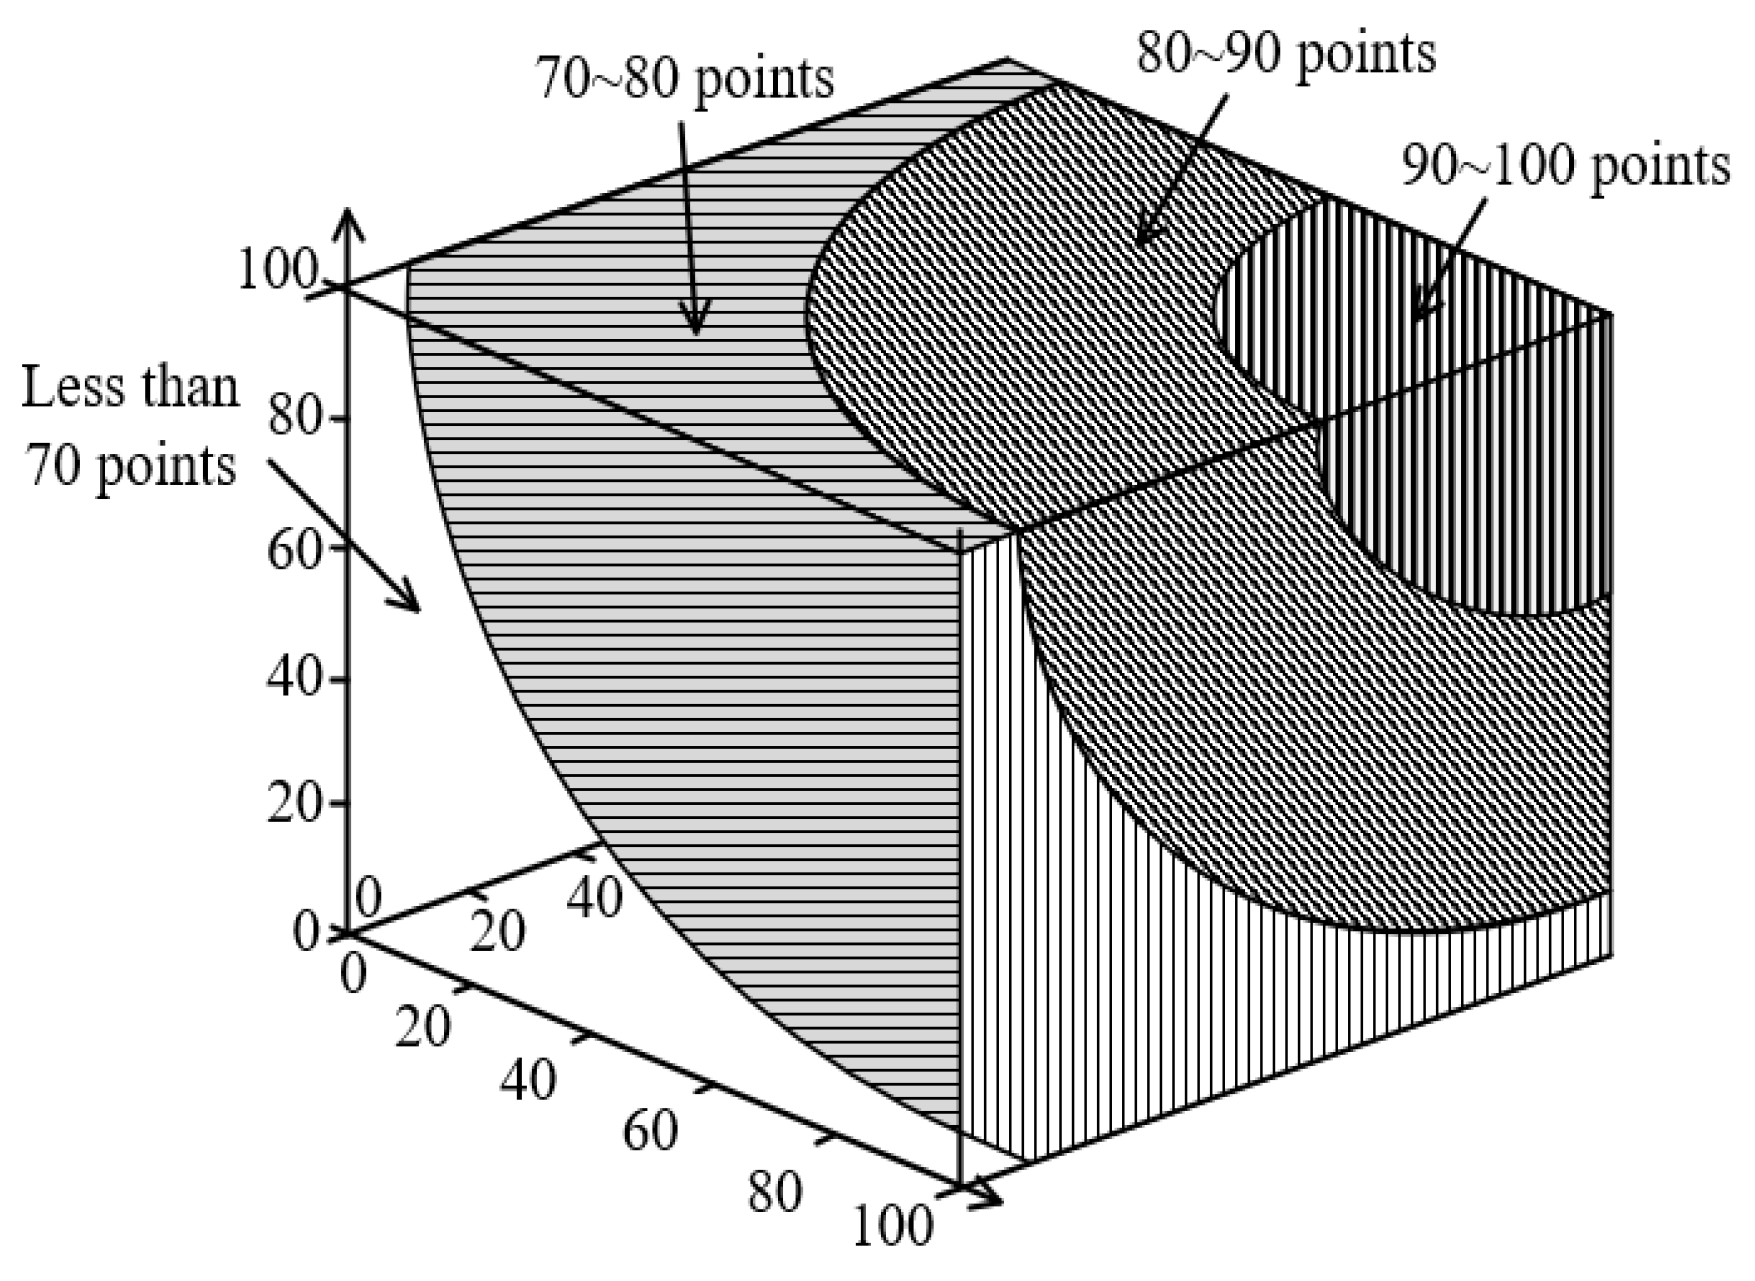
In the three-dimensional space, all performance points with the same score form a sphere, with the best point as the center and the score as the radius, as shown in
Figure 8 and
Figure 9. The comprehensive performance scores of the points outside the sphere are lower than the points on the sphere, while the comprehensive performance scores of the points inside the sphere are higher than the performance points on the sphere. In this model, to obtain a high overall performance score, the evaluated system must perform well in all dimensions; otherwise, a low score in one dimension can only be on the outer sphere, even if the other dimensions are full scores. Therefore, this algorithm not only reflects the contribution of each indicator to overall performance, but also fully considers their balance and coordination, which can meet the requirements of this system.
Benchmark port data are selected, and the quantitative score is obtained by comparing the data derived from the evaluation with the corresponding data of the benchmark port to obtain the specific gap value between the evaluated port and the benchmark port, and then comparing it with the gap value of the previous year. Here, the Euclidean distance is used to determine the similarity between the current construction performance and the performance of the benchmark port. Let the index scores of each dimension of the system be
M (management capability),
O (operational level), and
E (economic efficiency); then, the coordinates of its corresponding performance point are (
M,
O,
E). The Euclidean distance
D between this point and the optimal point (100, 100, 100) is as follows:
Since
D is a negative indicator of system performance, the comprehensive evaluation formula is obtained after transformation as follows:
4.4. Quantitative Analysis of Comprehensive Evaluation Results
The set of benchmark data was used as the best point of the 3D model, and the benchmark data were also used to score each index when scoring. The analysis is carried out based on the GCM to construct the dataset, and the gray class affiliation of each index is derived by combining the weights of the construction performance evaluation indexes obtained by using the ANP network and judgment matrix in the previous section of this paper, as shown in the table. Based on the principle of maximum affiliation, the gray class rank of the Port B Qinzhou Collection Division is calculated.
Combining the above results, the evaluation results of the CTOS construction performance indicators of Port B under the principle of maximum affiliation in 2021 can be obtained, and the overall evaluation result is good, with an overall excellent rate of 61% for all kinds of indicators, as shown in
Table 4.
At present, the average table hourly efficiency of the shore bridge, the proportion of vehicles passing through the gate with electronic documents, the simplicity of operation, the level of pollutant emissions, and several other indicators have not yet reached a good level. The main reasons are that the current development of the smart port is still relatively short; for the container operation part of the shore bridge, field bridge, and old and new equipment, there is a common situation. In the new construction of the CTOS, regarding the technical level of personnel challenges, the security of talent is also an issue that the current enterprise urgently needs to focus on.
At the same time, C3 (business realization degree) and F1 (system construction cost) receive only the passing grade. Internal research and analysis show that although the CTOS has been put into use, the current container terminal operation plan of Port B mainly relies on manual development and relies heavily on working experience. At the same time, there is no terminal business management system (TMS) in Port B. There is no independent information platform connected with electronic data interchange (EDI) and third parties, a result of which is that the accuracy and real-time nature of CTOS data need to be further improved. Additionally, the berth plan and yard plan in the CTOS are not perfect.
Combined with the weighted indicators, the sphere quantification model is used to set up the questionnaire. Through the calculation of expert scores from the port in 2021, the composite score of indicators in the three directions (40.023, 54.265, and 51.137) is compared to the benchmark port, and the composite score is located in the range of 60 points or less in the sphere. The composite scores in 2021 (74.7326, 66.3542, and 73.8963) are improved to the 70-point range, and the calculation can conclude that the composite scores in 2020 and 2021 are 45.495 and 71.364, respectively, which is an overall improvement of 12.7% compared to the benchmark port. It is obvious in the sphere model that the lack of management level among them prevents the port from reaching a higher tier in the overall rating, which is also the focus of the current port’s future development.
The results show that D1 (pollutant emission level), D2 (energy consumption level), and F (economic efficiency) receive only the passing grade. This indicates that the future development of the CTOS of the Port B Qinzhou Collection Division currently focuses on two aspects, i.e., green safety and economic efficiency. However, since these two aspects are not entirely determined by the construction performance of the CTOS, the weights are relatively low. Substituting the calculated results into
Figure 3,
Figure 4,
Figure 5,
Figure 6 and
Figure 7, it can be seen that although the scores of green safety and economic efficiency are not high, the total score of the port crosses out of the region below 60 points in the spatial sphere, reaching the 70–80-point region. Therefore, the construction performance improvement of the CTOS in 2021 is significant.
5. Conclusions and Future Directions
This paper introduces a new idea of constructing a CTOS construction performance evaluation system for ports based on three dimensions: the management level, business capability, and economic efficiency. It also uses a combined AISM-ANP method to better derive index weights and input a quantitative evaluation model constructed based on the GCM to obtain a scheme of CTOS construction performance. A visualized quantitative analysis method for the CTOS is proposed in the application of models and algorithms. By confronting the AIM model, the complex and confusing direct and indirect influence relationships among the factors of management capability, the business level, and economic efficiency can be identified, and the recursive structure hierarchy topology diagram of the factors affecting the CTOS is drawn from the AISM results, which makes the factor identification and analysis intuitive and clear. The optimization of traditional network layer analysis deals with the inconsistent and missing database of the expert judgment matrix in the ANP method and compensates for the subjective difficulty of experts in determining the relationship of importance (dominance) among the factors.
In terms of the results, applying the indicator relationships and indicator weights derived from the AISM-ANP, the GCM is used to evaluate the CTOS of the Port B Qinzhou Collection Division, construct a quantitative evaluation model, and input the results. It is concluded that Port B CTOS construction has achieved significant results in terms of the operational level and effectively improved the overall level of the port. Finally, through weight calculation and quantitative model calculation as well as with the comments of terminal staff members and terminal managers, the unsatisfactory indicators of Port B were compared with the reality and analyzed. It was found that the unsatisfactory indicators found by the program were very close to the areas covered by the projects that had not been fully constructed in actual development, proving the validity of the results. Through the analysis of the results, the next focus of CTOS development in Port B is on two aspects, i.e., green security and the economic efficiency of the system, and the results obtained from the CTOS evaluation scheme can be extended to the evaluation of other kinds of information systems in the future with such a three-dimensional quantitative evaluation scheme to finally realize the quantitative evaluation of the construction performance of the whole smart port.
In comparison with some articles on the evaluation of smart ports, we build the index system by selecting indicators from three dimensions and combining the official annual reports and questionnaires of each port, and there are many subjective indicators that are very suitable for the subject of the evaluation to build the index system. In the future, we can extend this method so that the project managers know more clearly which indicators will have a more important impact on the information system built, or compare the results of each year’s evaluation with the benchmark ports to make a current fit and obtain the future development trend of the project.
For future research, the challenge is to distinguish the overlapping points between port information systems that affect each other. In the process of fieldwork and literature research, it is found that many systems in ports are not built independently, and many systems cannot be built individually to obtain practical benefits. A more in-depth investigation is needed. If the whole functional platform or module can be analyzed on such a basis, then the construction of a smart port will more clearly bring an improvement in service, efficiency, and greenery to the port.


