Article

Variation of Internal Tides on the Continental Slope of the Southeastern East China Sea

1
CAS Key Laboratory of Ocean Circulation and Waves, Institute of Oceanology, Chinese Academy of Sciences, Qingdao 266071, China
2
Center for Ocean Mega-Science, Chinese Academy of Sciences, Qingdao 266071, China
3
Laboratory for Ocean and Climate Dynamics, Qingdao National Laboratory for Marine Science and Technology, Qingdao 266237, China
4
College of Marine Sciences, University of Chinese Academy of Sciences, Qingdao 266404, China
*
Author to whom correspondence should be addressed.
J. Mar. Sci. Eng. 2022, 10(1), 104; https://doi.org/10.3390/jmse10010104
Submission received: 8 December 2021 / Revised: 11 January 2022 / Accepted: 11 January 2022 / Published: 14 January 2022
(This article belongs to the Section Physical Oceanography)

Abstract

:
The semidiurnal internal tides (ITs) on the continental slope of the southeastern East China Sea (ECS) exhibited abrupt enhancement in November of 2017. This enhancement resulted from the intensification of the coherent semidiurnal ITs. Coherent and incoherent semidiurnal ITs had a comparative energy contribution in October; however, coherent semidiurnal ITs dominated with a variance contribution of 90% in November. The variance contribution of vertical modes of the semidiurnal ITs varied between October and November, and the mode with most variance contribution changed from the second mode to the first mode. Altimeter data and the observed background currents indicated that the Kuroshio mainstream meandered and abruptly intruded into the ECS in November. The upper layer background currents were significantly related to the kinetic energy of the semidiurnal ITs, and the correlation coefficient between them reached 0.81. The frequent occurrences of the Kuroshio intrusion have suggested that the ITs in the ECS are susceptible to the modulation of the Kuroshio current. Numerical modeling and predication of ITs should consider the meander of the Kuroshio mainstream.

1. Introduction

Internal tides (ITs) are ubiquitous in the world’s oceans [1,2,3,4], and they are generated by barotropic tidal currents flowing over abrupt ocean topography [5,6,7,8]. High-mode ITs usually break and dissipate near their source regions, which generates local mixing [9]; however, low-mode ITs can propagate for thousands of kilometers [10,11,12,13]. Coherent ITs are phase-locked with the barotropic tides in the generation site, and variations in the coherent ITs generally are induced by the spring-neap cycles of the barotropic tides. During their long-range propagation, ITs exhibit strong intermittency and unstable phase and part of the internal tidal energy is transferred to frequencies outside the deterministic tidal frequencies due to the modulation of background conditions. Consequently, ITs lose coherence to astronomical forcing and become incoherent [14,15,16]. ITs generate significant vertical displacement and vertical shear and can induce interior ocean turbulent mixing, which plays an important role in maintaining the meridional circulation and affects the global climate [17,18].
The East China Sea (ECS) have a wide continental shelf and a deep trough (the Okinawa Trough) connected by a steep continental slope. The generation of ITs in the ECS has been reported based on observations [19,20,21,22,23,24] and numerical models [25,26,27]. Lien et al. found that on the continental slope to the northeast of Taiwan Island, the semidiurnal internal tidal energy flux exhibits strong temporal and spatial variations, and it has a seaward direction [23]. The Mien-Hua Canyon, the I-Lan Ridge, and the continental shelf are the main IT generation sites in the ECS to the northeast of Taiwan [27]. The Kuroshio current is a strong west boundary current that flows across the ECS, and the Mien-Hua Canyon is one of the key passages by which the Kuroshio intrudes into the ECS [28,29]. The modulation of the ITs by the Kuroshio current to the northeast of Taiwan remains unclear because of the lack of suitable long-range in situ observations. In this study, the characteristics of the ITs subjected to Kuroshio mainstream meandering to the northeast of Taiwan Island were investigated based on in situ observations.

2. Data and Methods

A moored Acoustic Doppler Current Profiler (ADCP) was initially deployed on 23 May 2017, and the mooring was recovered, the battery was charged, and it was redeployed on 19 September 2017. The mooring was located at 122°35.6′ E, 25°30.5′ N, with a local water depth of about 600 m, and the local isobath aligns with the northeast-southwest direction (Figure 1). The ADCP was oriented upward and had temporal and vertical spatial resolutions of 1 h and 8 m, respectively. The ADCP detected the horizontal water velocity from 40 m to 480 m below the sea surface. The horizontal velocity collection lasted for nearly 1 year, that is, from 23 May 2017 to 18 May 2018.
We used all satellite-merged Absolute Dynamic Topography (ADT) and geostrophic current data from the Archiving, Validation, and Interpretation of Satellite Oceanographic (AVISO) to examine the meander of the Kuroshio mainstream. The monthly mean ADT and the geostrophic current data have a spatial resolution of 1/4°. The daily HYCOM + NCODA Global 1/12° analysis dataset is an operational, data-assimilative product, and consequently, it was used as a substitute for the hydrography that was not measured during the observation period.
The in situ observed horizontal currents were linearly interpolated into fixed layers, which ranged from 40 m to 480 m, with a vertical interval of 8 m. The barotropic currents were estimated as the depth-mean of the interpolated currents, and the baroclinic currents were derived by subtracting the barotropic currents from the interpolated currents. The current ellipses of the barotropic current were calculated using the least-squares fitting method of harmonic analysis [30]. Empirical Orthogonal Function (EOF) decomposition was used to extract the vertical modes of the ITs.
The rotary spectra of the baroclinic currents were estimated using Welch’s method [31], with a window of 42 days and a degree of freedom of 30. A fifth-order Butterworth band-pass filter was applied to the baroclinic currents to extract the diurnal ITs with a passband of 0.80–1.20 cycles per day (cpd) and the semidiurnal ITs with a pass-band of 1.73–2.13 cpd [11]. To eliminate the phase distortion, the filters were applied twice, that is, in the forward and backward directions. Tidal harmonic analysis was also conducted on the diurnal and semidiurnal internal tidal currents during each month to extract the coherent diurnal and semidiurnal ITs. The incoherent ITs were obtained by subtracting the coherent ITs from the band-pass filtered diurnal and semidiurnal ITs. The internal tidal currents were Wentzel-Kramers-Brillouin (WKB) scaled, and then, the rotary vertical wave-number spectra were estimated to examine the vertical energy propagation direction of the ITs [32]. The kinetic energy (KE) density of the ITs was calculated as follows:
KE = 1 2 ρ 0 ( u 2 + v 2 ) ,
where ρ0 = 1024 kg⁄m3 is the reference water density, and u and v are the zonal and meridional currents of the diurnal and semidiurnal ITs.

3. Results

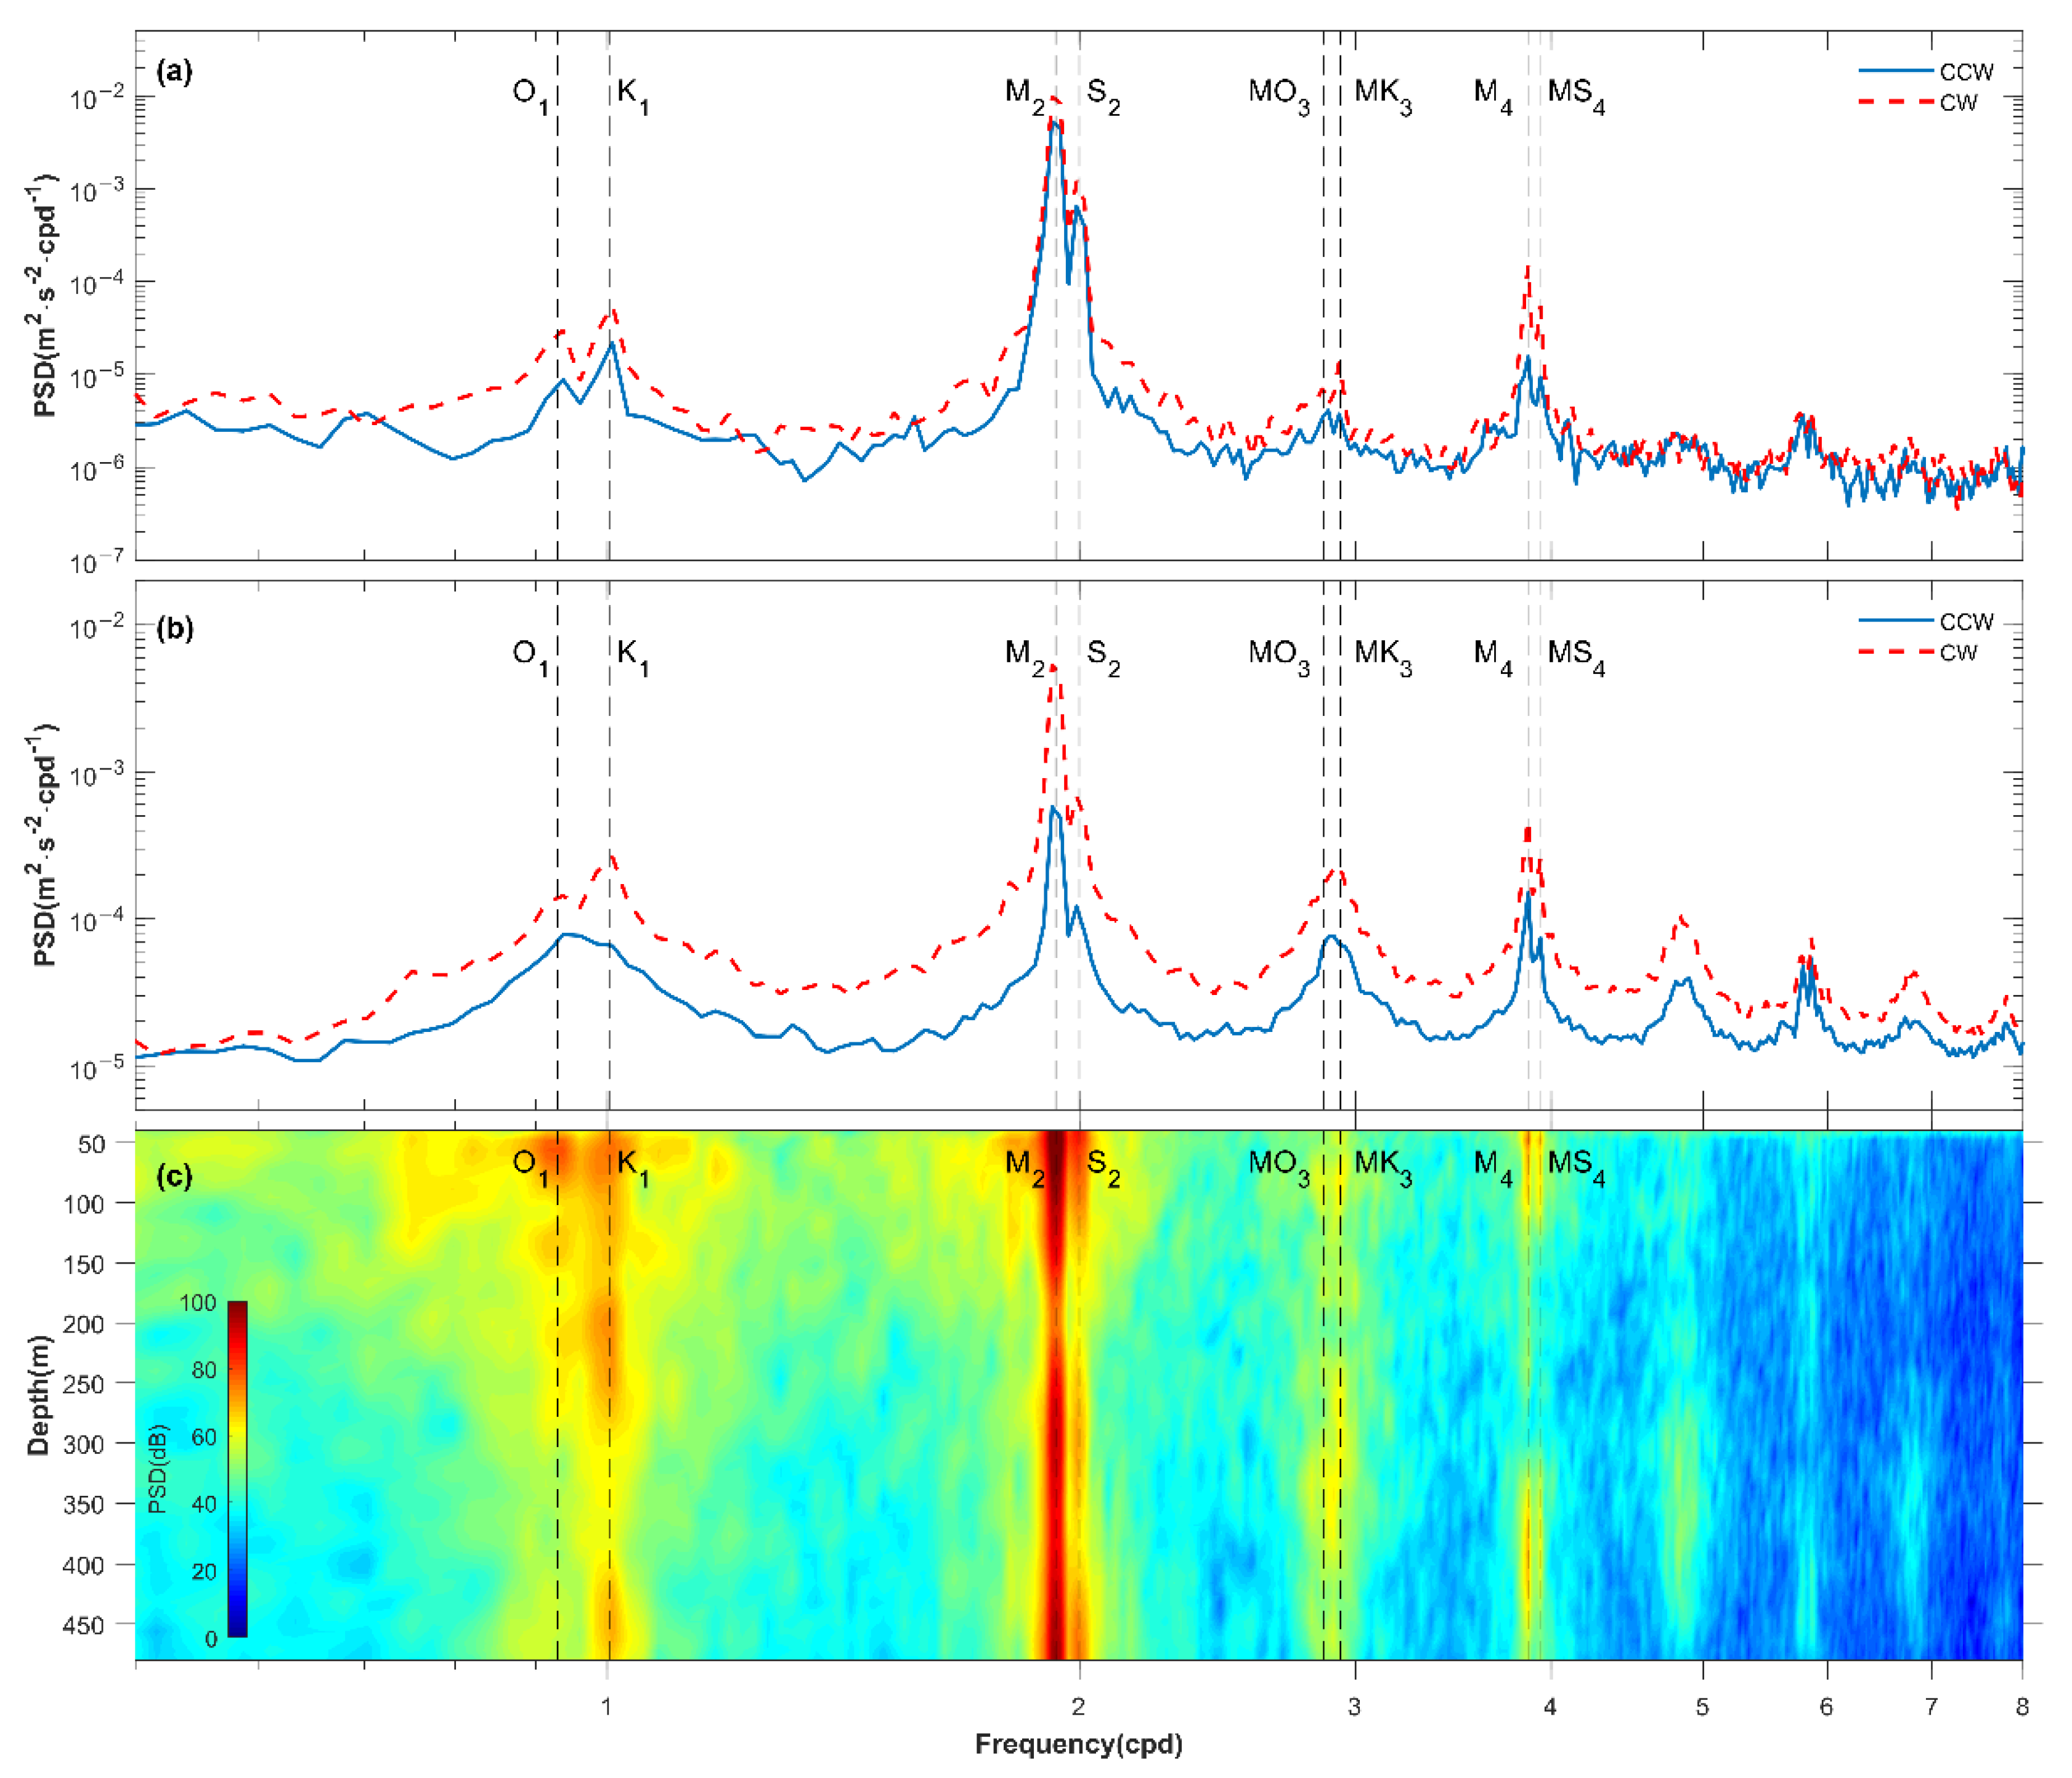
Figure 2 shows the variance-conserving rotary spectra of the barotropic and baroclinic currents. The barotropic and baroclinic semidiurnal signals dominated the local current field. The local barotropic tides were dominated by the semidiurnal constituents. The current ellipse of barotropic M2 constituent had major and minor axes of 23.2 cm/s and −3.6 cm/s with a negative minor axis, indicating clockwise rotation. The barotropic S2 constituent had major and minor axes of 7.7 cm/s and −1.2 cm/s. The barotropic diurnal constituents O1 and K1 were much weaker than the semidiurnal ones. The current ellipses of the four barotropic constituents were roughly aligned with the cross-isobath direction and are rotated clockwise.
The semidiurnal ITs dominated the local internal wave field, and the clockwise component of the semidiurnal ITs overwhelmed the counterclockwise component. The M2 internal tide had a power spectral density that was 10 times larger than that of the K1 and S2 internal tides. The M2 internal tides dominated the power spectra from the ocean surface to the bottom, with a low power range of ~200 m (Figure 2c). Since the M2 internal tides were dominate, there were spectral peaks at the MK3 (M2 + K1), M4 (M2 + M2), and MS4 (M2 + S2) frequencies.
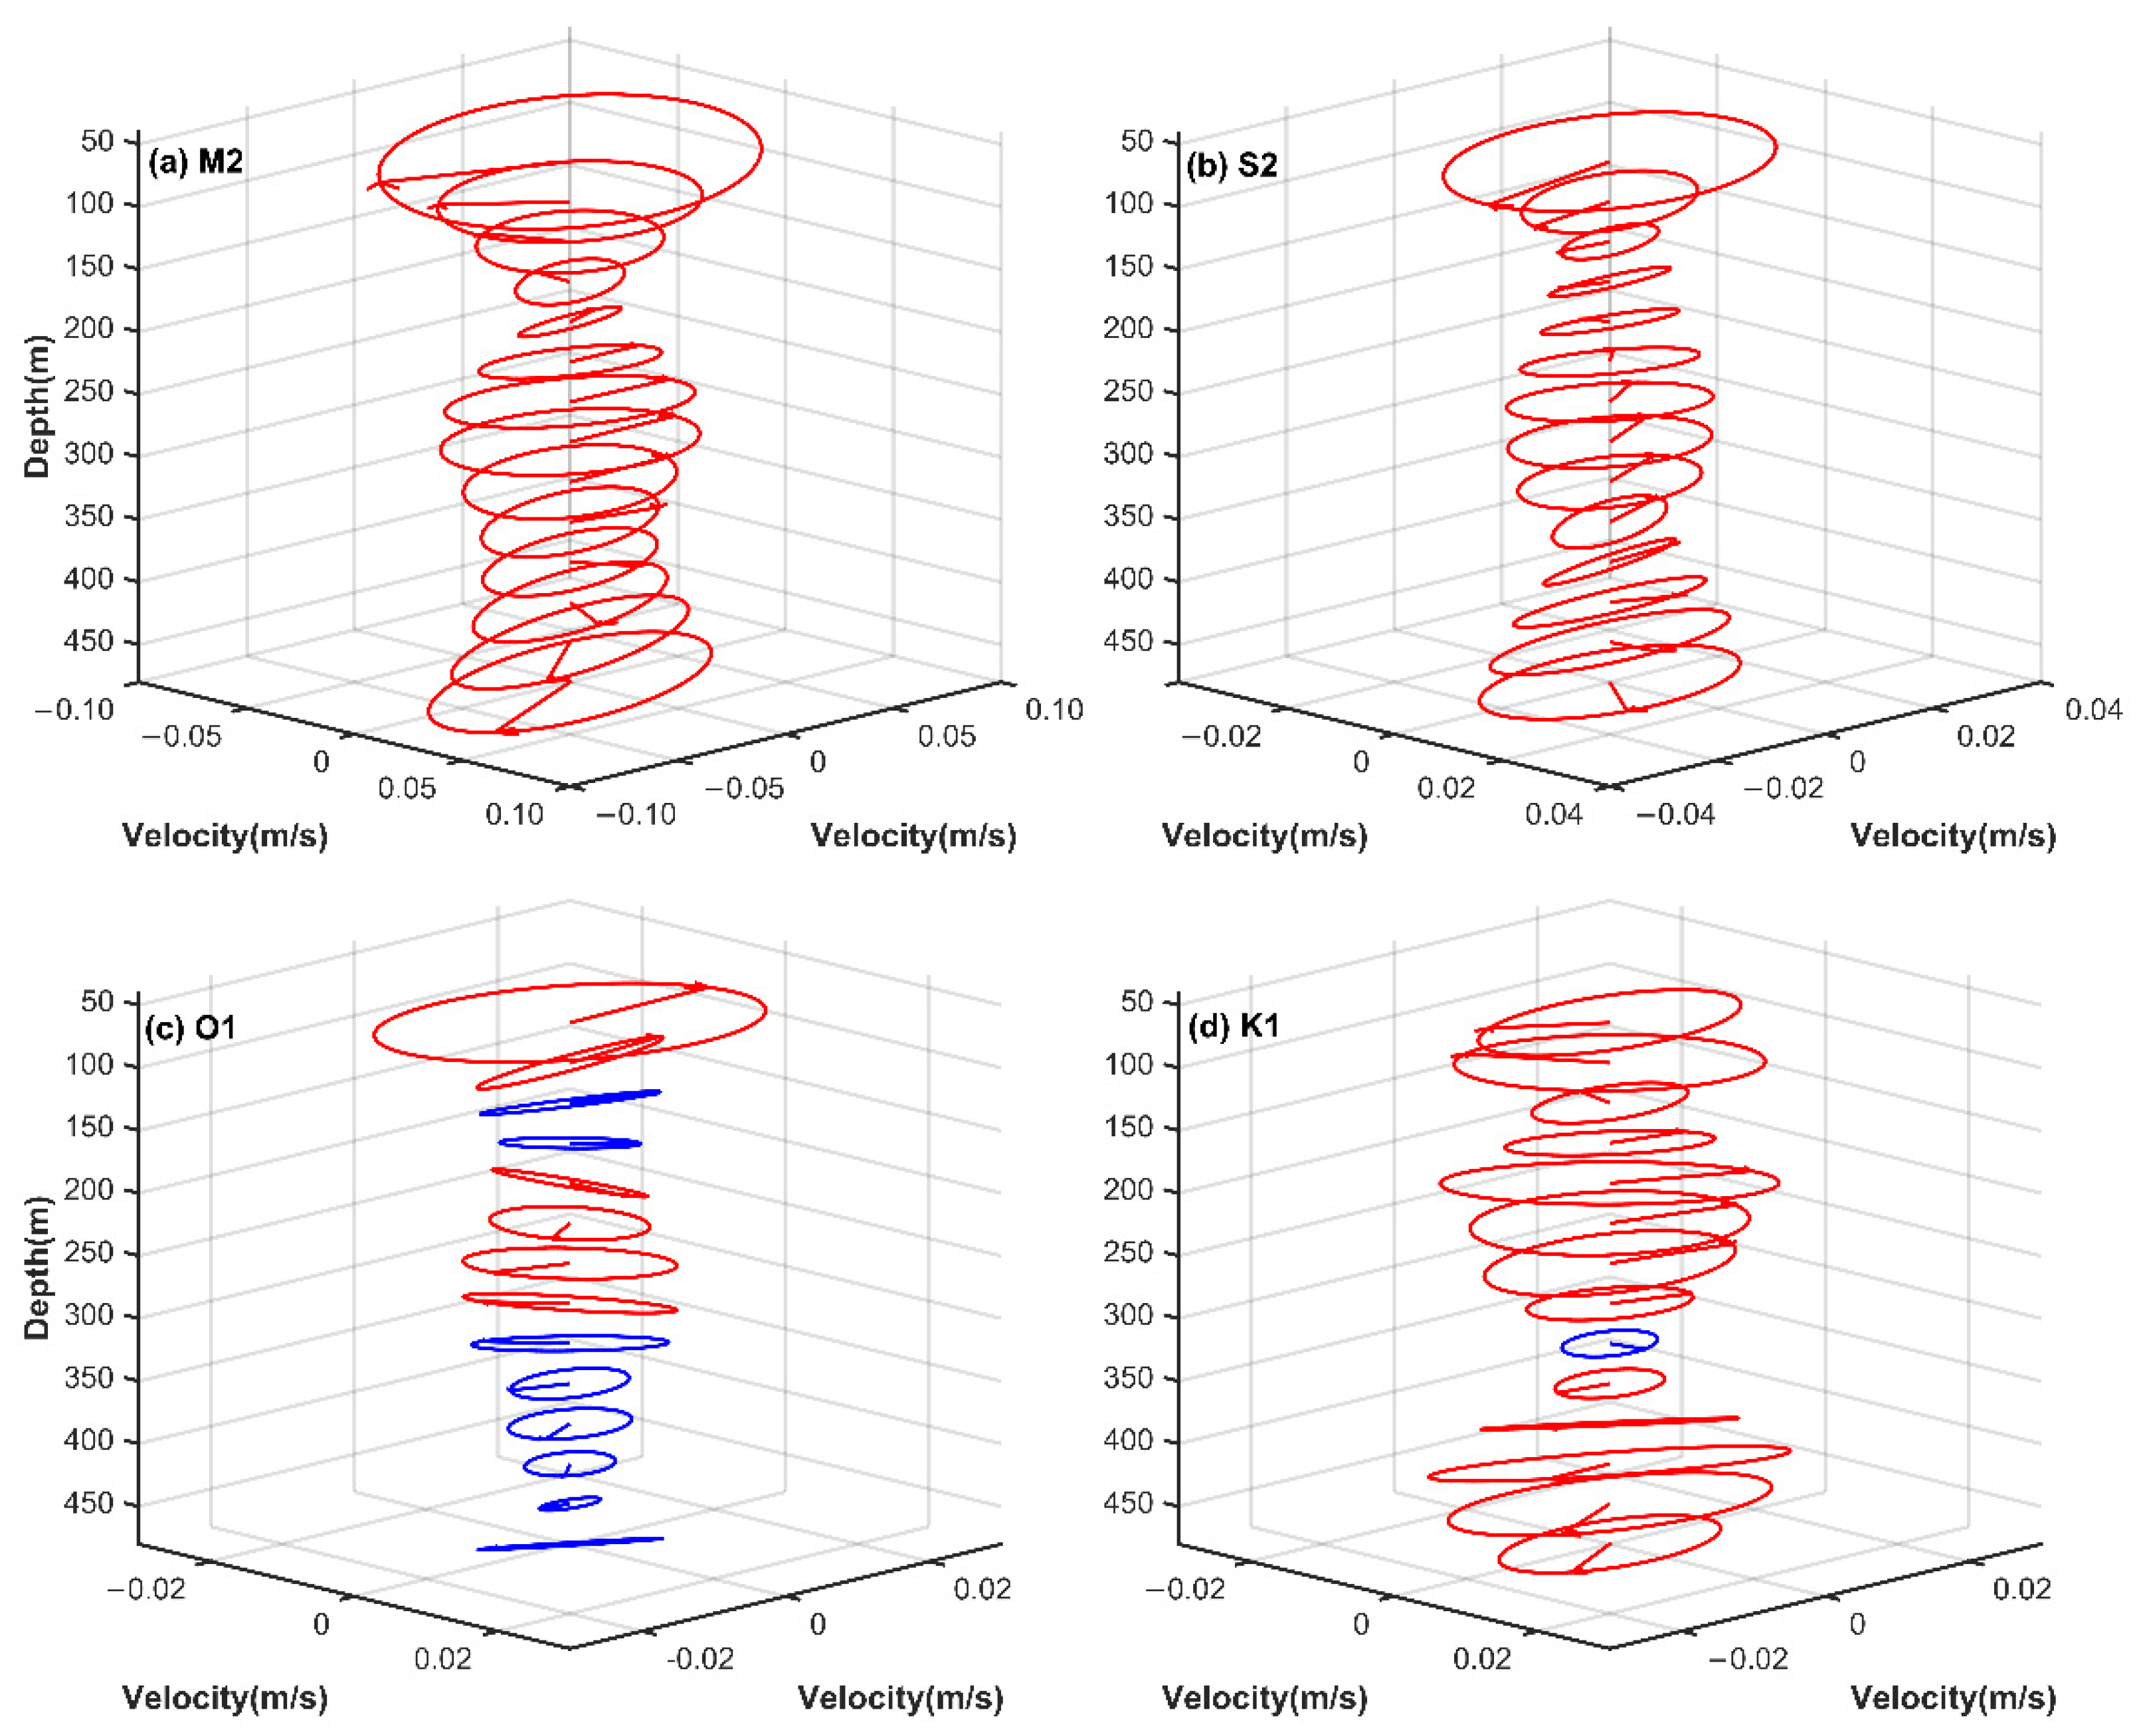
Figure 3 presents the tidal-current ellipses of the major baroclinic tidal constituents obtained from the harmonic analysis over the entire observation period. The harmonic analysis results represented the coherent baroclinic tides that were phase-locked to the astronomical tides. The red ellipses denoted clockwise rotation, and the blue ellipses denoted counterclockwise rotation. The M2 ITs were polarized and rotated clockwise, and they dominated the baroclinic currents within the entire water column. The M2 ITs had one node at a depth of about 200 m. The S2 ITs also were polarized and rotated clockwise within the entire water column, and they had two nodes at depths of 200 m and 420 m. The O1 and K1 ITs exhibited rectilinear features, and their rotation directions varied with depth. The rotation direction of the O1 ITs varied repeatedly with depth, whereas that of the K1 ITs was mostly clockwise with a counterclockwise rotation from 350 m to 400 m.
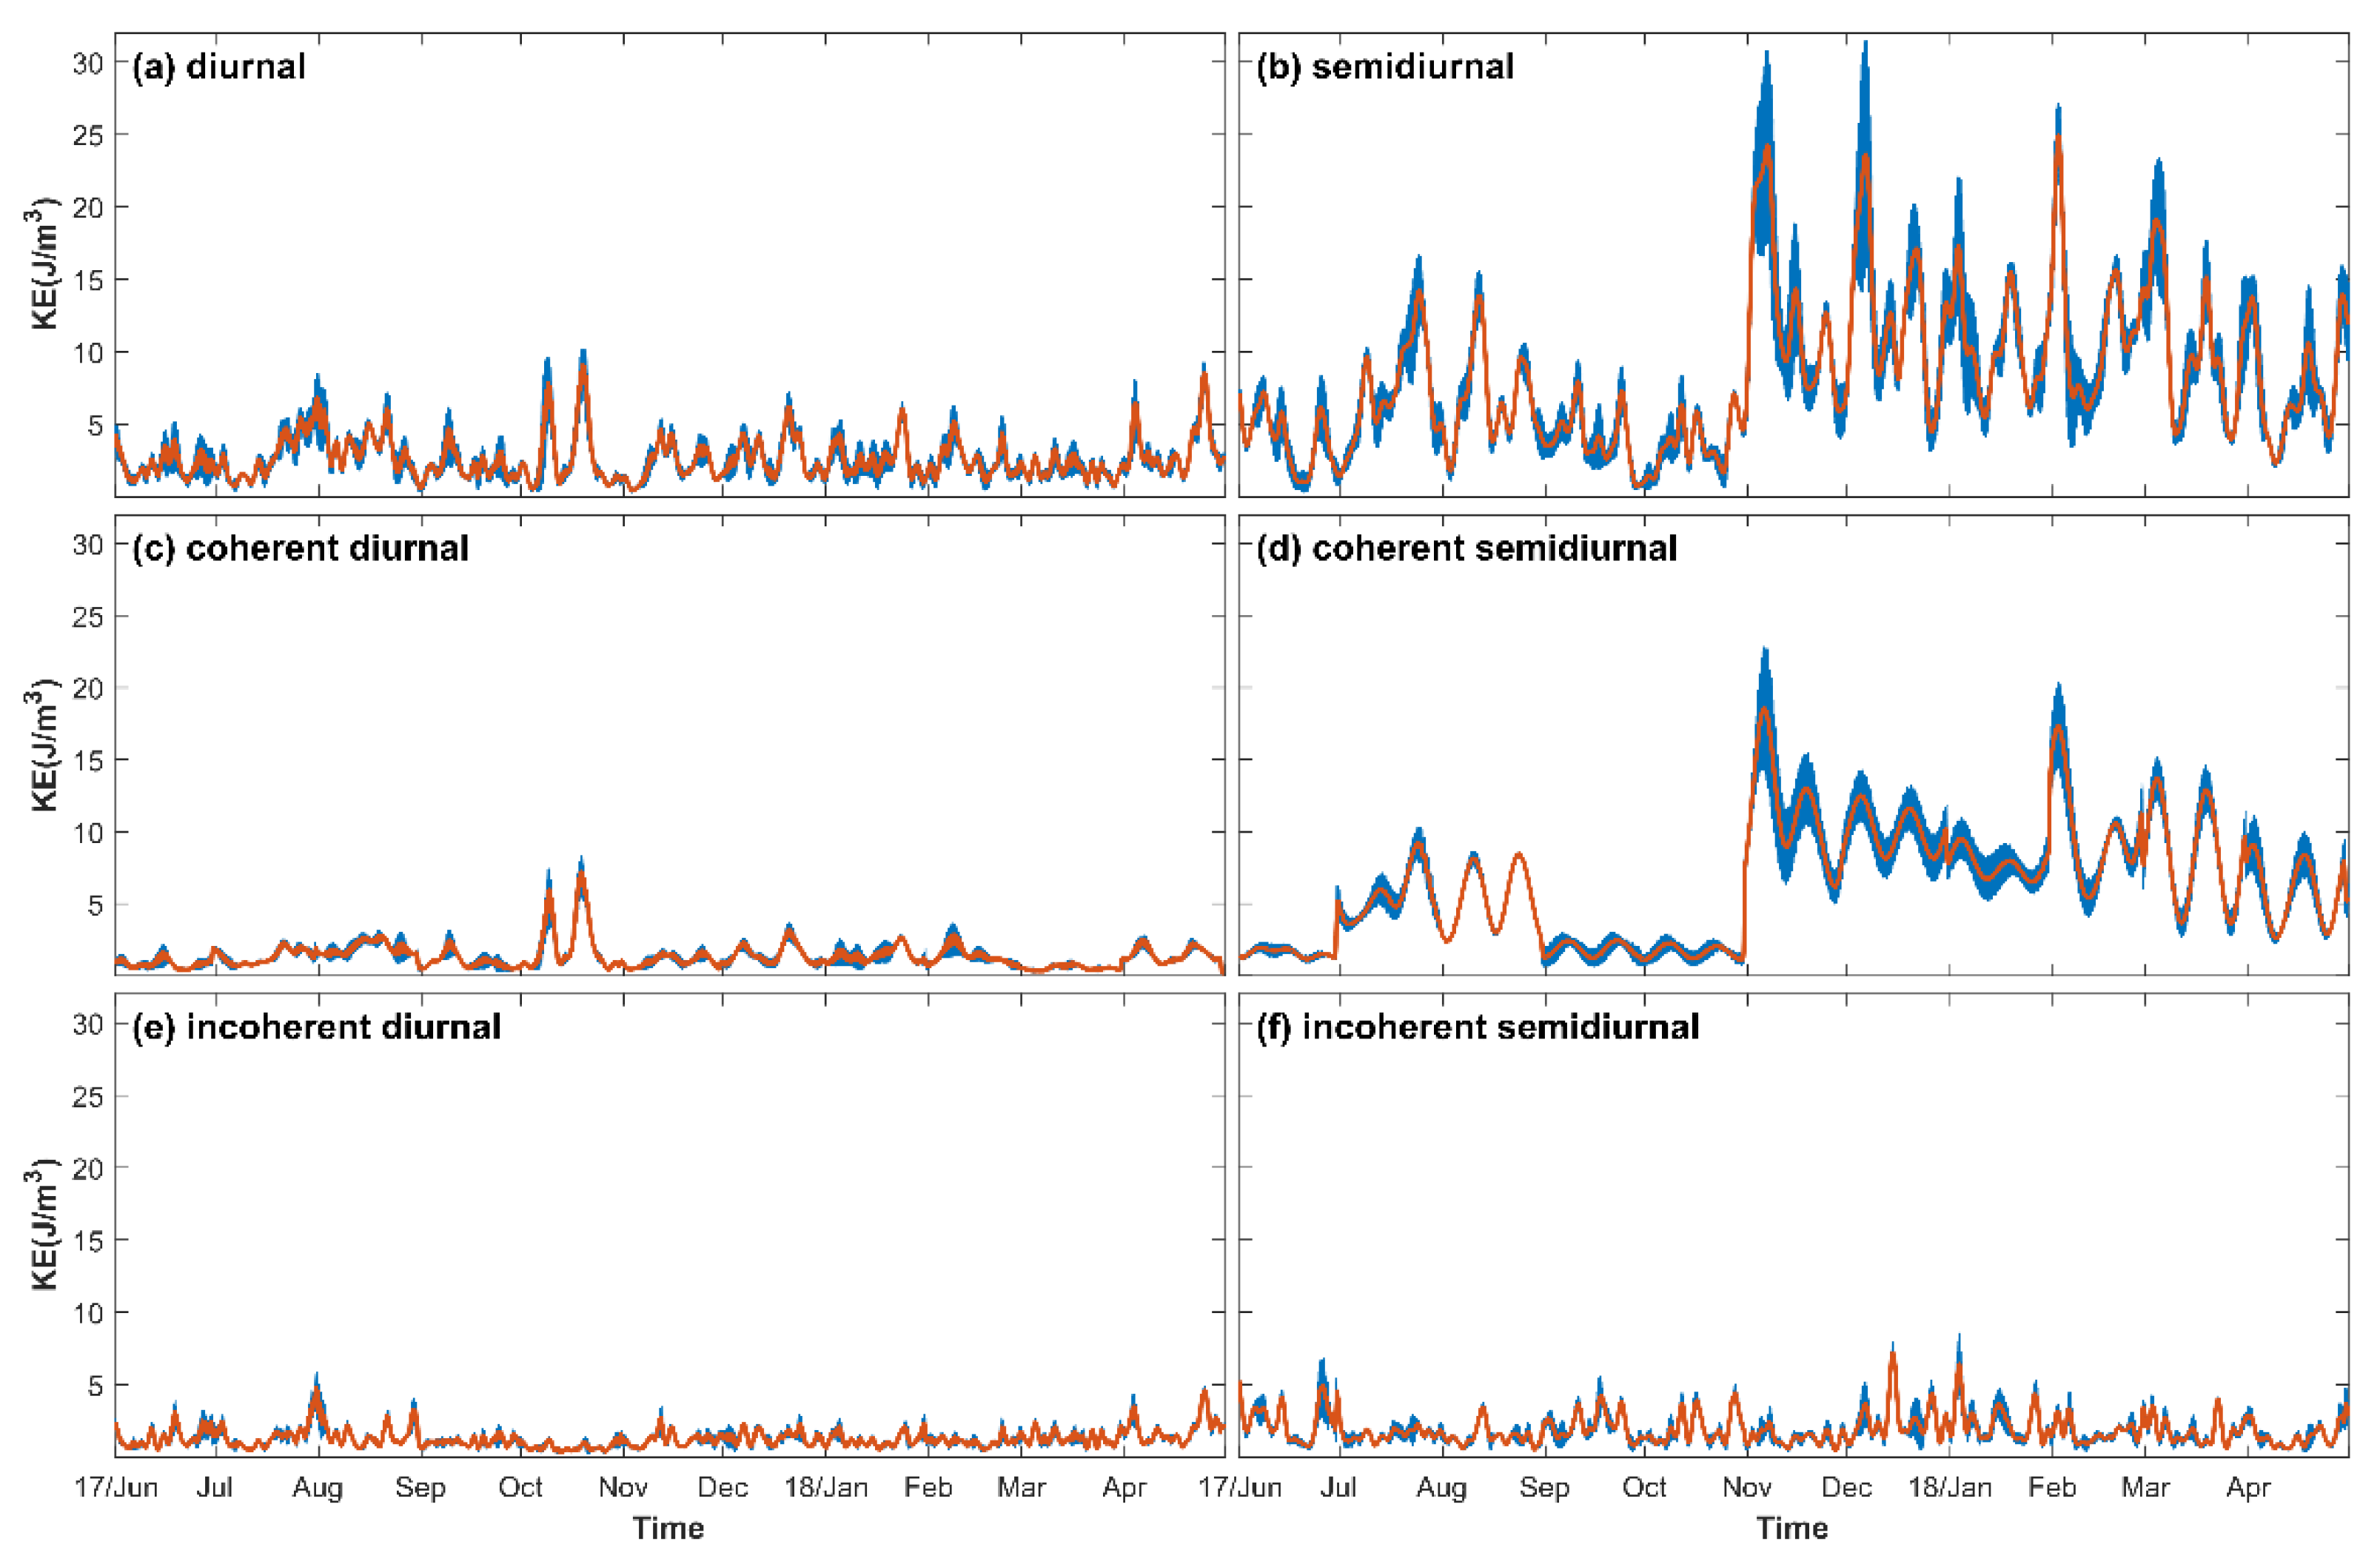
Figure 4 presents the depth-mean KE evolution of the diurnal, semidiurnal, coherent diurnal, coherent semidiurnal, incoherent diurnal, and incoherent semidiurnal ITs. The diurnal ITs had a maximum depth-mean KE of about 10 J/m3, and they did not exhibit regular variation. However, the KE of the semidiurnal ITs was much greater than that of the diurnal ITs, and it experienced an abrupt enhancement in November of 2017, with a depth-mean KE of 30 J/m3. The diurnal ITs had comparatively coherent and incoherent components during the observation period. The coherent diurnal ITs increased in October of 2017, and the incoherent diurnal ITs varied irregularly. The incoherent semidiurnal ITs also varied irregularly; however, the coherent semidiurnal ITs were enhanced in July and August of 2017 and from November 2017 to April 2018. In June, September, and October of 2017, the coherent and incoherent semidiurnal ITs had comparative KE values; however, the coherent semidiurnal ITs were much more energetic than the incoherent semidiurnal ITs from November 2017 to April 2018. Since the semidiurnal ITs dominated the observation site and exhibited abrupt enhancement, we focused on the semidiurnal ITs.
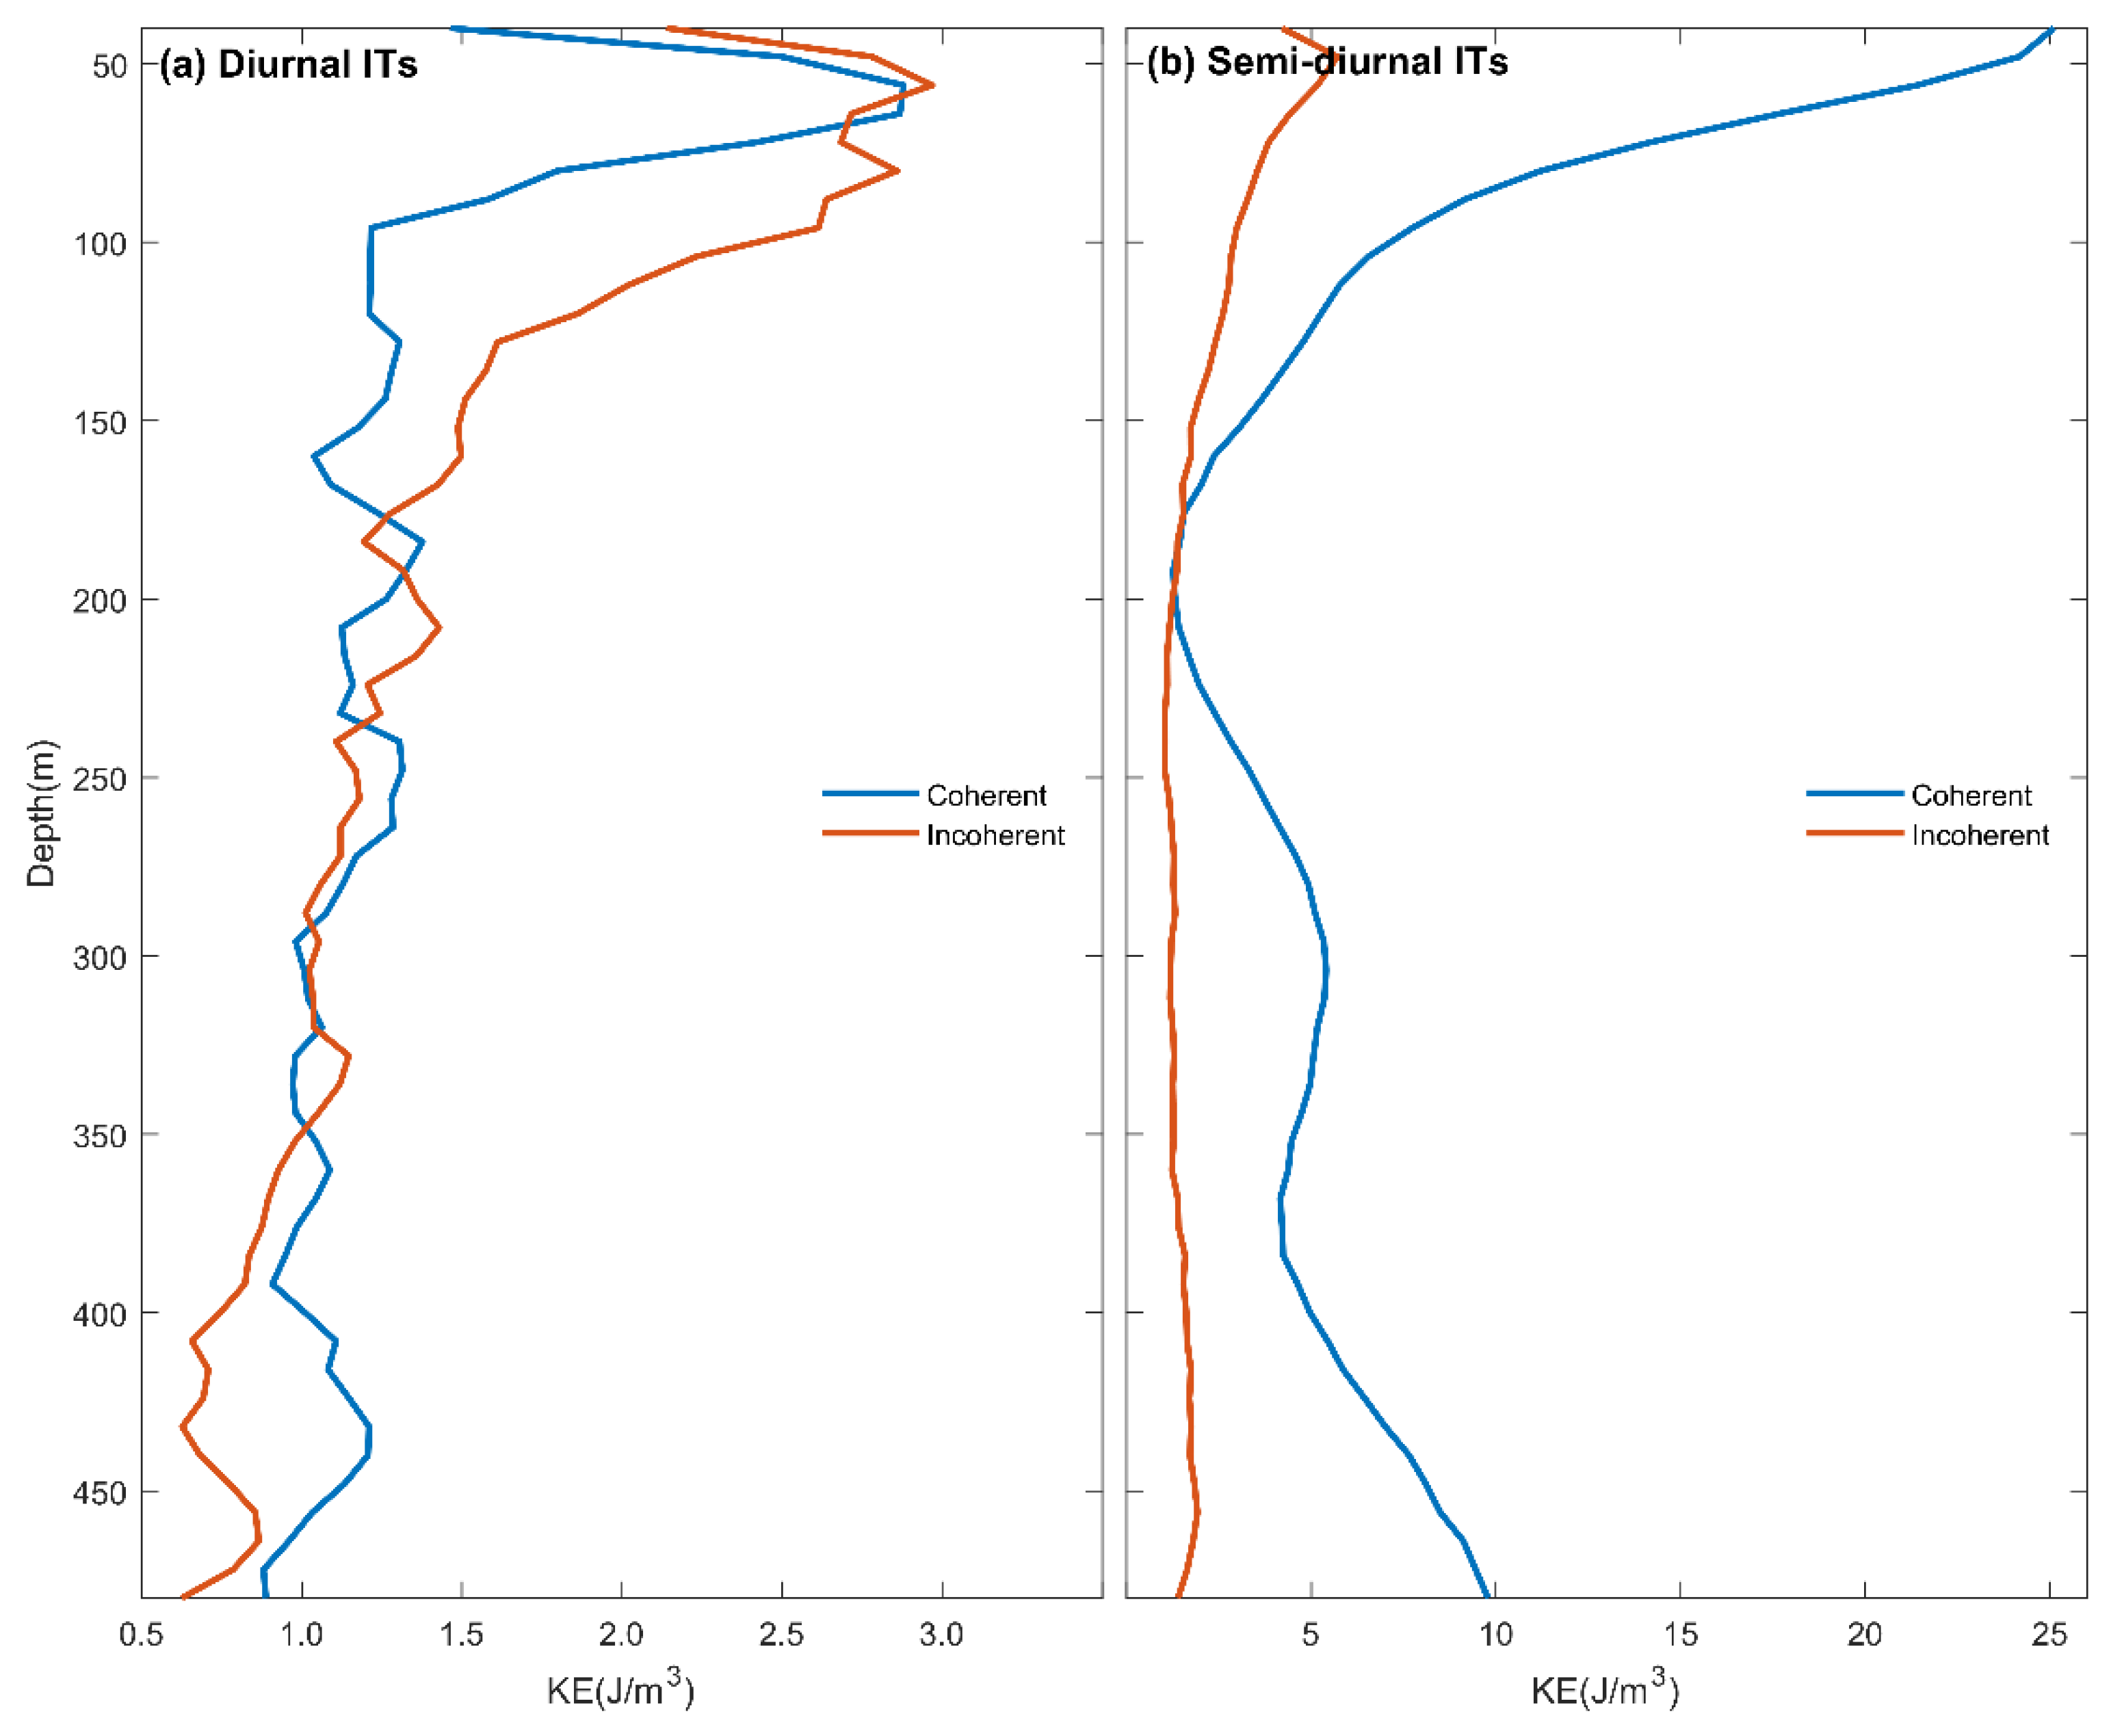
The temporal mean of the coherent and incoherent kinetic energy densities of the diurnal and semidiurnal ITs are shown in Figure 5. The diurnal ITs had comparatively coherent and incoherent ITs. The coherent and incoherent diurnal ITs had similar vertical profiles, which reached the maximum value at a depth of 60 m and then decreased with increasing depth. The maximum temporal mean energy density of the coherent and incoherent diurnal ITs was 3 J/m3. The semidiurnal ITs had stronger coherent components than incoherent components at most depths. The incoherent semidiurnal ITs exhibited subtle vertical variations; however, the coherent semidiurnal ITs exhibited significant vertical variations. The energy density of the incoherent semidiurnal ITs ranged from 2 to 5 J/m3. The coherent semidiurnal ITs were surface-intensified, with an energy density of 25 J/m3, and then, they decreased with depth to 200 m. Then, they increased with depth, reaching 10 J/m3 at the bottom. The coherent diurnal and semidiurnal ITs contributed 55% and 75% to the variance of the diurnal and semidiurnal ITs, respectively.
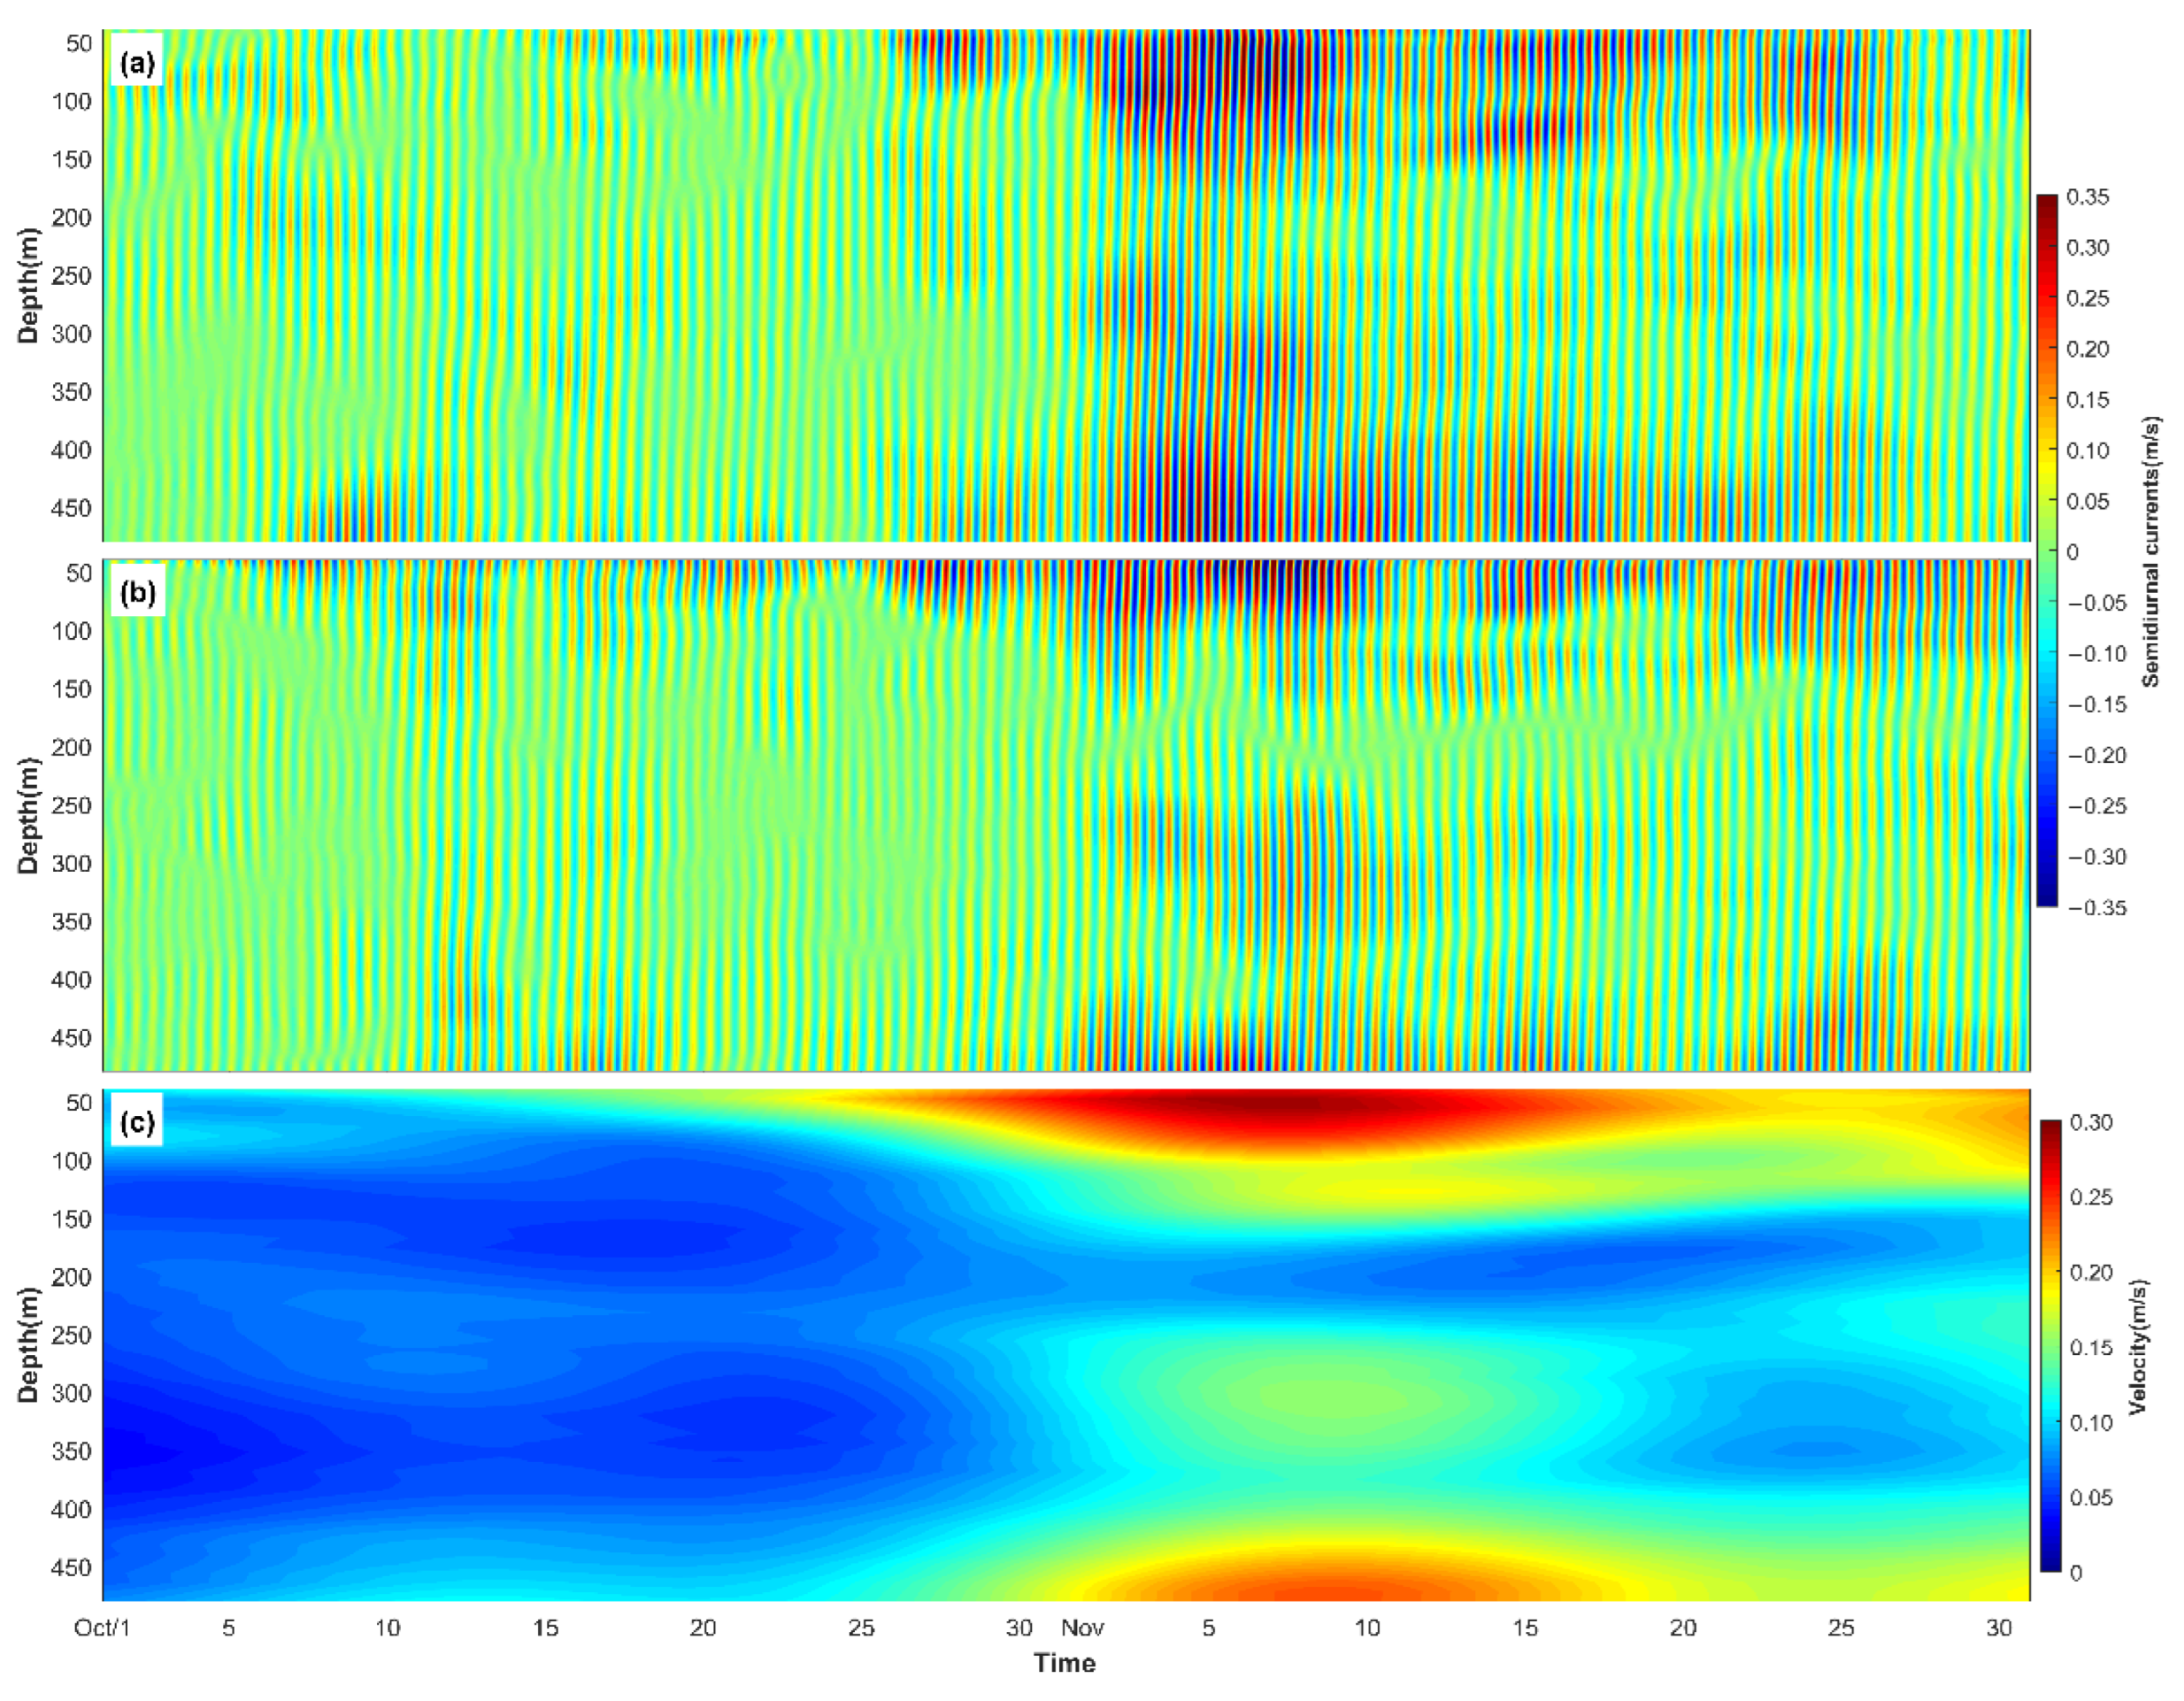
Figure 6 shows the evolution of the semidiurnal IT currents from October to November in 2017. The semidiurnal ITs exhibited abrupt enhancement between October and November in 2017. In October, the semidiurnal ITs had maximum zonal and meridional current components of about 0.15 m/s; however, the zonal and meridional currents of the semidiurnal ITs intensified to 0.35 m/s in November. The enhancement of the semidiurnal ITs began at the end of October, and it first appeared in the upper layer (above 110 m). In early November, the semidiurnal ITs strengthened in both the upper and bottom layers which was evident from the low-pass filtered amplitude of semidiurnal internal tidal velocity (Figure 6c).
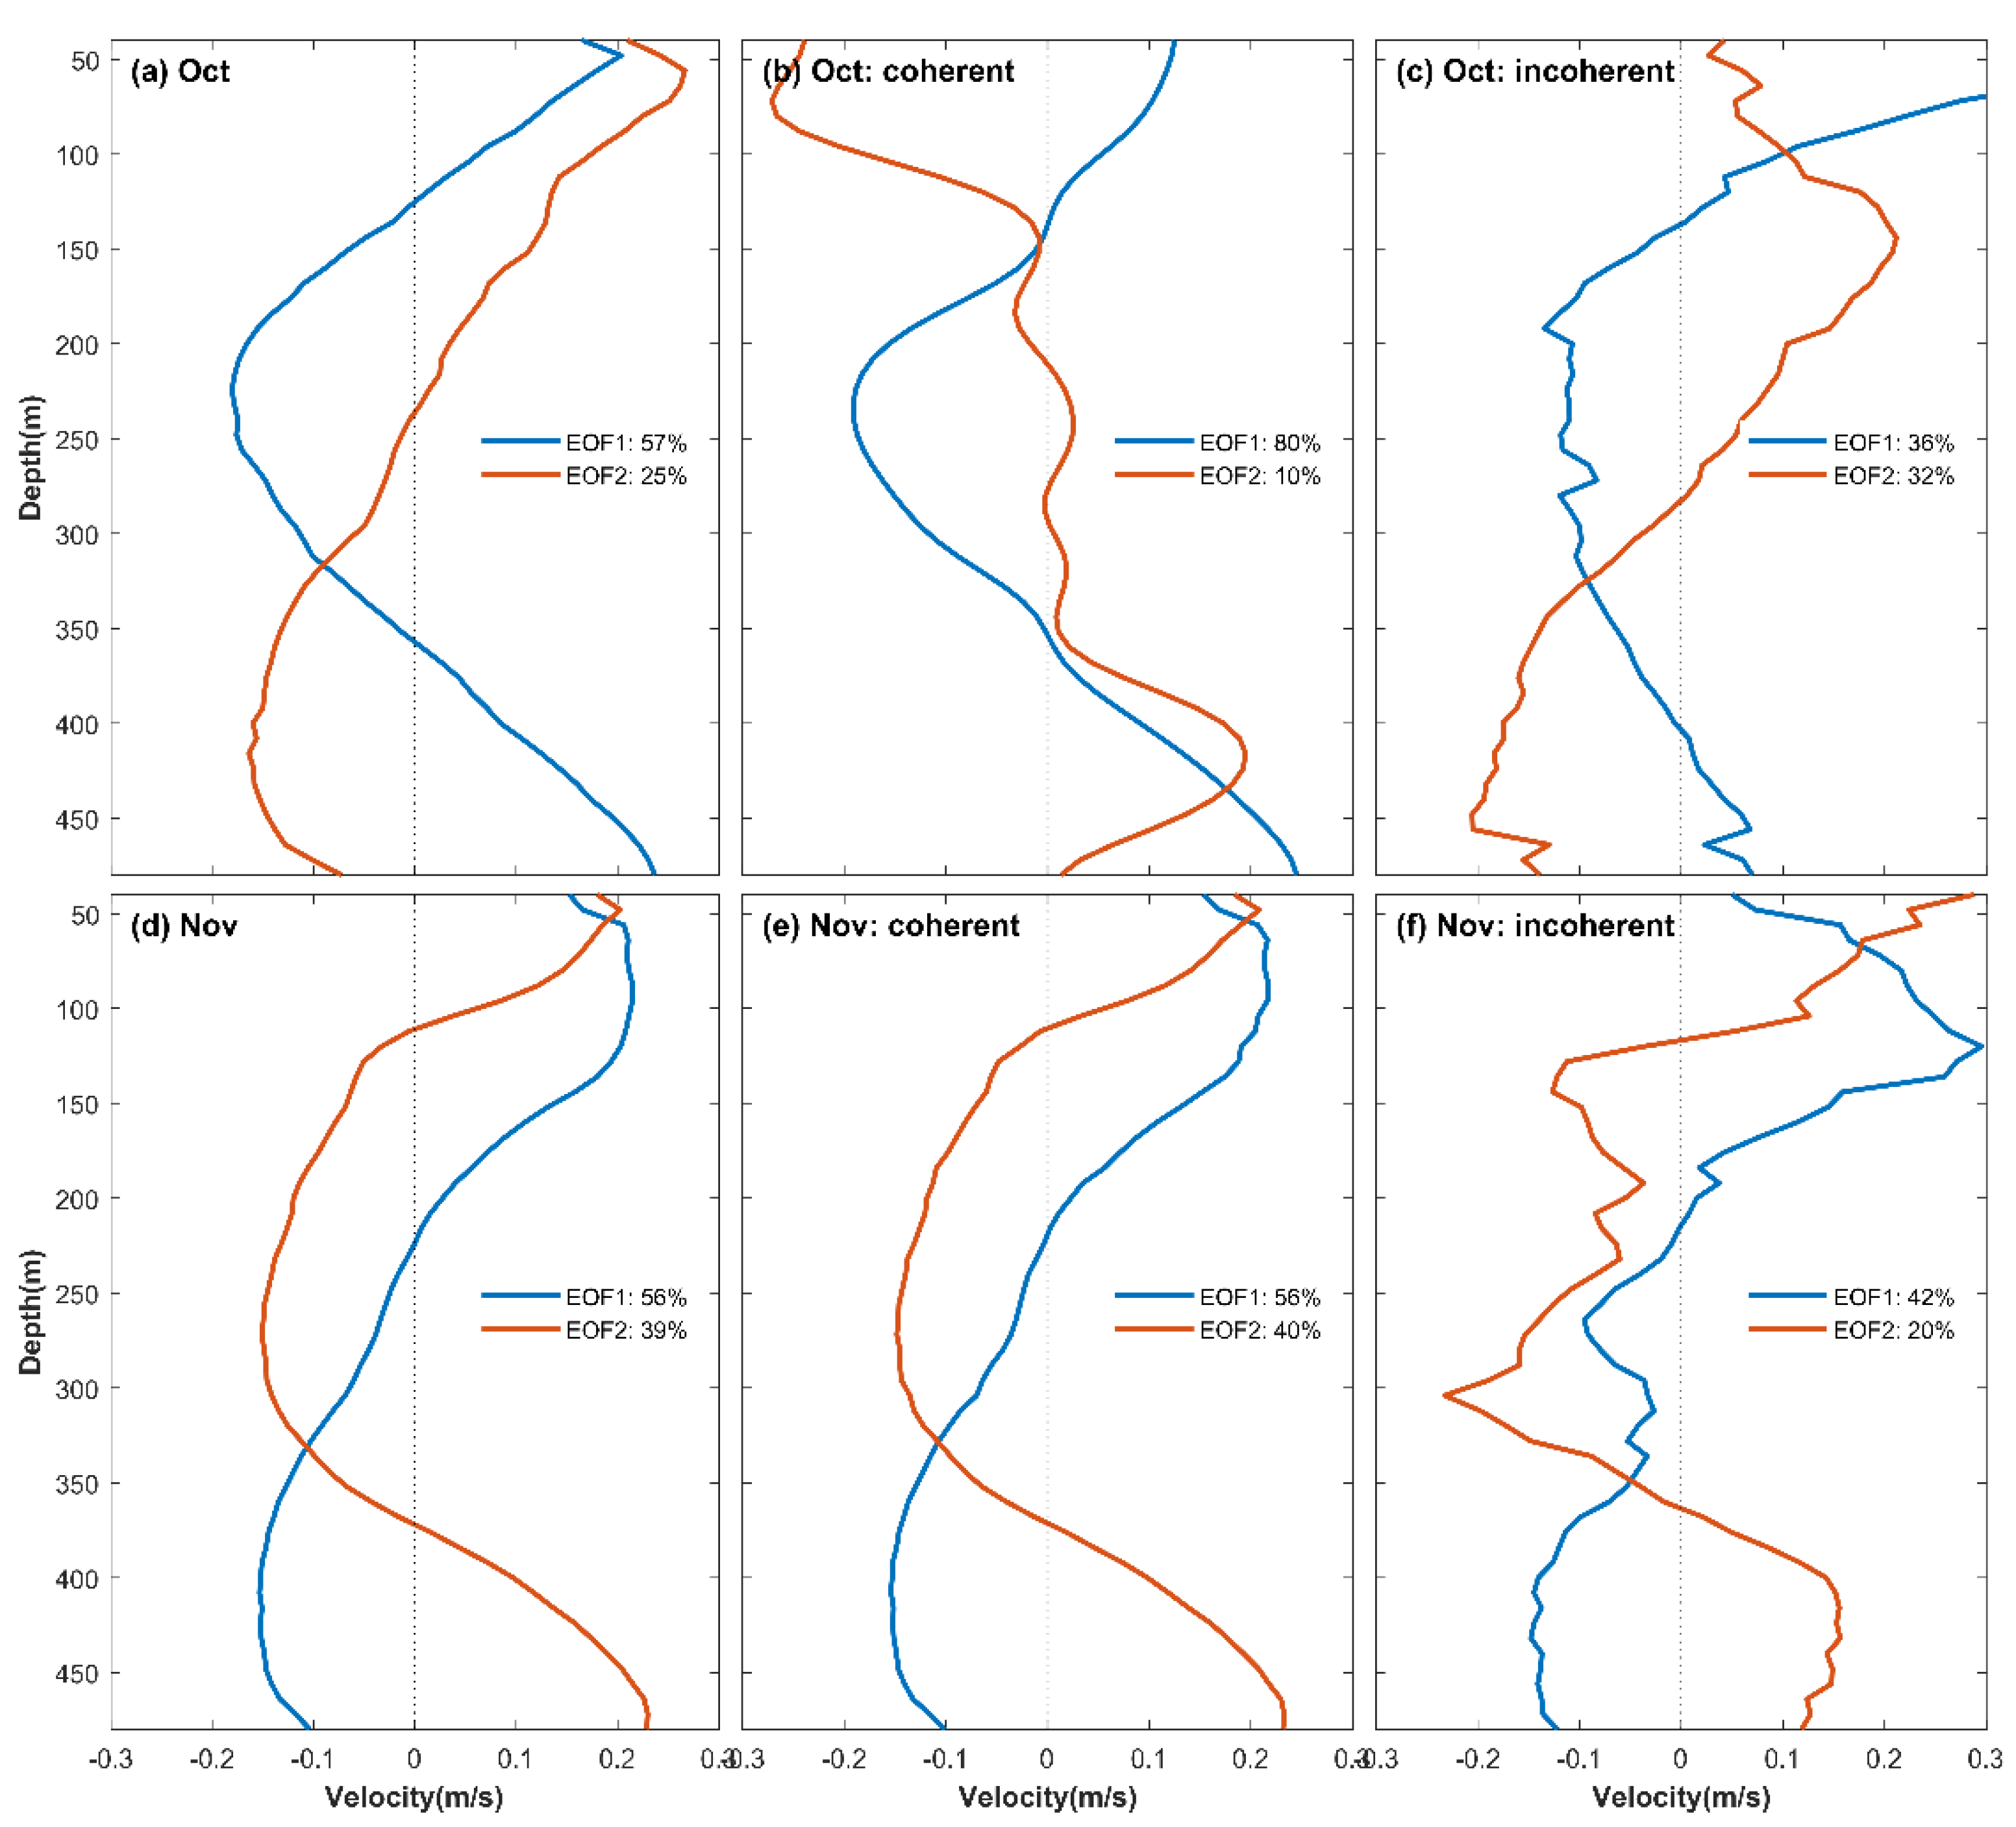
Vertical modes of the semidiurnal internal tides in October and November are shown in Figure 7. Since the observations covered almost the entire water column, the physical mode can be distinguished from the vertical profile of each EOF. In October, the semidiurnal ITs were composed primarily of the first and second baroclinic mode, with variance contributions of 25% and 57%, respectively. However, in November, the first and second mode semidiurnal ITs had variance contributions of 56% and 39%. That is, the variance contribution of the first mode increased from 25% to 56%, and that of the second mode decreased from 57% to 39%.
In October, the coherent and incoherent semidiurnal ITs had comparable variance contributions of 45% and 55%; however, in November, the coherent semidiurnal ITs was dominant, with a variance contribution of 90% which was consistent with Figure 4. The dominant coherent semidiurnal ITs suggested that in November, the ITs remained phase-locked with the local barotropic tides, and they were generated in the vicinity of the observation site. The Mien-Hua Canyon and North Mien-Hua Canyon are the closest significant generation sites of semidiurnal ITs [23,25,27], and they are the probable generation sites of the observed semidiurnal ITs.

4. Discussion

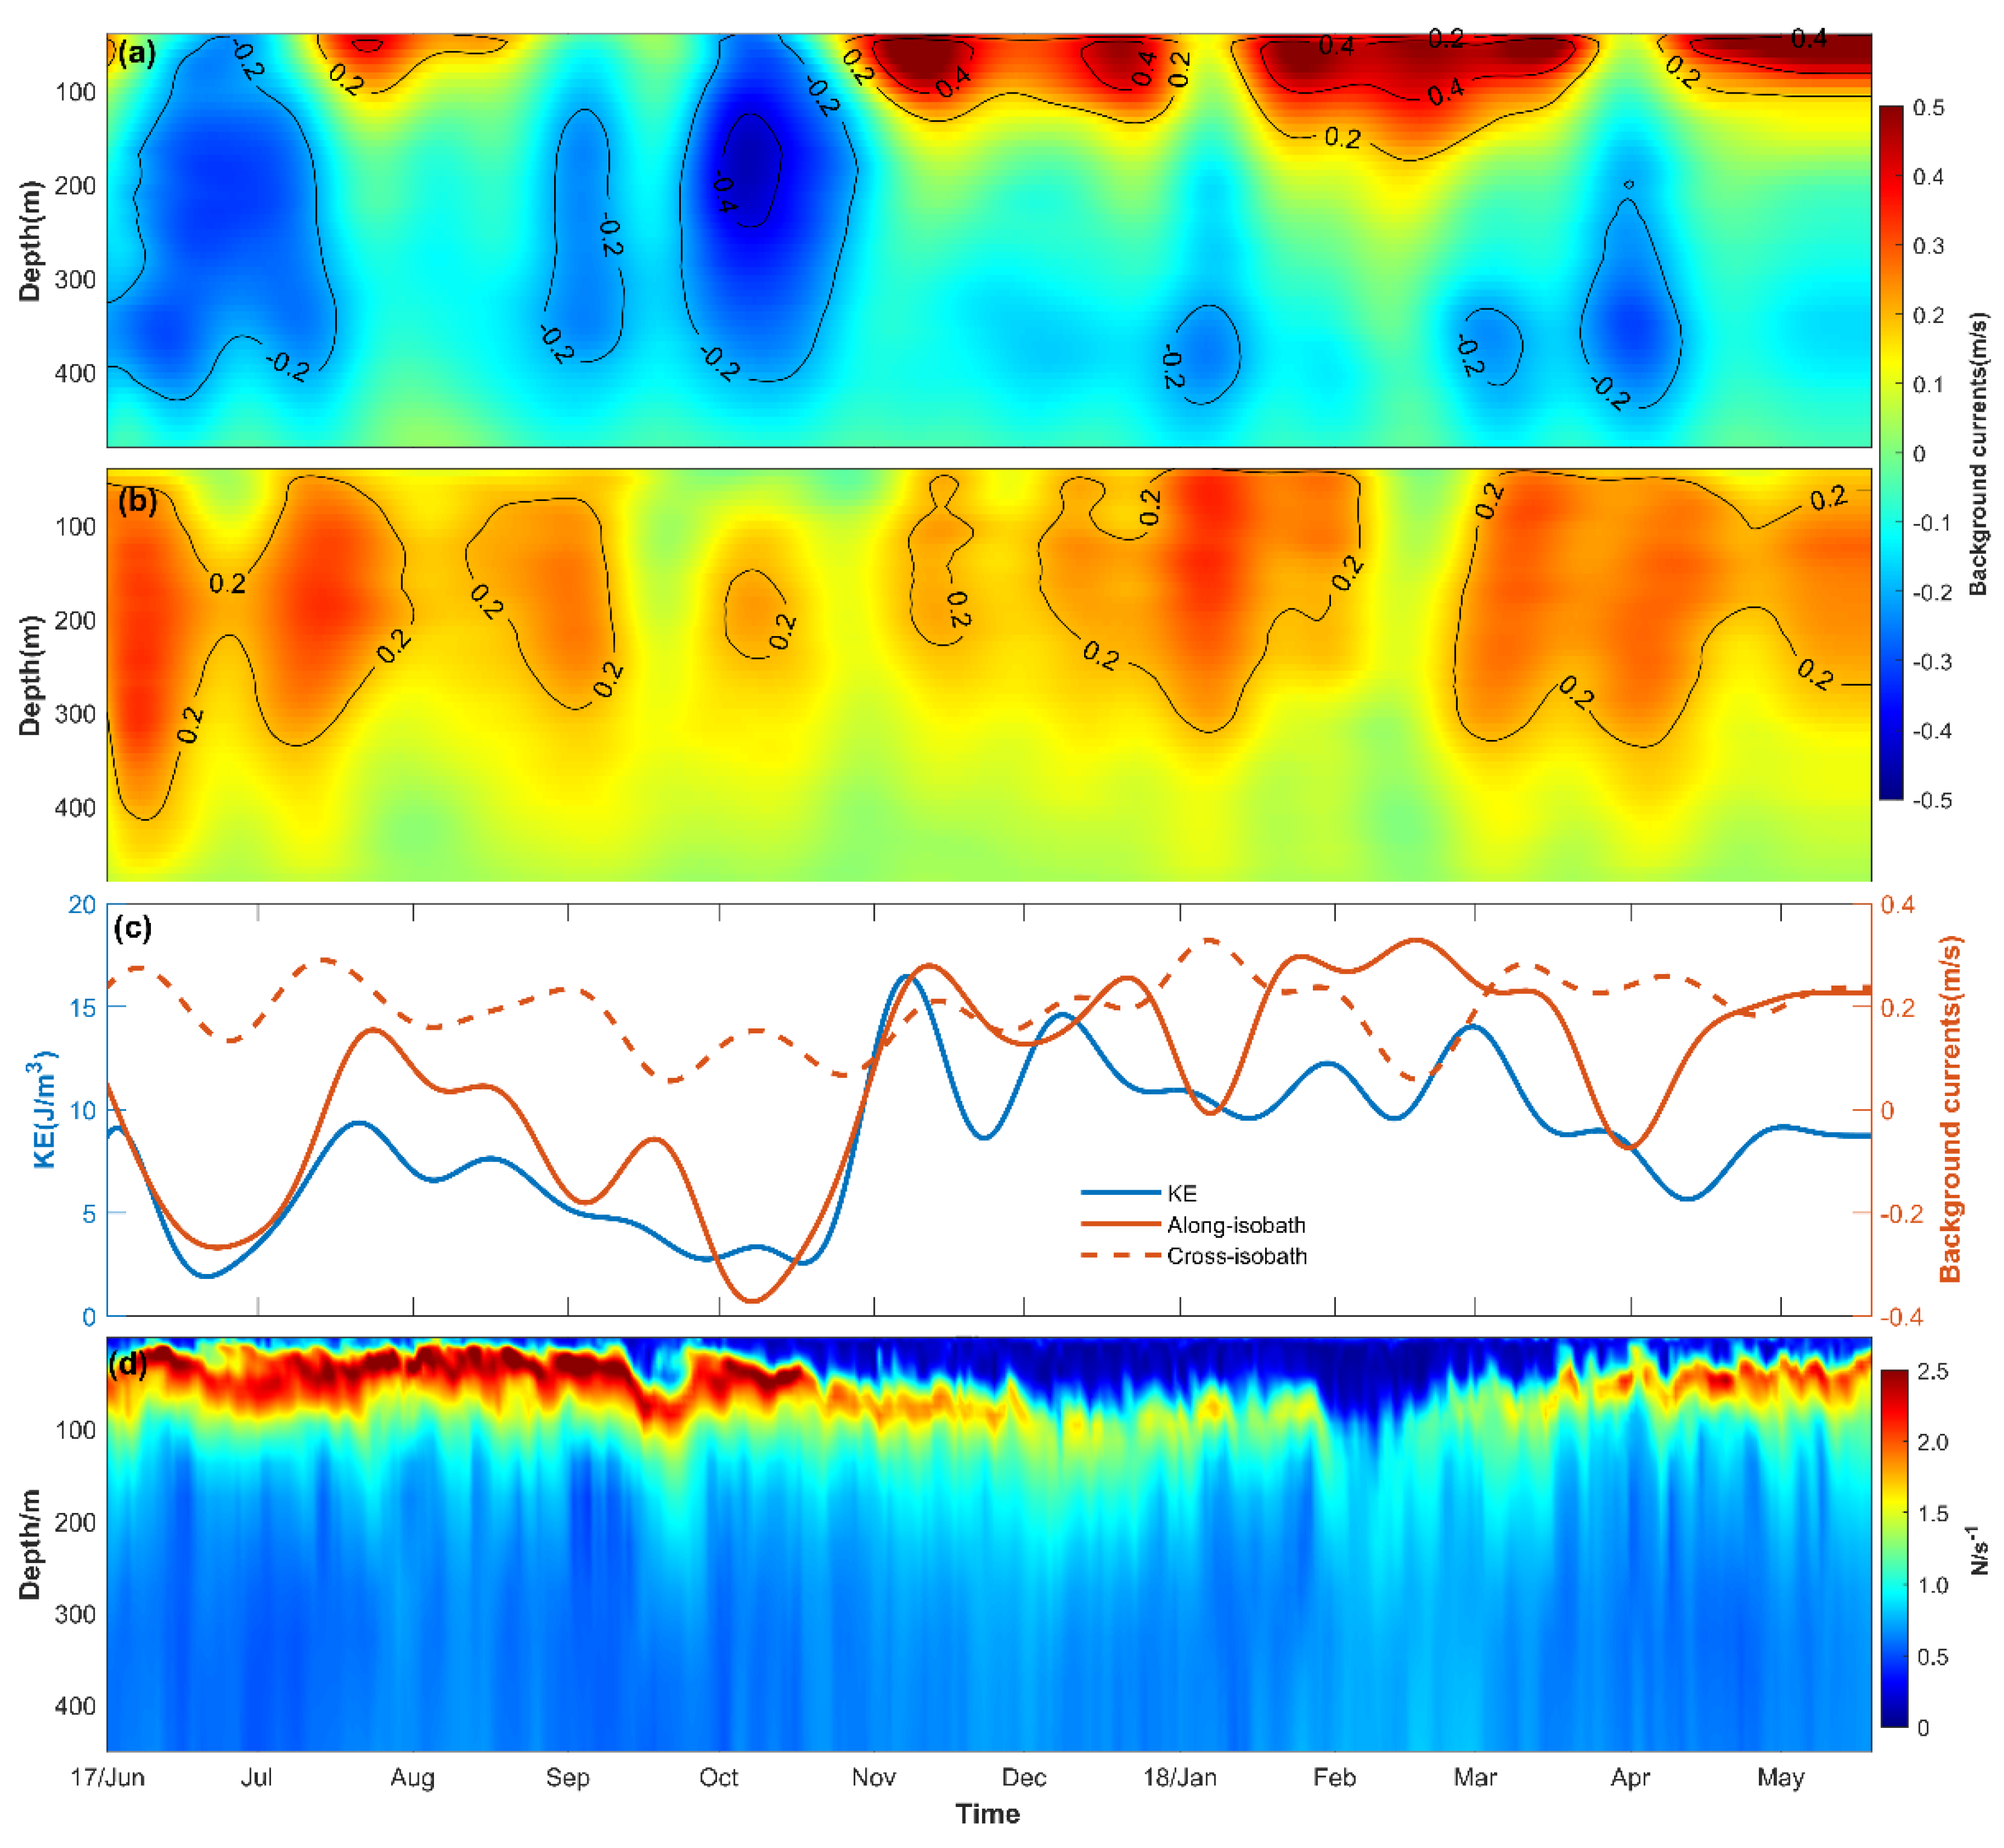
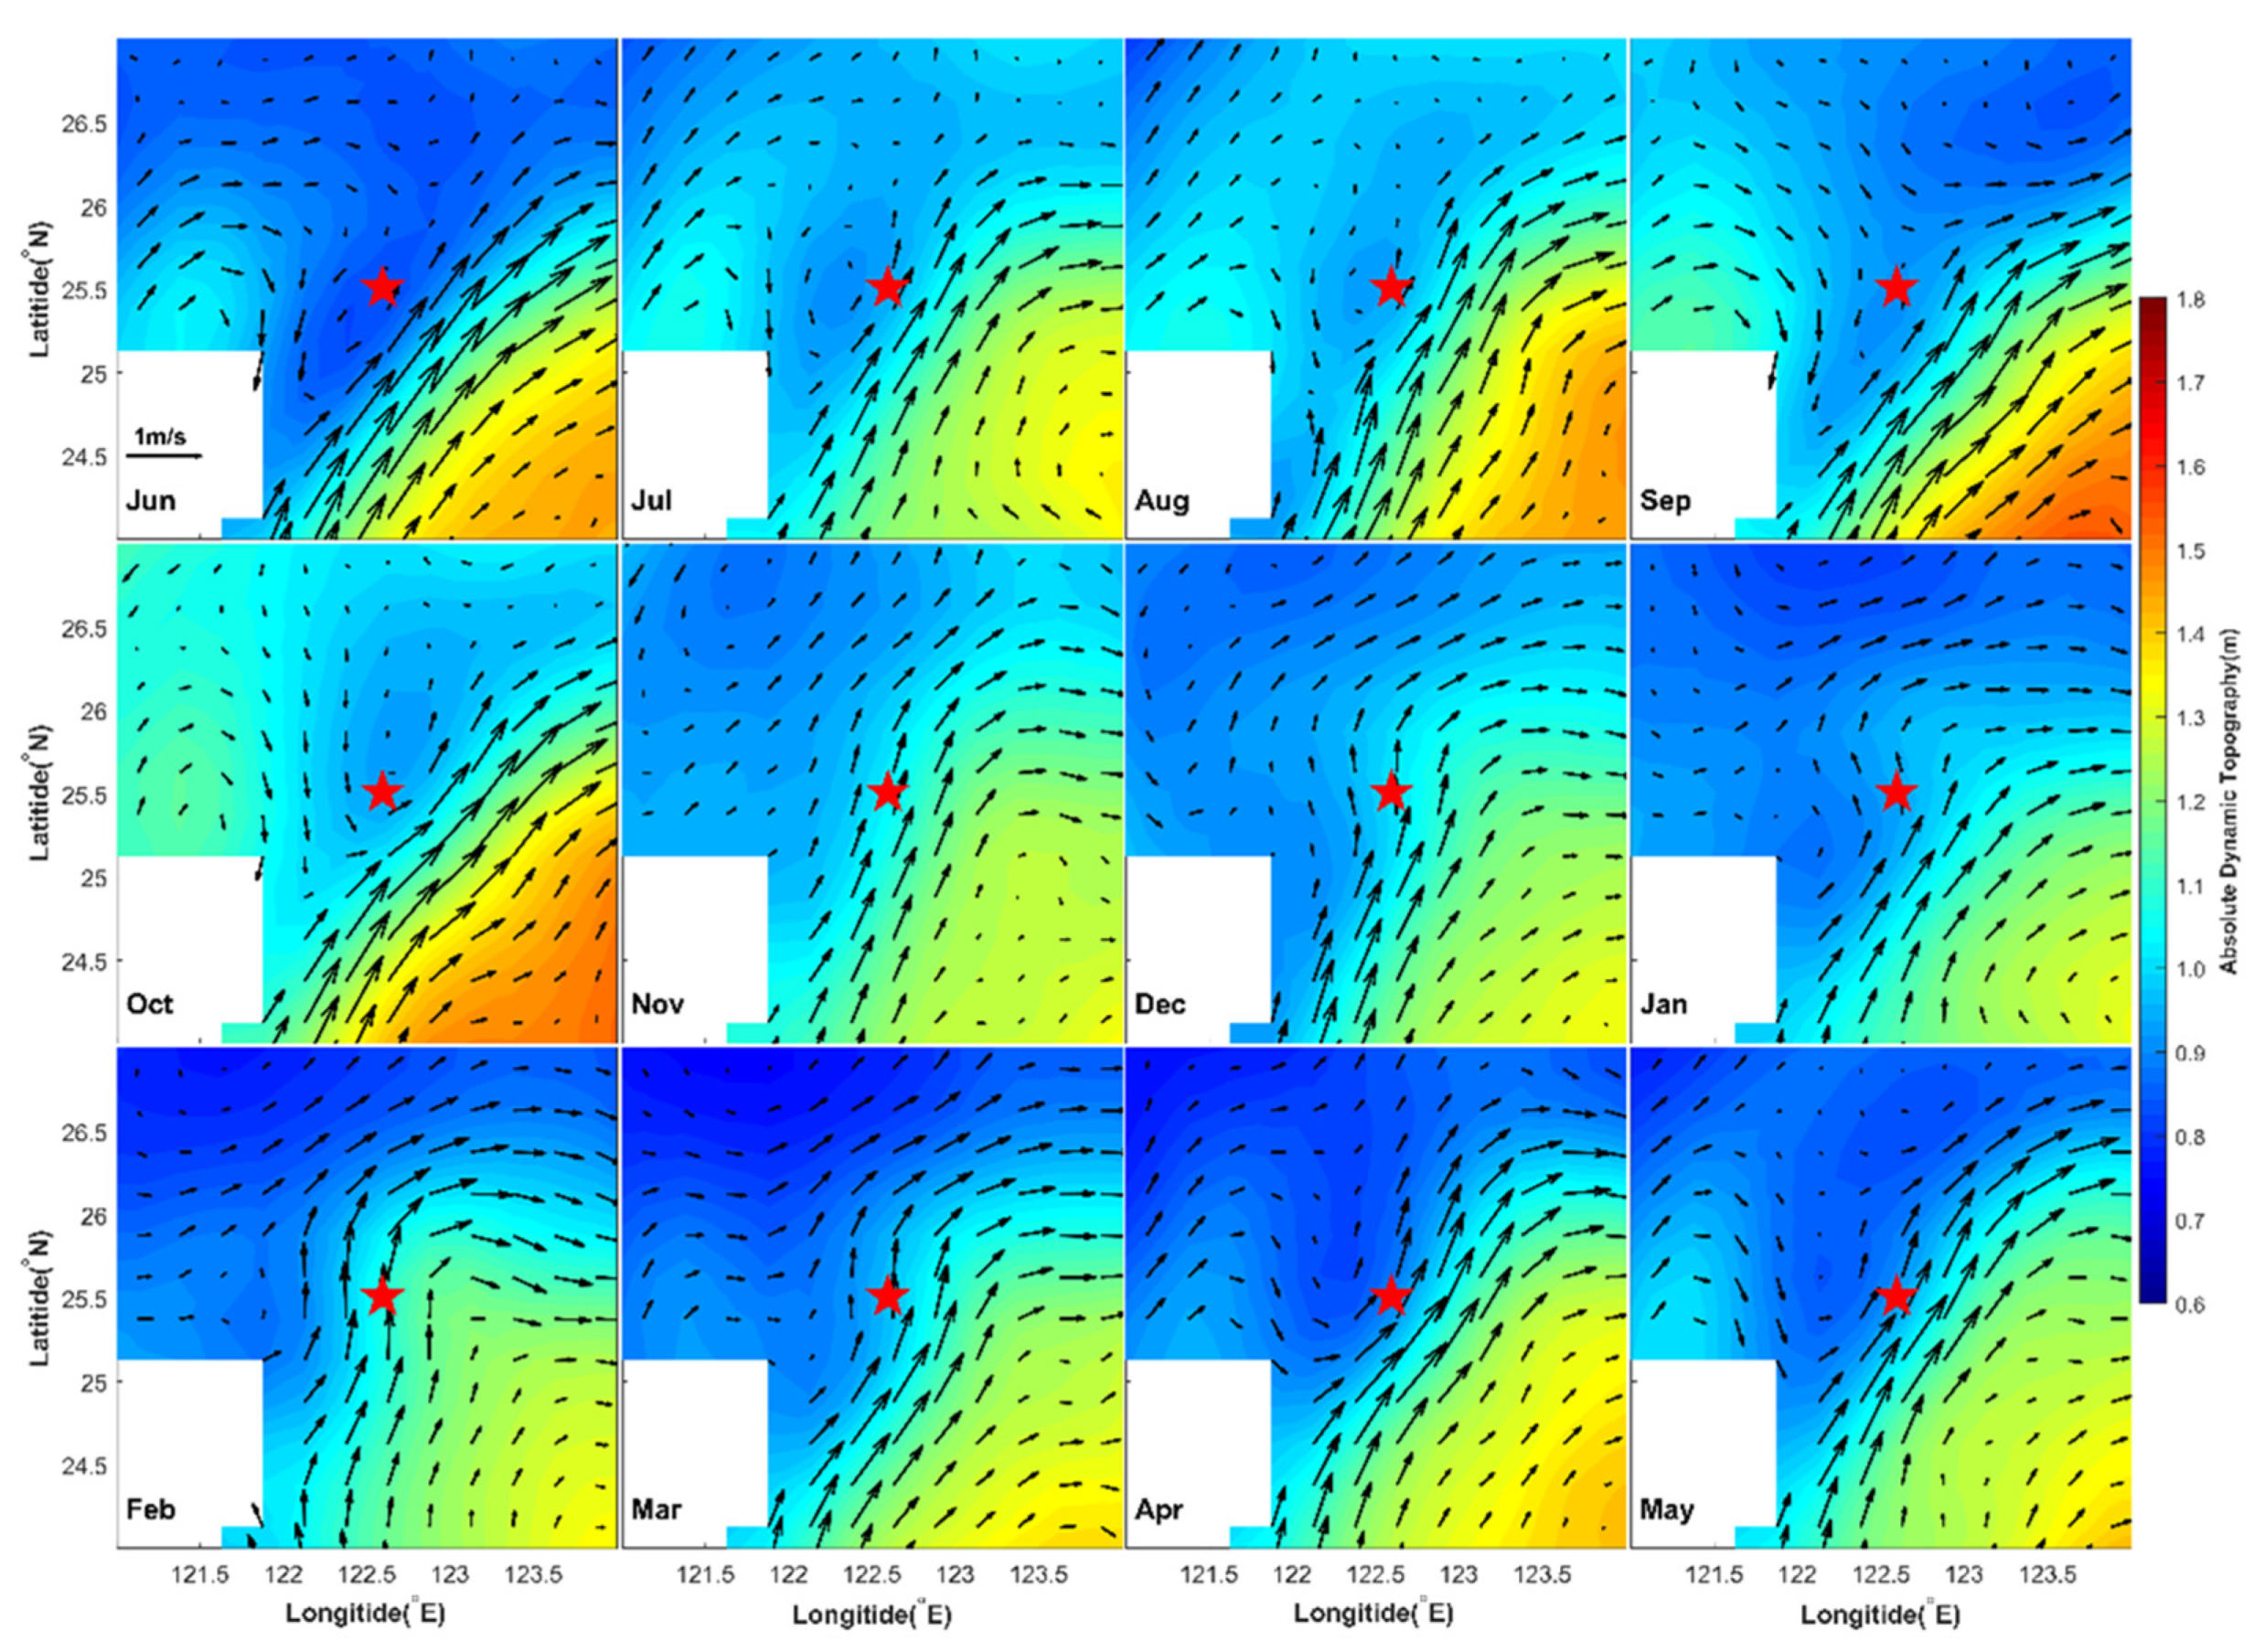
The incoherent internal tides appeared to be a little noisy which is probably related to the measurement accuracy of the ADCP, i.e., ±1.0% of measured velocity ± 0.5 cm/s, and the irregular characteristic of incoherent tides (Figure 4). The background currents obtained using a low-pass filter with a cutoff frequency of 1/30 cpd are shown in Figure 8. The amplitude and direction of the cross-isobath background currents varied only slightly; however, the along-isobath background currents varied conspicuously in the upper 200 m. The along-isobath background currents exhibited an abrupt direction reversal from October to November in 2017. Based on the monthly mean geostrophic currents from the AVISO (Figure 9), the along-isobath background currents’ direction reversal corresponded to the intrusion of the Kuroshio current into the ECS, and the in situ observations suggested that the Kuroshio intrusion occurred mainly in the upper 200 m.
The low-pass filtered KE of the semidiurnal ITs with a cutoff frequency of 1/30 cpd suggested that the KE was highly correlated to the along-isobath background currents (Figure 8c). The correlation coefficient between the low-pass filtered KE and the upper 200 m averaged along-isobath background currents reaches 0.81 with a 95% confidence interval of 0.80 to 0.82. Although the correlation was calculated between low-pass filtered time series, the rather high correlation coefficient suggests that the Kuroshio intrusion was related to the abrupt enhancement of the semidiurnal ITs. This conclusion is further supported by the background currents and semidiurnal ITs in July and August of 2017 when weaker Kuroshio intrusion (see Figure 9) and enhancement of the ITs occurred simultaneously. When Kuroshio intruded into the mooring station (Figure 9), the northeastward background current was thought to facilitate the northeastward propagation of ITs generated in the Mien-Hua Canyon which consequently induced the enhancement of semidiurnal ITs and coherent ITs. In addition, the correlation coefficient between the low-pass filtered KE and the upper 200 m averaged cross-isobath background currents is 0.26 with 95% confidence interval of 0.24 to 0.28. In summary, the influence of background currents on ITs in the southeastern ECS induced internal tidal energy field variation, which also occurred in the Luzon Strait [33,34,35,36], Tokara Strait and Izu Ridge [33], and the Bay of Bengal [36].

5. Conclusions

Based on one year of in situ observations, the characteristics and variation of the internal tides on continental slope of the southeastern East China Sea were examined. The semidiurnal barotropic and baroclinic tides dominated the local wave field. The diurnal ITs did not exhibit regular variations; however, the semidiurnal ITs experienced abrupt enhancement from November 2017 to April 2018. The semidiurnal internal tidal currents were about 0.15 m/s in October, and the semidiurnal internal tidal currents in November reached 0.35 m/s. The enhancement of the semidiurnal ITs was due to the intensification of the coherent semidiurnal ITs, whereas the incoherent semidiurnal ITs did not exhibit significant variation. In October, the coherent and incoherent semidiurnal ITs had comparative energies (i.e., 45% and 55%). In November, however, the coherent semidiurnal ITs dominated, with a variance contribution of 90%. In October, the second mode semidiurnal ITs, with a variance contribution of 57%, contributed most to the variance; however, in November, the first mode semidiurnal ITs, with a variance contribution of 56%, had the most variance contribution.
The satellite altimeter data and the observed background currents suggest that the Kuroshio mainstream meandered and intruded into the ECS at the location of the observation station from November 2017 to April 2018. The upper layer along-isobath background currents at the observation station were significantly related to the KE of the semidiurnal ITs. The correlation coefficient between the along-isobath background currents and the KE of the semidiurnal ITs reached 0.81, suggesting that the enhancement of the semidiurnal ITs was related to the intrusion of the Kuroshio current. When Kuroshio intrusion occurred, the northeastward background currents facilitate the northeastward propagation of ITs generated in the Mien-Hua Canyon which leaded to the enhancement of semidiurnal ITs and coherent ITs. The frequent occurrence of the intrusion of the Kuroshio current suggests that the ITs in the ECS are susceptible to the influence of the Kuroshio current. Numerical modeling and predications of the ITs should consider the meander of the Kuroshio mainstream.

Author Contributions

Conceptualization, P.H. and Y.H.; methodology, B.Y.; investigation, B.Y.; data curation, B.Y.; writing—original draft preparation, B.Y.; writing—review and editing, P.H.; visualization, B.Y.; supervision, Y.H.; project administration, P.H.; funding acquisition, P.H. and B.Y. All authors have read and agreed to the published version of the manuscript.

Funding

This research was funded by the National Natural Science Foundation of China, grant numbers 41630967, 41776020 and 41706017.

Institutional Review Board Statement

Not applicable.

Informed Consent Statement

Not applicable.

Data Availability Statement

The data presented in this study are available on request from the corresponding author.

Acknowledgments

The absolute dynamic topography and geostrophic current data from AVISO dataset is available at https://www.aviso.atimtry.fr/en/data.html and were accessed on 1 July 2021. The HYCOM+NCODA Global Analysis data are available at https://www.hycom.org/dataserver and were accessed on 1 July 2021.

Conflicts of Interest

The authors declare no conflict of interest. The funders had no role in the design of the study; in the collection, analyses, or interpretation of data; in the writing of the manuscript, or in the decision to publish the results.

References

  1. Egbert, G.D.; Ray, R.D. Significant dissipation of tidal energy in the deep ocean inferred from satellite altimeter data. Nature 2000, 405, 775–778. [Google Scholar] [CrossRef]
  2. Egbert, G.D.; Ray, R.D. Semidiurnal and diurnal tidal dissipation from TOPEX/Poseidon altimetry. Geophys. Res. Lett. 2003, 30, 1907. [Google Scholar] [CrossRef]
  3. Zhao, Z.; Alford, M.H.; Girton, J.B. Mapping low-mode internal tides from multisatellite altimetry. Oceanography 2012, 25, 42–51. [Google Scholar] [CrossRef] [Green Version]
  4. Zhao, Z.; Alford, M.H.; Girton, J.B.; Rainville, L.; Simmons, H.L. Global observations of open-ocean mode-1 M2 Internal Tides. J. Phys. Oceanogr. 2016, 46, 1657–1684. [Google Scholar] [CrossRef]
  5. Baines, P.G. On internal tide generation models. Deep Sea Res. Part A—Oceanogr. Res. Pap. 1982, 29, 307–338. [Google Scholar] [CrossRef]
  6. Lamb, K.G. Numerical experiments of internal wave generation by strong tidal flow across a finite amplitude bank edge. J. Geophys. Res. 1994, 99, 843–864. [Google Scholar] [CrossRef]
  7. Garrett, C.; Kunze, E. Internal tide generation in the deep ocean. Ann. Rev. Fluid Mech. 2007, 39, 57–87. [Google Scholar] [CrossRef]
  8. Qian, H.; Shaw, P.T.; Ko, D.S. Generation of internal waves by barotropic tidal flow over a steep ridge. Deep-Sea Res. Part I—Oceanogr. Res. Pap. 2010, 57, 1521–1531. [Google Scholar] [CrossRef]
  9. Klymak, J.M.; Alford, M.H.; Pinkel, R.; Lien, R.C.; Tang, T.Y. The breaking and scattering of the internal tide on a continental slope. J. Phys. Oceanogr. 2011, 41, 926–945. [Google Scholar] [CrossRef]
  10. Rainville, L.; Pinkel, R. Baroclinic energy flux at the Hawaiian Ridge: Observations from the R/P FLIP. J. Phys. Oceanogr. 2006, 36, 1104–1122. [Google Scholar] [CrossRef]
  11. Zhao, Z.; Alford, M.H.; MacKinnon, J.A.; Pinkel, R. Long-range propagation of the semidiurnal internal tide from the Hawaiian Ridge. J. Phys. Oceanogr. 2010, 40, 713–736. [Google Scholar] [CrossRef] [Green Version]
  12. Zhao, Z. Internal tide radiation from the Luzon Strait. J. Geophys. Res. Ocean. 2014, 119, 5434–5448. [Google Scholar] [CrossRef]
  13. Xu, Z.; Liu, K.; Yin, B.; Zhao, Z.; Wang, Y.; Li, Q. Long-range propagation and associated variability of internal tides in the South China Sea. J. Geophys. Res. Ocean. 2016, 121, 8268–8286. [Google Scholar] [CrossRef]
  14. Eich, M.L.; Merrifield, M.A.; Alford, M.H. Structure and variability of semidiurnal internal tides in Mamala Bay, Hawaii. J. Geophys. Res.-Oceans 2004, 109, C5. [Google Scholar] [CrossRef]
  15. van Haren, H. Incoherent internal tidal currents in the deep ocean. Ocean Dyn. 2004, 54, 66–76. [Google Scholar] [CrossRef]
  16. van Aken, H.M.; van Haren, H.; Maas, L.R.M. The high-resolution vertical structure of internal tides and near-inertial waves measured with an ADCP over the continental slope in the Bay of Biscay. Deep. Sea Res. Part I Oceanogr. Res. Pap. 2007, 54, 533–556. [Google Scholar] [CrossRef]
  17. Garrett, C. Internal tides and ocean mixing. Science 2003, 301, 1858–1859. [Google Scholar] [CrossRef]
  18. Levitus, S.; Antonov, J.I.; Boyer, T.P.; Baranova, O.K.; Garcia, H.E.; Locarnini, R.A.; Mishonov, A.V.; Reagan, J.R.; Seidov, D.; Yarosh, E.S.; et al. World ocean heat content and thermosteric sea level change (0–2000 m), 1955–2010. Geophys. Res. Lett. 2012, 39, L10603. [Google Scholar] [CrossRef] [Green Version]
  19. Yang, J.; Zhou, S.H.; Zhou, J.X.; Lynch, J.F. Internal wave characteristics at the ASIAEX site in the East China Sea. IEEE J. Ocean. Eng. 2004, 29, 1054–1060. [Google Scholar] [CrossRef]
  20. Kuroda, Y.; Mitsudera, H. Observation of internal tides in the East China Sea with an underwater sliding vehicle. J. Geophys. Res. 1995, 100, 10801–10816. [Google Scholar] [CrossRef]
  21. Park, J.H.; Andres, M.; Martin, P.J.; Wimbush, M.; Watts, D.R. Second-mode internal tides in the East China Sea deduced from historical hydrocasts and a model. Geophys. Res. Lett. 2006, 33, L05602. [Google Scholar] [CrossRef] [Green Version]
  22. Park, J.H.; Jae, L.H.; Guo, B.H. Observation of semidiurnal internal tides and near-inertial waves at the shelf break of the East China Sea. Ocean. Polar Res. 2011, 33, 409–419. [Google Scholar] [CrossRef] [Green Version]
  23. Lien, R.C.; Sanford, T.B.; Jan, S.; Chang, M.H.; Ma, B.B. Internal tides on the East China Sea continental slope. J. Mar. Res. 2013, 71, 151–185. [Google Scholar] [CrossRef]
  24. Zhao, X.; Hou, Y.; Liu, Z.; Zhuang, Z.; Wang, K. Seasonal variability of internal tides northeast of Taiwan. J. Ocean Univ. China 2020, 19, 740–746. [Google Scholar] [CrossRef]
  25. Niwa, Y.; Hibiya, T. Three-dimensional numerical simulation of M2 internal tides in the East China Sea. J. Geophys. Res. 2004, 109, C04027. [Google Scholar] [CrossRef]
  26. Wang, Y.; Xu, Z.; Yin, B.; Hou, Y.; Chang, H. Long-range radiation and interference pattern of multisource M2 internal tides in the Philippine Sea. J. Geophys. Res. Oceans 2018, 123, 5091–5112. [Google Scholar] [CrossRef] [Green Version]
  27. Chang, H.; Xu, Z.; Yin, B.; Hou, Y.; Liu, Y.; Li, D.; Wang, Y.; Cao, S.; Liu, A.K. Generation and propagation of M2 internal tides modulated by the Kuroshio northeast of Taiwan. J. Geophys. Res. Ocean. 2019, 124, 2728–2749. [Google Scholar] [CrossRef]
  28. Hsu, M.K.; Liu, A.K.; Liu, C. A study of internal waves in the China Seas and Yellow Sea using SAR. Cont. Shelf Res. 2000, 20, 389–410. [Google Scholar] [CrossRef]
  29. Guo, X.; Miyazawa, Y.; Yamagata, T. The Kuroshio onshore intrusion along the shelf break of the East China Sea: The origin of the Tsushima Warm Current. J. Phys. Oceanogr. 2006, 36, 2205–2231. [Google Scholar] [CrossRef]
  30. Pawlowicz, R.; Beardsley, R.; Lentz, S. Classical tidal harmonic analysis including error estimates in MATLAB using T_TIDE. Comput. Geosci. 2002, 28, 929–937. [Google Scholar] [CrossRef]
  31. Welch, P. The use of fast Fourier transform for the estimation of power spectra: A method based on time averaging over short, modified periodograms. IEEE Trans. Audio Electroacoust. 1967, 15, 70–73. [Google Scholar] [CrossRef] [Green Version]
  32. Leaman, K.D.; Sanford, T.B. Vertical energy propagation of inertial waves: A vector spectral analysis of velocity profiles. J. Geophys. Res. 1975, 80, 1975–1978. [Google Scholar] [CrossRef]
  33. Varlamov, S.M.; Guo, X.; Miyama, T.; Ichikawa, K.; Waseda, T.; Miyazawa, Y. M2 baroclinic tide variability modulated by the ocean circulation south of Japan. J. Geophys. Res. Ocean. 2015, 120, 3681–3710. [Google Scholar] [CrossRef]
  34. Song, P.; Chen, X. Investigation of the internal tides in the northwest Pacific Ocean considering the background circulation and stratification. J. Phys. Oceanogr. 2021, 50, 3165–3188. [Google Scholar] [CrossRef]
  35. Xu, Z.; Wang, Y.; Liu, Z.; McWilliams, J.C.; Gan, J. Insight into the dynamics of the radiating internal tide associated with the Kuroshio Current. J. Geophys. Res. Ocean. 2021, 126, e2020JC017018. [Google Scholar] [CrossRef]
  36. Jithin, A.K.; Francis, P.A.; Unnikrishnan, A.S.; Ramakrishna, S.S.V.S. Energetics and spatio-temporal variability of semidiurnal internal tides in the Bay of Bengal and Andaman Sea. Prog. Oceanogr. 2020, 189, 102444. [Google Scholar] [CrossRef]
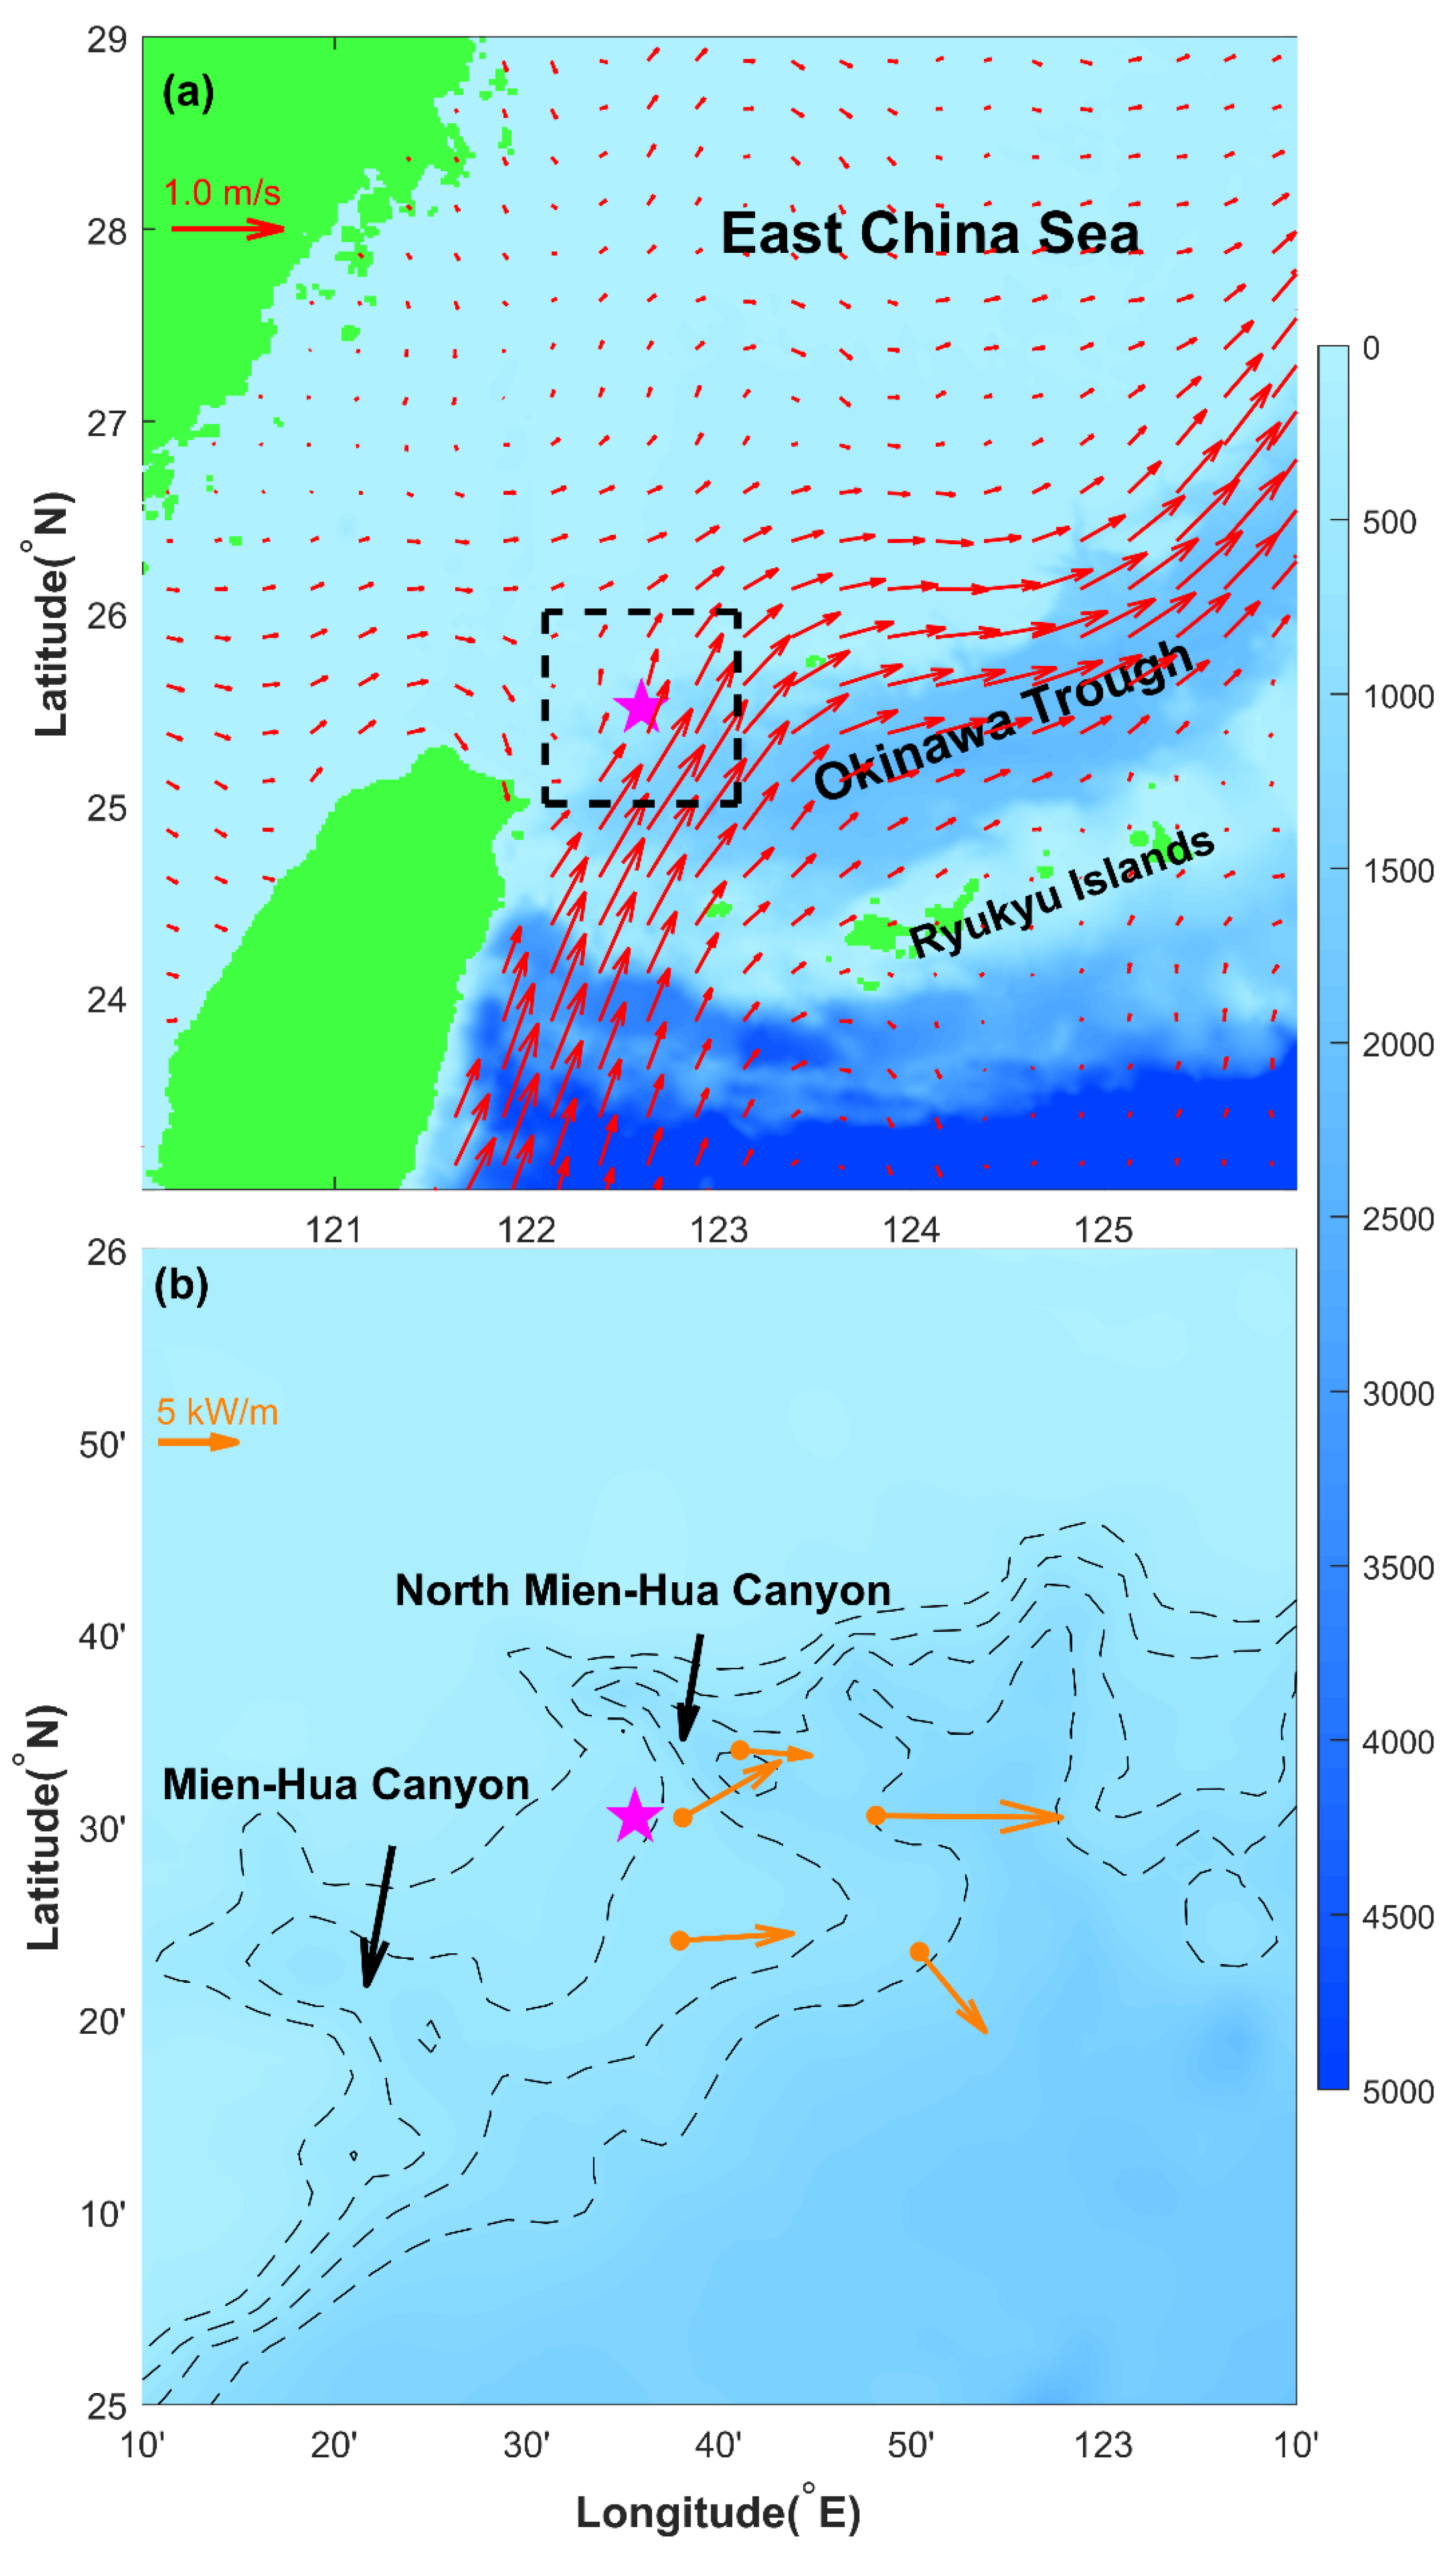
Figure 1. (a) Bathymetry of the southeastern East China Sea based on ETOPO-1 data. The red arrows denote the mean geostrophic current referenced to the period of 1993–2012 from the AVISO dataset. (b) Inset of the outlined square in (a) showing the location of the moored station (magenta pentagram) and the topography surrounding the moored station. The contours are 400 m, 600 m, 800 m, and 1000 m isobaths. The orange dots and arrows denote the observation stations and the observed M2 internal tidal energy flux from Lien et al. [23], respectively. The internal tidal energy flux is computed as F = u p , where u is the semidiurnal internal tidal velocity, p is the dynamic pressure perturbation associated with semidiurnal internal tides, and 〈 〉 represents time averaging. The scales of the geostrophic currents (1.0 m/s) and the energy flux (5 kW/m) are shown by the red and orange arrows, respectively, in the upper left area of (a,b).
Jmse 10 00104 g001
Figure 2. Variance-conserving plot of (a) rotary spectra of the barotropic currents, (b) depth-mean rotary spectra of the baroclinic currents, and (c) depth-frequency plot of the clockwise rotary spectra of the baroclinic currents. The blue solid and red dashed lines denote the counterclockwise (CCW) and clockwise (CW) components of the rotary spectra, respectively.
Jmse 10 00104 g002
Figure 3. Tidal current ellipses of the major baroclinic tidal constituents obtained from the harmonic analysis. Figure (ad) denote the M2, S2, O1 and K1 tidal constituent, respectively. The red ellipses denote clockwise rotation, and the blue ellipses denote counterclockwise rotation.
Jmse 10 00104 g003
Figure 4. Evolution of the depth-mean kinetic energy density of the (a) diurnal, (b) semidiurnal, (c) coherent diurnal, (d) coherent semidiurnal, (e) incoherent diurnal, and (f) incoherent semidiurnal ITs. The blue lines are the hourly kinetic energy density, and the orange lines are the 25-h averaged depth-mean kinetic energy density.
Jmse 10 00104 g004
Figure 5. Temporal mean coherent and incoherent kinetic energy density of (a) diurnal and (b) semidiurnal internal tides.
Jmse 10 00104 g005
Figure 6. (a) Along-isobath, (b) cross-isobath semidiurnal internal tidal currents and (c) low-pass filtered amplitude of semidiurnal internal tidal velocity from October to November in 2017. The low-pass filter has a cutoff frequency of 1/30 cpd.
Jmse 10 00104 g006
Figure 7. Vertical modes of the (a) semidiurnal ITs, (b) coherent semidiurnal ITs, and (c) incoherent semidiurnal ITs in October, and the vertical modes of the (d) semidiurnal ITs, (e) coherent semidiurnal ITs, and (f) incoherent semidiurnal ITs in November. The blue and orange lines represent the EOF1 and EOF2 of the along-isobath semidiurnal tidal currents, respectively, and the variance contributions of each EOF are denoted by the legends.
Jmse 10 00104 g007
Figure 8. Low-pass filtered (a) along-isobath and (b) cross-isobath background currents, (c) low-pass filtered depth-mean kinetic energy density of the semidiurnal ITs (blue line) and the upper 200 m averaged along-isobath (solid orange line) and cross-isobath (dashed orange line) background currents, and (d) the evolution of buoyancy frequency based on the HYCOM dataset. The low-pass filter has a cutoff frequency of 1/30 cpd.
Jmse 10 00104 g008
Figure 9. Monthly mean Absolute Dynamic Topography (color) and Geostrophic Currents (arrows) from June of 2017 to May of 2018 based on the AVISO dataset. The red pentagram denotes the location of the mooring.
Jmse 10 00104 g009
Publisher’s Note: MDPI stays neutral with regard to jurisdictional claims in published maps and institutional affiliations.