Article

Environmental and Economic Sustainability Assessment for Two Different Sprinkler and A Drip Irrigation Systems: A Case Study on Maize Cropping

1
Land Environment Resources and Health (LERH) PhD Programme, Territorio e Sistemi Agro-Forestali (TESAF) Department, Università degli studi di Padova, Viale dell’Università 16, 35020 Legnaro, Italy
2
Territorio e Sistemi Agro-Forestali (TESAF) Department, Università degli studi di Padova, Viale dell’Università 16, 35020 Legnaro, Italy
*
Author to whom correspondence should be addressed.
Agriculture 2019, 9(9), 187; https://doi.org/10.3390/agriculture9090187
Submission received: 25 July 2019 / Revised: 22 August 2019 / Accepted: 26 August 2019 / Published: 29 August 2019

Abstract

:
Water scarcity is worsened by climate change. Water savings can be reached by improving irrigation efficiency both on farm and on water supply. To do that, the choice of the best irrigation technology is not always straightforward, because farmers need to renew and implement farm infrastructures for irrigation. This study compares three irrigation systems, one drip irrigation and two sprinkler (center pivot and hose-reel) systems, on environmental, economic, and energetic performance under irrigated and non-irrigated maize cropping. The study combines impact and efficiency indicators, addressing a sustainability analysis for the irrigation practice under the three different irrigation systems. The sustainability for the irrigation systems was assessed using water-related indicators (water use efficiency, irrigation water use efficiency, and water footprint), biomass (crop growth rate, relative growth rate, harvest index, and yield response factor), and energy indicators (energy footprint, performance, and energy cost footprint) for the environmental aspect; and the economic-based indicators (water productivity and economic water footprint) for the economic aspect. Main results address the center pivot system as the best solution for irrigation practice since it demonstrated higher economic and environmental performance. Moreover, maize under the pivot system allowed a higher biomass production, economic benefits, and water use efficiency.

1. Introduction

The agricultural sector uses 70% of the global freshwater resource [1]. Although only 20% of global croplands is equipped for irrigation, 40% of global food production is attributable to irrigated lands [2]. Actually, 24% of the world river basin area suffers from severe water scarcity [3], and irrigation water use is in conflict with the ecological flows [4] in 15% of the global lands [5]. The economic welfare of a country is also linked with water depletion; in fact, water poverty increases following an increase of ecosystem degradation [6]. The use of irrigation water enhances crop production, which is usually correlated to higher economic benefits [6]. Hence, sustainable irrigation practice is a strategic enhancement to raise food production and enable the Earth system to operate within planetary boundaries [1,7]. A common opinion for increasing sustainability is given from the implementation of water saving irrigation technologies [8]. Although an increase of irrigation efficiency at the farm scale reduces water consumption at the farm scale, it fails to increase water availability at the watershed and basin scale [9], leading to the irrigation paradox exactly because of an increase of local beneficial water consumption due to a more efficient irrigation system. Moreover, previous non-consumed water losses at the farm scale are recovered and reused at the basin scale, and even more, the increase of irrigation efficiency at the farm scale might also increase the water consumption once the farm switches to more water-intense crops [10]. Therefore, sustainable implications of water use refer to integrated environmental preconditions while satisfying the societal demand [11]. In other words, a sort of “semi-sustainability” criterion needs to combine the best possible approach taken by human needs against the resulting environmental depletion [11]. In addition, the human interaction with the water cycle makes some unavoidable changes on water resources [11,12]. For that reason, decision-makers must make better decisions using appropriate tools to support policies and investments [13,14]. Thus, the sustainability of irrigation practice could be improved by governance with appropriate water policies [15]. Water policies enhance, for example, the use of water price and subsides to improve sustainable use of water resource [16,17]. As defined for the 6.4 Sustainable Development Goals target, water use indicators should analyze the inter-annual and intra-annual variability of water stress [18], and analyze changes in water management, integrating the several aspects of sustainability [19,20]. In fact, a core of indicators better analyze the overall sustainability [21,22]. Especially, the relation among biomass production, the economic productivity related to irrigation water, energy costs, and emissions on the environment permit one to fully understand the sustainability of water use [23,24], and was used in this case study to compare the different irrigation practices.
This study determines the agro-environmental and economic sustainability for supposed suitable irrigation systems, comparing two sprinkler irrigation (center pivot and hose-reel) systems and one drip irrigation system under maize cropping. This study focuses on different irrigation management, comparing irrigation systems and a non-irrigated test using several water-based indicators, analyzing the production of the biomass and yield and looking into their economic and energetic performance.

2. Materials and Methods

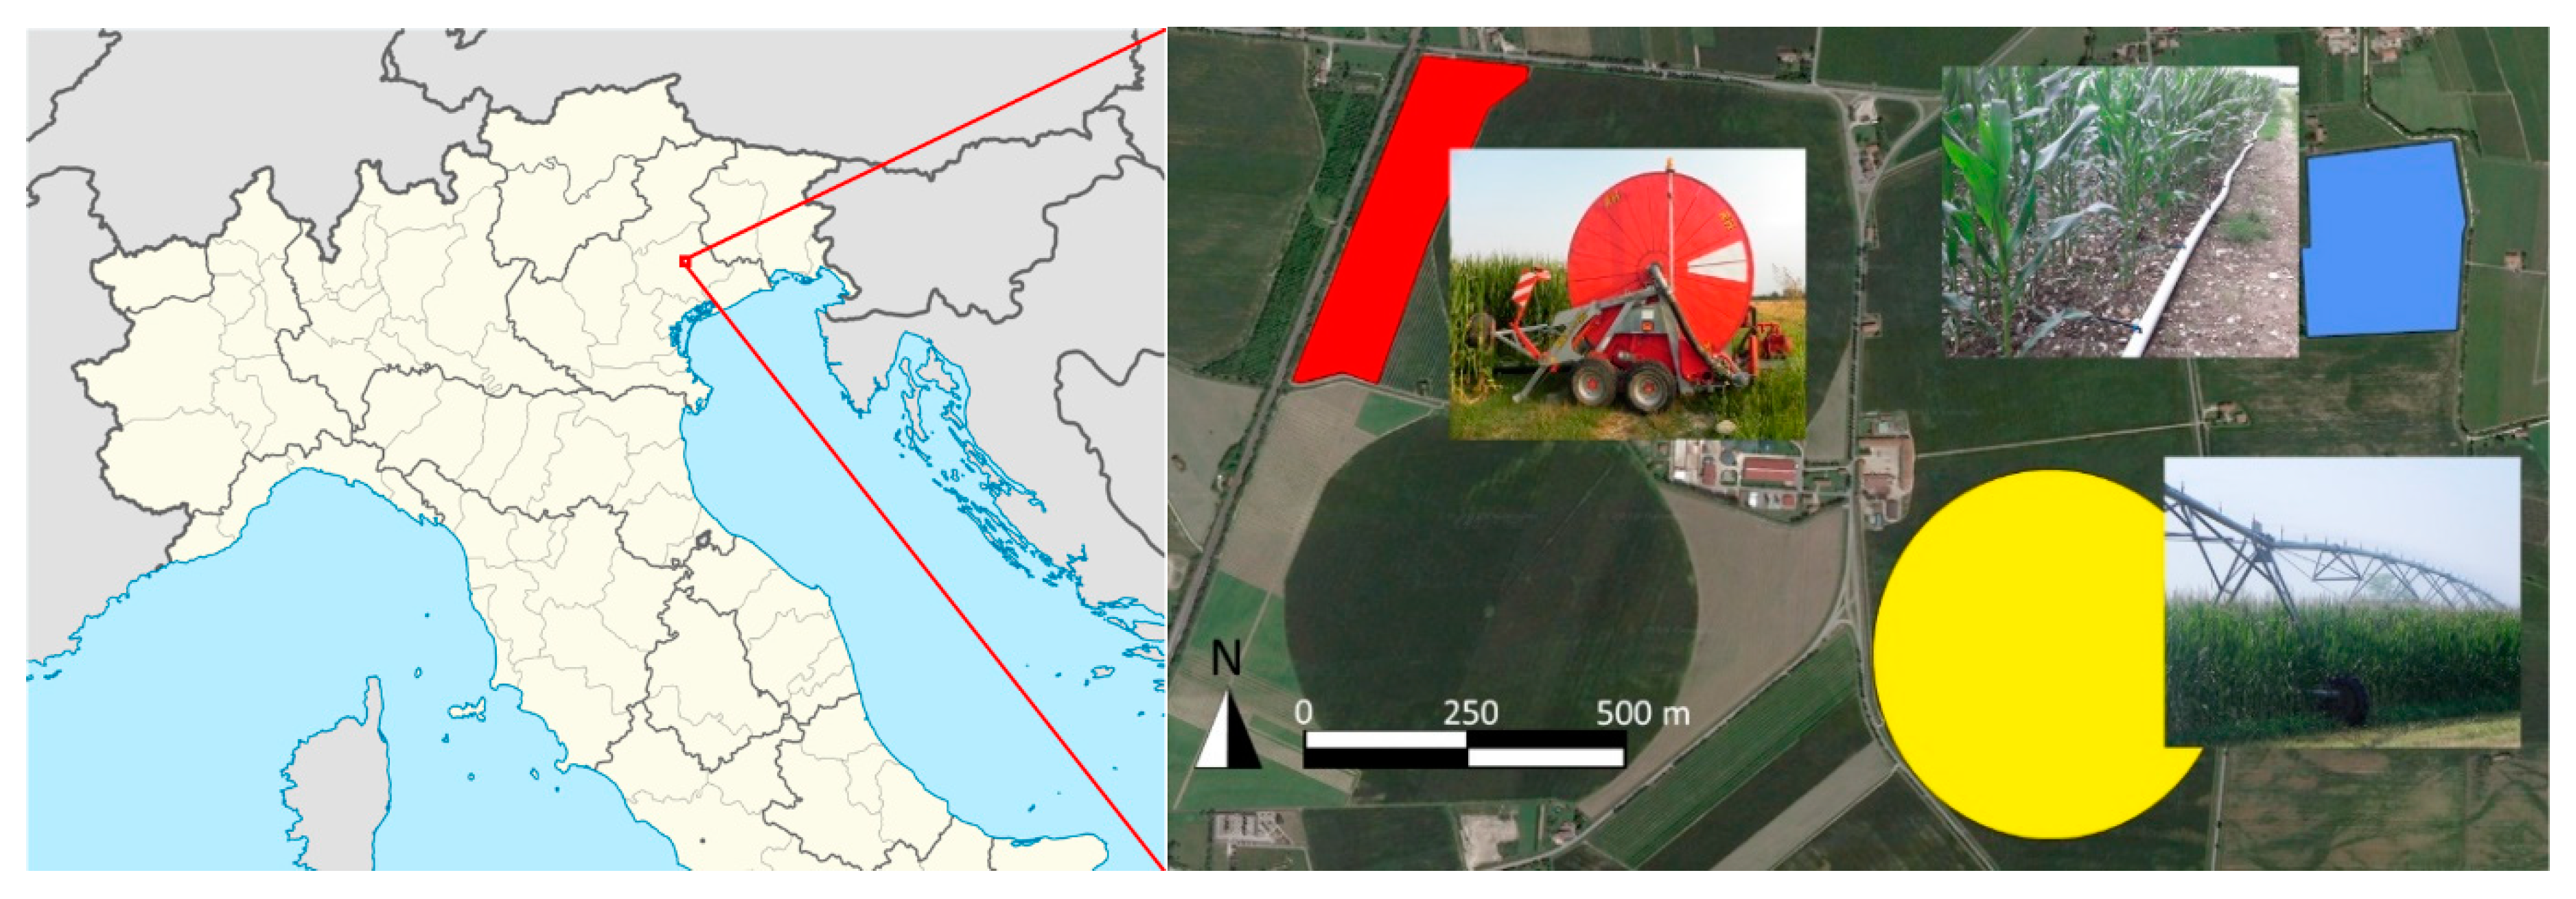
2.1. Study Area and Field Management
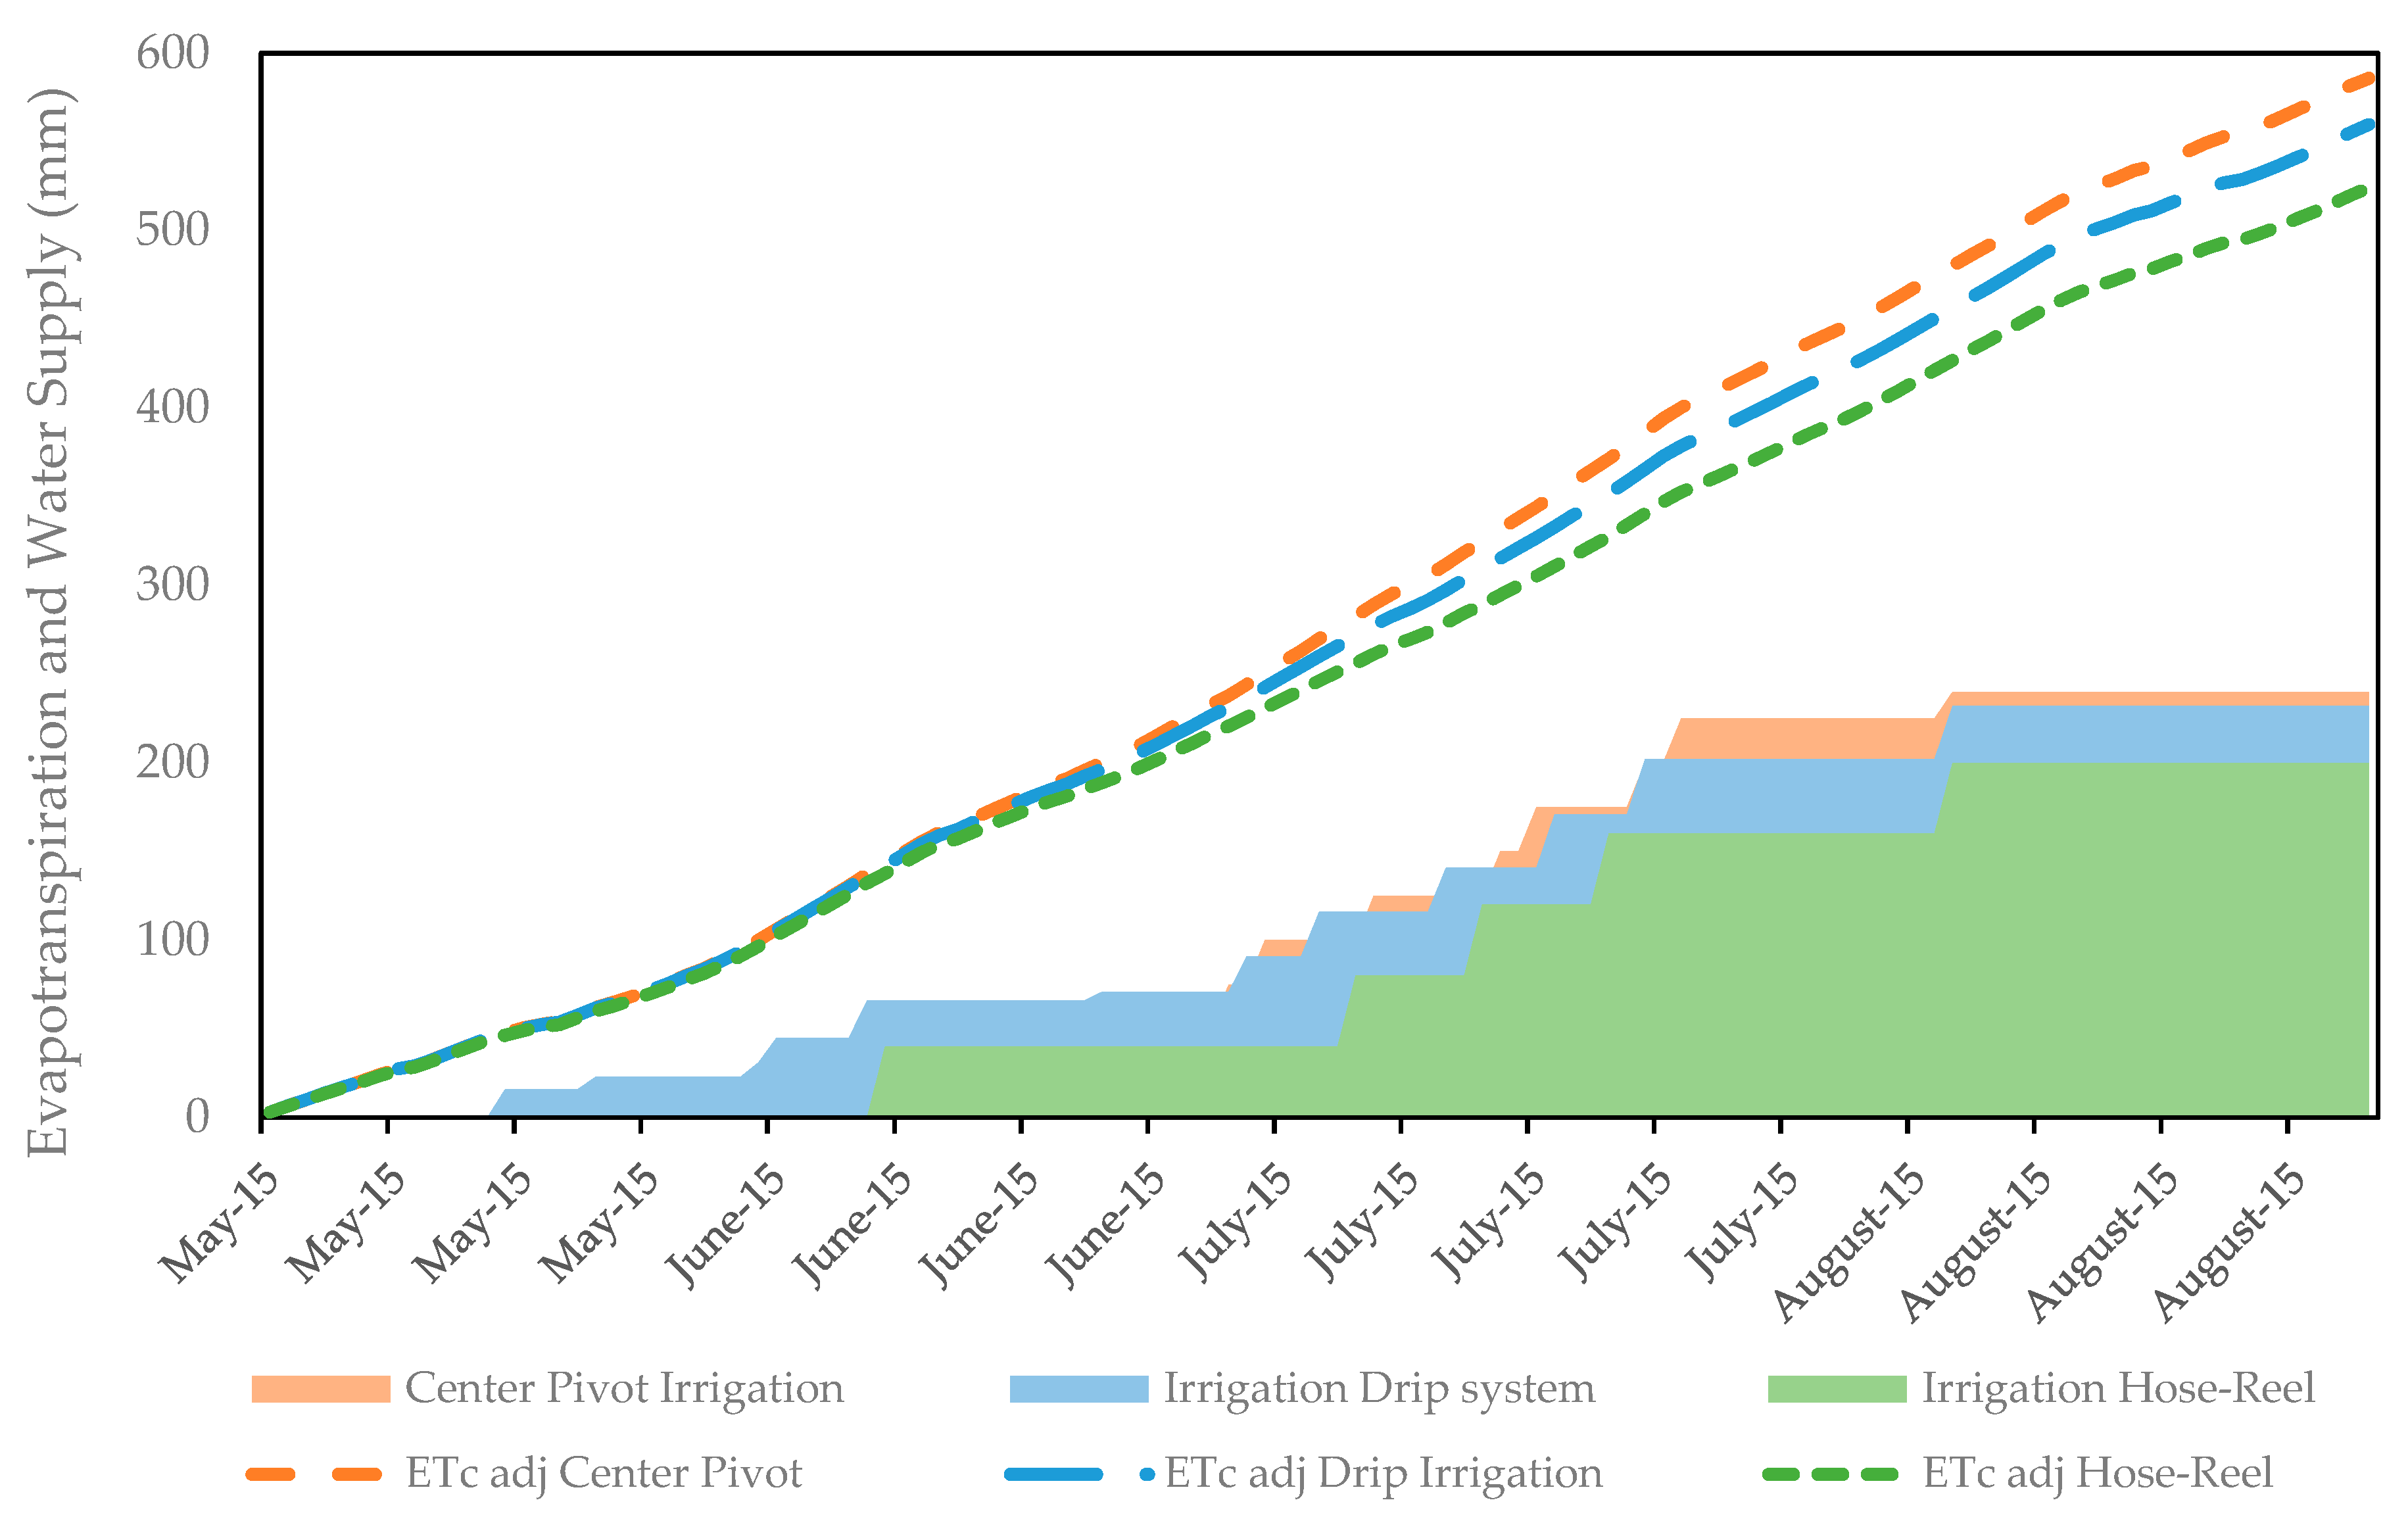
This study compared the management of three-irrigation systems during the maize cropping season. The study area was located in the high plain on the northeast of Italy (45°49′44.6″ N; 12°16′35.6″ E) (Figure 1) in proximity to rivers, the mountain area, and the coast. The area is characterized by a sub-continental climate with 1100 mm of annual rainfall, while during summer season, the area is characterized by warm temperatures and a high humidity.
Soil texture is silty–clay–loam textured (sand 12%, loam 61%, clay 27%). The area is characterized by the presence of 9% of gravel. The soil is sub-alkaline (pH 7.4) with a 2.2% organic matter and 1.3% of organic carbon. Soil nitrogen is about 1.37 g kg−1; usable phosphorous (P2O₅) is 55 ppm and potassium is 275 ppm of K2O.
Agronomical management has foreseen a 35 cm deep ploughing in autumn, after a fertilization with 50 t ha−1 of manure from biogas digestion. Prior to the seedbed preparation, a fertilization with 250 kg ha−1 of potassium chloride (KCl) and 200 kg ha−1 of calcium perphosphate Ca₃(PO₄)2 (P 46%) was applied in the fields. Maize was sown on the 20 of March in the pivot plot and on the 1 of April in the other plots at 7–8 plants m−2 density. A second fertilization with 500 kg ha−1 of urea N 46% (230 kg ha−1 of nitrogen) was applied during the maize growing season in both fields under sprinkler irrigation. In the microirrigation plot, on the other hand, a fertigation with urea was done five times during the early growing season. Maize was harvested on the 1 of September and maize yield was recorded to 11.5 tons ha−1 under the drip irrigation system, and to 10.3 and 9.7 tons ha−1 under center pivot and hose-reel systems, respectively, while the non-irrigated test performed 4.6 tons ha−1.

2.2. Irrigation

The irrigation timing was scheduled according to the Irrigation Board calendar compensating the evapotranspiration before water stress occurred. The irrigation season lasted from mid-May to mid-August. Rainfall and temperature data were recorded by a local weather station located in proximity of the farm. The non-irrigated test was located on each plot and kept willingly without water application for a total surface of 0.5 ha.
The three irrigation systems included two sprinklers and a microirrigation system (Figure 1). The sprinkler irrigation systems were a center pivot system and a hose-reel sprinkler. The microirrigation system was a drip line system located in an area of 10 ha. Water was firstly supplied from an irrigation channel, then pumped at a pressure of 1.5 bar by an electro pump of 37 kW and filtered by three automatic 120 mesh filters. The main line combined a 101.6 mm line that lay flat and a drip line with 22 mm of diameter. The drip line was characterized by drippers with a nominal flow rate 1.05 L h−1 at 0.8 bar pressure (water applied was 1.4 mm h−1) and spaced 0.5 m each other. The drip line was positioned 1.5 m apart or every two planting rows. The irrigation season counted 12 irrigations for a total of 232 mm of water volume.
The center pivot system was settled on an area of 40 ha. The pivot was 325 m long with a terminal section of 25 meters, with the sprinklers positioned every 3 meters. The pressure was 2.2 bar, with a flow rate of 47 L s−1. Water was pumped from the irrigation channel with an electro pump of 50 kW power. The irrigation volume was 25 mm each irrigation for a total of 10 irrigations and a cumulative irrigation volume of 240 mm (the last irrigation was 15 mm).
The hose-reel machine was settled in 10 ha. Water was pumped from the irrigation channel with a three-impeller motor pump with a 176 kW diesel engine. The pump pressure was 10 bar. The sprinkler gun had a flow rate of 35 L s−1 at 6–6.5 bar and about 70 m of radius of throw. Four irrigations were applied with a total irrigation volume of 200 mm during the whole irrigation season.

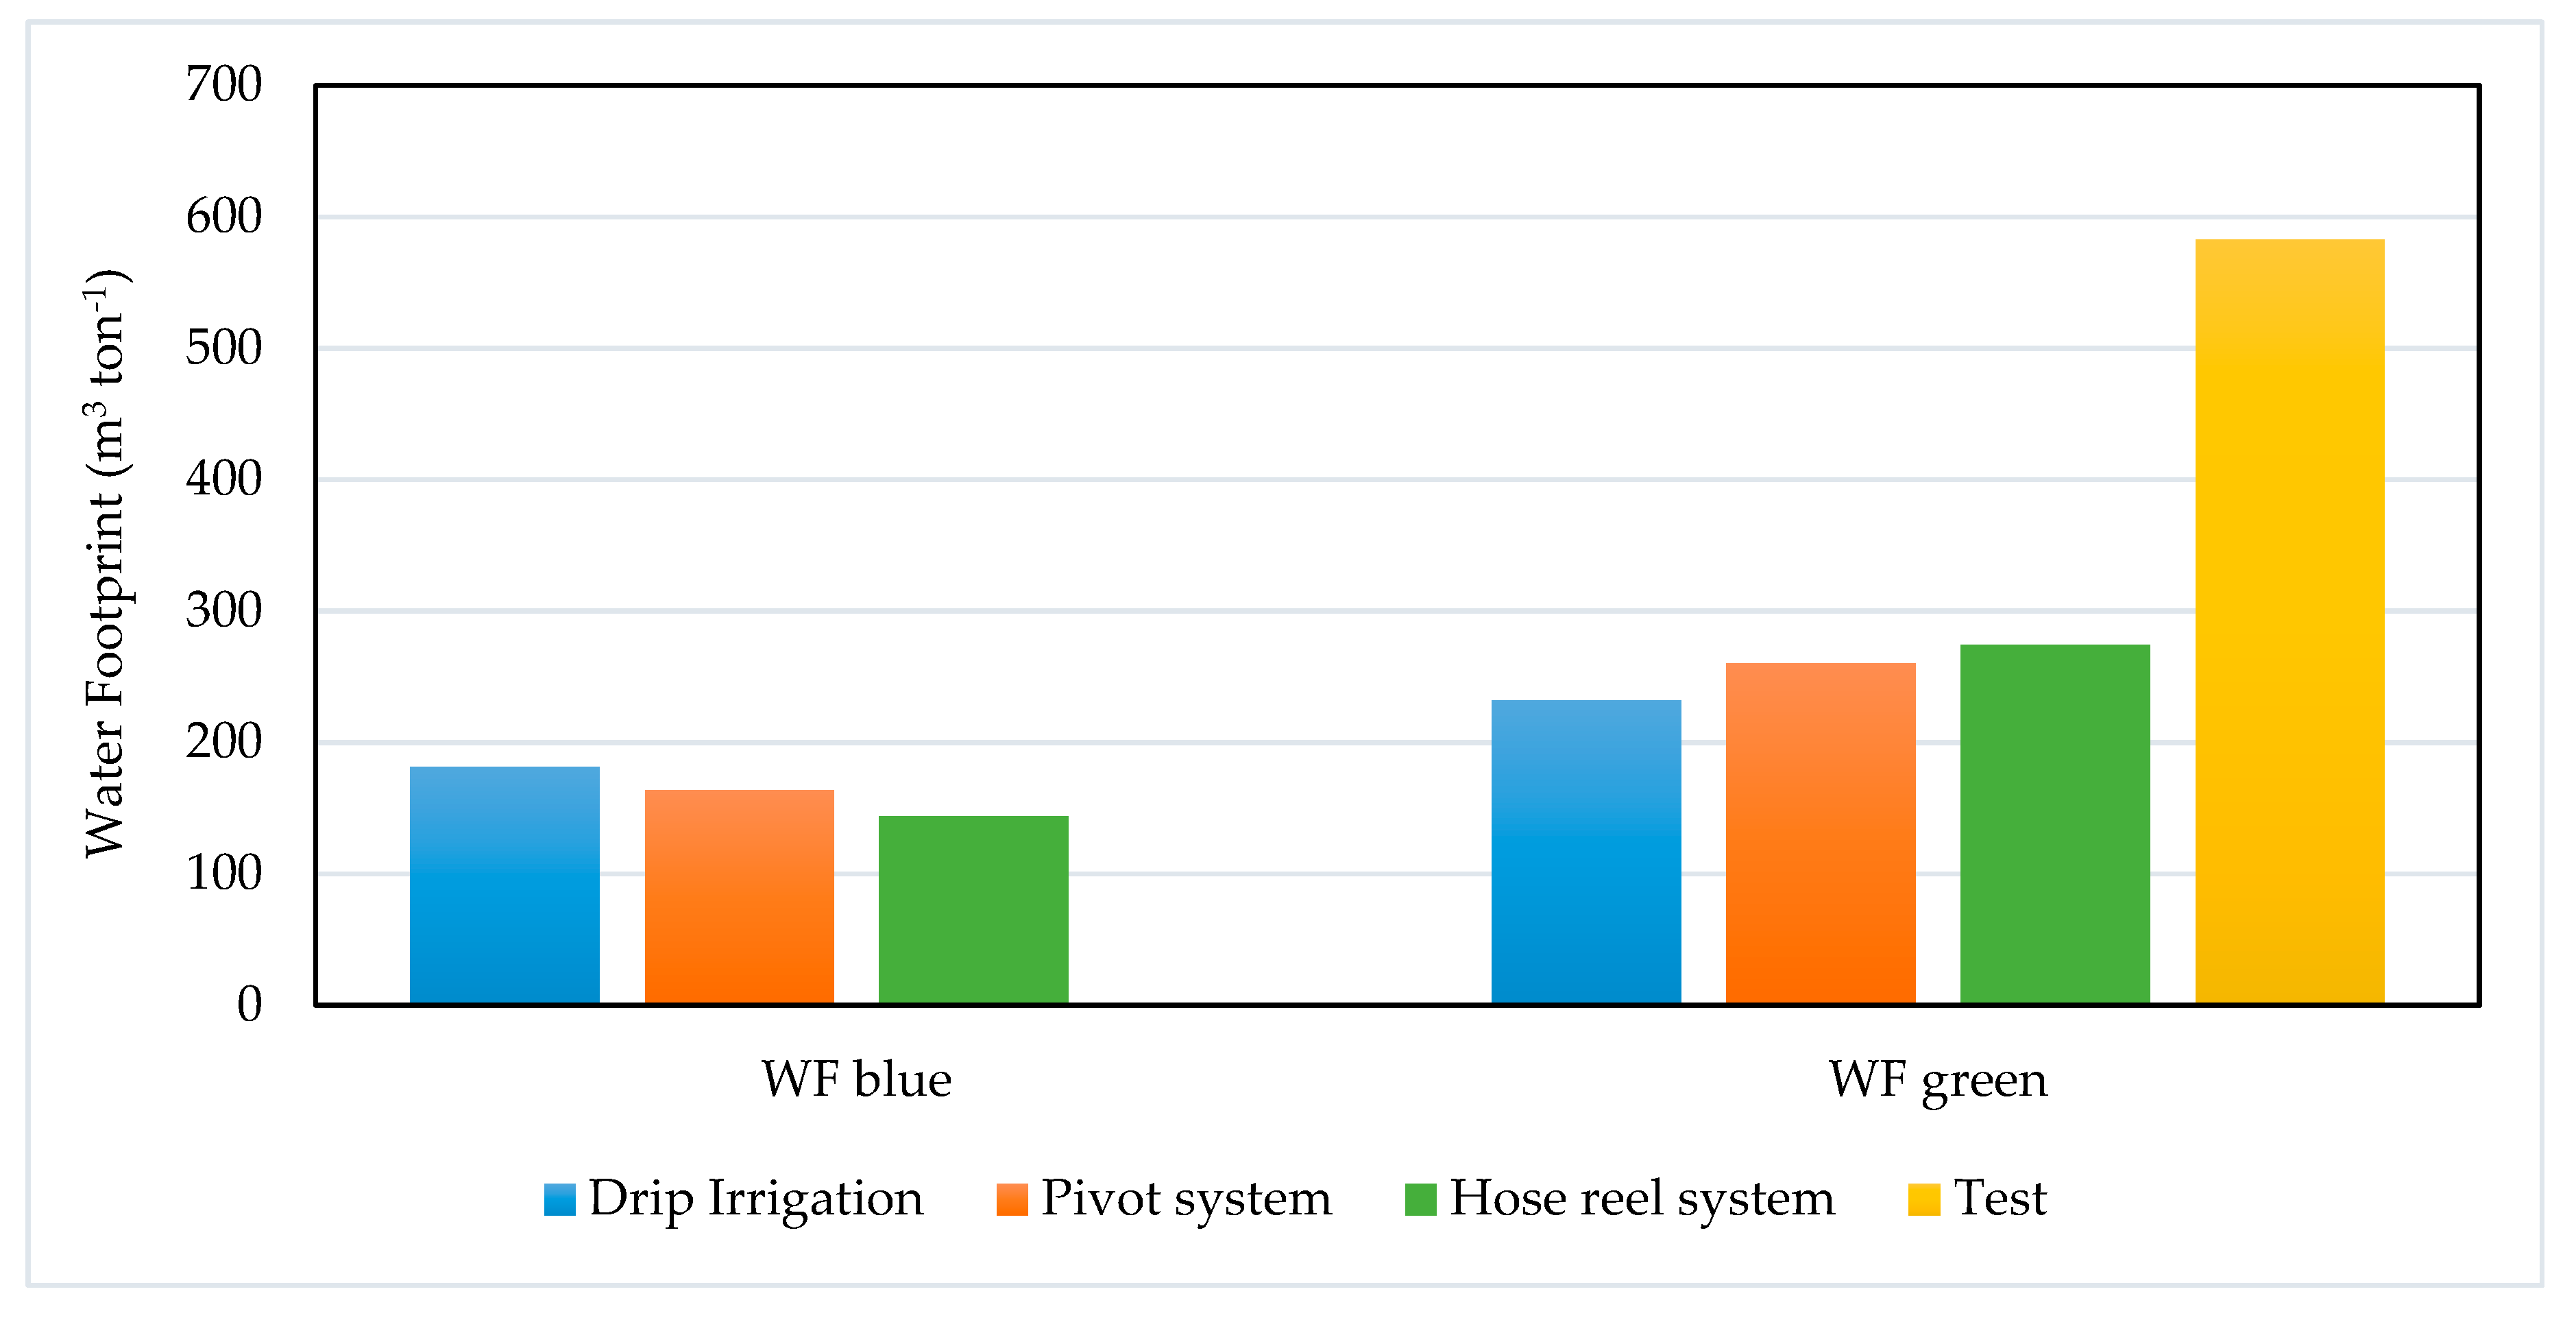
2.3. Water-Based Indicators

The environmental performance of the three irrigation systems was calculated applying the indicators of crop water use efficiency (WUE), the irrigation water use efficiency (IWUE) under the irrigation system, and the relative irrigation supply (RIS) indicator, while the impact on water resources was computed using the water footprint [25]. In order to calculate all those indicators of environmental performance, the crop water requirements were previously assessed. The adjusted crop evapotranspiration ( E T c   a d j ) was assessed on a daily basis according to FAO [26], multiplying the crop coefficient (kc) by E T 0 and by a water stress coefficient (ks) if a water deficit happened:
E T c   a d j =   E T 0 ×   k c × k s
The term “efficiency” can be associated with irrigation systems or can refer to water-use in a broader sense [9]. In this study, the indicator of water use efficiency (WUE) was calculated as the ratio between the yield biomass and the actual crop evapotranspiration in kg m−3 [27] for each irrigation system (i):
W U E i = B a , i E T c   a d j , i
where the actual maize biomass ( B a ) under a certain irrigation system i or the biomass produced on the non-irrigated test ( B t e s t ) is related to the adjusted crop evapotranspiration ( E T c   a d j ) for irrigated and the non-irrigated maize [28]. In addition, the irrigation water use efficiency (IWUE) was assessed. This indicator evaluates the marginal productivity per cubic meter of water provided by the irrigation. The IWUE (kg m−3) was calculated as following [29]:
I W U E i =   ( Y a Y t e s t ) I r
where Ya (kg ha−1) is the actual grain yield under irrigation, Ytest (kg ha−1) is the non-irrigated yield of the test in the field, and Ir (m3 ha−1) is the irrigation volume applied. IWUE corresponds to the increased production (in dry matter) in comparison to the non-irrigated sample yield in terms of the volume of water used for irrigation. Irrigation is one of the most important factors for increasing crop yield. In order to inform how the management of the irrigation systems during growing period matched the water requirements, the relative irrigation supply (RIS) indicator was assessed [30]:
R I S i = u g = 1 n I r 10   ·   ( E T c   a d j P e f f )
Basically, RIS evaluates if irrigation under an irrigation system i matches with the irrigation water deficit relating the ratio of irrigation water volumes over the difference between ETc adj and the effective rainfall (Peff). The RIS indicator shows the irrigation system’s performance, which is not merely the irrigation efficiency, but it indicates if supply meets the water requirement [31]. RIS values less than 1 indicate a deficit of water application, while larger values indicate a surplus.
In addition to the indicators of efficiency, the impact on water resource was calculated. The water footprint (WF) indicator measures the impact on water consumption in relation to the surface or the yield [32]. The study performed the WF by calculating the water consumption as the green water, which is the rainwater used by maize trough evapotranspiration [33,34], and the blue water, which is the irrigation volume applied to the plants [35]. The green and blue water are different crop water use over the crop growing season, which are calculated for each irrigation system i by the following [36,37,38]:
C W U g r e e n , i =   d = 1 l g p E T c   a d j , i
C W U b l u e , i = I r   ·   I e
The green crop water use (CWUgreen,i) represents the total rainwater evapotranspired from the planting day (day 1) to the day of harvest (lgp, length of growing period). The blue crop water use (CWUblue,i) represents the total irrigation water evapotranspired from the crop. The blue crop water use (CWUblue) estimated from Equation (6) considers the irrigation efficiency (Ie), which depends on the type of irrigation system used by the farmer: micro or drip irrigation is the most efficient system with a 0.9 coefficient, and sprinkler irrigation (center pivot and hose-reel system) with a 0.7 coefficient [39]. The WF is then calculated as the ratio between the CWU and the yield in terms of m3 ton−1 of dry matter or the surface in terms of m3 ha−1:
W F g r e e n i = C W U g r e e n , i Y   or   C W U g r e e n , i S u r f a c e
W F b l u e i =   C W U b l u e , i Y   or   C W U b l u e , i S u r f a c e

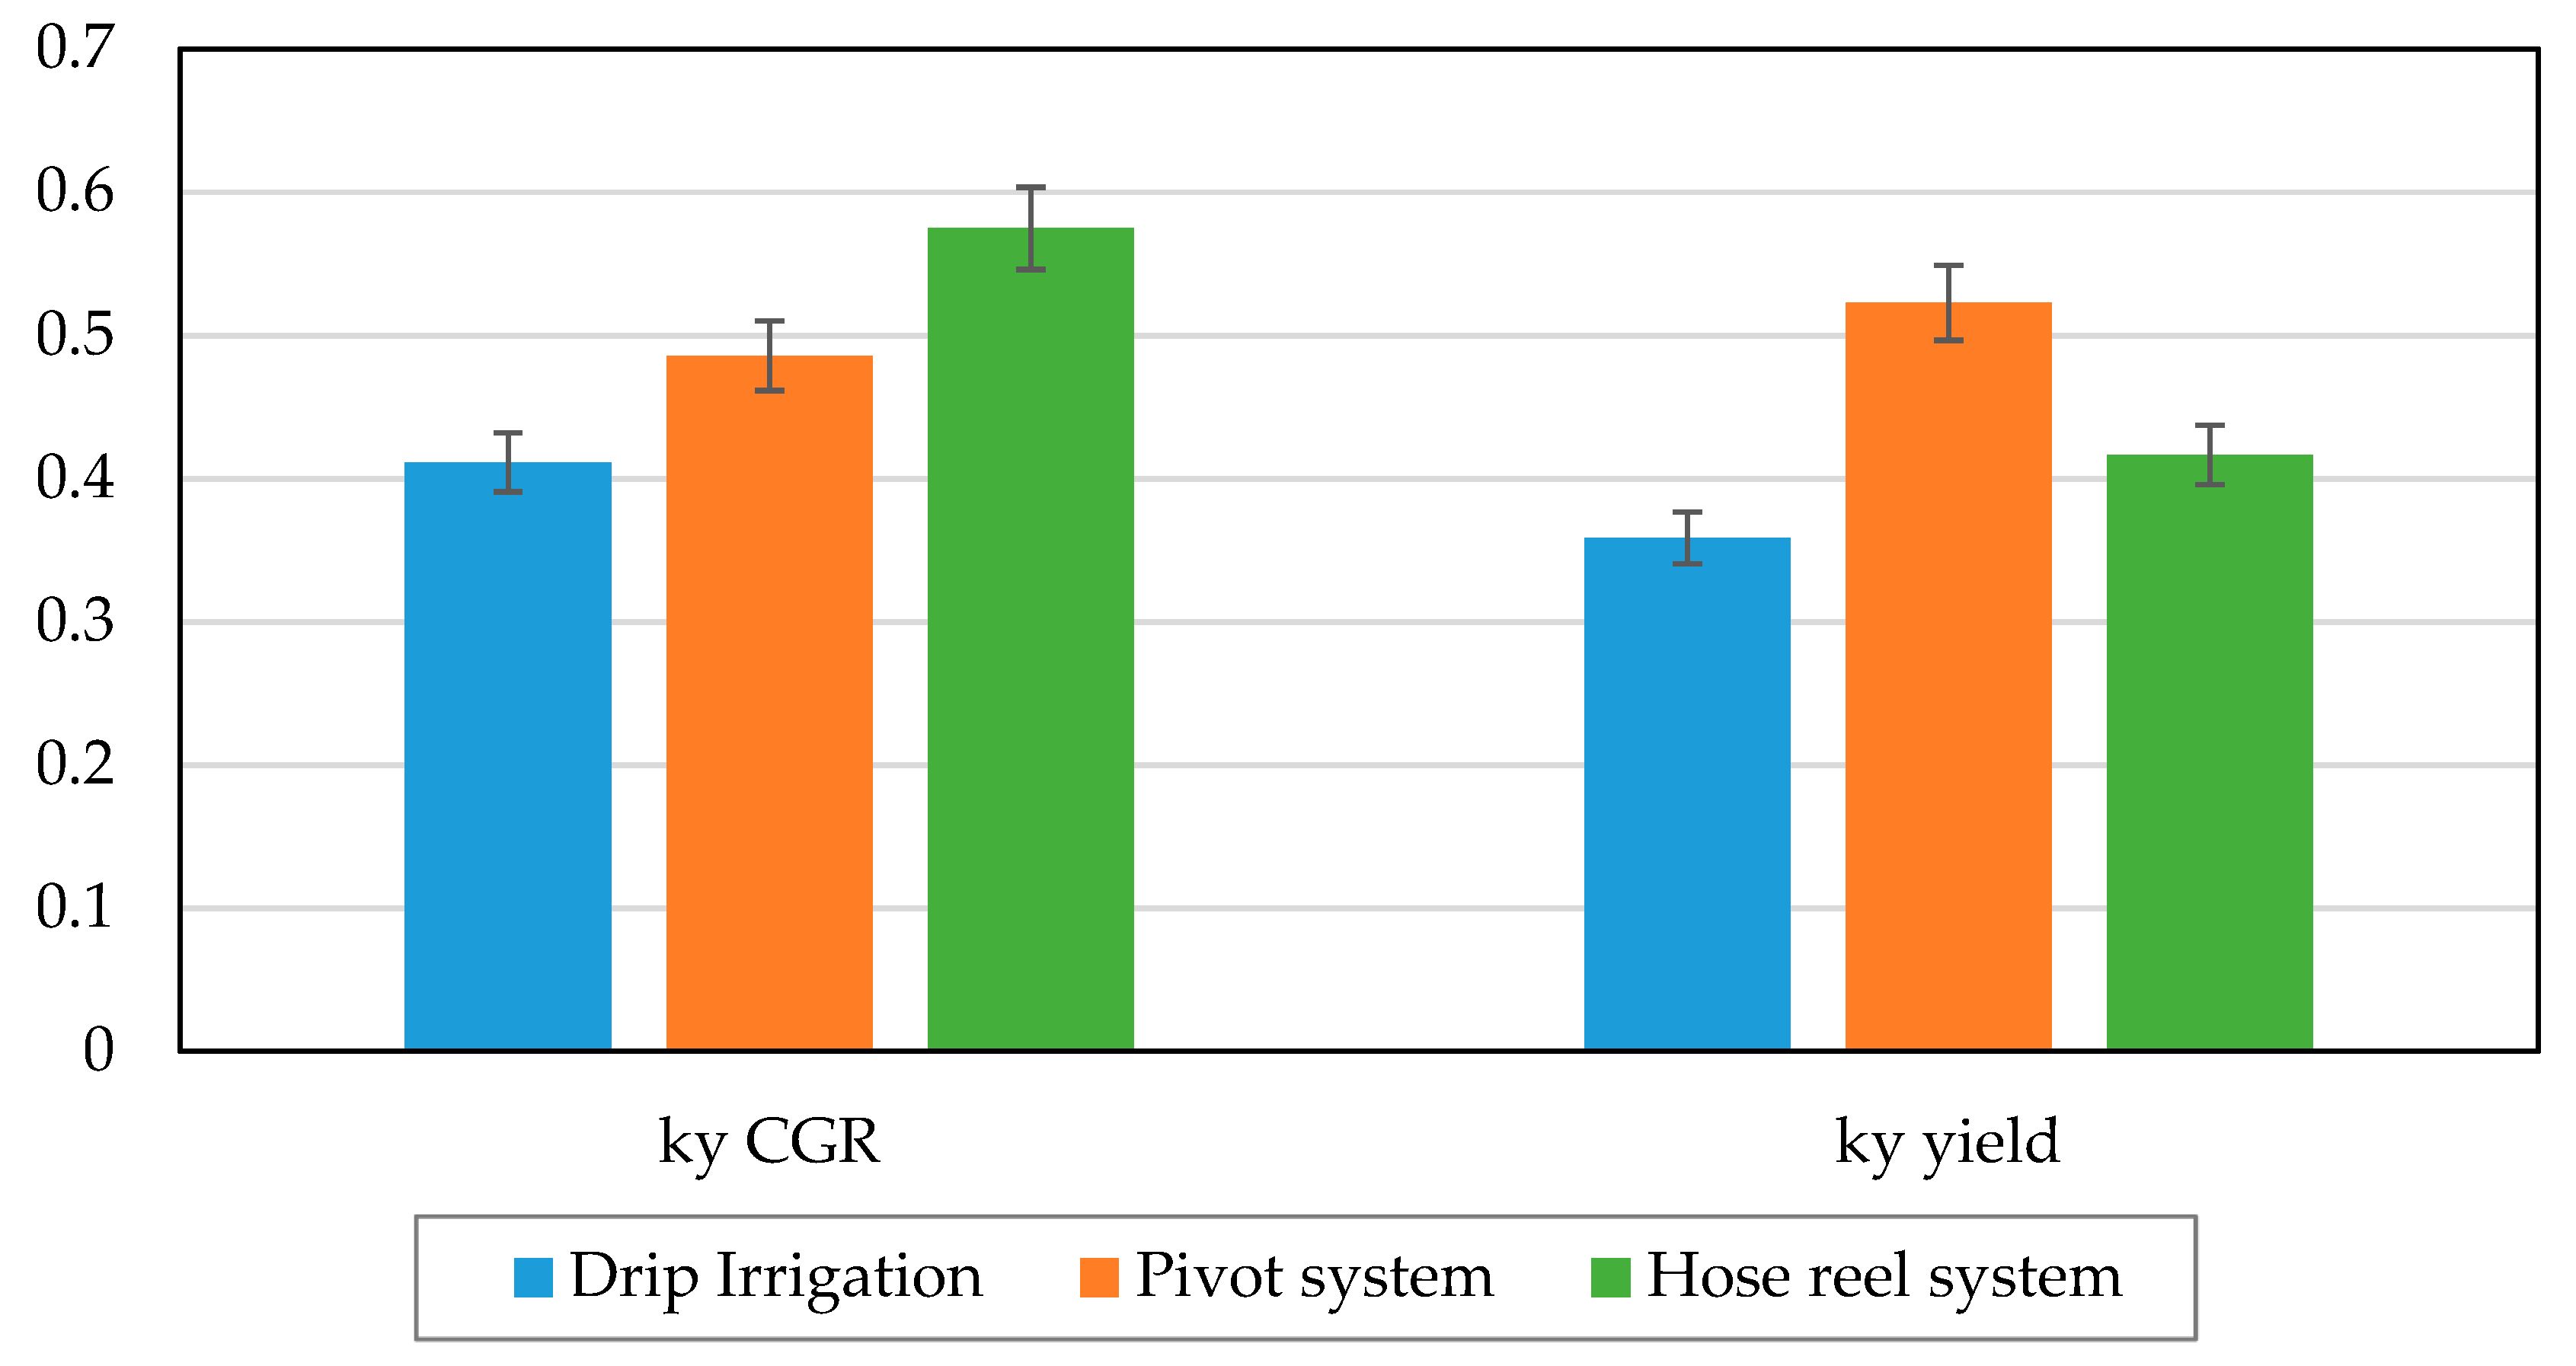
2.4. Biomass and Yield Analysis

The analysis of maize productivity concerns the field measurements of plant biomass and harvesting mass (yield). The crop growth was determined by the measure of the maize biomass in a two-step survey. The surveys collected maize plants for one square meter in six points of the field. The first biomass survey was done on the 22 of June during the stem elongation and pre-flowering phase, and the second was done on the 28 of July during the full ripening stage of maize grain. The surveys were done for all the fields, and both in the irrigated and in the non-irrigated areas. The aerial biomass was collected, then dried in an oven at 105 °C for 36 hours, and finally weighed. A statistical analysis was implemented to observe the repeatability of the survey using the standard deviation from the mean of samples. The biomass was used to analyze different indicators related to the crop growing rate and productivity. The crop growth rate (CGR) is the absolute amount of biomass that increases in a certain period, and it was assessed by the equation [40]:
C G R i = B i o m a s s t 2 B i o m a s s t 1 t i m e
where the mass increase (g day−1) is calculated as the difference of the biomass measured at the second survey ( B i o m a s s t 2 ) minus the biomass measured at the first survey ( B i o m a s s t 1 ) by the interval time (days). The biomass measured for the CGR in Equation (9) considers both the total biomass in a first step and the grain production as the ear growing rate. Furthermore, an additional indicator of crop increase biomass is the relative growing rate (RGR), which is the efficiency of growth with respect to mass [40,41]:
R G R i =   l n B i o m a s s   ( t 2 )   l n B i o m a s s   ( t 1 ) t i m e
The yield data collection was implemented with a field survey on the 28th of August collecting grain samples (ears) in 8 points corresponding to 1 m2 with a replication both on the irrigated and non-irrigated area and during harvesting on the 2nd of September, with a harvester machine recording the yield. The yield performance was analyzed through the index of crop productivity in terms of tons ha−1 of dry matter. Then, the harvest index (HI) was assessed, computing the ratio between the yield and the total biomass collected during the hard dough phase:
H I =   C o r n   m a s s T o t a l   b i o m a s s
An additional indicator useful to analyze the crop response to yield is the crop yield response factor to water ( k y ), which is the ratio between the relative evapotranspiration decrement and the relative yield decrement [42]. The coefficient is useful to analyze how crop can be tolerant to water stress according to different irrigation treatments i. The yield response factor was assessed according to the following [43]:
k y , i = ( E T i r E T t e s t ) E T i r ( Y a Y t e s t ) Y a
where the E T i r   ( mm ) is the adjusted crop evapotranspiration within irrigation, and E T t e s t (mm) is the adjusted crop evapotranspiration of the non-irrigated test. Accordingly, Y a is the crop yield within irrigation, and Y t e s t is the yield of the non-irrigated test. In a second step, k y was calculated substituting the yield with the CGR to implement a further analysis of the yield response factor.

2.5. Economic Balance and Related Indexes of Performance

The comparison of the economic benefit of irrigation between the three-irrigation systems concerned the analysis of the gross marketable output and the costs. The gross marketable output was performed multiplying the yield (at 14% humidity) by the corn price on trademark established to 172 € ton−1. The corn price referred to the price of the Bologna trademark on a national hybrid corn during the 2015 season. The net income was expressed as the gross income minus the irrigation costs (fixed and variable). Table 1 lists the total gross income, the inventory of expenditures (total irrigation costs), and the net income for the three irrigation systems.
Costs were divided into costs for labor and maintenance, costs for energy, costs for purchasing the equipment, and costs of linear depreciation (amortization). The cost of labor was 15 € h−1, which was the average among permanent and temporary jobs. It considered energetic costs for gasoline (0.65 € L−1) and electricity (0.18 € kWh−1) and the price of new machines for the amortization value (higher cost of investment for sprinkler systems) depreciated over their obsolescence time period (10, 15, and 20 years for drip, hose-reel, and center pivot, respectively). The water price was intentionally not mentioned, because it was considered negligible, since it refers to merely the service cost of water supply by the water board, which is fixed, not volumetric, and computed based on the benefit of growing on irrigated or non-irrigated land.
The economic sustainability analysis considered the indicator of “water productivity” (€ m−3), that is, the ratio between the difference of the net income between the irrigated ( Net   income i r ) and non-irrigated maize ( Net   income t e s t ) and the volume of water used for irrigation:
W a t e r   p r o d u c t i v i t y =   Net   income i r   (   ha 1 ) Net   income t e s t   (   ha 1 ) I r   ( m 3 ha 1 )
The water productivity highlighted the positive expected return of irrigation from an economic point of view. The volumetric impact on water resource is given by the ratio of the WF blue or green (m3 ha−1) and the marginal economic benefit from irrigation (€ ha−1):
e c o n o m i c   W F g r e e n = WF g r e e n   ( m 3   ha 1 ) Net   income i r   (   ha 1 ) Net   income t e s t   (   ha 1 )
e c o n o m i c   W F b l u e = CWU b l u e   ( m 3   ha 1 ) Net   income i r   (   ha 1 ) Net   income t e s t   (   ha 1 )
The blue and green WF have a different cost of opportunity and they need to be compared with the marginal net income for a full understanding of their economic performance.

2.6. Energetic Balance and Related Indexes

The irrigation systems were compared in terms of their energetic consumption and greenhouse gas (GHG) emissions. The energetic analysis considered the type of energy used for pumping water and irrigation itself (Table 2). The energy consumption referred to a unit of irrigated surface.
Energy consumption is the product of the electricity or the diesel consumed per hectare by the number of irrigations. Thereby, the conversion factor was used for electricity (1 kWh = 3.6 MJ) and diesel (1 L = 42.7 MJ). The energetic costs were assessed as the product of the energy consumption and the unit cost [44]. The energy-related indicators are described by the impact of energy consumption per unit of irrigation water consumed:
E n e r g e t i c   F o o t p r i n t = CWU b l u e E n e r g y   c o n s u m p t i o n
Similarly, the energetic cost footprint is calculated as followed:
E n e r g e t i c   C o s t   F o o t p r i n t = I r E n e r g y   c o s t
The energetic performance is evaluated as the ratio between the energy consumption and the GHG emission with the blue water consumption [45]:
E n e r g e t i c   P e r f o r m a n c e =   E n e r g y   c o n t e n t   ( MJ   h a 1 ) G H G   ( kg   C O 2 eq   h a 1 ) CWU b l u e   ( m 3   h a 1 )
The energy content is the energetic nutritional content in maize production, where 1 kg of maize contains 14.75 MJ [46]. The GHG emissions were implemented using the characterization factor of diesel (1 L diesel corresponds to 0.544 kg CO2−eq) and electricity (1 kWh electricity medium voltage at Italian level corresponds to 0.534 kg CO2−eq) for carbon footprint provided from the Ecoinvent 3.3 database (Ecoinvent, Zurich, Switzerland).

3. Results and Discussion

3.1. Water Based Indicators

The crop season was characterized by 300 mm of rainfall. Maize had a different evapotranspiration according to the plant vigor under the different irrigation systems plots. The cumulative water supply from rainfall and irrigation was 534 mm for drip irrigation, 542 mm for the center pivot system, and 502 mm for the hose-reel system (Figure 2). The ETc adj of maize for the entire season was 560 mm under the drip irrigation, 586 mm under the center pivot, and 524 mm under the hose-reel system.
During the growing season, the maize under the center pivot gained a greater water supply than all the other irrigation systems. The water supplied with irrigation and rainfall met the crop water requirement all the time. In drip irrigation, the irrigation met the crop water requirement with no water stress, while in the maize plot under the hose-reel system, the maize suffered from water stress only in the last period during the phase of corn ripening (Figure 2).
The WUE shows the efficiency of water consumption and biomass production, which is related with the crop growing stage (Table 3). The WUE was determined in two different periods of the growing season during which time there were slight differences between irrigated and non-irrigated tests visible when looking on the WUE from the 22 of June to the 28 of June (Table 3). It is curious to note how the non-irrigated test had a higher WUE (1.317 kg m−3) than the hose-reel system (0.972 kg m−3), although the lower evapotranspiration and biomass production of the test. This might be explained by the fact that the non-irrigated test benefitted from the rainfall water supply at the begin of the season and suffered later from the water stress, while the difference with a lower WUE within the hose-reel system might be due to other factors of loss beside irrigation (diseases). The difference in WUE started with the late season, where drip irrigation (1.875 kg m−3) and center pivot systems (2.04 kg m−3) reached higher values.
In addition, the IWUE was higher in drip irrigation (2.981 kg m−3) and hose-reel irrigation systems (2.58 kg m−3), which meant that the productivity obtained from a unit of water supplied with the practice of irrigation provided a better response than with the center pivot (2.37 kg m−3). This was true because the hose-reel system furnished a lower amount of water with the irrigation, and drip irrigation gained a better performance combining irrigation volume and crop yield. The RIS was very similar over the three irrigation systems and it stood between 0.75 for the center pivot and 0.79 for drip irrigation. In other words, drip irrigation expressed better the efficiency on supplying water compared to the other irrigation systems because of its superior management.
The WUE and the IWUE are two indicators that have similar metric, but they are conceptually different. According to the Sustainable Development Goals, a sustainable irrigation practice can produce more food with less water. In this sense, drip irrigation is the one that results in a greater ear production to the detriment of a lower total biomass production per m3.
In addition, the impact on the water resource from water consumption is expressed as the blue and green water footprint. Figure 3 expresses blue WF and green WF as the water consumed over the edible biomass produced. The blue WF was lower under the hose-reel system with 144 m3 ton−1. The reason is due to the lower irrigation volume applied, while drip irrigation and center pivot presented a blue WF of 182 m3 ton−1 and 164 m3 ton−1, respectively. In addition, the green WF under the hose-reel system gained the higher value of 274 m3 ton−1, and only 232 m3 ton−1 and 260 m3 ton−1 for drip irrigation and center pivot, respectively (Figure 3). In addition, the green WF of the non-irrigated test had the greatest value of 583 m3 ton−1.

3.2. Indicator for Biomass and Yield Evaluation

The crop yield registered during the harvesting stage was higher in the center pivot with 11.5 tons ha−1, followed by maize under drip irrigation system with 10.3 tons ha−1 and hose-reel with 9.7 tons ha−1. The biomass was measured in two phenological stages (BBCH-scale [47]): end of stem elongation (BBCH 39) and ripening-early dough (BBCH 83). The HI measures the relation between the harvest product and the biomass produced under the related irrigation system, which was higher (0.533) for the hose-reel irrigation machine (Table 4). Center pivot shows a relatively low HI (0.478) due to the higher biomass production, while the rain-fed (non-irrigated test) has the lowest HI in relation with the lowest yield production (0.416). Table 4 reports both the CGR that shows the difference in maize vigor under the different irrigation systems, and the RGR that determines the mass productivity and the efficiency of growth from the end stage of stem elongation to the early dough of corn kernels (Table 4).
The CGR was different between irrigation systems if we consider the total biomass, where the center pivot had the greater value of 15.9 g day−1 (Table 4). Moreover, looking to the CGR for the edible part of corn, the drip irrigation system had the greater value (21.5 g day−1). The maize growing speed was described by the RGR indicator (g g−1 day−1), which was higher under the center pivot in terms of total biomass (0.033 g g−1 day−1), and greater under the hose-reel in terms of ear production (0.033 g g−1 day−1). The RGR under drip irrigation showed that this type of system allows one to reduce water stress and plants can grow at the same rate both for the edible part of the corn ear and for the vegetal part of steam and leaves. A further indicator of biomass productivity and crop performance is the dimensionless crop yield response factor (ky). This indicator helps to understand the contribution of irrigation on crop productivity and the occurrence of a potential water deficit. As seen in Figure 4, different maize conditions under different irrigation management showed also that the yield response factor was greater within the center pivot system due to the higher evapotranspiration in relation to the yield. This is different if the biomass productivity is considered; the ky CGR describes a different trend of the crop response on biomass production in relation with irrigation. The hose-reel irrigator machine has the higher value of 0.57 in comparison with the drip irrigation that gains a value of 0.41. A general definition of ky factor defines that the higher the value is, the more sensible is the crop to water deficit. Figure 4 shows how ky might change between different irrigation practices looking either to the biomass or to the grains production. In Figure 4, the error bars are added to describe the standard deviation from between the irrigated plots and the rain-fed test.

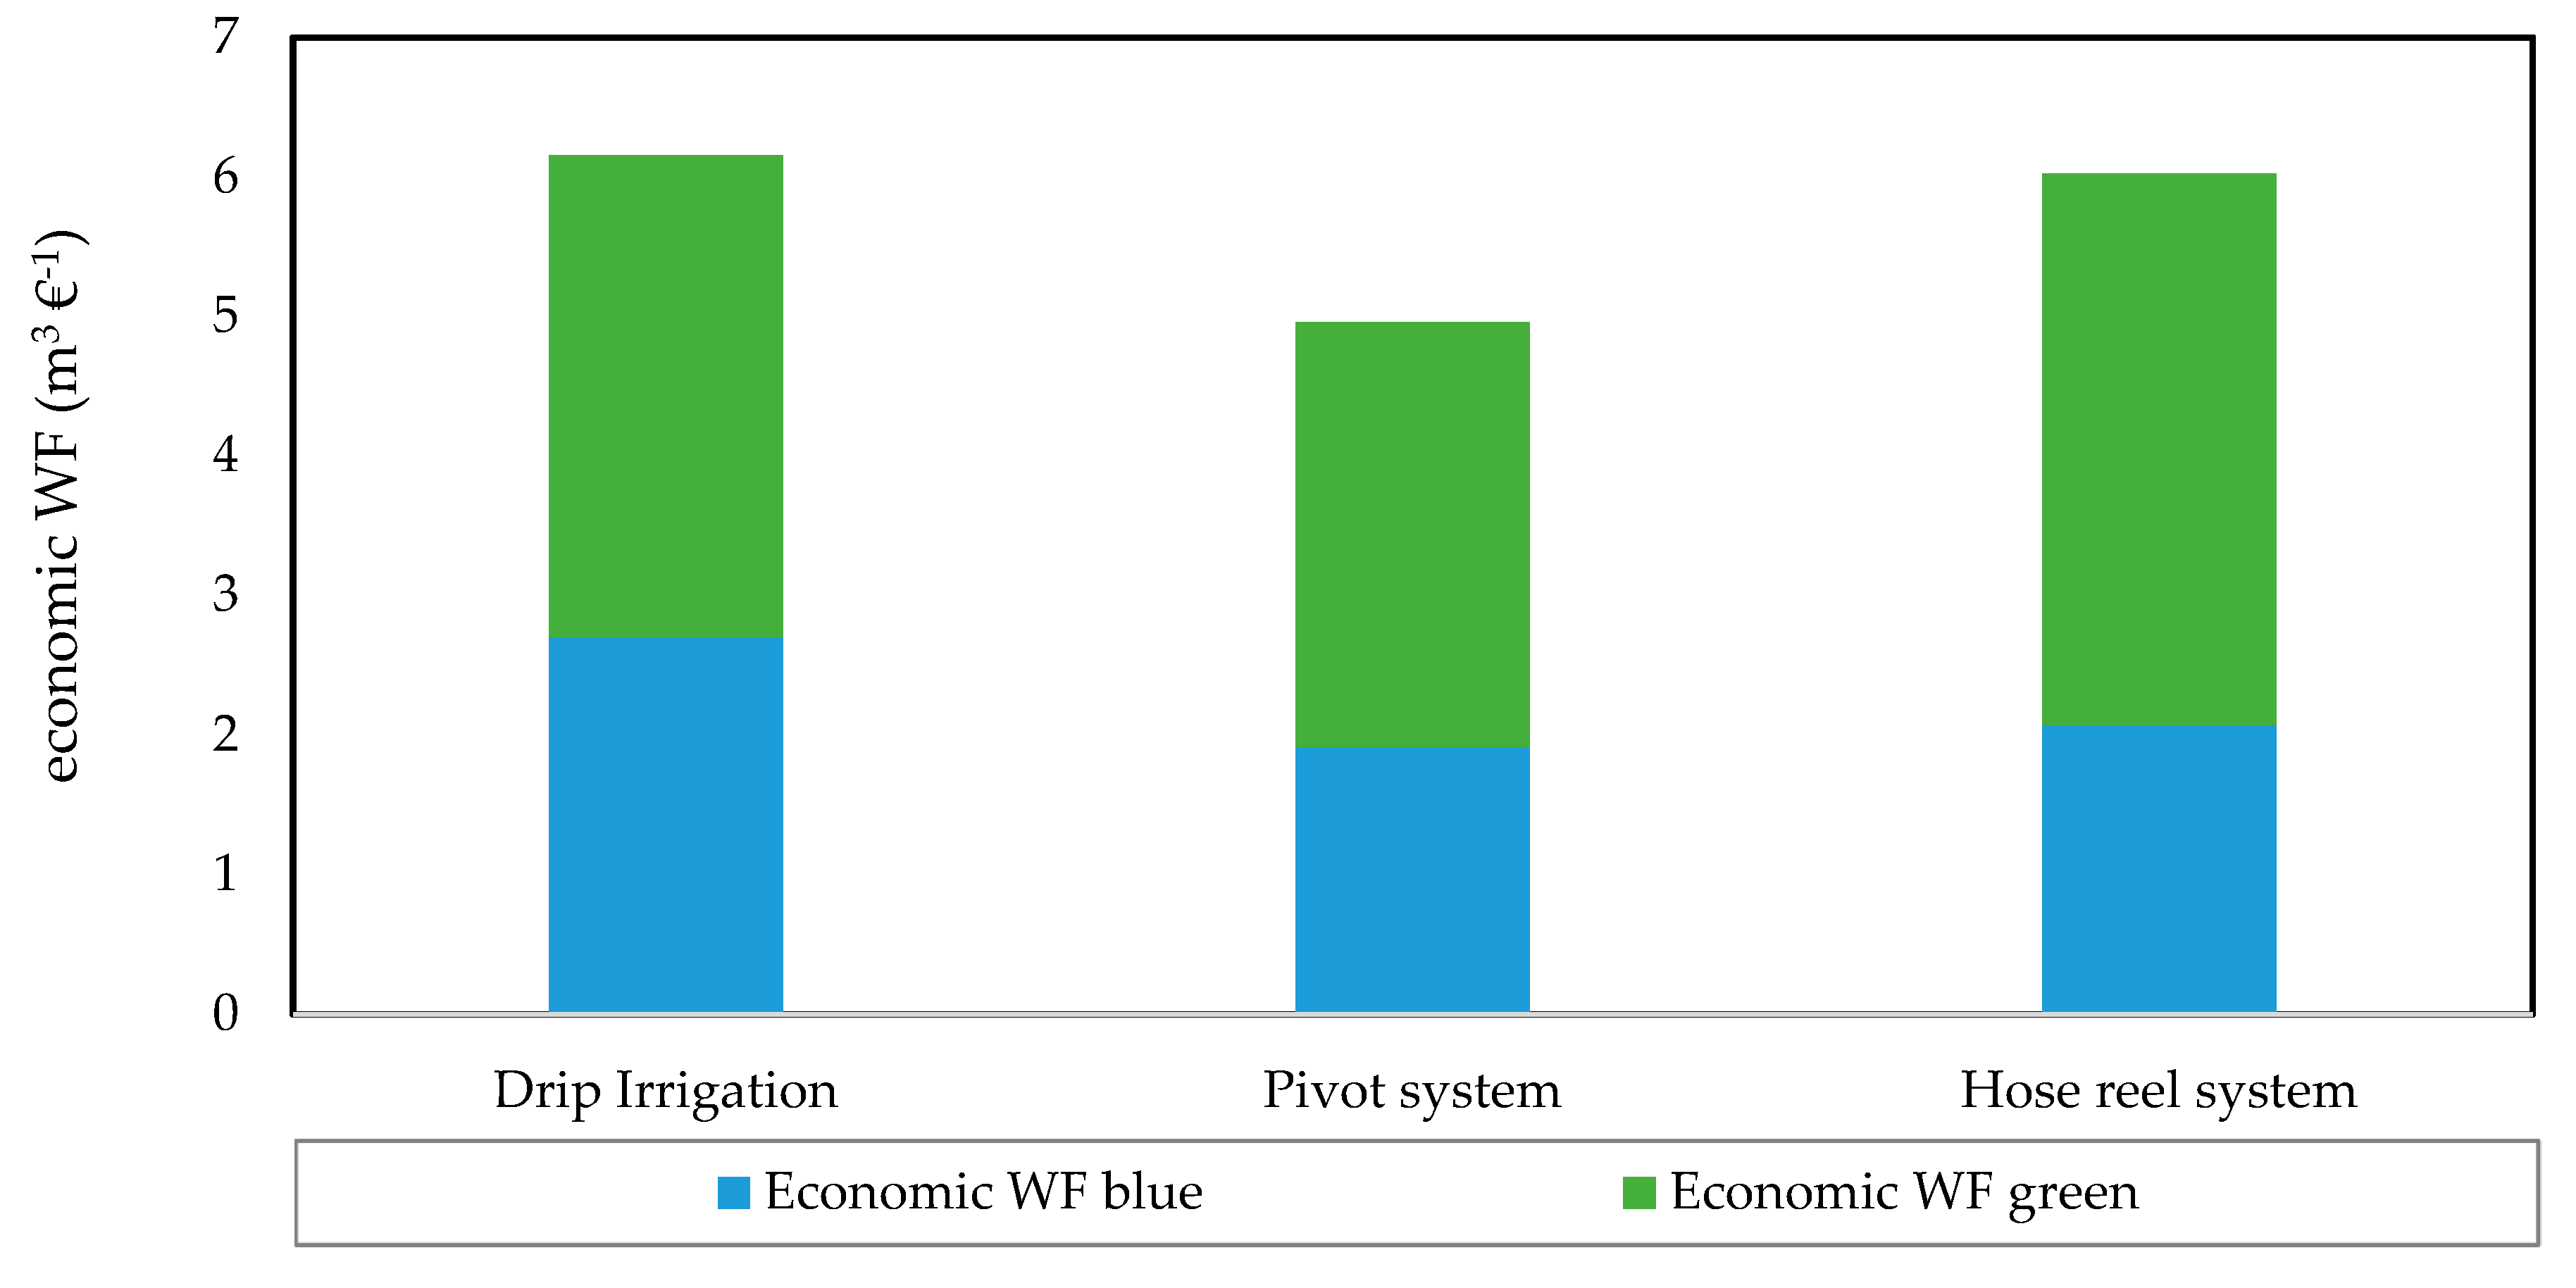
3.3. Economic Indicators

The economic aspect of sustainability of irrigation systems deals with the use of the indicator of water productivity and the economic water footprint. The water productivity is the economic benefit of an additional unit of water. Looking to the water productivity, the greater value was observed for center pivot (0.37 € m−3), which presented a higher irrigation volume in relation with a higher net income by 12% and 8% than drip irrigation (0.33 € m−3) and hose-reel machine (0.34 € m−3), respectively. Figure 5 shows the relation between the water consumed to produce a unit of income explained by the economic water footprint (WF) of different irrigation systems. In fact, blue and green water use had different opportunity costs. This was especially more evident under the hose-reel system where a lower economic WF blue (2.07 m3−1) corresponding to a higher economic WF green (3.95 m3−1). The center pivot machine gained a great water productivity and the lowest impact on water resource with 1.91 m3−1 and 3.04 m3−1 for WF blue and WF green, respectively. In this paper, a general consideration was needed when looking to economic indicators, because a small variation in the market price can vary consistently the gross marketable income, and in the meantime could tip the economic balance in favor of one or another irrigation system due to the high weight of this economic component compared to the rest of the balance.

3.4. Energetic Indicators

The energy consumption for irrigation purposes involves GHG emissions related to the electricity and diesel consumption for the engine pumping water. GHG emissions held from drip irrigation correspond to 308 kg CO2−eq ha−1, while they decreased to 26 kg CO2−eq ha−1 if looking to the single irrigation. The total GHG emissions for the center pivot and hose-reel systems were 294 and 143 kg CO2−eq ha−1, respectively. Those values changed when we considered the GHG emissions of the single irrigation of 29.4 kg CO2−eq ha−1 for center pivot and 28.5 kg CO2−eq ha−1 in the case of the hose-reel system (Table 5). The energetic footprint shows the water consumption per unit of energy consumed per irrigation. Drip irrigation gained a greater value (1 m3 MJ−1), while the center pivot consumed 0.85 m3 per MJ consumed, and the hose-reel spent 0.12 m3 MJ−1. The energetic cost footprint is the water consumption supplied with irrigation per unit of energy cost. The center pivot was the more efficient system in terms of water supplied per unit of cost of energy spent (24.2 m3−1). Drip irrigation and hose-reel systems showed an energetic cost footprint of 22.3 m3−1 and 11.7 m3−1, respectively (Table 5). Differently, the energy performances are given from the relation between the ratio of energy content in maize, the GHG emissions, and the blue WF. The hose-reel system showed the greater value of energy performance with 0.35 MJ m3 kgCO2−eq−1. Drip irrigation and center pivot showed a lower value of 0.21 MJ m3 kgCO2−eq−1 and 0.15 MJ m3 kgCO2−eq−1, respectively. Energy indicators related to environmental impact for the different irrigation systems studied allowed us to understand energy performance, the environmental impact from the energetic point of view, and in relation to water consumption.

4. Conclusions

This study provides different environmental indicators suited to analyze the sustainability of different irrigation systems. The study includes indicators of water balance, economic balance, and energetic analysis. Those indicators help users to detect the most performant irrigation system from environmental, energetic, and economic points of view. The main results indicate the center pivot system has generally higher performance among the irrigation systems in this case study. In fact, the CGR, RGR, and ky gained a better response under the center pivot. At the same time, indicators related to the economic balance showed that the center pivot was the better irrigation system with higher water productivity and lower economic water footprint. Indicators related to water balance generally performed better under drip irrigation. However, the hose-reel system supplied a lower amount of water (lower WF blue), while the center pivot had a better WUE but a worse IWUE. Finally, drip irrigation showed better performance on IWUE and RIS, and with a lower WF green. Looking to the energetic performance, there is no clear picture of the best performant irrigation system. However, drip irrigation gained a higher energetic footprint, while the center pivot had a higher energetic cost footprint, and the hose-reel system showed a better energetic performance. Comparing the overall contribution on the environmental sustainability, the center pivot system combines good performance and presents an overall good solution for irrigation sustainability, especially from an economic point of view.
This study enhances the choice of the most appropriate irrigation system held under maize cropping. Further analysis under different crops must be implemented. In fact, the three systems are not always alternatives. For example, a pivot is not feasible on very small plots or on irregularly shaped plots; drip is not applicable to pasture crops (if crops rotate), while sprinkler systems may be; and hose-reel is inefficient in very windy areas. Investment in irrigation should consider crop succession throughout the year. Moreover, a one-year study was carried out; a sensitive analysis should be implemented to analysis what variable might affect the choice of the users to a suitable sustainable irrigation system. Besides that, the use of the correct irrigation system needs to combine a proper irrigation water management to take advantage of its performance.

Author Ccontributions

Conceptualization, E.B., F.M. and L.B.; Data curation, E.B. and M.M.; Formal analysis, E.B.; Funding acquisition, F.M.; Investigation, E.B. and M.M.; Methodology, E.B.; Project administration, L.B.; Resources, F.M. and L.B.; Supervision, F.M. and L.B.; Validation, L.B.; Writing—original draft, E.B.; Writing—review and editing, F.M. and L.B.

Funding

The research has been supported by the Ph.D. grant provided by Fondazione Cassa di Risparmio di Padova e Rovigo (CARIPARO).

Conflicts of Interest

The authors declare no conflict of interest.

References

  1. Rockström, J.; Williams, J.; Daily, G.; Noble, A.; Matthews, N.; Gordon, L.; Wetterstrand, H.; DeClerck, F.; Shah, M.; Steduto, P.; et al. Sustainable intensification of agriculture for human prosperity and global sustainability. Ambio 2017, 46, 4–17. [Google Scholar] [CrossRef]
  2. Chartzoulakis, K.; Bertaki, M. Sustainable Water Management in Agriculture under Climate Change. Agric. Agric. Sci. Procedia 2015, 4, 88–98. [Google Scholar] [CrossRef] [Green Version]
  3. Alcamo, J.; Döll, P.; Henrichs, T.; Kaspar, F.; Lehner, B.; Rösch, T.; Siebert, S. Global estimates of water withdrawals and availability under current and future “business-as-usual” conditions. Hydrol. Sci. J. 2003, 48, 339–348. [Google Scholar] [CrossRef]
  4. Directorate-General for Environment. Ecological Flows in the Implementation of the Water Framework Directive: Guidance Document N°31; European Commission: Bruxelles, Belgium, 2016; ISBN 978-92-79-45758-6. [Google Scholar]
  5. Smakhtin, V.; Revenga, C.; Döll, P. A pilot global assessment of environmental water requirements and scarcity. Water Int. 2004, 29, 307–317. [Google Scholar] [CrossRef]
  6. Sullivan, C. Calculating a Water Poverty Index. World Dev. 2002, 30, 1195–1210. [Google Scholar] [CrossRef]
  7. Rosa, L.; Rulli, M.C.; Davis, K.F.; Chiarelli, D.D.; Passera, C.; D’Odorico, P. Closing the yield gap while ensuring water sustainability. Environ. Res. Lett. 2018, 13, 104002. [Google Scholar] [CrossRef] [Green Version]
  8. D’Odorico, P.; Davis, K.F.; Rosa, L.; Carr, J.A.; Chiarelli, D.; Dell’Angelo, J.; Gephart, J.; MacDonald, G.K.; Seekell, D.A.; Suweis, S.; et al. The Global Food-Energy-Water Nexus. Rev. Geophys. 2018, 56, 456–531. [Google Scholar] [CrossRef]
  9. Unver, O.; Bhaduri, A.; Hoogeveen, J. Water-use efficiency and productivity improvements towards a sustainable pathway for meeting future water demand. Water Secur. 2017, 1, 21–27. [Google Scholar] [CrossRef]
  10. Grafton, R.Q.Q.; William, J.; Perry, C.J.J.; Molle, F.; Ringler, C.; Steduto, P.; Udall, B.; Wheeler, S.A.A.; Wang, Y.; Garrick, D.; et al. The paradox of irrigation efficiency. Science 2018, 361, 748–750. [Google Scholar] [CrossRef] [Green Version]
  11. Falkenmark, M. Society’s interaction with the water cycle: A conceptual framework for a more holistic approach. Hydrol. Sci. J. 1997, 42, 451–466. [Google Scholar] [CrossRef]
  12. Tuninetti, M.; Tamea, S.; Dalin, C. Water Debt Indicator Reveals Where Agricultural Water Use Exceeds Sustainable Levels. Water Resour. Res. 2019, 55, 2464–2477. [Google Scholar] [CrossRef] [Green Version]
  13. Borsato, E.; Galindo, A.; Tarolli, P.; Sartori, L.; Marinello, F. Evaluation of the grey water footprint comparing the indirect effects of different agricultural practices. Sustainability 2018, 10, 3992. [Google Scholar] [CrossRef]
  14. Mejía, A.; Hubner, M.N.; Sánchez, E.R.; Doria, M. Water and Sustainability: A Review of Targets, Tools and Regional Cases; UNESCO: Paris, France, 2012; ISBN 9789230010942. [Google Scholar]
  15. Gómez-Limón, J.A.; Riesgo, L. Alternative approaches to the construction of a composite indicator of agricultural sustainability: An application to irrigated agriculture in the Duero basin in Spain. J. Environ. Manag. 2009, 90, 3345–3362. [Google Scholar] [CrossRef] [PubMed]
  16. Bubb, R.; Kaur, S.; Mullainathan, S. Barriers to contracting in village economies: A test for enforcement constraints. Unpublished work. 2016. [Google Scholar]
  17. Pellegrini, E.; Bortolini, L.; Defrancesco, E. Coordination and Participation Boards under the European Water Framework Directive: Different approaches used in some EU countries. Water 2019, 11, 833. [Google Scholar] [CrossRef]
  18. Vanham, D.; Hoekstra, A.Y.; Wada, Y.; Bouraoui, F.; de Roo, A.; Mekonnen, M.M.; van de Bund, W.J.; Batelaan, O.; Pavelic, P.; Bastiaanssen, W.G.M.; et al. Physical water scarcity metrics for monitoring progress towards SDG target 6.4: An evaluation of indicator 6.4.2 “Level of water stress”. Sci. Total Environ. 2018, 613–614, 218–232. [Google Scholar] [CrossRef] [PubMed]
  19. Chaves, H.M.L.; Alipaz, S. An integrated indicator based on basin hydrology, environment, life, and policy: The watershed sustainability index. Water Resour. Manag. 2007, 21, 883–895. [Google Scholar] [CrossRef]
  20. Galli, A.; Wiedmann, T.; Ercin, E.; Knoblauch, D.; Ewing, B.; Giljum, S. Integrating Ecological, Carbon and Water footprint into a “footprint Family” of indicators: Definition and role in tracking human pressure on the planet. Ecol. Indic. 2012, 16, 100–112. [Google Scholar] [CrossRef]
  21. Čuček, L.; Klemeš, J.J.; Kravanja, Z. A review of footprint analysis tools for monitoring impacts on sustainability. J. Clean. Prod. 2012, 34, 9–20. [Google Scholar] [CrossRef]
  22. Rennings, K.; Wiggering, H. Steps towards indicators of sustainable development: Linking economic and ecological concepts. Ecol. Econ. 1997, 20, 25–36. [Google Scholar] [CrossRef]
  23. Galindo, A.; Collado-González, J.; Griñán, I.; Corell, M.; Centeno, A.; Martín-Palomo, M.J.; Girón, I.F.; Rodríguez, P.; Cruz, Z.N.; Memmi, H.; et al. Deficit irrigation and emerging fruit crops as a strategy to save water in Mediterranean semiarid agrosystems. Agric. Water Manag. 2018, 202, 311–324. [Google Scholar] [CrossRef]
  24. Herva, M.; Franco, A.; Carrasco, E.F.; Roca, E. Review of corporate environmental indicators. J. Clean. Prod. 2011, 19, 1687–1699. [Google Scholar] [CrossRef] [Green Version]
  25. Marino, G.; Zaccaria, D.; Snyder, R.L.; Lagos, O.; Lampinen, B.D.; Ferguson, L.; Grattan, S.R.; Little, C.; Shapiro, K.; Maskey, M.L.; et al. Actual Evapotranspiration and Tree Performance of Mature Micro-Irrigated Pistachio Orchards Grown on Saline-Sodic Soils in the San Joaquin Valley of California. Agriculture 2019, 9, 76. [Google Scholar] [CrossRef]
  26. Allen, R.G.; Pereira, L.S.; Raes, D.; Smith, M. Crop Evapotranspiration. In FAO Irrigation and Drainage Paper No. 56; FAO: Rome, Italy, 1998; Volume 56, p. 333. ISBN 92-5-104219-5. [Google Scholar]
  27. Lovelli, S.; Perniola, M.; Ferrara, A.; Di Tommaso, T. Yield response factor to water (Ky) and water use efficiency of Carthamus tinctorius L. and Solanum melongena L. Agric. Water Manag. 2007, 92, 73–80. [Google Scholar] [CrossRef]
  28. Steduto, P.; Albrizio, R. Resource use efficiency of field-grown sunflower, sorghum, wheat and chickpea: II. Water use efficiency and comparison with radiation use efficiency. Agric. For. Meteorol. 2005, 130, 269–281. [Google Scholar] [CrossRef]
  29. Molden, D.; Oweis, T.; Steduto, P.; Bindraban, P.; Hanjra, M.A.; Kijne, J. Improving agricultural water productivity: Between optimism and caution. Agric. Water Manag. 2010, 97, 528–535. [Google Scholar] [CrossRef]
  30. Morillo, J.G.; Díaz, J.A.R.; Camacho, E.; Montesinos, P. Linking water footprint accounting with irrigation management in high value crops. J. Clean. Prod. 2015, 87, 594–602. [Google Scholar] [CrossRef]
  31. Playán, E.; Mateos, L. Modernization and optimization of irrigation systems to increase water productivity. Agric. Water Manag. 2006, 80, 100–116. [Google Scholar] [CrossRef] [Green Version]
  32. Hoekstra, A.Y.; Chapagain, A.K.; Aldaya, M.M.; Mekonnen, M.M. The Water Footprint Assessment Manual; Earthscan: London, UK, 2011; ISBN 9781849712798. [Google Scholar]
  33. Chukalla, A.D.; Krol, M.S.; Hoekstra, A.Y. Green and blue water footprint reduction in irrigated agriculture: Effect of irrigation techniques, irrigation strategies and mulching. Hydrol. Earth Syst. Sci. 2015, 19, 4877–4891. [Google Scholar] [CrossRef]
  34. Mekonnen, M.M.; Hoekstra, A.Y. National water footprint accounts: The green, blue and grey water footprint of production and consumption. In Value of Water Research Report Series No. 50; UNESCO-IHE: Delft, The Netherlands, 2011. [Google Scholar]
  35. Bonamente, E.; Scrucca, F.; Rinaldi, S.; Merico, M.C.; Asdrubali, F.; Lamastra, L. Environmental impact of an Italian wine bottle: Carbon and water footprint assessment. Sci. Total Environ. 2016, 560, 274–283. [Google Scholar] [CrossRef]
  36. Lamastra, L.; Suciu, N.A.; Novelli, E.; Trevisan, M. A new approach to assessing the water footprint of wine: An Italian case study. Sci. Total Environ. 2014, 490, 748–756. [Google Scholar] [CrossRef] [PubMed]
  37. Zhuo, L.; Mekonnen, M.M.; Hoekstra, A.Y. Sensitivity and uncertainty in crop water footprint accounting: A case study for the Yellow River basin. Hydrol. Earth Syst. Sci. 2014, 18, 2219–2234. [Google Scholar] [CrossRef]
  38. Borsato, E.; Giubilato, E.; Zabeo, A.; Lamastra, L.; Criscione, P.; Tarolli, P.; Marinello, F.; Pizzol, L. Comparison of Water-focused Life Cycle Assessment and Water Footprint Assessment: The case of an Italian wine. Sci. Total Environ. 2019, 666, 1220–1231. [Google Scholar] [CrossRef] [PubMed]
  39. Castellanos, M.T.; Cartagena, M.C.; Requejo, M.I.; Arce, A.; Cabello, M.J.; Ribas, F.; Tarquis, A.M. Agronomic concepts in water footprint assessment: A case of study in a fertirrigated melon crop under semiarid conditions. Agric. Water Manag. 2016, 170, 81–90. [Google Scholar] [CrossRef]
  40. Toniolo, L.; Mosca, G.; Sattin, M. Crop physiology aspects of soybean versus maize in north-eastern Italy. Rivista di Agronomia 1985, 19, 251–257. [Google Scholar]
  41. Hunt, R.; Causton, D.R.; Shipley, B.; Askew, A.P. A Modern Tool for Classical Plant Growth Analysis. Ann. Bot. 2002, 90, 484–488. [Google Scholar] [CrossRef] [PubMed]
  42. Haghverdi, A.; Leib, B.; Washington-Allen, R.; Wright, W.; Ghodsi, S.; Grant, T.; Zheng, M.; Vanchiasong, P. Studying Crop Yield Response to Supplemental Irrigation and the Spatial Heterogeneity of Soil Physical Attributes in a Humid Region. Agriculture 2019, 9, 43. [Google Scholar] [CrossRef]
  43. Doorenbos, J.; Pruitt, W.O. Guidelines for predicting crop water requirements. In FAO Irrigation and Drainage Paper 24; FAO: Rome, Italy, 1977. [Google Scholar]
  44. Handa, D.; Frazier, R.; Taghvaeian, S.; Warren, J. The Efficiencies, Environmental Impacts and Economics of Energy Consumption for Groundwater-Based Irrigation in Oklahoma. Agriculture 2019, 9, 27. [Google Scholar] [CrossRef]
  45. Borsato, E.; Tarolli, P.; Marinello, F. Sustainable patterns of main agricultural products combining different footprint parameters. J. Clean. Prod. 2018, 179, 357–367. [Google Scholar] [CrossRef]
  46. Carnovale, E.; Marletta, L. Tabelle di Composizione Degli Alimenti. Available online: http://nut.entecra.it/646/tabelle_di_composizione_degli_alimenti.html (accessed on 28 August 2019).
  47. Hess, M.; Barralis, G.; Bleiholder, H.; Buhr, L.; Eggers, T.H.; Hack, H.; Stauss, R. Use of the extended BBCH scale—general for the descriptions of the growth stages of mono; and dicotyledonous weed species. Weed Res. 1997, 37, 433–441. [Google Scholar] [CrossRef]
Figure 1. Illustration of the study area on the northeast of Italy (left), and the zoomed image with the three fields with the three irrigation systems identified with different colors (right): center pivot in yellow, micro irrigation in blue, and the hose-reel sprinkler machine in red.
Agriculture 09 00187 g001
Figure 2. Cumulative water supplied from irrigation and crop evapotranspiration (ETc adj) over the growing season for each irrigation system.
Agriculture 09 00187 g002
Figure 3. Water footprint (WF) blue and green of each irrigation system in terms of m3 ton−1. For Water Footprint (WF) green, the non-irrigated test was included.
Agriculture 09 00187 g003
Figure 4. Crop yield response factor (ky yield) of harvesting product and the ky from biomass production (ky crop growth rate (CGR) of maize under different irrigation systems.
Agriculture 09 00187 g004
Figure 5. Water productivity and economic water footprint of different irrigation systems.
Agriculture 09 00187 g005
Table 1. Total gross income, costs and net income for the three different irrigation systems. All the items are expressed in € ha−1.
Center Pivot SystemDrip IrrigationHose-reel SystemTEST
Total gross income 205423001949917
Amortization value13162111-
Labor and maintenance3012575-
Energy99104171-
Cost for drip line-320--
Total Irrigation costs260610357-
Net income179416901592917
Table 2. Inventory list of annual energy consumption and costs for the three different irrigation systems considered per hectare.
Inventory ListMetricDrip IrrigationCenter Pivot Hose-Reel
Number of irrigations12105
Electricity consumption single irrigation per hectarekWh (*)485552.5
Energy cost€ ha−110499171
Electricity price€ kWh−1 (**)0.180.180.65
* Diesel (L) in case of hose-reel system. ** Diesel price (€ L−1) in case of hose-reel system.
Table 3. Comparison of water use efficiency (WUE), irrigation water use efficiency (IWUE), and relative irrigation supply (RIS) under different irrigation systems. The dates of WUE are reported where the non-irrigated test is included.
Irrigation PlotWUE 22-June
kg m−3
WUE 28-July
kg m−3
IWUE
kg m−3
RIS
Drip irrigation1.2511.8752.9810.79
Center Pivot1.3492.0402.3700.75
Hose-reel system0.9721.5412.5800.78
Non-irrigated test1.3191.627
Table 4. Indicators of performance of biomass and harvest production such as the harvest index (HI), crop growth rate (CGR), and relative growth rate (RGR) are shown for drip, center pivot, and hose-reel irrigation systems.
Irrigation SystemHI at Hard Dough Phase
kgharvest·kgbiomass−1
CGR Maize Biomass
g day−1
CGR Maize Ear
g day−1
RGR Maize Biomass
g g−1 day−1
RGR Maize Ear
g g−1 day−1
Drip irrigation0.52113.521.50.0310.031
Center pivot0.47815.917.50.0330.026
Hose-reel0.53310.418.90.0320.033
Test0.4166.47.30.0190.024
Table 5. Energy indicators of environmental impact for irrigation practice comparing different irrigation systems.
Energetic Footprint
m3 MJ−1
Energetic Cost Footprint
m3−1
Energy Performance
MJ m3 kgCO2−eq−1
GHG Emission Per Irrigation
kgCO2−eq ha−1
Drip irrigation1.0022.30.2126
Center pivot system0.8524.20.1529
Hose-reel system0.1211.70.3529

