Article

Effects of Green Manure Application and Prolonging Mid-Season Drainage on Greenhouse Gas Emission from Paddy Fields in Ehime, Southwestern Japan

1
Graduate School of Agriculture, Ehime University, 3-5-7, Tarumi, Matsuyama 790-8566, Ehime, Japan
2
Faculty of Agriculture, Universitas of Gadjah Mada, Bulaksumur, Yogyakarta 55281, Indonesia
3
Faculty of Agriculture, Ehime University, 3-5-7, Tarumi, Matsuyama 790-8566, Ehime, Japan
4
NARO Tohoku Agricultural Research Center, 4 Akahira, Shimokuriyagawa, Morioka 020-0198, Iwate, Japan
5
NARO Hokkaido Agricultural Research Center, 1, Hitsujigaoka, Toyohira-ku, Sapporo 062-8555, Hokkaido, Japan
*
Author to whom correspondence should be addressed.
Agriculture 2019, 9(2), 29; https://doi.org/10.3390/agriculture9020029
Submission received: 8 January 2019 / Revised: 24 January 2019 / Accepted: 24 January 2019 / Published: 1 February 2019
(This article belongs to the Special Issue Greenhouse Gas Emissions in Agroecosystems)

Abstract

:
Green manure application helps maintain soil fertility, reduce chemical fertilizer use, and carbon sequestration in the soil. Nevertheless, the application of organic matter in paddy fields induces CH4 and N2O emissions. Prolonging mid-season drainage reduces CH4 emissions in paddy fields. Therefore, the combined effects of green manure application and mid-season drainage prolongation on net greenhouse gas emission (NGHGE) were investigated. Four experimental treatments were set up over a 2-year period: conventional mid-season drainage with (CMG) and without (CM) green manure and prolonged (4 or 7 days) mid-season drainage with (PMG) and without (PM) green manure. Astragalus sinicus L. seeds were sown in autumn and incorporated before rice cultivation. No significant difference in annual CH4 and N2O emissions, heterotrophic respiration, and NGHGE between treatments were observed, indicating that green manure application and mid-season drainage prolongation did not influence NGHGE. CH4 flux decreased drastically in PM and PMG during mid-season drainage under the hot and dry weather conditions. However, increasing applied carbon increases NGHGE because of increased CH4 and Rh. Consequently, combination practice of mid-season drainage prolongation and green manure utilization can be acceptable without changing NGHGE while maintaining grain yield in rice paddy fields under organically managed rice paddy fields.

Graphical Abstract

1. Introduction

Global climate change is caused by increasing atmospheric concentrations of greenhouse gases (GHG) such as carbon dioxide (CO2), methane (CH4), and nitrous oxide (N2O) [1]. As rapid climate change will significantly affect food security and other social issues, mitigation strategies for anthropogenic GHG emissions are required worldwide.
Rice (Oryza sativa L.) is a major cereal crop. In 2010, rice production in east-, southeast-, and south Asia was 633 Mt from 143 Mha. This area constitutes approximately 88% of all rice paddy fields worldwide [2]. CH4 emissions are the main source of GHG from rice paddy fields. In waterlogged paddy fields, CH4 is generated by anaerobic decomposition of organic matter in the soil [3,4]. In Japan, paddy fields comprised 54.4% of the total agricultural area in 2017. An estimated 17,904 Tg CO2eq of CH4 was emitted from paddy fields in 2014 and it contributed 46.6% of the CH4 emission in the entire agricultural sector in Japan. N2O emission from paddy fields is also considered as a source of atmospheric N2O [5]. However, year-round monitoring in a recent study indicated that paddy fields could also be a significant N2O sink [6,7]. Therefore, long-term studies of N2O emission from paddy fields are necessary because short-term experiments do not provide enough data to evaluate net N2O emissions [5,8]. Paddy fields have been reported as an atmospheric carbon sink [9,10] and a contributor to global warming owing to their high CH4 emission levels when both soil carbon and CH4 are considered [5]. Therefore, the CH4, N2O, and carbon budget must be considered when evaluating the contribution of paddy fields to global warming.
Green manure (legume crops) application in paddy fields supplies nitrogen required for rice growth and increases soil organic carbon, thus maintaining soil fertility [11]. Green manure seeds are sown after rice cultivation and incorporated into the soil several weeks or months before the next rice planting. Although it improves rice yield, green manure application increases CH4 emissions [12,13]. Toma et al. [14] reported that the incorporation of green manure, in the case white clover (Trifolium repens), into paddy fields induced higher CH4 emissions. In paddy fields, incorporation of organic matter in spring induces higher CH4 emissions during the growing season compared to incorporation in autumn. The reason is that labile organic carbon, which can be the carbon source for CH4 production, is poorly decomposed due to the short time interval between the green manure incorporation and rice cultivation [3]. Green manure applications in paddy fields also increase N2O emissions [14]. Therefore, it is necessary to develop rice cultivation techniques that mitigate CH4 emissions and utilize green manure effectively.
Mid-season drainage is successful management practice for mitigating CH4 emissions in paddy fields [15]. Soil oxidation during rice cultivation effectively lowers CH4 emissions. Nevertheless, it can also inhibit the reduction of N2O to N2 through denitrification. Zou et al. [16] reported that the introduction of mid-season drainage during rice cultivation reduces CH4 and induces N2O emissions. Because N2O is a more potent GHG than CH4, it is necessary to balance CH4 decrease and N2O increase when introducing mid-season drainage to mitigate GHG emissions in paddy fields. In paddy fields where mid-season drainage has already been introduced, its prolongation mitigates CH4 emissions. Itoh et al. [17] reported that CH4 and N2O emissions from paddy fields were suppressed to approximately 72% (as global warming potential [GWP]-based CO2 equivalent) when mid-season drainage was prolonged.
The aims of this study were to evaluate the effects of green manure application and mid-season drainage prolongation on GHG emissions from paddy fields. The effects of management practices on global warming were evaluated using net GHG emissions (NGHGE) which took into account CH4 and N2O emissions and carbon budgets.

2. Materials and Methods

2.1. Study Site

A 2-year experiment was conducted at the Ehime University Farm (33°57′ N, 132°47′ E, 12 m asl) from October 2013 to September 2015. The mean annual air temperature was 16.5 °C and annual precipitation was 1315 mm (mean values over a 30-year period from 1981 to 2010). The soil was a fluvic paddy soil classified according to Soil Classification System of Japan [18]. The surface soil layer (approximately 0–21 cm depth) had a sandy clay loam texture (62.6% sand, 10.9% silt, 26.5% clay), with a bulk density of 1.11 g cm−3, total carbon concentration of 1.04%, and total nitrogen concentration of 0.10%. Free iron (Fe) concentrations were 3.46 g Fe kg−1, cation exchange capacity was 8.77 cmolc kg−1, soil mass carbon in the top 30 cm of soil was 2.72 kg C m−2.

2.2. Treatments and Management Practices

In October 2013, four treatments were set up: conventional water management with (CMG) or without (CM) green manure application and prolonged mid-season drainage with (PMG) or without (PM) green manure application. Each treatment consisted of four plots (2.5 m wide × 8.3 m long; area 20.8 m2). Weed can grow well in the spring season in all the plots because those plots have been used for the study of organic farming for recent decades.
Field management practice was shown in Table 1. Rice straw (6-cm-long segment) was prepared from the residue of rice grown in 2013 and 2014; it was broadcasted and incorporated into the soil surface (0–10 cm) at the rate of 5480 kgDW ha−1 (and 2310 kg C ha−1) in the first year and 2740 kgDW ha−1 (1120 kg C ha−1) in the second year. Chinese milk vetch (Astragalus sinicus L.) seeds were manually broadcasted (30 kg ha−1 in 2013 and 40 kg ha−1 in 2014) as green manure after rice straw incorporation. The plant grown in the plot (green manure and weeds) were cut and incorporated into the soil on next early summer in all treatment.
Basal fertilizer was applied to the CM and PM plots at the rate of 40 kg ha−1 ammonium-nitrogen, 17.5 kg ha−1 phosphorus (P, in the form of 40 kg P2O5 ha−1), and 24.9 kg ha−1 potassium (K, in the form of 60 kg K2O ha−1). In the CMG and PMG plots, urea was applied in both years as a basal fertilizer supplying 10 kg ha−1 of nitrogen. Supplemental fertilizers (40 kg N ha−1, 12 kg K ha−1) were applied to the all treatments after finishing mid-season drainage. Rice seedlings (c.v. Akitakomachi) were transplanted at the rate of 15.2 hills m−2.
Plots were irrigated appropriately. In the early growth stages of rice plants, the paddy field was kept flooded until mid-season drainage. Paddy water was drained through irrigation ditches during mid-season drainage. In the PM and PMG plots, mid-season drainage was carried out for 9 and 14 days in the first and second year. In the CM and CMG plots, it was carried out for 5 and 7 days in the first and second year. Because the weather in July 2014 was hot and dry, mid-season drainage ended on the same day in all treatments to avoid serious drought in the PM and PMG plots.

2.3. Gas Flux Measurements

GHG fluxes were measured with the closed chamber technique. In the fallow season, gas flux was measured using stainless-steel bases and chambers, as described by Toma et al. [7]. Two stainless-steel bases were installed per plot to measure CH4 and N2O fluxes from green manure-covered soil, and CO2 flux from bare soil surfaces. To prevent plant growth on soil surfaces intended for CO2 flux measurement, herbicide was applied around the stainless-steel bases at least 1 week before CO2 flux measurement. During the growing season, acrylic chambers divided into upper and lower compartments were used for measuring CH4 and N2O fluxes [6,7]. For measuring CO2 flux, stainless-steel bases were installed between rows. PVC collars (20 cm high) were positioned under the stainless-steel bases to deter root growth under the base area, consequently preventing CO2 contamination from roots [19].
CH4 and N2O gas samples were collected in vacuum-sealed vials fitted with butyl rubber stoppers, at 0, 30, and 60 min in the fallow season and at 4, 14, and 24 min in the growing season after the chambers were deployed. Gas samples for CO2 flux measurement were collected at 0, 6, and 12 min using Tedlar® bags (500 mL). CH4 and N2O concentrations were analyzed with a gas chromatography (GC) fitted with a flame-ionization detector (GC-8A, Shimadzu, Kyoto, Japan) and an electron-capture detector (GC-14B, Shimadzu, Kyoto, Japan), respectively. CO2 concentrations were analyzed with a CO2 analyzer (ZFP-9, Fuji Electric Systems, Tokyo, Japan). Gas fluxes were measured every 2 weeks during fallow seasons and early and late growing seasons. During mid-season drainage and after plant biomass incorporation, gas samples were collected every 2 days.
In this study, CO2 emissions from bare soil surfaces in the fallow season and between rows in the rice growing season were defined as soil organic carbon decomposition or heterotrophic respiration (Rh) [6]. Rh, CH4, and N2O fluxes were calculated by linear regression. There were significant correlations between Rh and soil temperature (at a depth of 5 cm) during the fallow season as described in Results (Table S1). Therefore, Rh in the fallow season was estimated using hourly soil temperature measured in the presence of plants (GM and weeds) and the correlation between soil temperature measured in bare soil and Rh [20]. Integrated values of Rh, CH4, and N2O were determined by the trapezoidal method according to Toma et al. [7]. Cumulative CH4, N2O, and Rh emissions were calculated periodically and annually (Table 2).

2.4. Amount of Carbon Applied in the Form of Rice Straw, Green Manure, and Other Plants

The amount of carbon applied as rice straw was determined from rice straw mass and its carbon concentration measured with an NC analyzer (Sumigraph NC-80, Sumika, Osaka, Japan). A week before cutting the green manure, all aboveground biomass was collected from a 0.25 m2 (50 cm × 50 cm) area in all treatments. The belowground biomass was collected from a 0.06 m−2 (25 cm × 25 cm) area in the aboveground biomass collection area. Aboveground biomass was separated into green manure and weeds. Belowground biomass was washed with tap water to remove soil. All plant material was dried at 70 °C and powdered. Concentrations of carbon and nitrogen were measured using the NC analyzer.

2.5. Calculating Net Greenhouse Gas Emissions

The GWPs, including climate-carbon feedbacks, of CH4 and N2O were 34 and 298 times higher, respectively, than the GWP of CO2 over 100-year time horizon [21]. The NGHGE was calculated as the sum of the GWP values of all GHG, carbon inputs, and carbon outputs:
NGHGE (Mg CO2eq ha−1 year−1) = GWPCH4 + GWPN2O + GWPRh − GWPRS − GWPGM,
where, GWPCH4, GWPN2O, GWPRh, GWPRS, and GWPGM were GWP of CH4, N2O, Rh, rice straw carbon, and green manure and weeds carbon, respectively. Each of GWP values (Mg CO2eq ha−1) were calculated as follows:
GWPCH4 = annual CH4 emission (Mg C ha−1 year−1) × 16/12 × 34,
GWPN2O = annual N2O emission (Mg N ha−1 year−1) × 44/28 × 298,
GWPRh = Rh (Mg C ha−1 year−1) × 44/12,
GWPRS = C application rate of rice straw (Mg C ha−1 year−1) × 44/12,
GWPGM = application rate of aboveground- and belowground biomass C of GM and weeds (Mg C ha−1 year−1) × 44/12,

2.6. Ancillary Measurements

Soil samples were collected from a depth of 0–10 cm when gas fluxes were measured and extracted with 2 M KCl for measuring ammonium-nitrogen (NH4+) and nitrate-nitrogen (NO3) concentrations by indophenol blue and vanadium (III) chloride–nitrogen-ethylenediamine dihydrochloride colorimetry, respectively. Soil water content of the soil samples was also measured. Soil samples for the measurement of Fe2+ concentrations were collected from a depth of 0–10 cm five or six times during the rice growing period and extracted with 1 M sodium acetate at pH 3.0. The Fe2+ concentrations of the extracts were analyzed by 0.2% o-phenanthroline colorimetry. Soil redox potential (Eh) was measured at a depth of 5 cm with three replicates per plot. Soil temperatures at 5-cm depth were measured continuously by thermistors (Ondotori Jr. RTR 502, T&D, Nagano, Japan). Air temperature and precipitation were measured at the weather station on the Ehime University Farm.
Eight rice plants per plot were clipped and dried at harvest time. Panicles were counted and rice sheaves were dried for 1 week. Grains were separated from the straw, their husks removed, and 1000 brown rice grains were weighed using a grain inspector (RGQI10A, Satake, Hiroshima, Japan). The brown rice yield per unit area was calculated from plant density and brown rice yield per plant.

2.7. Statistical Analyses
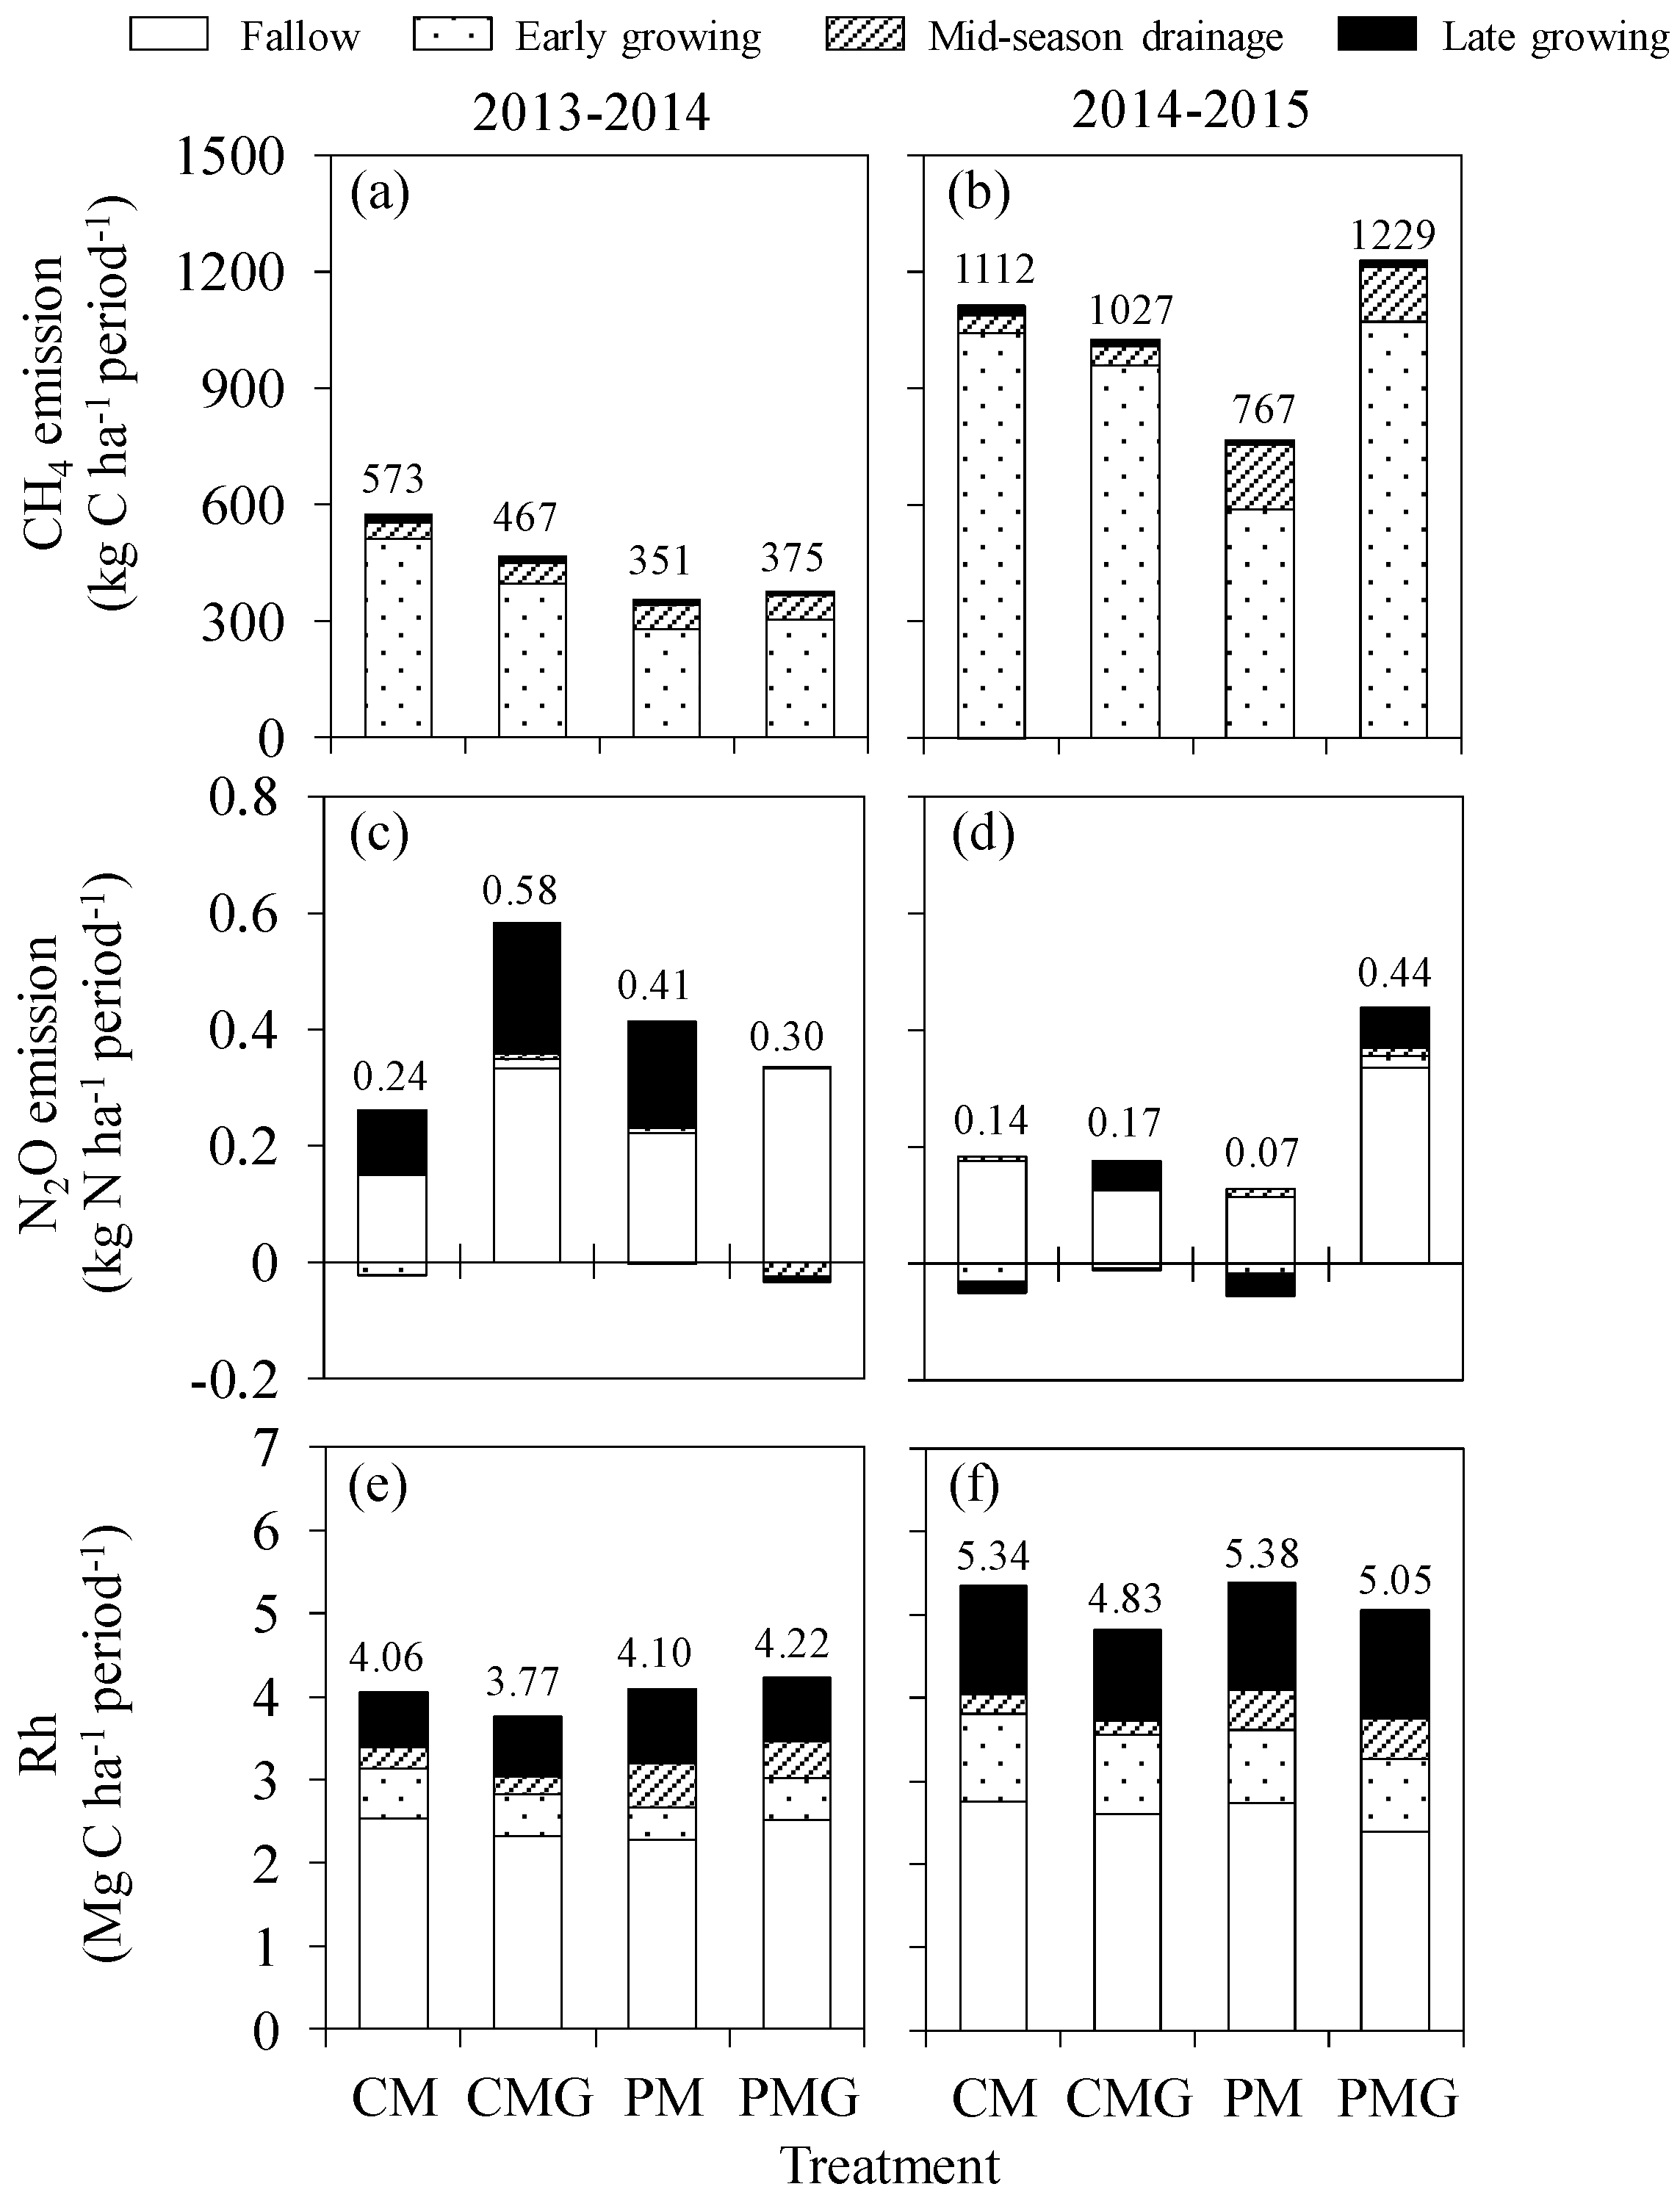
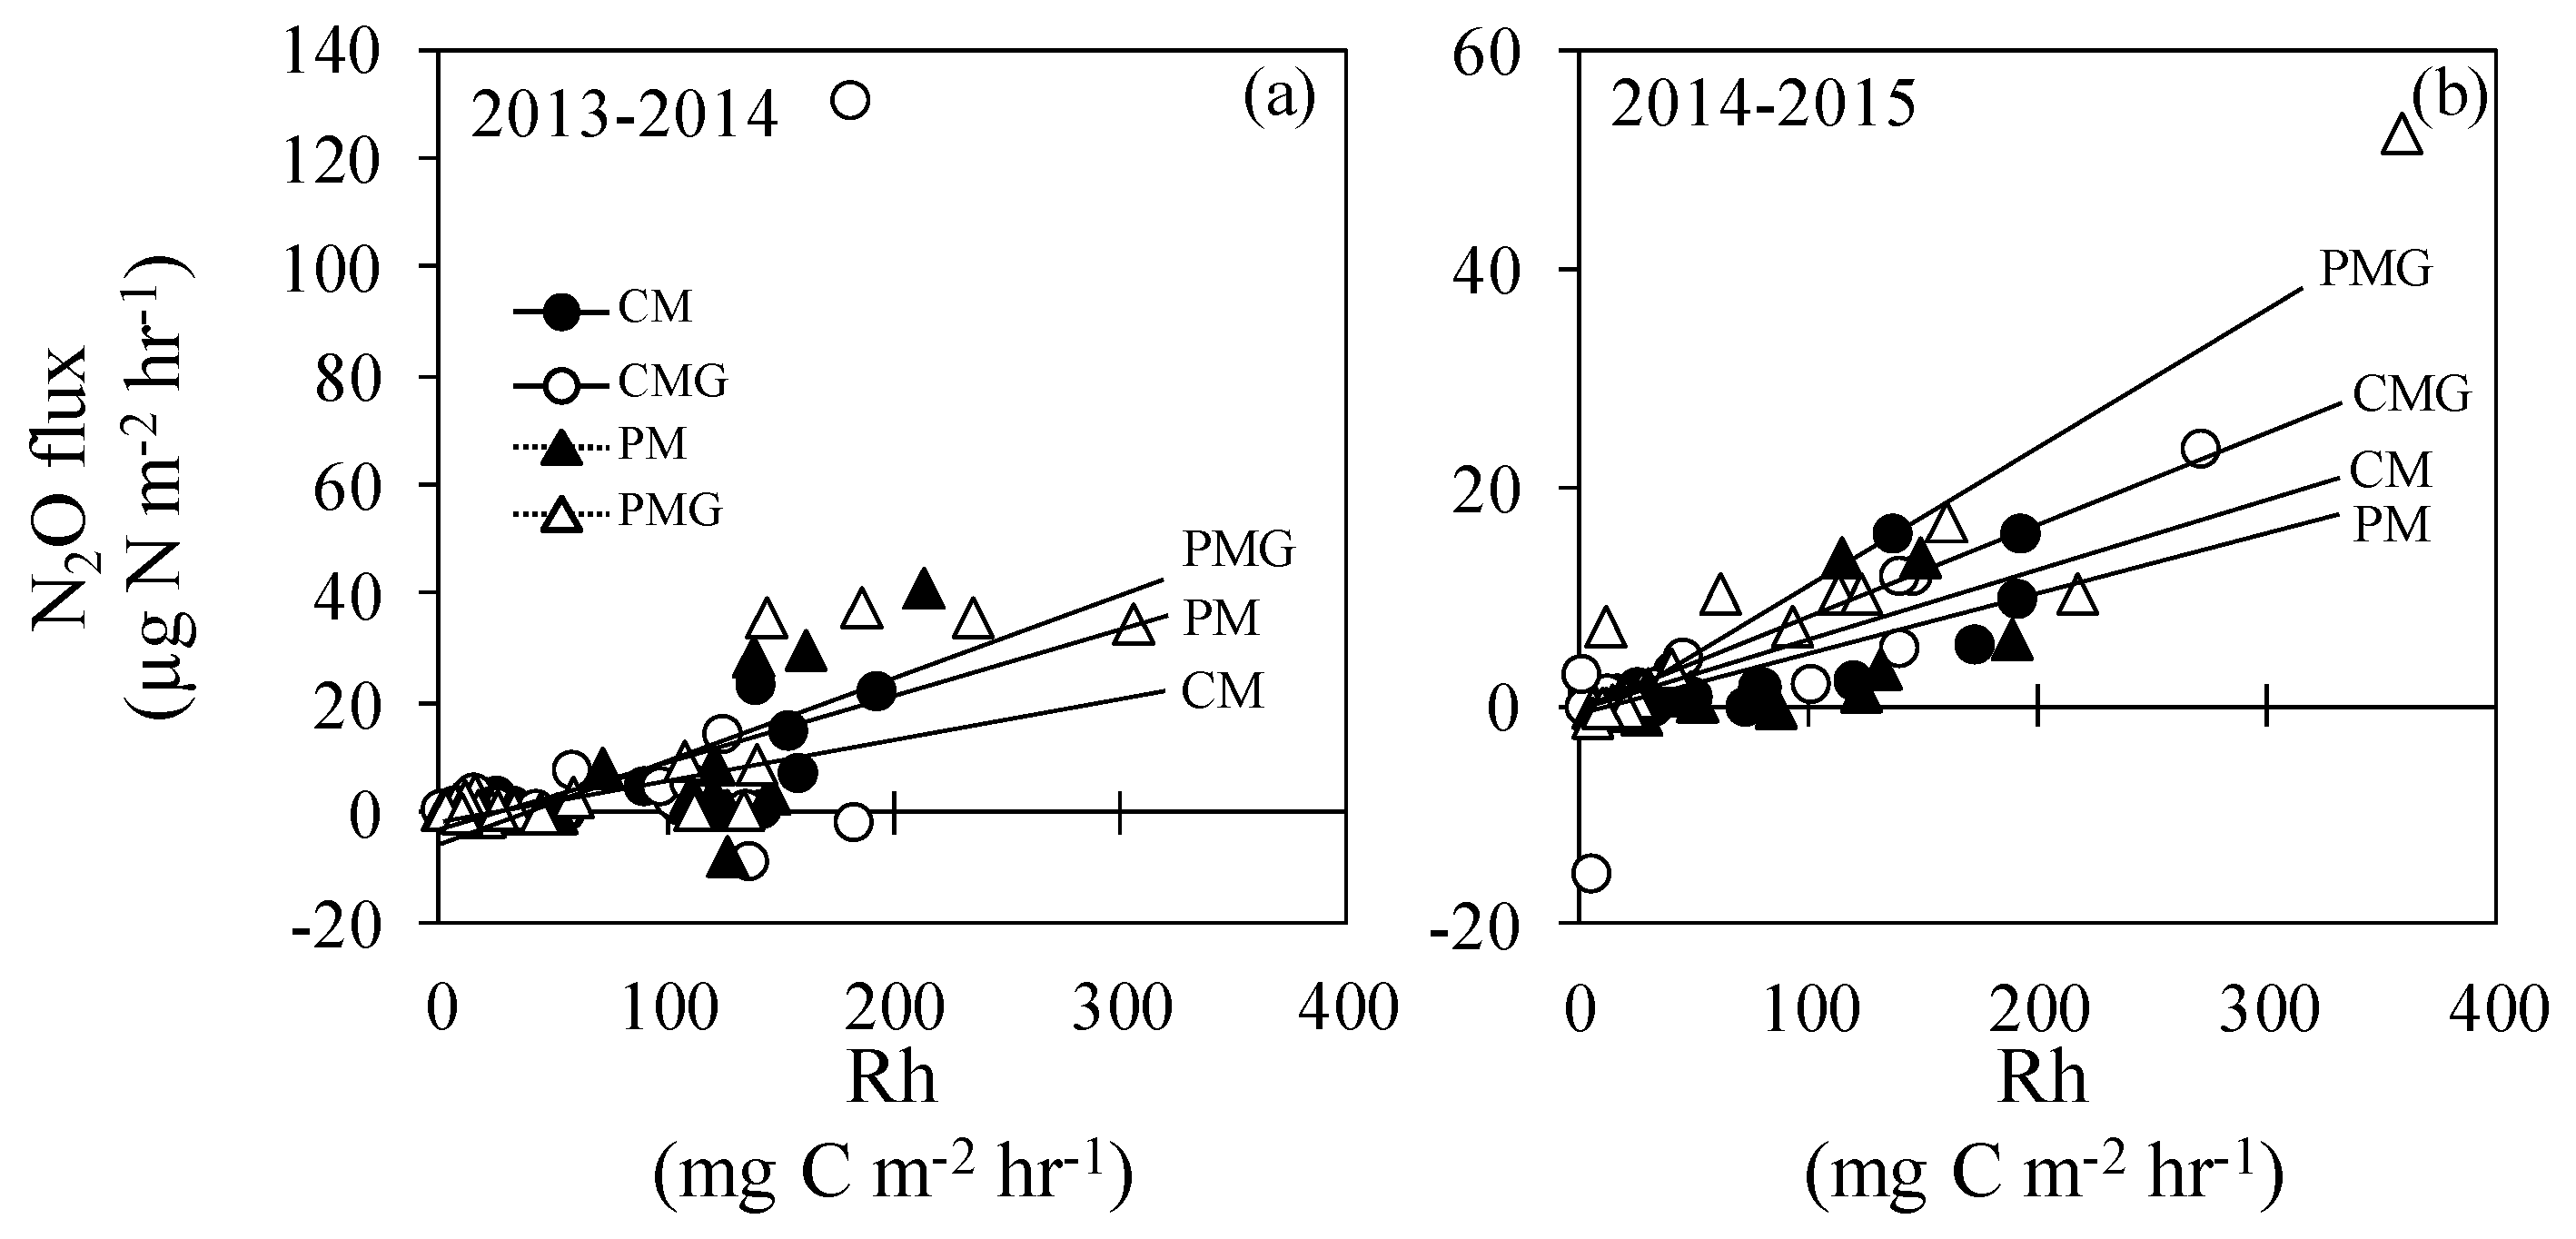
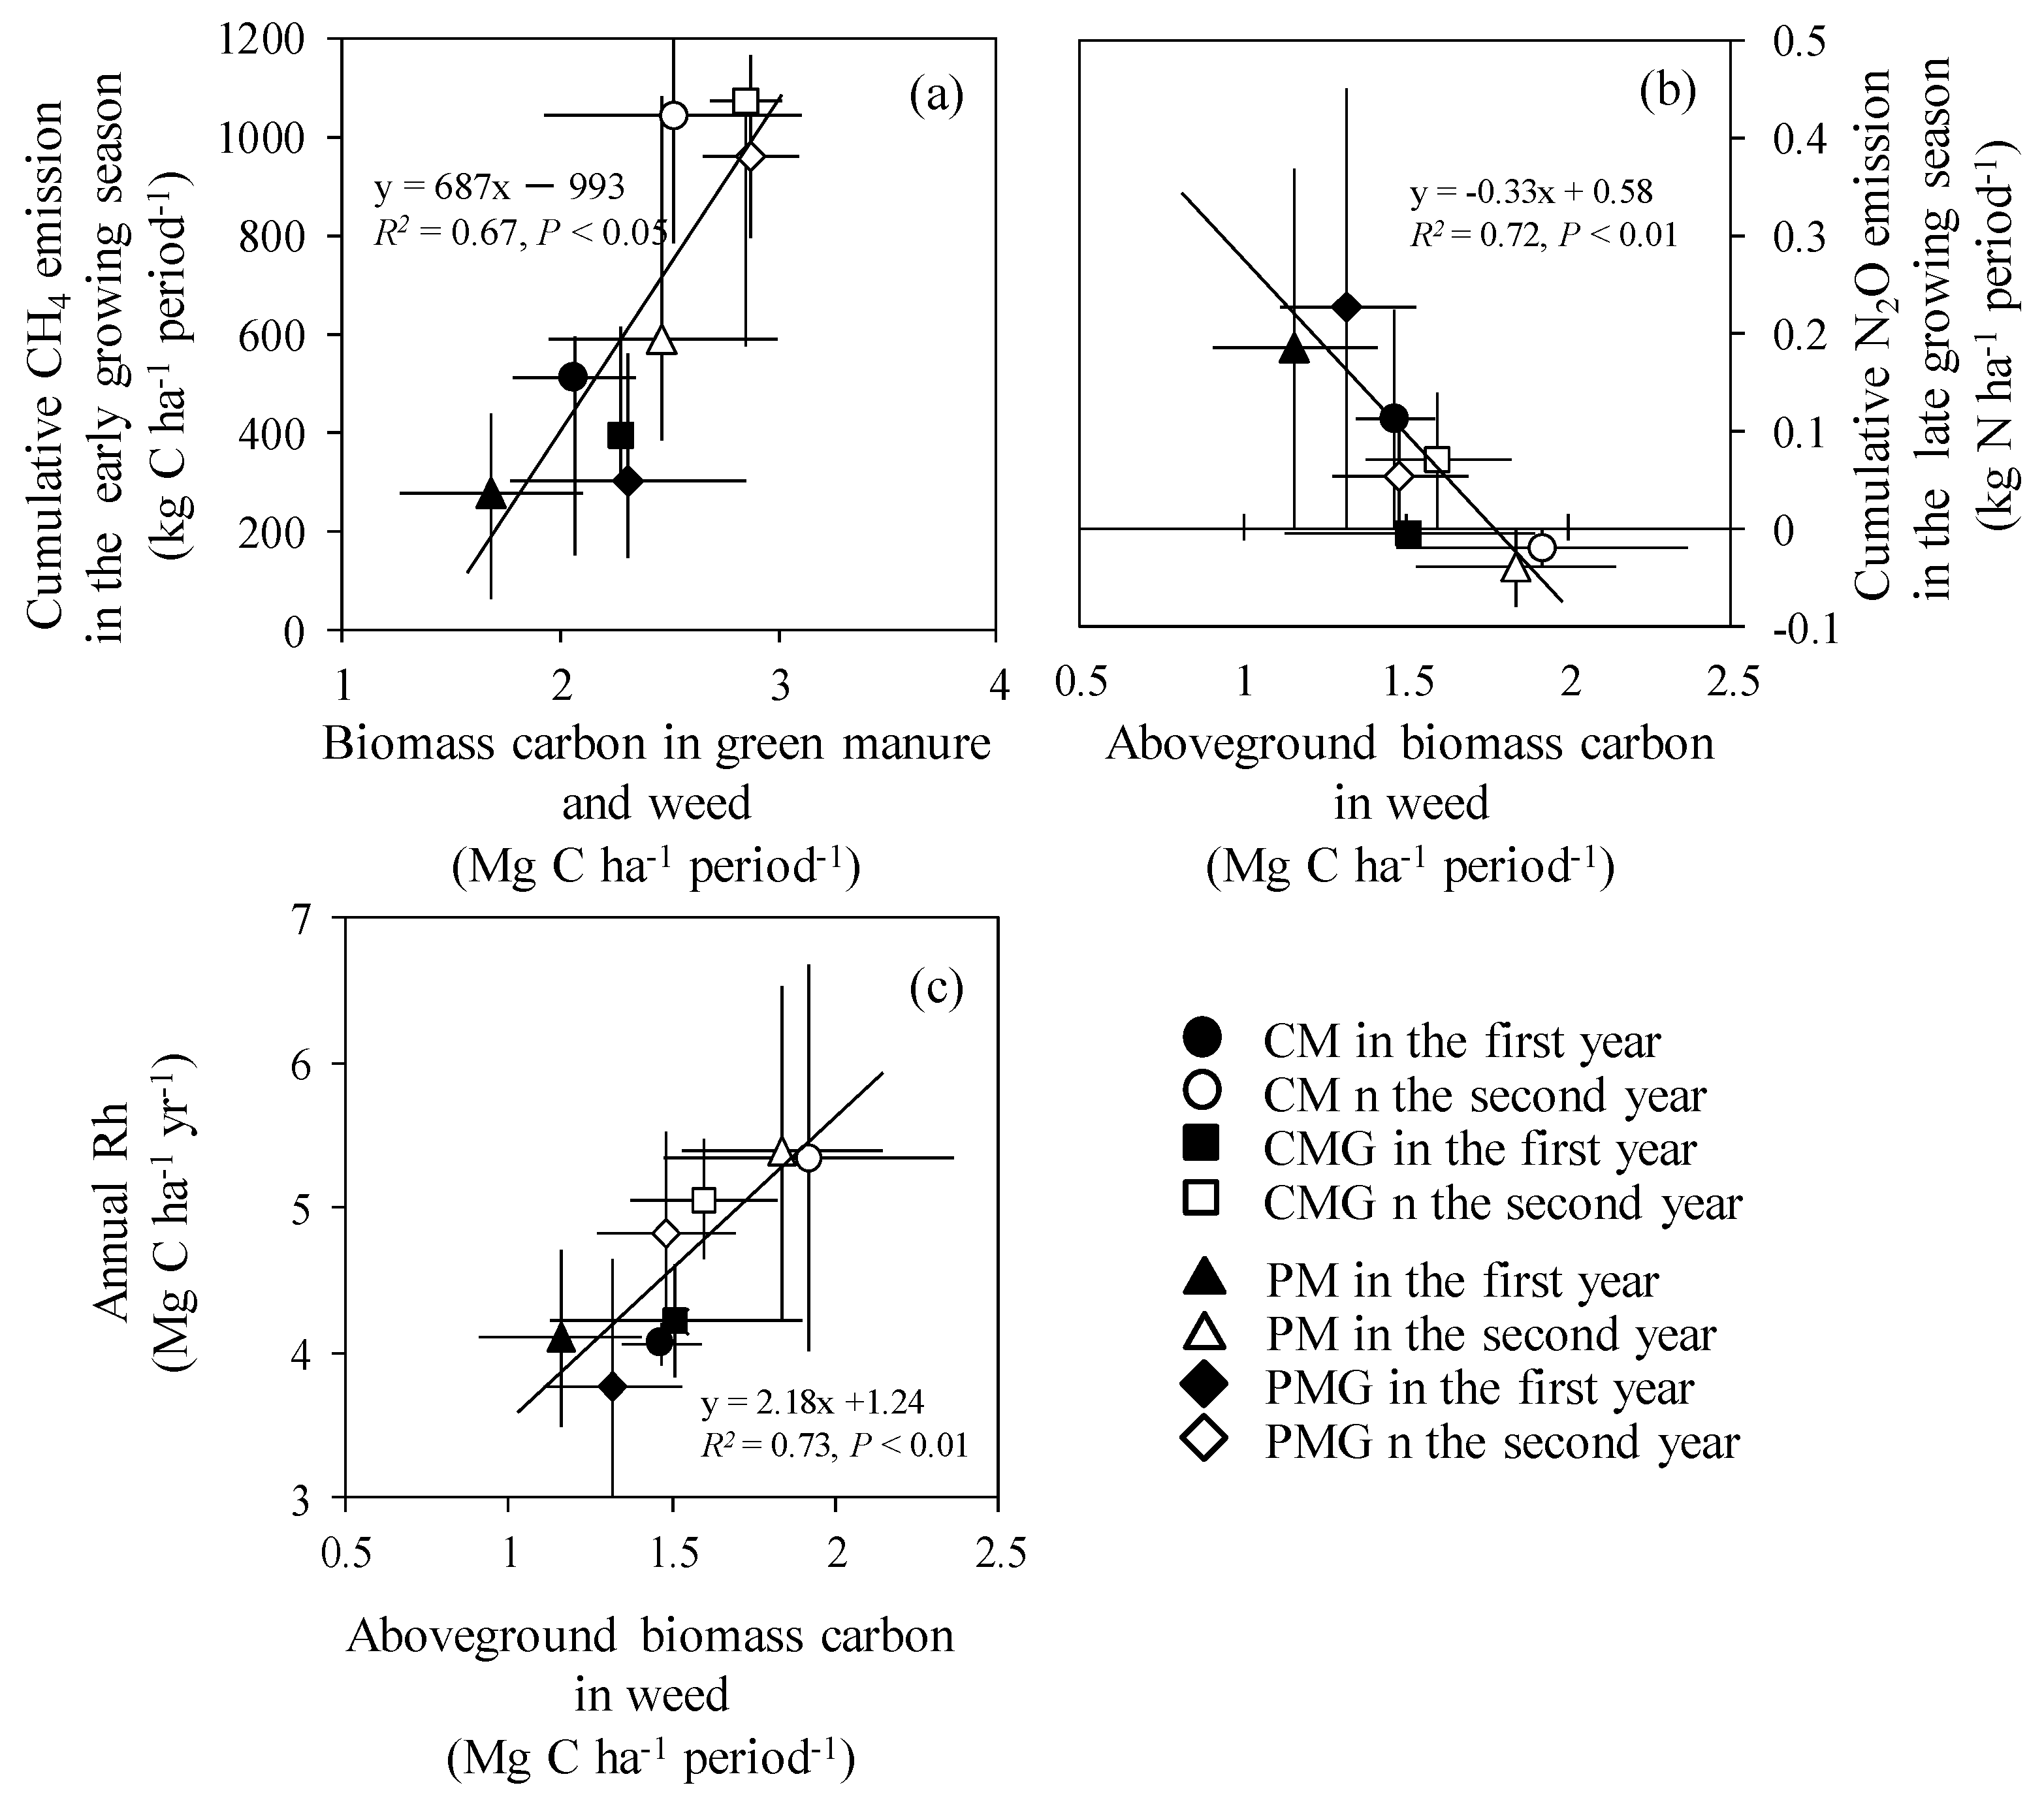
All statistical analyses were performed using ‘R’ software (version 3.1.0) [22]. Statistically significant differences in cumulative GHG emissions, daily GHG fluxes, and NGHGE between treatments were determined periodically and annually using the Tukey’s test following one-way analysis of variance (ANOVA). The effects of prolongation of mid-season drainage, green manure and weed application, and their interaction were evaluated by two-way ANOVA in the first and second years. Over the entire study period, the effects of three factors (mid-season drainage prolongation, green manure and weed application, year, and their interaction) on GHG emissions, daily GHG fluxes, and NGHGE were analyzed by three-way ANOVA. Correlations between GHG emissions, NGHGE and applied carbon of rice straw, green manure, and weed biomass were investigated using the Pearson’s rank correlation coefficient test. Statistically significant differences are reported at P < 0.05 level.

3. Results

The CH4 flux in the fallow season was lower than 0.2 mg C m−2 hr−1 (Figure S1). In the growing season, CH4 flux increased, especially in the early part of the season, in all treatments (Figure 1a,d). After mid-season drainage, CH4 flux was low towards the end of the growing season. In the first year, CH4 flux decreased and Eh increased faster in PM and PMG than in CM and CMG (Figure 1a,c). In the second year, CH4 flux in all treatment increased just after the starting MD (Figure 1d,f). The variation between treatments in soil water content was greater in the early growing season, decreased during mid-season drainage, and increased after that (Figure 1e,a).
Seasonal N2O flux variations are shown in Figure 2a,d. During the fallow season, N2O fluxes across treatments were approximately 0 µg N m−2 hr−1 in both years. However, they increased sharply and peaked (at 130 and 52.5 µg N m−2 hr−1 in the first and the second years, respectively) after green manure and weeds incorporation (Figure 2a,d). The lowest N2O fluxes were observed during the mid-season drainage in the first year (−79.7 µg N m−2 hr−1; Figure 2a) and in the late growing season in the second year (−35.8 µg N m−2 hr−1; Figure 2d).
Seasonal Rh variations are shown in Figure 3a,b. In the fallow season, Rh in all treatments decreased from autumn to winter and increased towards spring. There were significant correlations between Rh and soil temperature in the fallow season in all treatments in both years, except for two plots in treatments CMG and PMG in the first and second years, respectively (Table S1). Rh increased in the early growing season and during mid-season drainage in both years (Figure 3). After mid-season drainage, Rh decreased in the late growing season in all treatments in the first year, whereas it decreased only in CM and CMG in the second year.
Annual CH4 emissions were not significantly different between treatments in the first and second years (Figure 4a,b). The cumulative CH4 emissions in the growing season accounted for nearly 100% of the annual CH4 emission in the first and second years, and cumulative CH4 emission in the early growing season contributed to more than 70% of the emission in the growing season (Table S2). The averages of annual CH4 emission in PM and PMG (363 kg C ha−1 in the first year, 998 kg C ha−1 in the second year) were 69.8% and 93.3% of that in CM and CMG (520 kg C ha−1 in the first year, 1070 kg C ha−1 in the second year) in the first and second years, respectively. In the second year, cumulative CH4 emissions during the mid-season drainage were significantly higher in PM (169 kg C ha−1) and PMG (144 kg C ha−1) than those in CM (45.4 kg C ha−1) and CMG (47.5 kg C ha−1); and 2-year average of cumulative CH4 emission was significantly higher in PM (116 kg C ha−1) than in CM (43.2 kg C ha−1; Table S2).
There were no significant differences in annual N2O emission between treatments in the first and second years (Figure 4c,d). Cumulative N2O emissions in the fallow season were higher than those in the growing season, and they contributed approximately 55–156% to the annual N2O emissions (Table S4). In the first year, cumulative N2O emission and daily N2O flux in the late growing season and the entire growing season were lower in PMG than those in CMG and PM (Tables S4 and S5). In the second year, cumulative N2O emission in PMG (0.34 kg N ha−1) was significantly higher than that in CMG (0.12 kg N ha−1) and PM (0.11 kg N ha−1) in the fallow season (Table S4).
There were no significant differences in the annual Rh between the treatments in the first and second years (Figure 4e,f). The cumulative Rh in the fallow season contributed approximately 55.2% to the annual Rh in all treatment (Table S6). During mid-season drainage, cumulative Rh values were significantly higher in PM (0.53 Mg C ha−1 in the first year, 0.47 Mg C ha−1 in the second year) and PMG (0.46 Mg C ha−1 in the first year, 0.47 Mg C ha−1 in the second year) than those in CM (0.25 Mg C ha−1 in the first year, 0.24 Mg C ha−1 in the second year) and CMG (0.22 Mg C ha−1 in the first year, 0.24 Mg C ha−1 in the second year) (Table S6), whereas daily Rh during mid-season drainage was not significantly different between treatments (Table S7).
Over the study period, NGHGE did not differ significantly between treatments (Table 3). The 2-year average of GWPCH4 made the highest contribution to the 2-year average of NGHGE (by 93.6%, 100%, 87.5%, and 96.0% in CM, CMG, PM, and PMG, respectively) compared to other NGHGE component. Furthermore, the 2-year average of GWPRh contributed by 42.1%, 45.4%, 59.8%, and 44.8% in CM, CMG, PM, and PMG, respectively to the 2-year average of NGHGE. GWPGM, GWPRh, GWPCH4, and NGHGE were significantly affected by treatment year. GWPGM was significantly affected by green manure and weeds applications and GWPN2O was significantly affected by the tree-way interaction between mid-season drainage prolongation, green manure and weeds applications, and year.
Linear positive correlations between N2O flux and Rh in the fallow season were observed in CM (y = 0.08x − 1.61, R2 = 0.46, P < 0.05), PM (y = 0.13x − 3.61, R2 = 0.49, P < 0.01), and PGM (y = 0.14x − 2.80, R2 = 0.72, P < 0.01) in the first year (Figure 5a) and in CM (y = 0.06x − 1.17, R2 = 0.62, P < 0.01), CMG (y = 0.09x − 2.20, R2 = 0.70, P < 0.001), PM (y = 0.05x − 0.88, R2 = 0.48, P < 0.001), and PMG (y = 0.12x − 1.60, R2 = 0.84, P < 0.001) in the second year (Figure 5b). There were strong relationships between GHG and applied carbon (with the highest correlation coefficients, Figure 6). Cumulative CH4 emission in the early growing season was positively correlated with applied biomass carbon in green manure and weeds (Figure 6a). Cumulative N2O emission in the late growing season was negatively correlated, and annual Rh was positively correlated with applied aboveground biomass carbon from weeds (Figure 6b,c). NGHGE increased significantly with increasing applied biomass carbon from green manure and weeds (y = 37.6x − 54.1, R2 = 0.64, P < 0.05, data is not shown). There were no significant relationships between N2O emission and applied nitrogen (Table S9). Other correlation coefficients for the relationships between GHG emissions and inputs of carbon (from green manure, weeds, and roots) and nitrogen (from green manure, weeds, roots, and fertilized nitrogen) are given in Tables S8 and S9.
Mean daily precipitation and mean air temperature during mid-season drainage was lower in the first year than in the second year (Table 4). After starting mid-season drainage in PM and PMG (4 days earlier than in CM and CMG in both years), there was no rainfall for 4 days in the first year, whereas 14 mm of rainfall was observed over 4 days in the second year. From March to May (after incorporation of green manure) in the first year, the mean daily soil temperature (17.9 °C) in CM and PM was slightly higher than that in CMG and PMG (17.6 °C). In the same time interval in the second year, the mean daily soil temperature in CMG and PMG (16.9 °C) was lower than that in CM and PM (17.6 °C). The mean soil water content in CM and PM (27.3% in the first year and 38.6% in the second year) was almost identical to that in CMG and PMG (27.5% in the first year and 38.9% in the second year). Fe2+ concentrations at the end of mid-season drainage in CM (0.12 and 0.24 mg Fe kg−1 in the first and second years, respectively) and CMG (0.15 and 0.14 mg Fe kg−1 in the first and second years, respectively) were higher than those in PM (0.03 and 0.03 mg Fe kg−1 in the first and second years, respectively) and PMG (0.03 and 0.02 mg Fe kg−1 in the first and second years, respectively) (Figure S2c and S3c). In the fallow season in both years, soil NH4+ concentrations varied similarly in all treatments (Figure 2b,e). Conversely, soil NO3 concentrations in the second year were slightly higher in CMG and PMG than those in CM and PM (Figure 2c,f).
There were no significant differences in annually applied plant biomass carbon (3.59 to 4.62 Mg C ha−1 year−1) between the treatments (Table S10). Applied biomass carbon from green manure and weeds in the second year (2.47 to 2.88 Mg C ha−1) was approximately 16% higher than that in the first year (1.68 to 2.31 Mg C ha−1), whereas annually applied carbon in the second year (3.59 to 4.00 Mg C ha−1) was approximately 13% lower than that in the first year (3.99 to 4.62 Mg C ha−1). In CMG and PMG, the 2-year averages of applied plant biomass carbon (4.30 Mg C ha−1 in both treatments) were 7.20% and 13.3% higher than those in CM (4.00 Mg C ha−1) and PM (3.79 Mg C ha−1), respectively. Applied plant biomass nitrogen was significantly higher in CMG (145 kg N ha−1 in the first year and 156 kg N ha−1 in the second year) and PMG (149 kg N ha−1 in the first year and 148 kg N ha−1 in the second year) than in CM (110 kg N ha−1 in the first year and 106 kg N ha−1 in the second year) and PM (103 kg N ha−1 in the first year and 92.1 kg N ha−1 in the second year) (Table S11). In contrast, annually applied nitrogen, which was the sum of plant biomass nitrogen and fertilized nitrogen, was not different between treatments (183 to 199 kg N ha−1 in the first year, 172 to 206 kg N ha−1 in the second year). There were no significant differences between the 2-year averages of brown rice yields in CM, CMG, PM, and PMG (3.74, 3.98, 3.80, and 3.70 Mg ha−1, respectively; Table S12).

4. Discussion

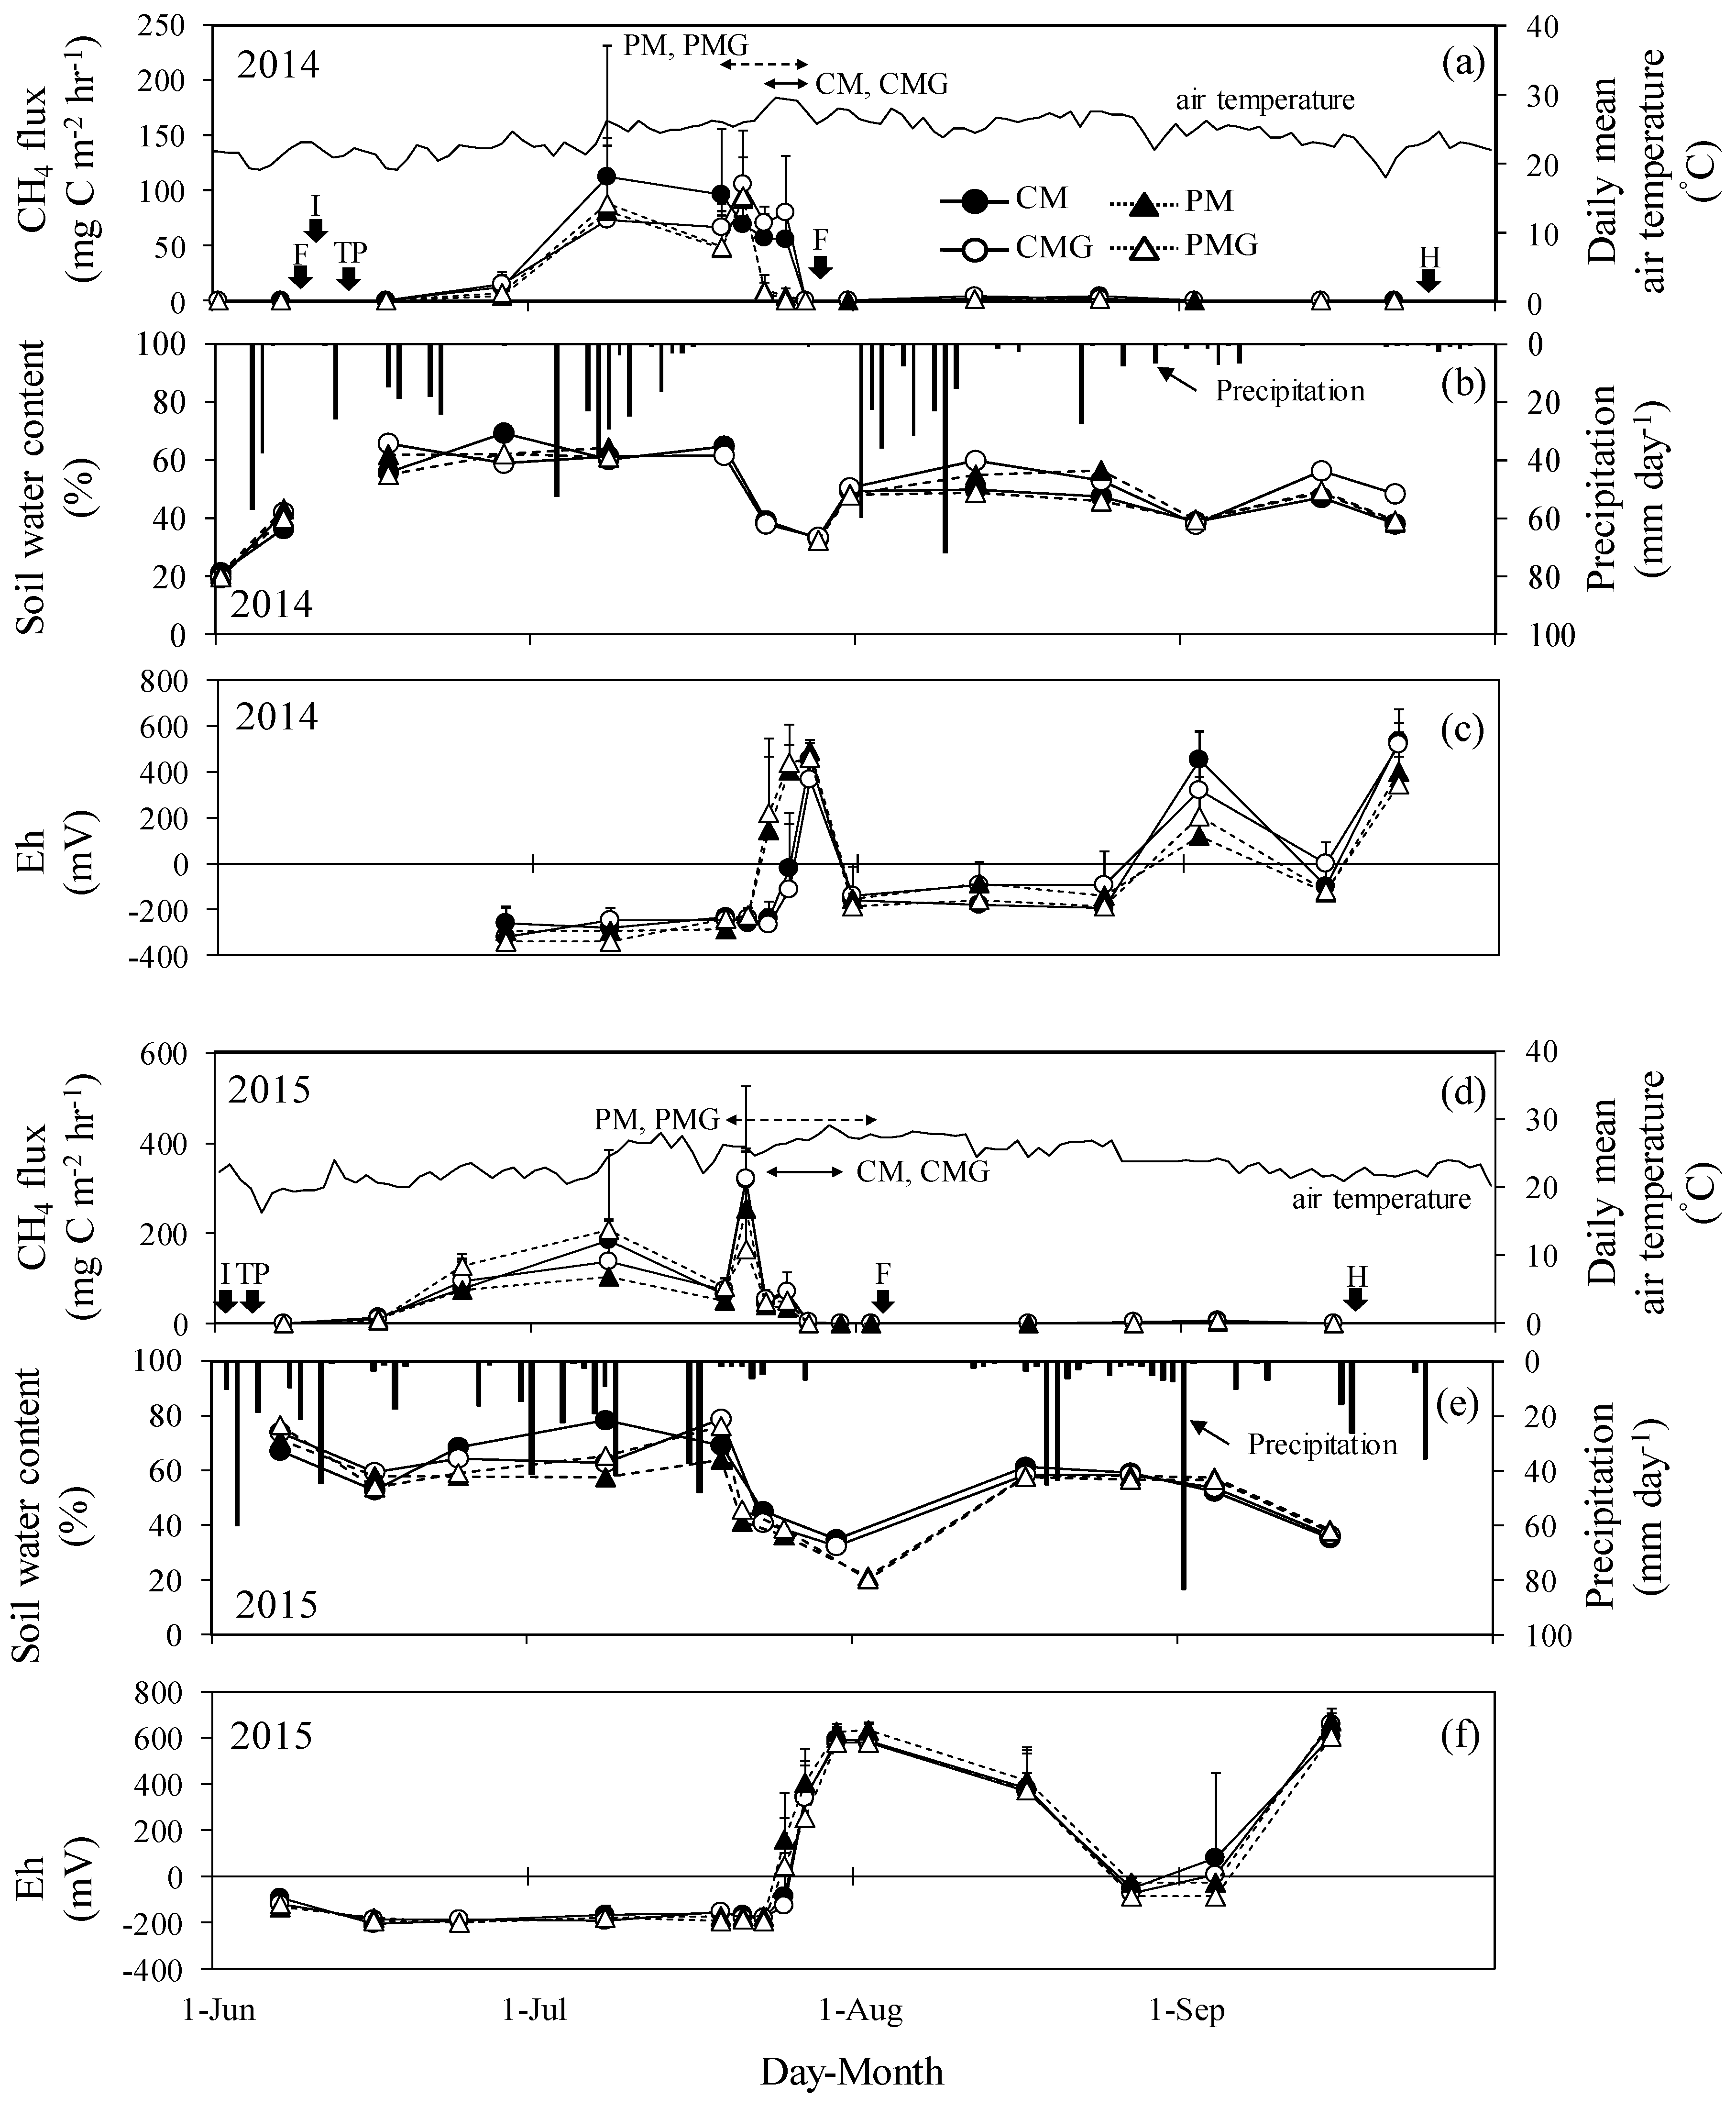
4.1. Methane Emission

The high CH4 emission observed during the growing season of rice indicates that suppressing it during this period help to reduce annual CH4 emissions significantly. Furthermore, CH4 flux increased in the early growing season and decreased during mid-season drainage in this study and in previous studies involving other nearby sites [6,7]. In Japan, CH4 flux in paddy fields has been observed to peak mostly either early or late in the growing season or both (as two peaks, Itoh et al. [17]). Therefore, the best strategy for reducing CH4 emissions is to ensure emissions to be lower early in the growing season in areas where higher CH4 fluxes are observed during that period, such as the study field used in the current study.
Although organic matter application increases CH4 emission in paddy fields [12,13], a positive correlation between CH4 emission in the early growing season and biomass carbon from green manure and weeds suggests that the lack of effect of GM application on CH4 emission is because of the incorporation of weeds and belowground biomass in all treatments. Lower air temperatures early in the growing season in the second year compared to those in the first year suggest that, rather than weather conditions, the higher application rate of plant biomass carbon increased CH4 emission during the season. Therefore, the significant effect of year on cumulative CH4 emission was because of the variation in applied carbon from plant biomass in this study. Sources of carbon for CH4 production in the early growing season originate mainly from organic carbon applied before rice cultivation [23]. Thus, results of this study show the importance of considering the total amount of incorporated biomass carbon from all three sources, i.e., green manure, weeds, and belowground biomass, for understanding the effects of green manure application on CH4 emission in paddy fields applied with green manure as basal fertilizer.
In this study, a similar amount of annual CH4 emission among different management of mid-season drainage might be due to the weather conditions during the mid-season drainage period. Especially in the second year, high CH4 fluxes and low Eh in all treatments after the starting mid-season drainage in the prolonged mid-season drainage treatments suggest that the high CH4 fluxes were due to anaerobic CH4 production under reduced conditions of soil caused by rainfall (14 mm for 4 days−1 after the starting mid-season drainage). Itoh et al. [17] reported that the percentage of CH4 emission resulting from alternative water management strategies decreased with increasing differences in no-rain days during the mid-season drainage period between alternative and conventional water-management strategies. In this study, the percentage of CH4 emission resulting from prolonged mid-season drainage (69.8% in the first year and 93.3% in the second year) was of a similar magnitude (68.5% in the first year and 98.8% in the second year) to that estimated by the difference in no-rain days during the mid-season drainage period (4 days in the first year and 0 day in the second year) between prolonged and conventional mid-season drainage treatments using the equation provided by Itoh et al. [17]. This shows that CH4 emission resulting from prolonging mid-season drainage depended on rainy days during the mid-season drainage period even in this study site. Furthermore, CH4 emission may be reduced effectively when mid-season drainage is timed based on the weather forecast.

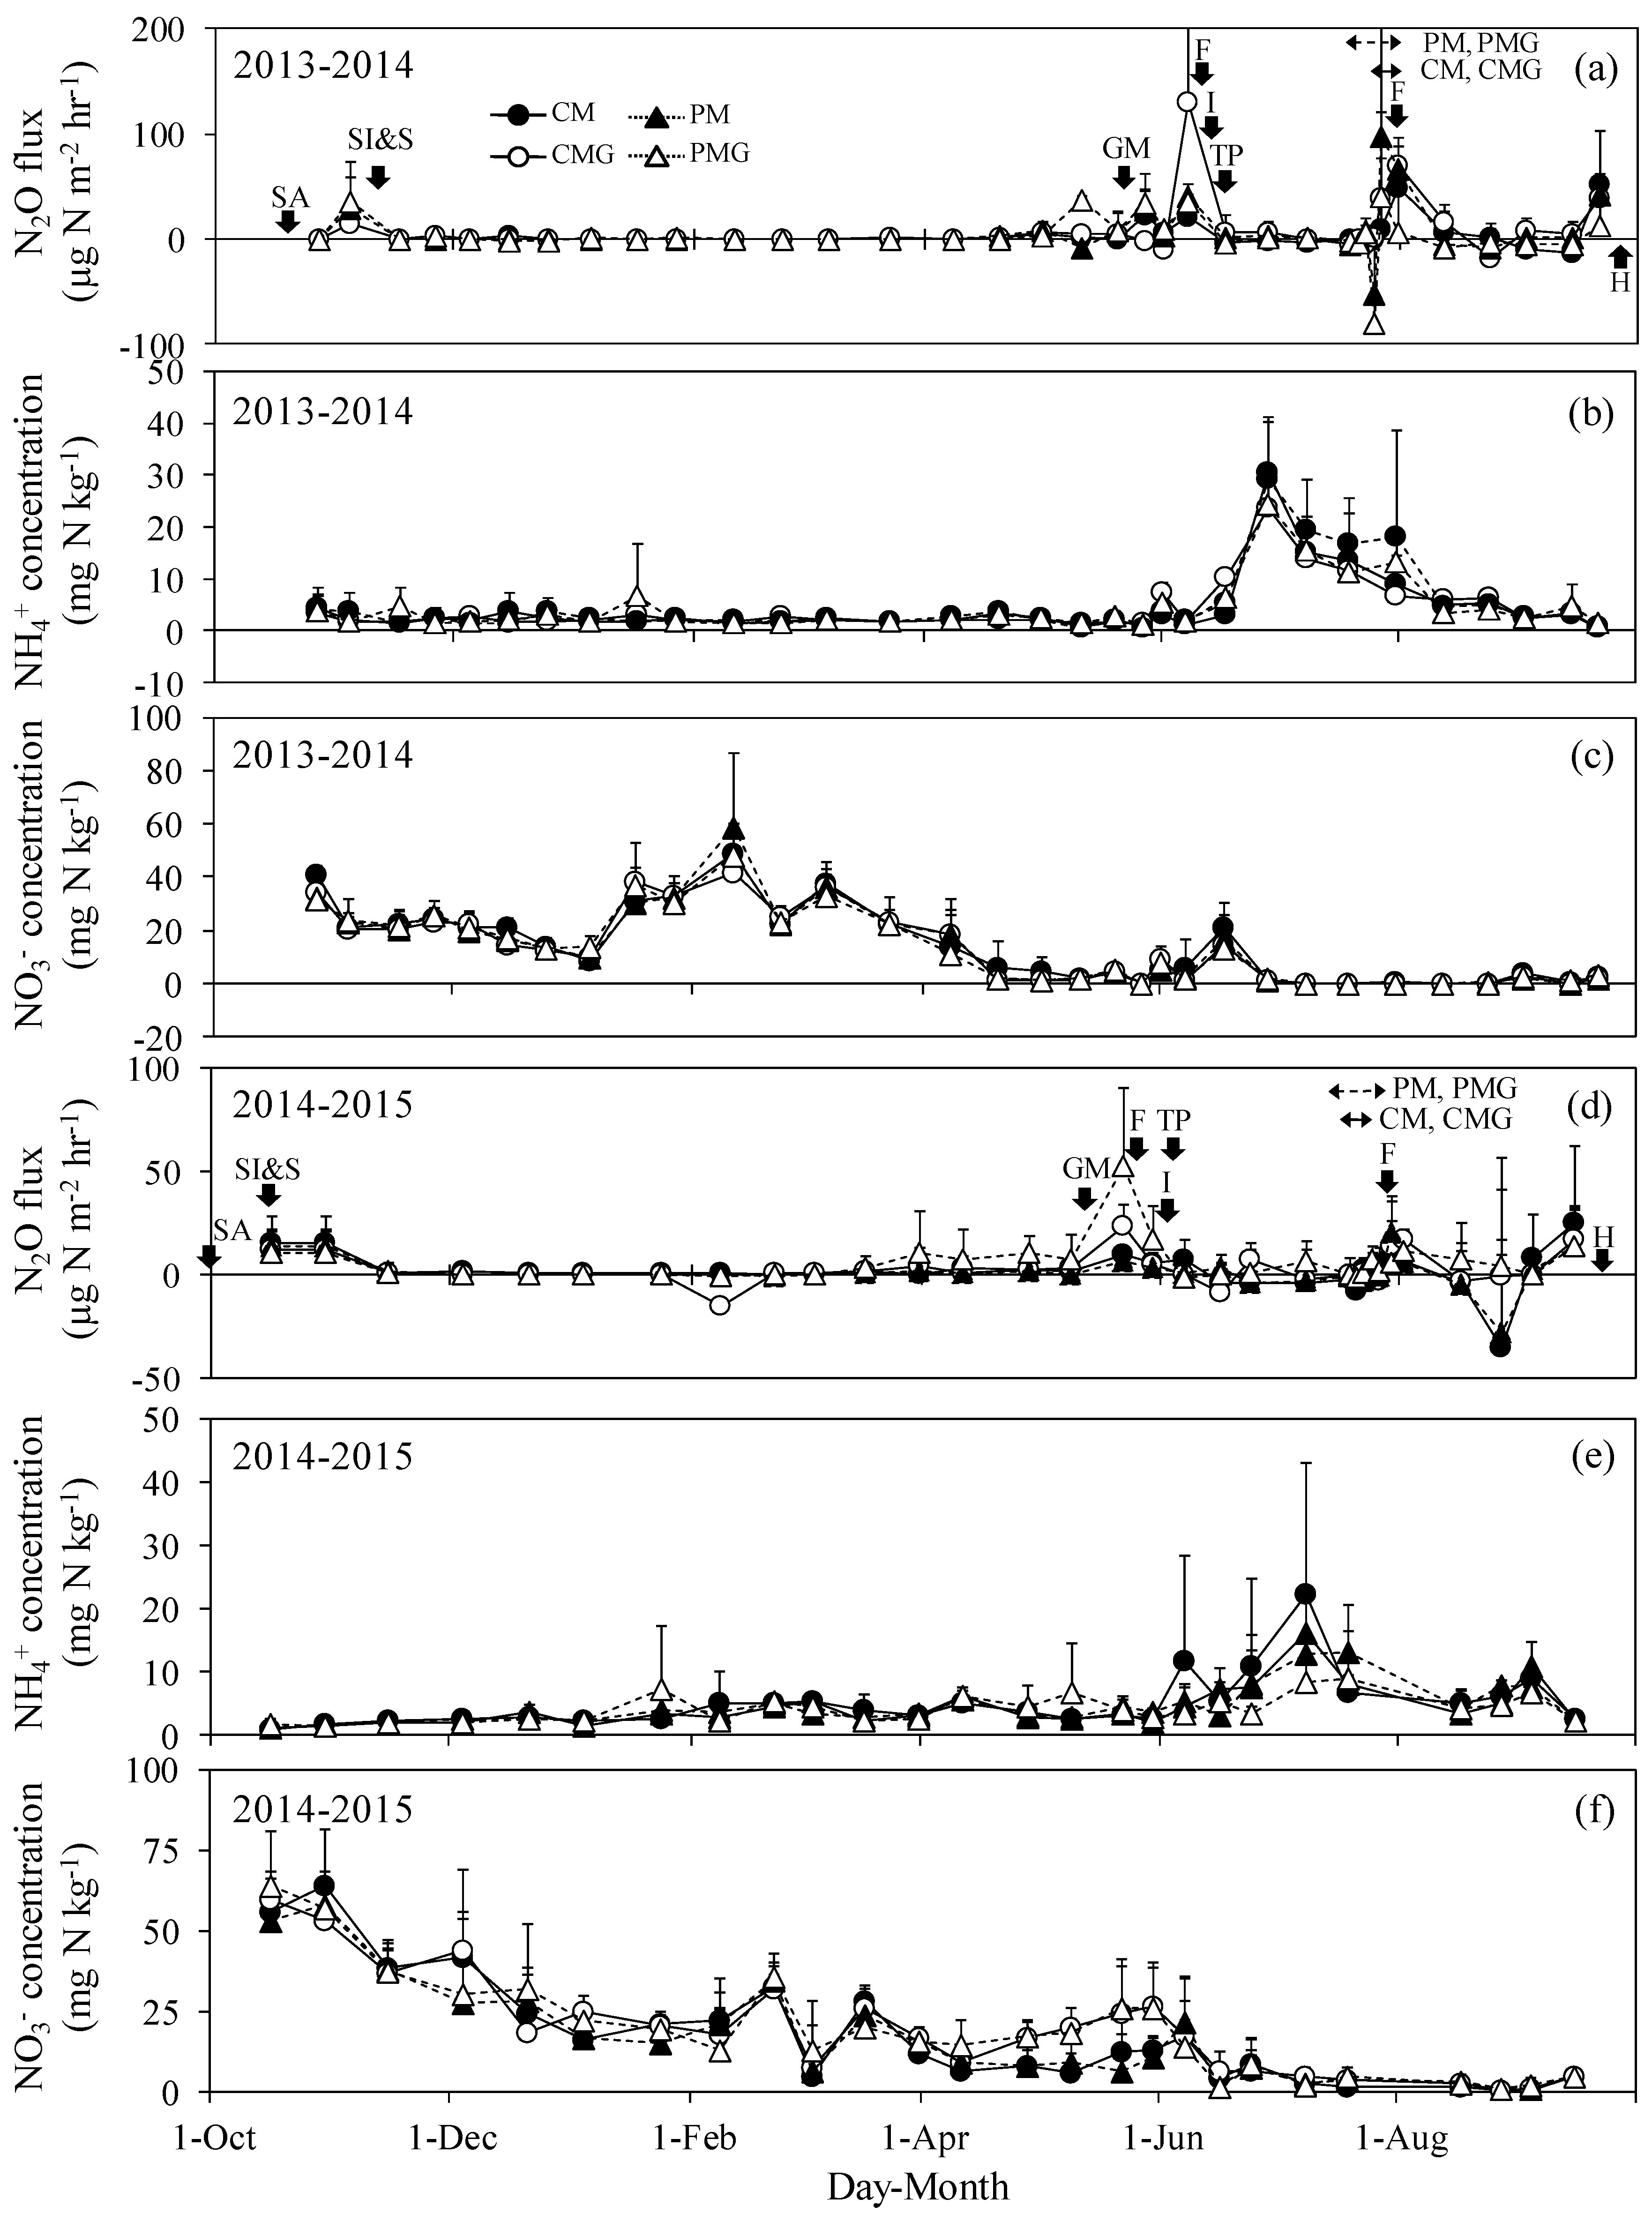
4.2. Nitrous Oxide Emission

Our study showed that the factors influencing N2O emissions in the fallow period have the biggest impact on annual N2O emissions. In the fallow season, higher N2O fluxes after incorporation of green manure but before transplanting rice seedlings and the significant positive correlation between Rh and N2O flux suggests that decomposition of organic matter increased N2O production. Increased N2O fluxes have been reported after incorporation of plant residue with low C:N ratio, e.g., legume crops [24,25]. In soil, N2O is produced mainly by microbial nitrification and denitrification [26]. The rates of these two processes are often determined by the amount of available organic matter, which supplies nitrogen for nitrification while its organic carbon works as an electron donor for denitrification. Toma and Hatano [24] and Lou et al. [27] reported that soil N2O flux was significantly positively correlated with soil CO2 flux. The lack of significant differences in N2O emission between treatments in the fallow season may be due to the high amount of weed biomass in all treatments. Because weeds could not be controlled once green manure was added, green manure application did not influence annual N2O emission. Higher emission of cumulative N2O later in the growing season in the first year compared to the second year resulted in the statistically significant effect of year on cumulative N2O emission in the late growing season and the entire growing season. The moderately reduced soil conditions demonstrated by lower Eh values and lower CH4 fluxes after mid-season drainage in the first year suggest that the soil condition was optimal for N2O production through denitrification. However, this study could not explain why N2O emission in CMG and PM was higher than that in PMG, especially just after mid-season drainage, under the different reducing conditions of soil demonstrated by changes in Fe2+ concentrations. Further studies, such as incubation experiments, may be required to understand this.

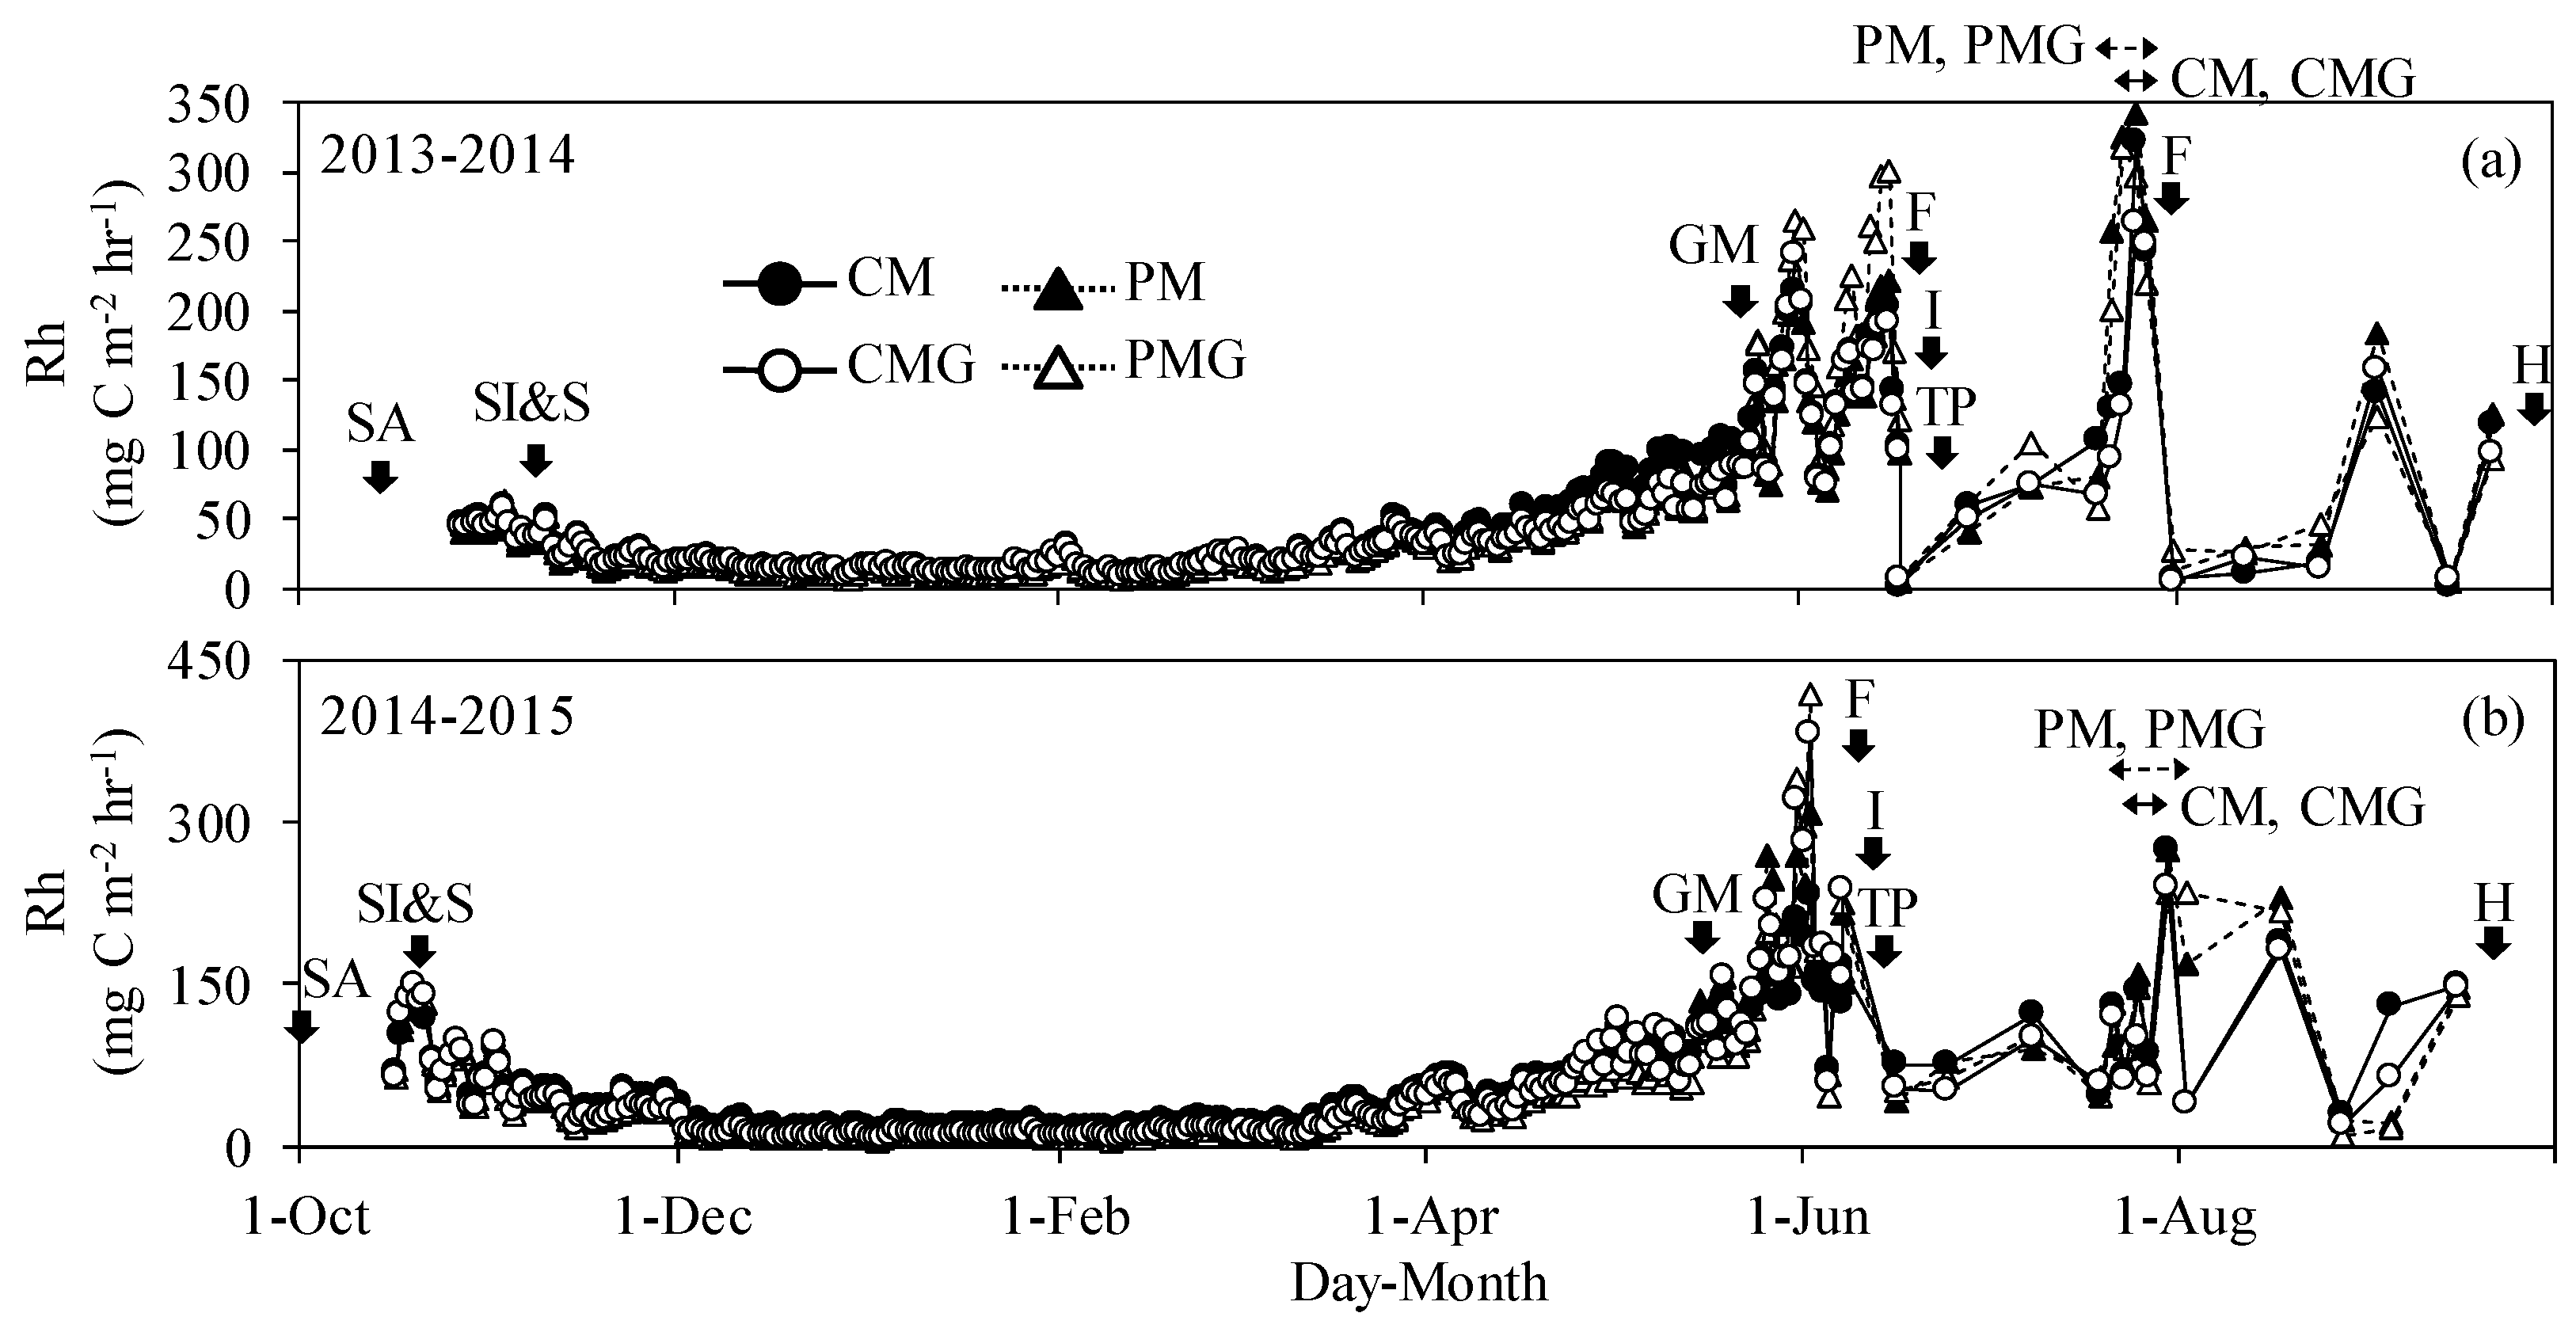
4.3. Heterotrophic Respiration

CO2 emission, defined as Rh in this study, includes CO2 released by decompositions of both green manure and other plant residues such as rice straw and weeds. Consequently, any effect of green manure application on annual Rh may have been confounded by the effect of weeds. Similar to cumulative CH4 emission, significant differences between treatments in cumulative Rh in the mid-season drainage period are because of prolonged mid-season drainage but not because of the higher potential for organic matter decomposition. Our study showed that organic matter decomposition after mid-season drainage was also affected by mid-season drainage prolongation. Although Rh generally increases with increasing soil temperature [6,28], lack of a significant relationship between Rh and soil temperature in the growing season implies that other factors, such as soil moisture, influenced Rh. Because of insufficient data on soil moisture in our study, the effect of soil water or related environmental conditions on Rh in the growing season in the second year was not analyzed.

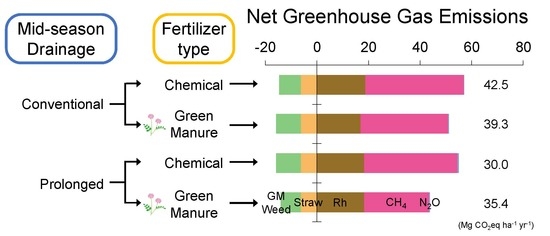
4.4. Net Greenhouse Gas Emission

Because GWPCH4 was the main contributor to NGHGE, the strategy for reducing CH4 emissions may be effective in lowering NGHGE in paddy fields. Incorporation of weeds into the soil together with green manure can increase CH4 emission, and therefore, NGHGE. The regression equations in Figure 6a and the correlation between NGHGE and applied carbon from green manure and weeds indicate that application of 1.00 Mg C ha−1 (3.77 Mg CO2eq ha−1) of biomass carbon from green manure and weeds increased GWPCH4 by 31.1 Mg CO2eq ha−1 (687 kg C ha−1) and NGHGE by 37.6 Mg CO2eq ha−1, although soil organic carbon and applied rice straw carbon were additional sources of carbon for CH4 production. Therefore, incorporation of plant biomass in the form of green manure and weeds into soil before rice transplanting offsets the benefits of carbon application and is not an effective strategy for reducing NGHGE in paddy fields. Although prolongation of mid-season drainage did not significantly reduce annual CH4 emissions and Rh in this study, CH4 emission, and therefore NGHGE, may be reduced when mid-season drainage is timed, based on the weather forecast, for increasing no-rain days. Although they are not effective strategies for mitigating global warming, both green manure application and prolongation of mid-season drainage may be acceptable for replacing chemical fertilizer to green manure while maintaining grain yield at the same NGHGE levels in rice cultivation.

5. Conclusions

This study showed that the best strategy for reducing CH4 emissions is to ensure emissions are lower early in the growing season, thought CH4 emission could be reduced effectively when mid-season drainage is timed based on the weather forecast. Although N2O emissions were larger in the fallow season and were dependent on the decomposition of organic matter incorporated, N2O emission did not influence the greenhouse gas effect in rice paddy fields because of the lower contribution of N2O to NGHGE. As an application of green manure with weed increases CH4 and Rh, which offset the sequestrated carbon, the adaption of green manure utilization was not an effective strategy for mitigating global warming. However, both green manure application and prolongation of mid-season drainage can be acceptable for utilization of green manure instead of chemical fertilizer without changing global warming while maintaining grain yield.

Supplementary Materials

The following are available online at https://www.mdpi.com/2077-0472/9/2/29/s1, Figure S1: Seasonal variations in CH4 fluxes in fallow season in the first (a) and second (b) years. Error bars represent standard deviations. SA, SI, and S, GM, and F represent straw application, incorporation, seeding, green manure and weeds incorporations, and fertilization, respectively, Figure S2: Seasonal variations in air temperature and precipitation (a), Eh (b), Fe2+ concentration (c) in the period of mid-season drainage in 2014, Figure S3: Seasonal variations in air temperature and precipitation (a), Eh (b), Fe2+ concentration (c) in the period of mid-season drainage in 2015, Table S1: Coefficients of the correlations between soil temperature at 5-cm depth and heterotrophic respiration (Rh) in fallow and growing seasons, Table S2: Cumulative CH4 emission (Mean ± SD), Table S3: Daily CH4 flux (Mean ± SD), Table S4: Cumulative N2O emission (Mean ± SD), Table S5: Daily N2O flux (Mean ± SD), Table S6: Cumulative Rh (Mean ± SD), Table S7: Daily Rh (Mean ± SD), Table S8: Spearman’s rank correlation coefficients between greenhouse gases (GHG) and applied carbon, Table S9: Spearman’s rank correlation coefficients between N2O emission and applied nitrogen, Table S10: Application rates of biomass carbon (Mean ± SD), Table S11: Application rates of plant biomass and fertilized nitrogen (Mean ± SD), Table S12: Number of panicle, 1000-grain weight, and brown rice yield (Mean ± SD).

Author Contributions

Conceptualization, Y.T., O.N., S.N., B.P. and H.U.; methodology, Y.T., S.O., O.N., S.N. and H.U.; formal analysis, Y.T., N.N.S., S.N., K.A. and S.O.; investigation, Y.T., S.N., K.A., S.O.; resources, Y.T. and H.U.; writing—original draft preparation, Y.T., N.N.S., S.N. and K.A.; writing—review and editing, O.N., S.N., B.P. and H.U.; project administration, O.N. and S.N.; funding acquisition, N.N.S. and O.N.

Funding

This research received no external funding.

Acknowledgments

We would like to express appreciation to Yoichi Yamashita, Masataka Adachi, and Keiji Ishikake in the University Farm, Faculty of Agriculture, Ehime University.

Conflicts of Interest

The authors declare no conflict of interest. The funders had no role in the design of the study; in the collection, analyses, or interpretation of data; in the writing of the manuscript, or in the decision to publish the results.

References

  1. Intergovernmental Panel on Climate Change (IPCC). Mitigation of climate change, introductory chapter: Synthesis report, summary for policymakers. In Climate Change 2014; Victor, D., Zhou, D., Ahmed, E.H.M., Dadhich, P.K., Olivier, J.G.J., Rogner, H.H., Sheikho, K., Yamaguchi, M., Grübler, A., Muvunkika, A., Eds.; Cambridge University Press: Cambridge, UK, 2014; Available online: https://www.ipcc.ch/report/ar5/wg3/ (accessed on 3 January 2019).
  2. Food and Agriculture Organization of United Nations (FAO). FAOSTAT 2001. Available online: http://www.fao.org/faostat/en/#data (accessed on 3 January 2019).
  3. Yagi, K.; Tsuruta, H.; Minami, K. Possible options for mitigating methane emission from rice cultivation. Nutr. Cycl. Agroecosyst. 1997, 49, 213–220. [Google Scholar] [CrossRef]
  4. Minamikawa, K.; Yagi, K. Possibility of water management for mitigating total emission of greenhouse gases from irrigated paddy field. In Climate Change and Crops, 1st ed.; Singh, S.N., Ed.; Springer: Berlin/Heidelberg, Germany, 2009; pp. 307–328. [Google Scholar]
  5. Akiyama, H.; Yagi, K.; Yan, X. Direct N2O emissions from rice paddy fields: Summary of available data. Glob/ Biogeochem. Cycles 2005, 19, GB1005. [Google Scholar] [CrossRef]
  6. Oomori, S.; Toma, Y.; Nagata, O.; Ueno, H. Effects of bamboo biochar application on global warming in paddy field in Ehime prefecture, Southern Japan. Soil Sci. Plant Nutr. 2016, 62, 553–560. [Google Scholar] [CrossRef]
  7. Toma, Y.; Oomori, S.; Maruyama, A.; Ueno, H.; Nagata, O. Effect of the number of tillage in fallow season and fertilizer type on greenhouse gas emission from a rice (Oryza sativa L.) paddy field in Ehime, southwestern Japan. Soil Sci. Plant Nutr. 2016, 62, 69–79. [Google Scholar] [CrossRef]
  8. Sander, B.O.; Samson, M.; Sanchez, P.B.; Valencia, K.P.; Demafelix, E.A.M.; Buresh, R. Contribution of fallow periods between rice crops to seasonal GHG emissions: Effect of water and tillage management. Soil Sci. Plant Nutr. 2018, 64, 200–209. [Google Scholar] [CrossRef]
  9. Pan, G.; Li, L.; Wu, L.; Zhang, X. Storage and sequestration potential of topsoil organic carbon in China’s paddy soil. Glob. Chang. Biol. 2004, 10, 79–92. [Google Scholar] [CrossRef]
  10. Nishimura, S.; Akiyama, H.; Sudo, S.; Fumoto, T.; Cheng, W.; Yagi, K. Combined emission of CH4 and N2O from a paddy field was reduced by preceding upland crop cultivation. Soil Sci. Plant Nutr. 2011, 57, 167–178. [Google Scholar] [CrossRef]
  11. Becker, M.; Ladha, J.K.; Ali, M. Green manure technology: Potential, usage, and limitations. A case study for lowland rice. Plant Soil. 1995, 174, 181–194. [Google Scholar] [CrossRef]
  12. Lauren, J.G.; Pettygrove, G.S.; Duxbury, J.M. Methane emissions associated with green manure amendment to flooded rice in California. Biogeochemistry 1994, 24, 53–65. [Google Scholar] [CrossRef]
  13. Lee, C.H.; Park, K.D.; Jung, K.Y.; Ali, M.A.; Lee, D.; Gutierrez, J.; Kim, P.J. Effect of Chinese milk vetch (Astragalus sinicus L.) as a green manure on rice productivity and methane emission in paddy soil. Agric. Ecosyst. Environ. 2010, 138, 343–347. [Google Scholar] [CrossRef]
  14. Toma, Y.; Maruyama, A.; Oomori, S.; Nagata, O.; Ueno, H. Study of rice (Oryza sativa L.) growth, yield, and quality, and variations of methane and nitrous oxide emissions from paddy field managed under organic farming. Bull. Exp. Farm. Fac. Agric. Ehime Univ. 2013, 35, 1–14, (In Japanese with English Summary). [Google Scholar]
  15. Yagi, K.; Tsuruta, H.; Kanda, K.; Minami, K. Effect of water management on methane emission from a Japanese rice paddy field: Automated methane monitoring. Glob. Biogeochem. Cycl. 1996, 10, 255–267. [Google Scholar] [CrossRef]
  16. Zou, J.; Huang, Y.; Zheng, X.; Wang, Y. Quantifying direct N2O emissions in paddy fields during rice growing season in mainland China: Dependence on water regime. Atmos. Environ. 2007, 41, 8030–8042. [Google Scholar] [CrossRef]
  17. Itoh, M.; Sudo, S.; Mori, S.; Saito, H.; Yoshida, T.; Shiratori, Y.; Suga, S.; Yoshikawa, N.; Suzue, Y.; Mizukami, H.; et al. Mitigation of methane emission from paddy fields by prolonging midseason drainage. Agric. Ecosyst. Environ. 2011, 141, 359–372. [Google Scholar] [CrossRef]
  18. The Fifth Committee for Soil Classification and Nomenclature. Classification System of Japan 2017. The Japanese Society of Pedology. Available online: http://pedology.jp/img/Soil%20Classification%20System%20of%20Japan.pdf (accessed on 6 January 2019).
  19. Raich, J.W.; Tefekciogul, A. Vegetation and soil respiration: Correlations and controls. Biogeochemistry 2000, 48, 71–90. [Google Scholar] [CrossRef]
  20. Toma, Y.; Fernandez, F.G.; Sato, S.; Izumi, M.; Hatano, R.; Yamada, T.; Nishiwaki, A.; Bollero, G.; Stewart, J.R. Carbon budget and methane and nitrous oxide emissions over the growing season in a Miscanthus sinensis grassland in Tomakomai, Hokkaido, Japan. GCB Bioenergy 2011, 3, 116–134. [Google Scholar] [CrossRef]
  21. Intergovernmental Panel on Climate Change (IPCC). Chapter 8 Anthropogenic and Natural Radiative Forcing. In Climate Change 2013: The Physical Science Basis; Myhre, G., Shindell, D., Breon, F.M., Collins, W., Fuglestvedt, J., Huang, J., Koch, D., Lamarque, J.F., Lee, D.S., Mendoza, B., et al., Eds.; Cambridge University Press: Cambridge, UK, 2013; Available online: http://www.ipcc.ch/report/ar5/wg1/ (accessed on 6 January 2019).
  22. R Development Core Team. A Language and Environment for Statistical Computing; R Foundation for Statistical Computing: Vienna, Austria, 2014; Available online: https://www.r-project.org/ (accessed on 6 January 2019).
  23. Watanabe, A.; Yoshida, M.; Kimura, M. Contribution of rice straw carbon to CH4 emission from rice paddies using 13C-enriched rice straw. J. Geophys. Res. 1998, 103, 8237–8242. [Google Scholar] [CrossRef]
  24. Toma, Y.; Hatano, R. Effect of crop residue C:N ratio on N2O emissions from Gray Lowland soil in Mikasa, Hokkaido, Japan. Soil Sci. Plant Nutr. 2007, 53, 198–205. [Google Scholar] [CrossRef]
  25. Shimotsuma, M.; Uchida, Y.; Nakajima, Y.; Akiyama, H. The effects of rice (Oryza sativa L. ssp. japonica) husk biochar on nitrogen dynamics during the decomposition of hairy vetch in two soils under high-soil moisture condition. Soil Sci. Plant Nutr. 2017, 63, 178–184. [Google Scholar] [CrossRef]
  26. Butterbach-Bahl, K.; Davidson, E.A.; Smith, K.A.; Smith, P.; Melillo, J.M.; Dentener, F.; Crutzen, P.J. Nitrous oxide emissions from soils: How well do we understand the processes and their controls? Philos. Trans. R. Soc. B 2013, 368. [Google Scholar] [CrossRef]
  27. Lou, Y.; Ren, L.; Li, Z.; Zhang, T.; Inubushi, K. Effect of rice residues on carbon dioxide and nitrous oxide emissions from a paddy soil of subtropical China. Water, Air Soil Pollut. 2007, 178, 157–168. [Google Scholar] [CrossRef]
  28. Boone, R.D.; Nadelhoffer, K.L.; Canary, J.D.; Kaye, J.P. Roots exert a strong influence on the temperature sensitivity of soil respiration. Nature 1998, 396, 570–572. [Google Scholar] [CrossRef]
Figure 1. Seasonal variations in daily mean air temperature and CH4 flux (a,d), precipitation and soil water content (b,e), and Eh (c,f) during the growing season. Error bars represent standard deviations. I, F, TP, and H represent irrigation, fertilization, transplanting, and harvest, respectively. Arrows of the continuous and dotted lines show the periods of mid-season drainage.
Agriculture 09 00029 g001
Figure 2. Seasonal variations in N2O flux (a,d), ammonium (NH4+) concentration (b,e), and nitrate (NO3) concentration (c,f). Error bars represent standard deviations. SA, SI, and S represent straw application, incorporation, and seeding, respectively. GM, I, F, TP, and H represent green manure and weeds incorporations, irrigation, fertilization, transplanting, and harvest, respectively. Arrows of the continuous and dotted lines show the periods of mid-season drainage.
Agriculture 09 00029 g002
Figure 3. Seasonal variations in heterotrophic respiration (Rh) in the first (a) and second (b) years Error bars represent standard deviations. SA, SI, and S represent straw application, incorporation, and seeding, respectively. GM, I, F, TP, and H represent green manure and weeds incorporations, irrigation, fertilization, transplanting, and harvest, respectively. Arrows of the continuous and dotted lines show the periods of mid-season drainage.
Agriculture 09 00029 g003
Figure 4. Cumulative CH4 (a,b) and N2O (c,d) emissions and heterotrophic respirations (Rh) (e,f). Number in the figures represent annual emission of CH4, N2O, and Rh. Left and right figures represent the data collected in the first (2013–2014) and the second (2014–2015) years, respectively.
Agriculture 09 00029 g004
Figure 5. Relationship between heterotrophic respiration (Rh) and N2O flux in fallow season in the first (a) and second (b) years.
Agriculture 09 00029 g005
Figure 6. Relationship between biomass carbon in green manure and weed and CH4 emission in early growing season (a), above-ground biomass carbon in weed and N2O emission in late growing season (b), and biomass carbon in green manure and weed and annual heterotrophic respiration (Rh) (c) in the first (2013–2014) and second (2014–2015) years. Error bars represent standard deviations.
Agriculture 09 00029 g006
Table 1. Field management practice.
ManagementFirst YearSecond Year
Treatment Treatment
YearCM & CMGPM & PMGYearCM & CMGPM & PMG
Rice straw application201317 October, 8 November20141&17 October
Straw incorporation8 November20 October
Green manureseeding8 November20 October
cutting201417 May201515 May
incorporation 22 May18 May
Basal fertilization9 June30 May
Starting irrigation14 June1 June
Transplanting16 June5 June
Mid-season drainagestart23 July19 July23 July19 July
end28 July28 July30 July2 August
(days)59714
Supplemental fertilization28 July2 August
Harvest21 September15 September
CM: conventional mid-season drainage, CMG: conventional mid-season drainage with green manure application, PM: prolonged mid-season drainage, PMG: prolonged mid-season drainage with green manure application. †: Only weeds were incorporated in CM and PM.
Table 2. Accumulation period of methane and nitrous oxide emissions and heterotrophic respiration.
YearTreatmentAnnualFallow SeasonRice Growing Season
Early GrowingMidseason DrainageLate Growing
2013–2014CM27 October–21 September
(329 days)
27 October–17 June
(233 days)
17 June–23 July
(36 days)
23–28 July
(5 days)
28 July–21 September
(55 days)
CMG
PM17 June–19 July
(32 days)
19–28 July
(9 days)
PMG
2014–2015CM16 October–15 September
(334 days)
16 October–7 June
(234 days)
7 June–23 July
(46 days)
23–30 July
(7 days)
30 July–15 September
(47 days)
CMG
PM7 June–19 July
(42 days)
19 July–2 August
(14 days)
2 August–15 September
(44 days)
PMG
CM: conventional mid-season drainage, CMG: conventional mid-season drainage with green manure application, PM: prolonged mid-season drainage, PMG: prolonged mid-season drainage with green manure application.
Table 3. Net greenhouse gas emission (NGHGE) (Mean ± SD).
YearTreatmentGWPRSGWPGMGWPRhGWPCH4GWPN2ONGHGE
(Mg CO2eq ha−1 year−1)
2013–2014CM−8.47−7.5714.926.00.1124.9 ± 16.9
CMG−8.3613.821.20.2718.4 ± 8.14
PM−6.1715.015.90.1916.5 ± 12.0
PMG−8.4715.517.00.1415.7 ± 7.09
PMDna0.360.400.220.670.36
GM<0.050.770.740.390.54
MD × GM0.290.480.600.100.64
2014–2015CM−4.12−9.2219.650.40.0656.7 ± 13.7
CMG−10.617.746.60.0849.6 ± 8.80
PM−9.0519.734.80.0341.4 ± 12.1
PMG−10.418.555.70.2159.9 ± 22.4
PMDna0.860.790.670.430.77
GM0.100.410.270.130.46
MD × GM0.960.850.120.210.12
2013–2015CM−6.30−8.4017.238.20.0940.8 ± 14.0
CMG−9.4515.833.90.1834.0 ± 4.22
PM−7.6117.425.30.1128.9 ± 9.02
PMG−9.4617.036.30.1737.8 ± 11.1
PMDna0.450.510.270.800.40
GM<0.010.380.470.090.83
Year<0.01<0.001<0.010.06<0.001
MD × GM0.450.600.110.720.12
MD × Year0.660.840.680.390.75
GM × Year0.860.560.270.630.34
MD × GM × Year0.490.850.31<0.050.31
GWPRS, GWPGM, GWPRh, GWPCH4, and GWPN2O represent carbon dioxide equivalent values of applied carbon in rice straw, green manure and weeds, Rh, CH4 emission, and N2O emission, respectively. CM: conventional mid-season drainage, CMG: conventional mid-season drainage with green manure application, PM: prolonged mid-season drainage, PMG: prolonged mid-season drainage with green manure application. P values represent the results of two- or thee way ANOVA between mid-season drainage (MD) prolongation, green manure (GM) application, and year. Bold values represent statistically significant.
Table 4. Mean air temperature and mean daily precipitation in each period.
YearTreatmentAnnualFallow SeasonRice Growing Season
Early GrowingMidseason DrainageLate Growing
2013–2014CM15.8 °C
4.37 mm
12.0 °C
3.76 mm
23.5 °C
7.71 mm
28.3 °C
0.17 mm
24.8 °C
5.35 mm
CMG
PM23.2 °C
8.67 mm
27.3 °C
0.10 mm
PMG
2014–2015CM16.1 °C
4.49 mm
12.4 °C
3.80 mm
22.7 °C
7.91 mm
27.1 °C
1.38 mm
24.4 °C
5.39 mm
CMG
PM22.5 °C
8.40 mm
26.8 °C
1.47 mm
24.2 °C
5.13 mm
PMG
CM: conventional mid-season drainage, CMG: conventional mid-season drainage with green manure application, PM: prolonged mid-season drainage, PMG: prolonged mid-season drainage with green manure application.

