Article

Growth Strategy of Rhizomatous and Non-Rhizomatous Tall Fescue Populations in Response to Defoliation

1
Faculty of Agriculture and Life Sciences, Lincoln University, P.O. Box 85084, Lincoln 7647, New Zealand
2
Institute of Agriculture and Environment, Massey University, Private Bag 11-222, Palmerston North 4442, New Zealand
*
Author to whom correspondence should be addressed.
Agriculture 2015, 5(3), 791-805; https://doi.org/10.3390/agriculture5030791
Submission received: 6 July 2015 / Revised: 27 August 2015 / Accepted: 7 September 2015 / Published: 11 September 2015
(This article belongs to the Special Issue Forage Plant Ecophysiology)

Abstract

:
The aim of this study was to determine the morphology of rhizome production, in two contrasting rhizomatous (R) and non-rhizomatous (NR) tall fescue (Schedonorus arundinaceus (Schreb.) Dumort) populations, and to assess whether rhizome production is associated with changed biomass allocation or plant growth pattern. Growth of R and NR populations was compared, under hard defoliation (H, 50 mm stubble), lax defoliation (L, 100 mm stubble), or without defoliation (U, uncut). Populations were cloned and grown in a glasshouse and defoliated every three weeks, with destructive harvests performed at 6, 12 and 18 weeks. R plants allocated more biomass to root and less to pseudostem than NR plants. Plant tiller numbers were greatly reduced by defoliation, and R and NR populations differed in leaf formation strategy. R plants had narrower leaves than NR, but their leaves were longer, because of greater leaf elongation duration. R plants were more plastic than NR plants in response to defoliation. Ultimately, biomass allocation to rhizomes did not differ between populations but R plants exhibited a subtle shift in distribution of internode length with a few longer internode segments typically located on secondary and tertiary tillers.

1. Introduction

Tall fescue (Schedonorus arundinaceus (Schreb.) Dumort) is a genetically diverse species which can exhibit a wide range of variation in tiller size, leaf appearance rate and leaf elongation rate [1]. Such variation has been the basis for a number of studies of ecophysiology of the species. For example, lines of plants selected for contrasting leaf elongation rate (LER) showed consistent morphological characteristics. Plants with high LER had high yield per tiller, large tiller size and few tillers per plant while low LER plants had small tillers with higher tiller number per plant [2,3].
Such behavioural differences arise ultimately from differences in expression of the same basic morphology. Tillers are formed from axillary buds. Therefore, each new leaf which appears has the potential to produce a tiller from an axillary bud. In young plants the appearance of new leaves and tillers is synchronous at corresponding sites across successive tiller generations. However, as plants mature, leaf and tiller appearance becomes non-synchronous between generations, and many sites they do not form tillers. In tall fescue plants, buds at these sites often remain viable and typically form a spherical shape [4]. Site filling is one measure of the frequency of tiller production from undeveloped buds and is calculated from the ratio between tiller appearance and leaf appearance rates [5]. The example mentioned previously illustrates that different plant populations may prioritize the use of assimilates differently, either in favour of leaf extension or tiller appearance. Defoliation, especially more severe defoliation, results in rapid depletion of non-structural carbohydrate reserves in the plant [6], and can modify such responses.
Another feature of tall fescue morphology is the formation, by internode elongation, of stolons and rhizomes. Although stolons and rhizomes are anatomically similar [7], rhizome development is the elongation of internodes to form horizontal shoots below the soil surface. Rhizomes have reduced scale-like leaves at each node and their tips turn upwards, forming new tillers some distance from the parent plant with laminate leaves above ground. Stolons are formed from basal internode elongation as new tillers form adjacent to the parent plant, without a prior period of horizontal growth. Because of their anatomical similarity, rhizomes and stolons have been referred to collectively as true stems [8], to emphasise their anatomical distinctness from pseudostems formed from rolled leaf sheaths and holding leaf laminae to the light.
It has been reported [4] that rhizomes were more likely to occur at down-facing axillary buds. These buds tended to be those which had been dormant for a period and had taken on a spherical shape. Stolon and rhizome formation on a per plant basis has also been quantified in Grasslands Roa tall fescue [9], however, factors determining rhizome initiation and details of site of initiation and numbers and lengths of internodes comprising each rhizome are largely unknown.
The objectives of this study were to quantify the morphology of differences in rhizome production between rhizomatous and non-rhizomatous tall fescue populations, in order to better understand their visually dramatic contrast in degree of rhizome formation, and to determine whether effects on tiller and leaf production attributable to the energy cost of rhizome production could be observed.

2. Experimental Section

2.1. Plant Preparation and Management

Two populations of tall fescue (Schedonorus arundinaceus (Schreb.) Dumort, previously Festuca arundinacea (Schreb.)) were compared; a standard non-rhizomatous (NR) population and a strongly rhizomatous (R) population. The standard NR population was derived from a cross between USA turf cultivars Tribute and Rebel, and exhibited no visually obvious rhizomatous behavior. The second population, a third generation cross from germplasm of a local ecotype collected in Spain and Portugal, had been selected specifically for rhizomatous behavior visually evident when the original germplasm was collected.
In April 1997 sods from established two year old swards of both populations were washed free of soil, divided into clones of single rooted tillers and planted into 500 mL plastic pots. Use of planting material from established swards was to ensure that immediate expression of rhizomes would occur in the rhizomatous population [10]. Two weeks later developing plants were transplanted into 5 L pots of a 50:50 sterile sand and soil mixture and supplemented with 2.5 g/L slow release fertiliser (NPK 15:4.8:10.8 Osmocote® Pro Everris, Geldermalsen, The Netherlands). Plants were maintained in a temperature controlled glasshouse (16 to 24 °C), under natural daylight, at the Massey University Plant Growth Unit in Palmerston North between April and September 1997 (40°20′ S).
The experimental design was a 2 × 3 × 3 factorial, comprising the R and NR populations, three defoliation treatments and three destructive harvests. There were four replicates, giving 72 pots in total. The three defoliation treatments were: hard defoliation (H, 50 mm stubble); lax defoliation (L, 100 mm stubble); and undefoliated (U). Defoliation treatments began when all pots contained a minimum of five tillers and subsequently every three weeks over 15 weeks. Plants were grown on for a further three weeks after the last defoliation, giving six three-week regrowth intervals in total.

2.2. Measurements

Non-destructive measurements of leaf length (one random tiller per pot) and total tiller number per plant were performed weekly on marked tillers and leaves of a randomly chosen adult tiller. From the weekly leaf length measurements it was possible to calculate leaf appearance rate (LAR), leaf elongation (LER) and senescence rates (SR) in units of mm per tiller per day. Tiller numbers per plant were counted once a week and site filling was determined from the ratio between LAR and relative tiller appearance rate (RTA) which was then used to calculate site usage [11].
Three destructive harvests, were carried out at six week intervals, coinciding with the conclusion of each alternate three week regrowth period. At destructive harvests, designated plants were removed from pots and washed free from soil. Primary tillers were removed sequentially from the original clone, recording the nodal position of each successive tiller removed, and associated daughter tillers categorized as either secondary or tertiary tillers. The original intention was to record numbers of tillers forming stolons and rhizomes, as in the study of Hume and Brock [9], but it was found that no clear distinction could be made between stolons and rhizomes. This was due to a continuous gradation in morphology from tillers with a small amount of internode elongation at one or two phytomers to tillers with fully formed rhizomes 100 mm or more in length. This phenomena has been depicted and described previously [4]. Accordingly, true stem length for each internode of all tillers was measured and stolons and rhizomes are not differentiated in the data presented here. After measurement of true stem length, tillers were dissected into leaf, pseudostem, true stem (stolon and rhizome), and root for primary, secondary, and tertiary tillers, and dry weights obtained for each herbage component.

2.3. Statistical Analysis

Population and defoliation effects on tiller component dry weight, tiller number, LAR, LER, SR were compared by a factorial two way analysis of variance (ANOVA) model using the general linear model (GLM) procedure in Statistical Analysis System (SAS Institute Inc, Cary, NC, USA) to identify population (R, NR) and defoliation (H, L, U) effects. Data from different harvests were analysed separately. RTAR values and their standard errors were obtained by regression of log (plant tiller number) on time. Due diligence was exercised with respect to statistical assumptions. Repeat measures analyses were not required for multiple harvest dates since a different potted plant was destructively harvested on each date and data for each harvest date was analysed separately; comparison of R and NR populations is not subject to variance heterogeneity concerns because only two treatments are being compared. In one case where plant size differences from grazing effects were felt serious, loge transformation was employed. There were no obvious reasons for non-normal distribution of residuals such as numbers of zeroes in the data set needing to be addressed, and normal probability plots in Minitab v. 10.5 (Minitab Pty Ltd., Sydney, Australia) for a selection of reported variables were near linear with P-values > 0.05 for the Anderson-Darling A2 statistic.

3. Results

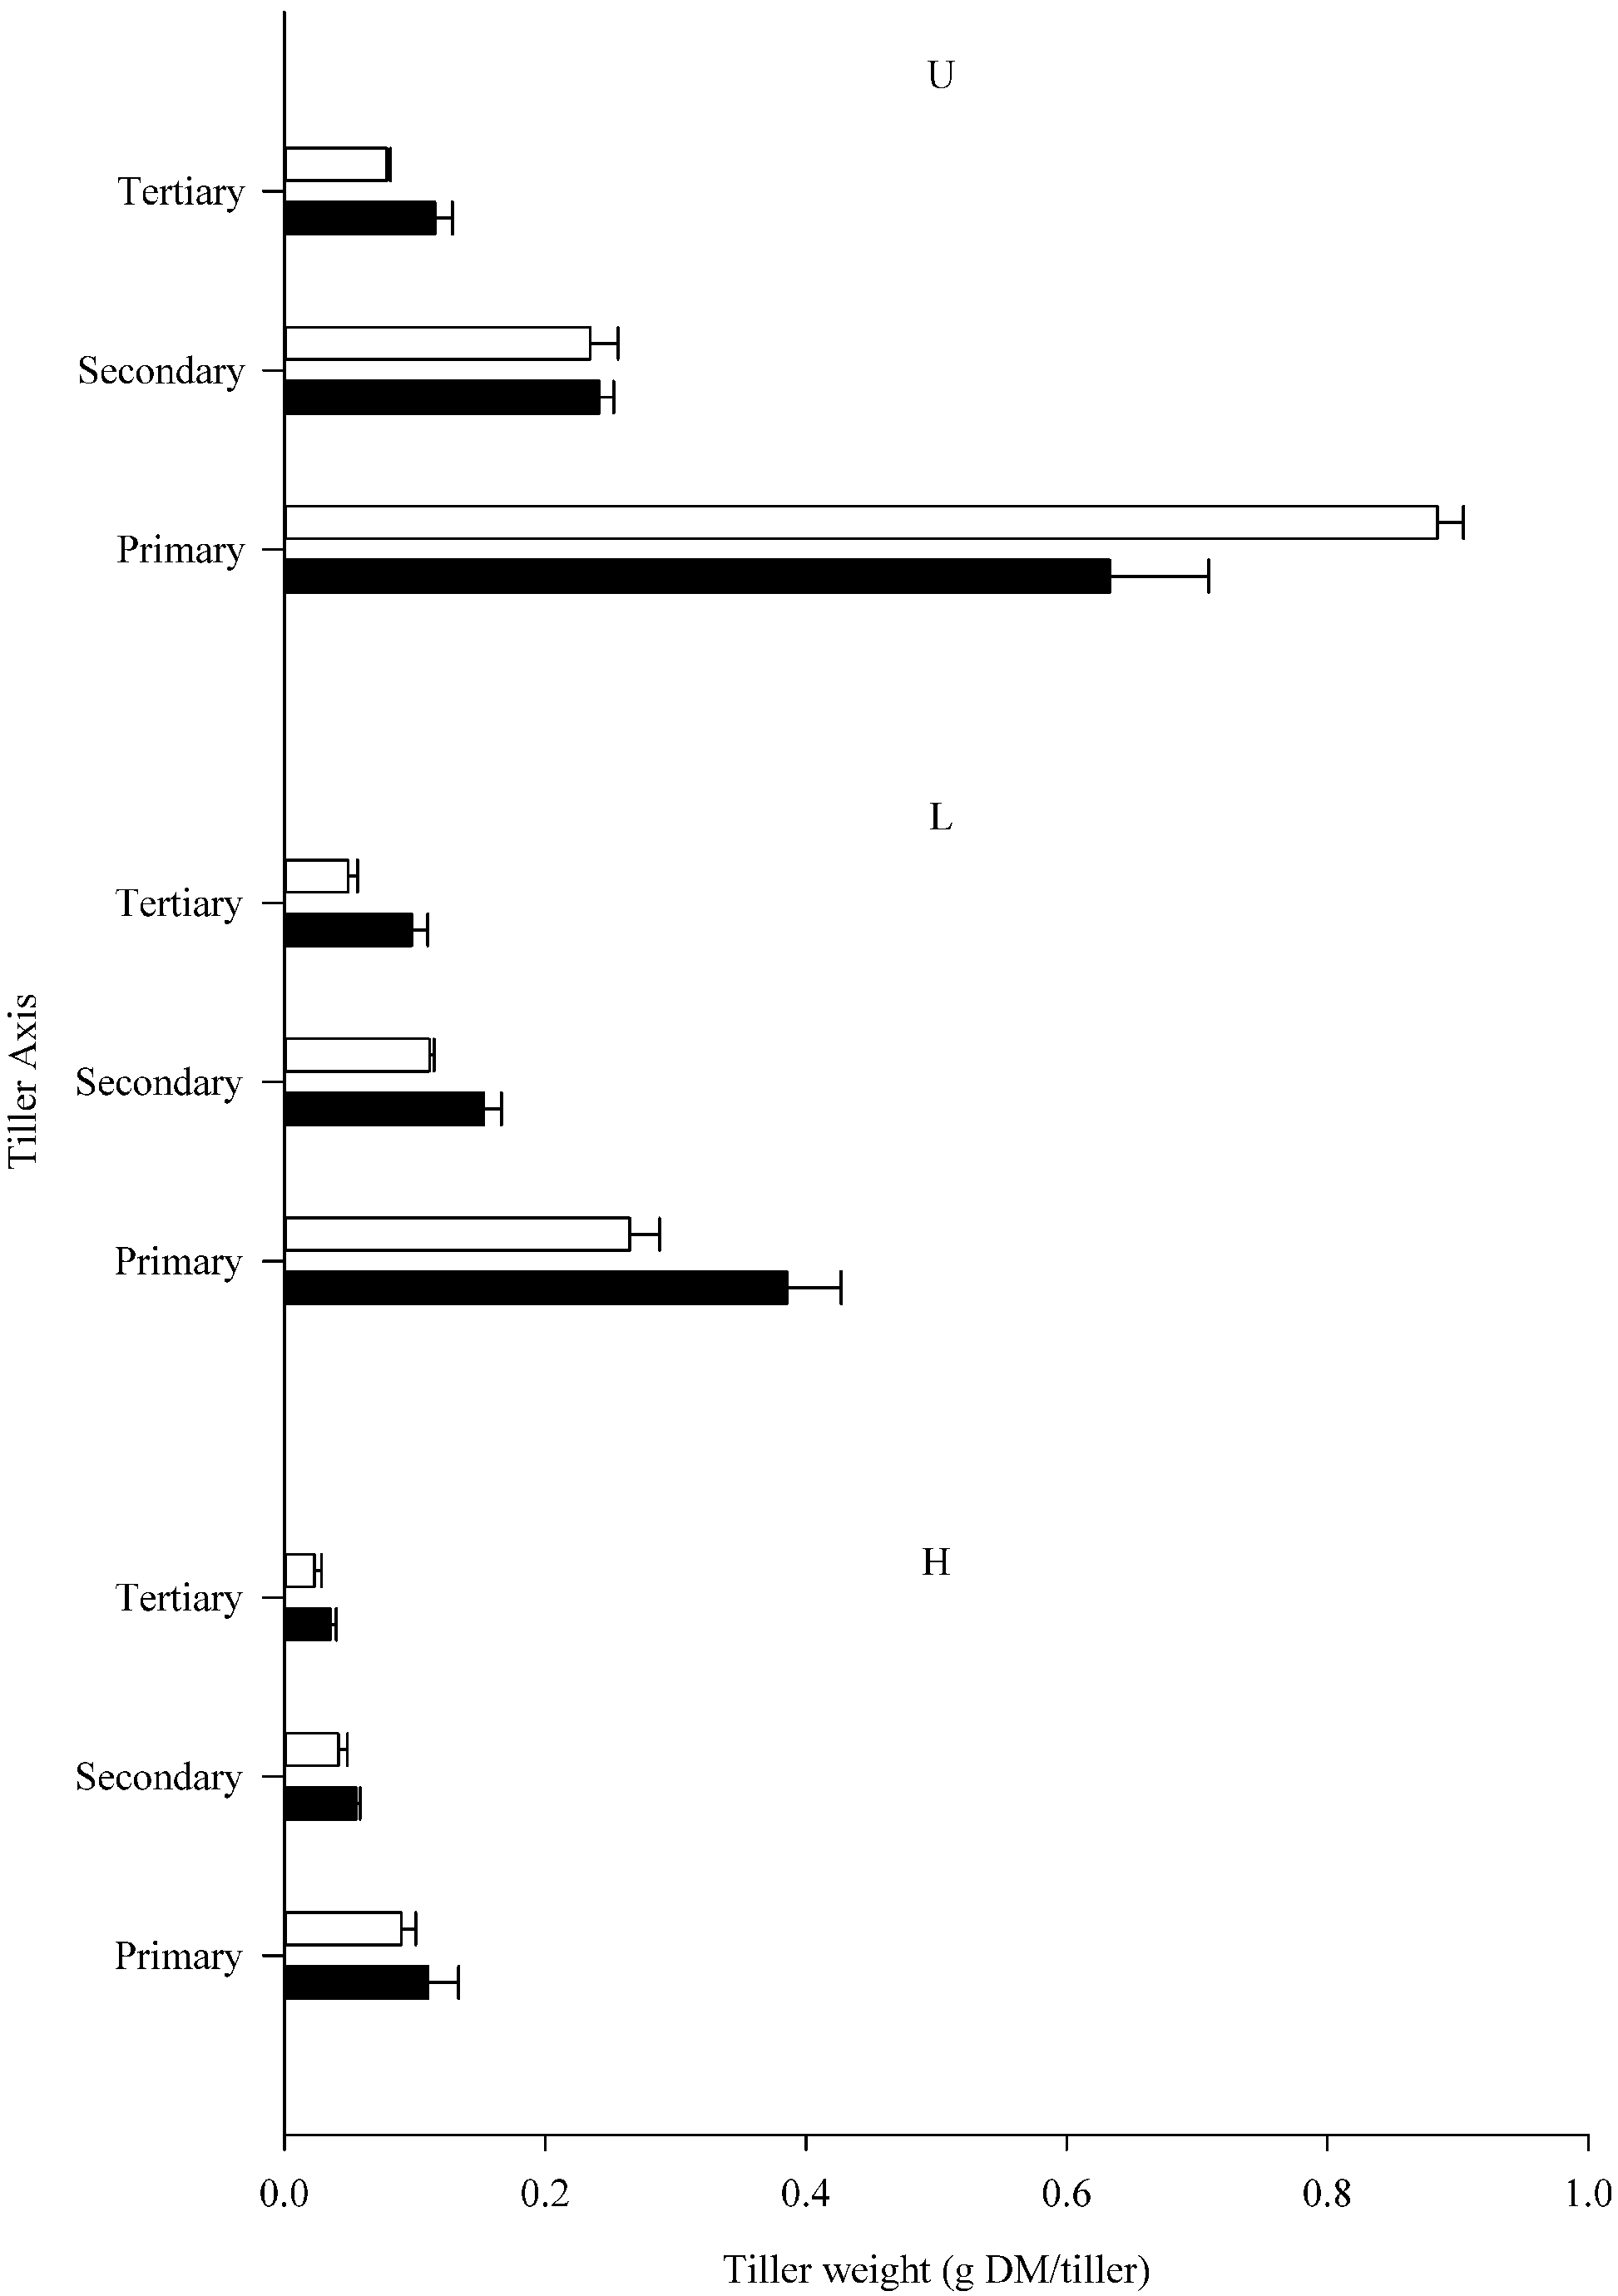
3.1. Plant Yield and Tiller Production

In both populations plant dry weight was reduced nearly tenfold by the H defoliation treatment (p < 0.001), with decrease in tiller dry weight (Table 1) and tiller number (Table 2) being approximately 80% and 40%, respectively. Total herbage weight was very similar for the two populations when no defoliation occurred, but defoliation reduced dry matter (DM) more dramatically for R than for NR population (L 68% and 42%, H 90% and 85%, p < 0.05; Table 1). However, despite a large reduction in plant leaf mass across defoliation treatments and a smaller reduction in the R population compared to NR population, the % allocation of plant biomass to leaf was remarkably conserved across grazing management treatments and between populations (Table 1). Interestingly, the R and NR populations did not differ significantly in true stem mass per plant although there was trend to higher % allocation of biomass to true stem in the R population. Rather, the differential response between populations to defoliation, as reflected by a significant defoliation × population interaction, was observed in the pseudostem and root fractions. The R population had less pseudostem and more root than the NR population but a marked tendency to reduce % biomass allocation to roots under more intensive defoliation pressure (Table 1).
Table 1. Contribution of tiller components to plant weight (g DM) of non-rhizomatous (NR) and rhizomatous (R) tall fescue populations undefoliated (U), or under lax (L) or hard (H) defoliation treatments.
LeafPseudostemTrue StemRootRoot:ShootTotalTiller Weight
NRU17.9 (43)11.4 (27)3.6 (8)9.2 (22)0.2841.90.22
L8.8 (41)5.9 (28)2.4 (11)4.7 (20)0.2621.70.16
H2.7 (43)1.6 (27)0.7 (11)1.3 (21)0.276.40.06
Mean 9.776.312.225.070.2723.40.15
RU15.2 (38)8.1 (20)4.3 (11)12.7 (32)0.4740.40.21
L6.2 (41)3.3 (22)1.9 (13)3.8 (25)0.3315.30.09
H1.7 (42)1.0 (23)0.6 (15)0.8 (20)0.254.10.04
Mean 7.734.132.295.770.3519.90.12
SE 0.800.470.320.770.0322.010.0092
SignifPopln*****NSNS******
Cut********************
P × CNS*NS***,LT**
NS, not significant; * p < 0.05; ** p < 0.01; *** p < 0.001. Percentage of total mass shown in parentheses. LT denotes analysis performed on log-transformed data to remove heterogeneity of error variance across treatments with a tenfold difference in plant dry weight.
Table 2. Tiller numbers per plant, categorized by position on the tiller axis, on non-rhizomatous (NR) and rhizomatous (R) populations undefoliated (U), or under lax (L) or hard (H) defoliation after a 12 or 18 week growing period.
12 Weeks18 Weeks
PrimarySecondaryTertiaryTotalPrimarySecondaryTertiaryTotal
NRU1645441041971102192
L15422077165757130
H11261350175149117
Mean 14382577176069146
RU133531791772100189
L9302664155797169
H8231949113856105
Mean 10292564145684154
SEM 7.81.34.04.11.65.49.812.8
Sig.Popln****NSNS*NSNSNS
Cut********************
P × CNSNSNSNSNSNSNSNS
NS, not significant; * p < 0.05; ** p < 0.01; *** p < 0.001. Percentage of total mass shown in parentheses.
The total number of tillers per plant did not differ between populations. However, some differences in growth patterns between the two populations became evident when tillers were categorised into primary, secondary or tertiary tillers. Decrease in tiller number following defoliation, regardless of category, was consistent for both populations. After 12 weeks the NR plants had, averaged across defoliation treatments, 40% more primary tillers (p < 0.001) and 31% more secondary tillers (p < 0.05), but similar numbers of tertiary tillers compared with R plants (Table 2). By week 18 there were more primary tillers on the NR, compared with R, population (p < 0.05). However, the effect of population on secondary and tertiary tillers was not significant, even though, numerically, the proportion of whole plant tillers accounted for by tertiary tillers was greater for the R population. Differences between populations in leaf appearance and site filling (see below, Table 3) led to a higher relative tiller appearance rate in the R than the NR population. As a result, the average number of tillers per plant at the end of the experiment was similar for both populations (Table 2).
Table 3. Effect of defoliation on relative tiller appearance (for initial and final stages of development, ± standard error), and calculated rates of site filling and site usage. Data are for non-rhizomatous (NR) or rhizomatous (R) populations undefoliated (U) or under lax (L) or hard (H) defoliation.
Relative Tiller Appearance (No. obs) (Tillers/Tiller/Day)Site Filling 1Site Usage 2
OverallInitialFinal
NRU0.022 ± 0.0011 (17)0.030 ± 0.0011 (11)0.016 ± 0.0008 (6)0.160.17
L0.021 ± 0.0005 (17)N/A0.014 ± 0.0009 (6)0.140.15
H0.017 ± 0.0006 (17)N/A0.020 ± 0.0011 (6)0.180.20
RU0.025 ± 0.0007 (17)0.028 ± 0.006 (11)0.018 ± 0.0012 (6)0.300.35
L0.024 ± 0.0004 (17)N/A0.024 ± 0.0008 (6)0.300.35
H0.021 ± 0.0007 (17)N/A0.027 ± 0.0013 (6)0.300.35
1 Ratio between tiller appearance and leaf appearance rates; 2 percentage of tiller sites which produce tillers; N/A is not applicable.
Relative tiller appearance (RTA) expressed as tillers/tiller/day was calculated for each population, both as the average for the entire experimental period and as the average for the final six weeks of measurement (Table 3). Throughout the observation period rhizomatous tall fescue had the highest RTA and this was attributed to a higher site filling ratio (Fs) or equivalently higher site usage (Table 3). Over the final six weeks of measurement, RTA began to decline (Table 3), particularly for U and L defoliated plants, which by this time, had comparatively high numbers of tillers (Table 2).
Mean tiller weight, including both above and below ground mass, was 0.208 g DM across treatments and did not differ between populations. However, an interaction (p < 0.001) between population, defoliation treatment, and tiller position revealed that while tiller weight was less for tertiary tillers, and defoliation further reduced tiller weight, the R population was more negatively affected by defoliation than the NR treatment. In particular, the most pronounced reduction in tiller weight occurred on primary tillers on the R population (Figure 1).
Figure 1. Mean ± SE for tiller weights at the primary, secondary and tertiary tiller axes of non-rhizomatous (■) and rhizomatous (□) tall fescue populations when plants were undefoliated (U), or received lax (L) defoliation to 100 mm stubble, or hard (H), defoliation to 50 mm stubble every three weeks for 18 weeks.
Agriculture 05 00791 g001

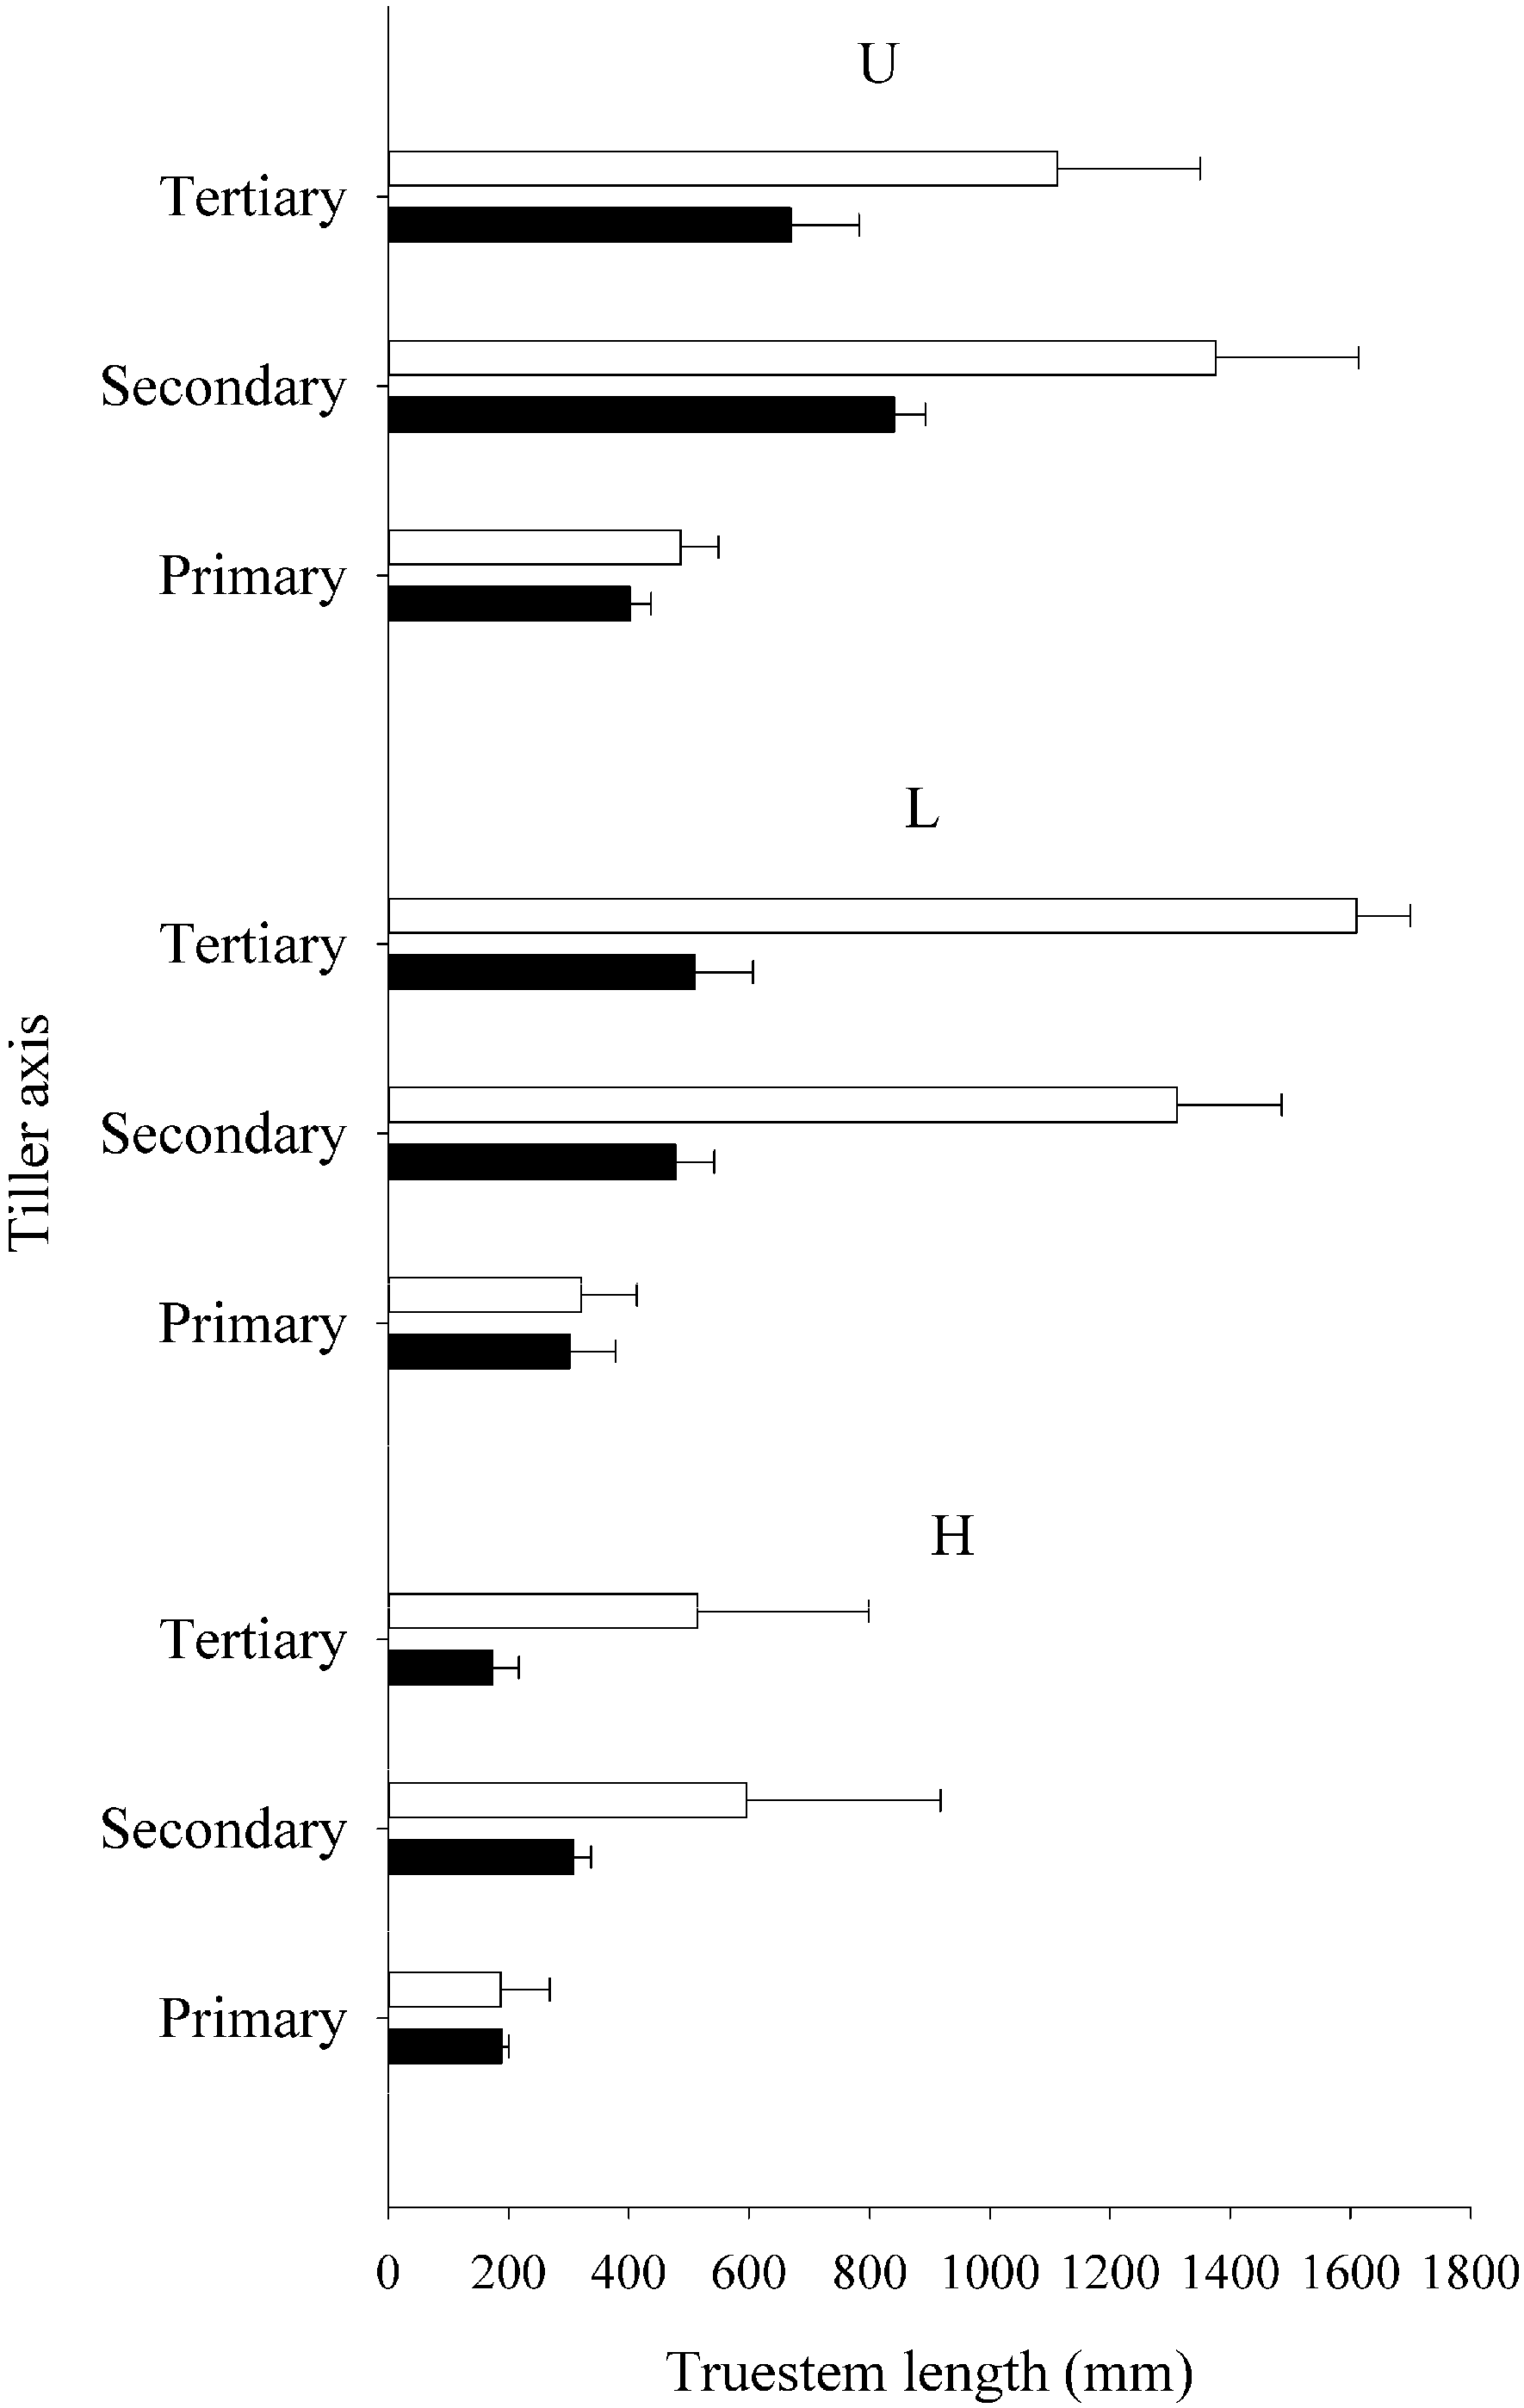
3.2. Leaf Production Strategies

Leaf area per plant, on average, was slightly greater (p = 0.09) for the NR compared with the R population (1044 vs. 776 ± 107 cm2 respectively). Defoliation reduced leaf area from 1711 cm2 in U plants to 271 cm2 in H defoliation treatments (p < 0.001; Table 4). The R plants had fewer green leaves per tiller (2–3 cf. 3–4), and a lower leaf appearance rate (LAR) than NR plants (Table 4). However, the faster leaf elongation rate of the R population was largely offset by production of narrower leaves than NR plants (5.9 vs. 8.0 mm respectively; p < 0.001).
The R population had leaves 91% longer than the NR population in the U treatment and just under 60% longer than NR in L and H defoliation treatments (population × defoliation interaction p < 0.05; Table 4). One trait contributing to longer leaf length of the R population in undefoliated plants was greater LER (20.1 cf. 16.2 mm/tiller/day in undefoliated plants, p < 0.01). As might be expected from defoliation effects on tiller dry weight noted above, both populations responded to increased defoliation severity by reduced leaf elongation rate. However in contrast to the nearly 80% reduction in tiller dry weight in H defoliated plants compared to U plants (Table 1), the corresponding leaf elongation rate reduction was less than 60% (Table 4).
Table 4. Effect of defoliation regime and population on leaf area, leaf elongation rate (LER) per tiller per day, leaf senescence per tiller per day (SR), leaf appearance rate (LAR), number of live leaves per tiller (NL), tiller total leaf length (TiLL), and the longest live leaf per tiller (LoLL) for the final six weeks of observations. Data are for non-rhizomatous (NR) or rhizomatous (R) populations undefoliated (U) or under lax (L) or hard (H) defoliation.
Leaf area (cm2/Plant)LER (mm/tlr/d)SR (mm/tlr/d)LAR (Leaves/d)NL (Leaves/Tiller)TiLL (mm)LoLL (mm)
NRU180516.216.60.105.8846191
L95412.69.10.106.5463147
H3757.14.20.115.520371
RU161720.113.40.064.51247364
L54318.010.70.084.8461232
H1667.94.20.094.0198113
Sig.SEM184.61.221.180.0080.3883.921.6
PoplnNS**NS******NS***
Defol.*********NSNS******
P × DNSNSNSNSNS**
SEM, Standard error of the mean for the interaction; *** p < 0.001; ** p < 0.01; * p < 0.05; NS, not significant, p > 0.05.
Dividing longest leaf length by LER indicates an estimated leaf elongation duration of 12 and 18 days for NR and R populations, respectively, when undefoliated. The duration of elongation reduced by 10% for NR populations and 25% for R when defoliated (Table 4). Furthermore, L defoliation resulted in a 63% reduction in leaf length in R populations but only a 45% reduction in leaf length in NR populations (Table 4). Hence, R populations exhibited a greater degree of plasticity for leaf length, forming longer leaves under laxer defoliation compared to NR populations, and reflected in a significant population × defoliation regime interaction for measures of leaf length.

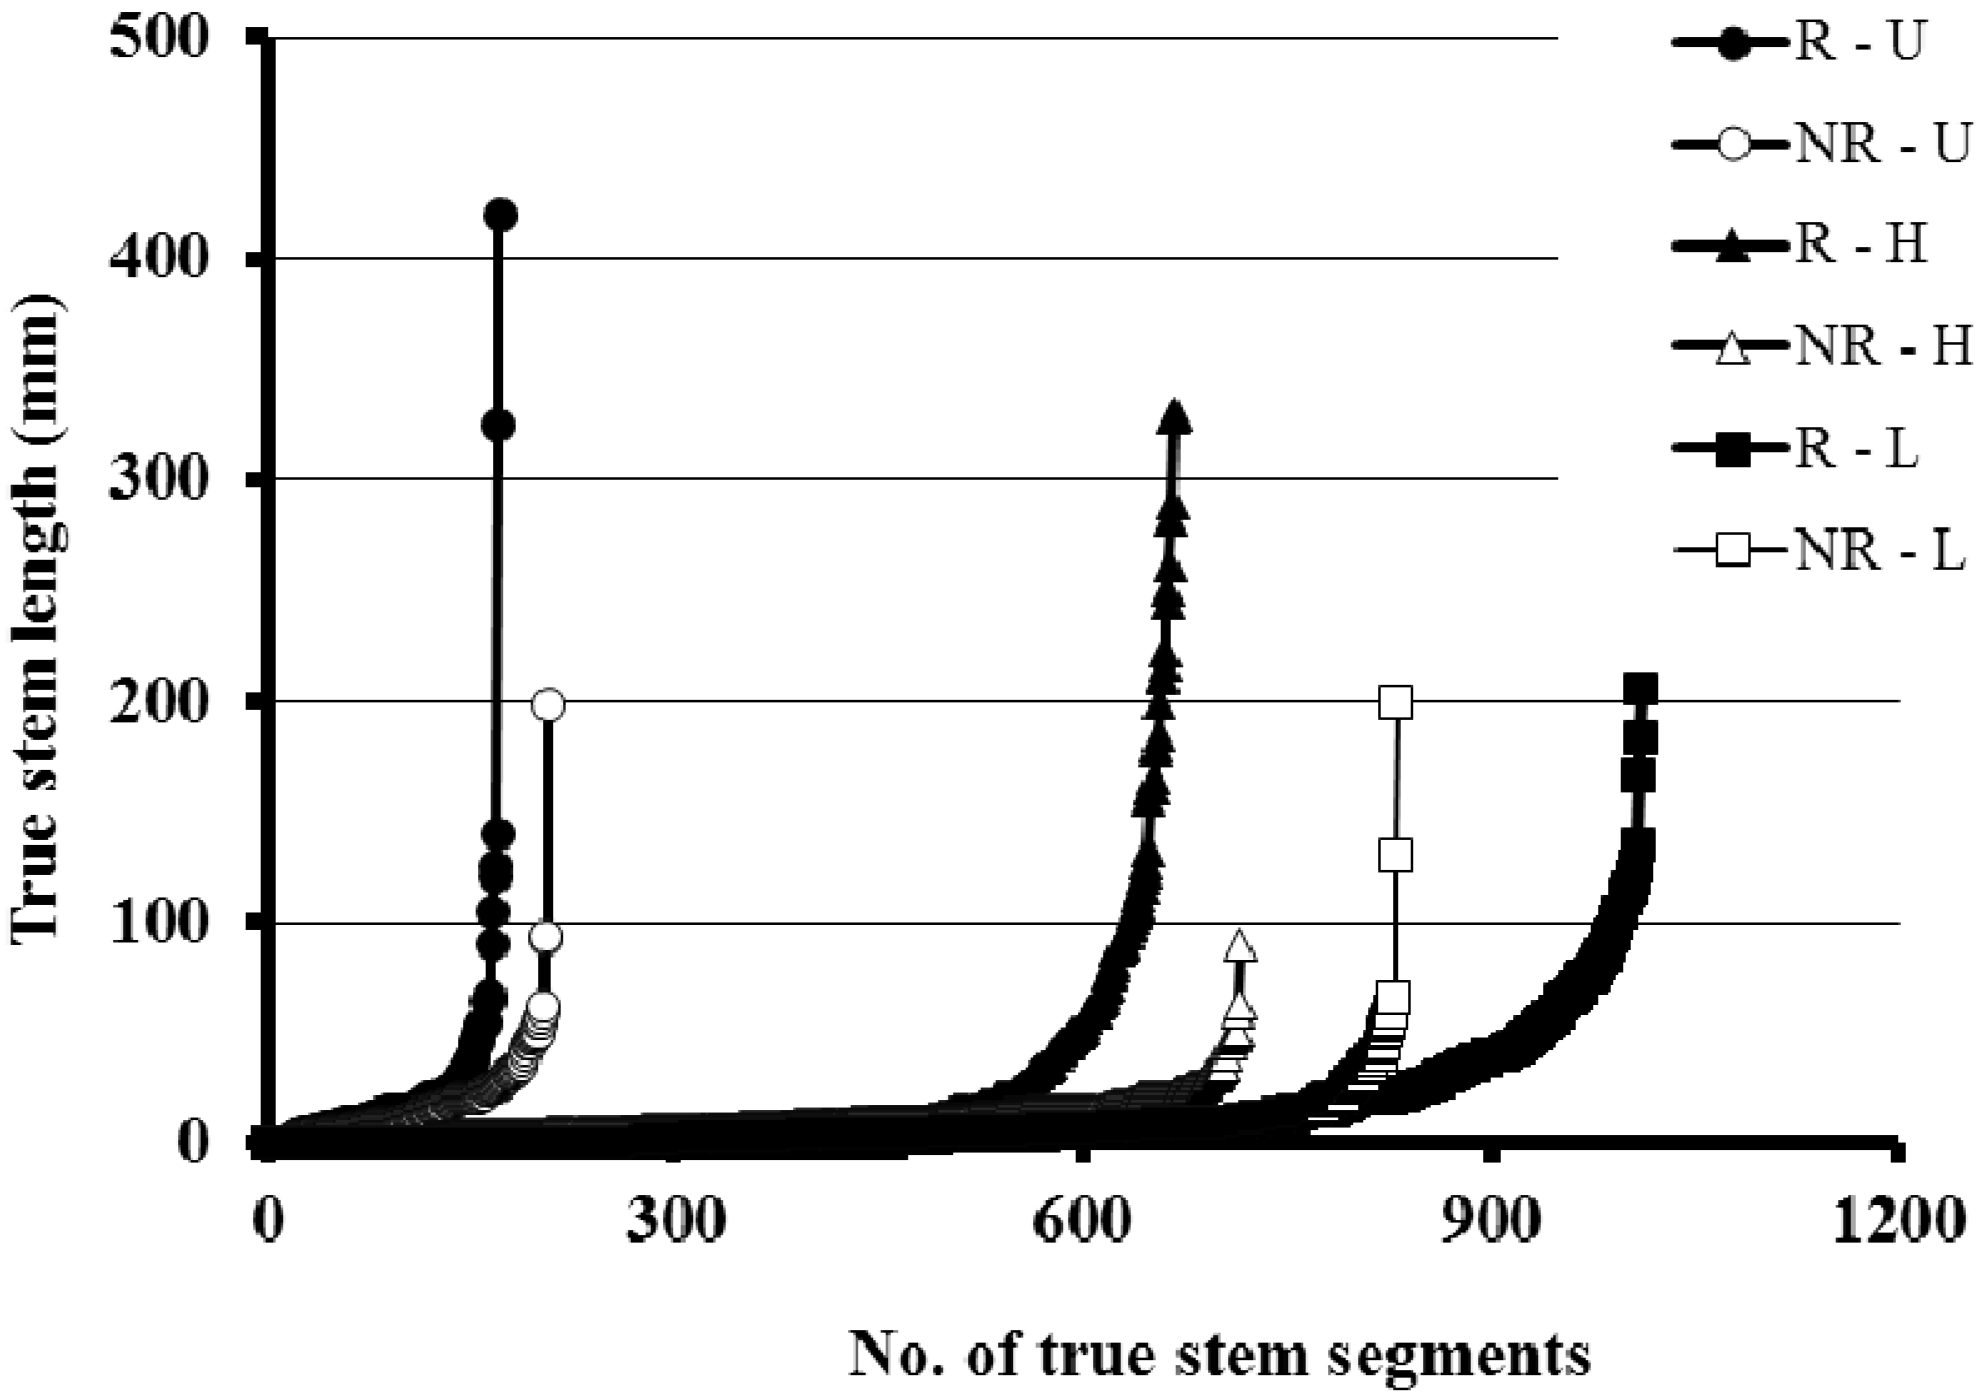
3.3. Rhizome Formation

Undefoliated plants had a mean true stem length of 20 mm for R and 13 mm for NR populations (p < 0.10). As mentioned previously, difference in true stem formation between R and NR populations proved difficult to quantify because of the presence of numerous stems which were intermediate between stolons and rhizomes. Measures of plant morphology found to give insight into the respective differences were a distribution plot of true stem lengths per internode for each plant category (Y-axis) against serial rank (X-axis), compiled after sorting data by ascending order of internode length to determine serial rank for each internode (Figure 2), and total length of true stem per plant for primary, secondary, and tertiary tillers (Figure 3).
Figure 2. Cumulative distribution plot for internode true stem lengths in each of six plant population × defoliation categories. Each symbol represents a single internode with its length (mm) plotted on the Y-axis against its serial rank for length among all internodes of that plant category (X-axis) The total number and length of true stems on rhizomatous (R) and non-rhizomatous (NR) tall fescue plants subjected to hard defoliation (50 mm stubble, H), lax defoliation (100 mm stubble, L), or undefoliated (U).
Agriculture 05 00791 g002
Figure 3. Mean ± SE for total true stem length of primary, secondary and tertiary tiller axes of non-rhizomatous (■) and rhizomatous (□) tall fescue populations when plants were undefoliated (U), or subject to lax (L) defoliation to 100 mm stubble, or hard (H) defoliation to 50 mm stubble every three weeks for 18 weeks.
Agriculture 05 00791 g003
It is seen in Figure 2 that the increase in true stem formation of the rhizomatous population was confined to approximately 20% of the internodes being somewhat longer than the comparably ranked internode of NR populations from the same defoliation regime, with a very small proportion of the internodes on R populations being dramatically longer than internodes for NR populations. Each rhizomatous plant possessed a small number of very long rhizomes (i.e., truestem length greater than 150 mm) (Figure 2). Because of this distribution pattern it was hard to show statistically that R populations differed from NR populations at the whole plant level. However, when data are sorted according to the hierarchical position of the tiller (primary, secondary, or tertiary), it becomes clear that true stem development of the R population was much greater on secondary and tertiary tillers than on primary tillers (Figure 3). The longest of these rhizomes appeared on secondary tillers where true stem internode segments of up to 420, 330 and 210 mm length were recorded for U, H, and L defoliation, regimes respectively, for the R population (Figure 2).
In undefoliated R populations, rhizome or true stem formation was also greatest at secondary and tertiary node positions (Figure 3a), but the differences in total true stem length associated with tiller hierarchical position were much reduced at high defoliation intensity (Figure 3c).
Generally R and NR populations showed a similar response to defoliation treatments, with defoliation decreasing true stem formation in all categories of tillers (Figure 3) There was, however, a possible interaction (p = 0.075) between defoliation treatment and population for total stem length of tertiary tillers. Under the L defoliation treatment R population had a greater differential over the NR population for total stem length for undefoliated plants because these L-defoliated R plants maintained their tertiary tiller number near to that of undefoliated plants (Table 2) and those tertiary tillers had the highest total true stem lengths (Figure 3).

4. Discussion

There are two main ways in which a grass plant can express a comparatively greater size increase. The first is by increasing the size of currently formed tillers (e.g., through enhanced leaf elongation rate); the second is by producing more tillers (e.g., through increased site filling). The extent to which either of these occurs is a reflection of assimilate use. However, if physical boundaries are genetically predetermined then additional assimilates above tillering potential may be stored or used to increase underground biomass. Conversely, if photoassimilates are used to a greater degree for production of non-photosynthetic organs such as true stem or rhizome, it would be expected that the metabolic cost of this construction was reflected in a reduction in biomass of other plant organs. In this study, the data collection was structured so that population differences in allocation of biomass to tillering, leaf, true stem and root formation and the plant morphology basis for these differences could be measured under differing levels of assimilate removal by defoliation.

4.1. Morphology of NR and R Tall Fescue Populations When Undefoliated

From the outset the two populations were visibly different in their appearance, with the NR population exhibiting a prostrate, leafy, clumpy growth habit while the R population was more upright and had a sparse, open growth habit. While tiller size and density can often be used to describe morphological differences, in the present study after 18 weeks growth from transplanted tiller ramets the undefoliated NR and R plants had similar total biomass (41.9 and 40.4 g DM/plant, respectively), similar mean tiller size (0.22 and 0.21 g DM/tiller), and similar tiller number (192 and 189 tillers/plant respectively). Instead of variation in plant or tiller size, the visible morphological differences between NR and R populations in this study arose from an enhancement of certain activities (especially rhizome formation) in secondary and tertiary tillers, compared to primary tillers, and from a variation in leaf production strategy with longer, narrower leaves in the R population.
Although the presence of rhizomes in tall fescue has been well documented [7,12,13,14], anatomical descriptions provide little insight towards structural development of rhizomatous plants. The complexity of morphological forms that caused difficulty distinguishing structures referred to in previous studies as stolons and rhizomes was not envisaged in the planning of this experiment. We observed that tiller initiation often began on nodes on the rhizomes themselves while the parent tiller still only possessed one or two scale leaves. These new tillers tended to grow vertically off lateral shoots, but because of their position beneath the soil, internode elongation was required for tillers to reach the surface. It soon became apparent that rhizome formation was not merely lateral expansion of older underground nodes, although this type of formation did tend to produce the longest rhizomes, but also a mechanism for allowing a succession of shoots to reach the soil surface at a distance from the original plant. In addition to this clarification, the results presented here appear to be unique among studies of stolon formation in tall fescue in that they provide a measure of biomass allocation to different organs within the plant and to tillers of primary, secondary, and tertiary hierarchical status. The biomass distribution data show an unexpected and rather complex picture. There is not a simple trade-off between forming stolons and other organs in the R population. Rather, increased true stem formation of R plants is scarcely statistically discernible at the whole plant level, but the R growth strategy is associated with increased biomass allocation to root formation and an energy saving through reduced investment in pseudostem, while leaf production is comparatively conserved, exhibiting only a modest reduction. Meanwhile, increased true stem formation in the R population is most evident at the periphery of a primary-secondary-tertiary hierarchical chain of tillers. There is a large body of literature on the dynamics of clonal plants. Contrasting rhizomatous and non-rhizomatous growth habits are typically referred to in ecology as guerrilla and phalanx growth strategies, e.g., [15], and some functional models have been explored identifying the potential foraging advantage of the guerilla strategy in environments with patchy root distribution [16]. However, the present information may indicate additional detail of a guerilla morphology. If true stem formation in the R population (guerrilla strategy) is an adaptation to reach and exploit nutrient patches in resource poor environments it is logical that this strategy would be associated with a greater investment in root mass. Further, a hypothesis for further investigation from the present data is that the R population had a greater assimilate transfer from parent to daughter tiller than the NR population; facilitating the spreading behavior, and building a compounding effect within a hierarchical chain of tillers. If this were true, it would explain very well the data pattern of increased true stem length in secondary and tertiary tillers of the R population observed in Figure 3. Notably, such a strategy whereby rhizomes are formed preferentially at the periphery of a plant will have a much lower energy cost than if rhizomes were formed routinely at every tiller, including primary tillers. The energy economy of this strategy is emphasized by the observation that a mere 3% increase in biomass allocation to true stem at the whole plant level (Table 1), with only a subtle change in distribution of individual internode lengths (Figure 1), when expressed preferentially in secondary and tertiary tillers (Figure 3) can result in visually dramatic differences in plant morphology.
Rhizomes are sometimes considered to function as storage organs, or as a survival strategy [17]. In this study it seems less likely that rhizomes functioned as storage organs as, at a whole plant level, allocation of plant DM to true stem formation was increased by only 2%–4% (NS) in the R population, compared to the NR.
With respect to the differences in leaf production strategy, undefoliated R plants had a 24% faster LER and a 50% longer duration of leaf elongation than NR plants and so produced much longer leaves, and consequently taller pseudostem (though counter-intuitively the slenderness of R tillers resulted in a lower % biomass allocation to pseudostem in the R population). However, the NR plants had wider leaves, and a more rapid leaf appearance interval meaning that more tiller buds were produced, even though as a result of lower site filling and site usage (Table 3 and Table 4), this did not result in more tillers per plant. For instance, only a tenth of leaves which appeared on NR plants had developed tillers from their axillary buds in the final six weeks of development, compared with a third of axillary buds on R plants. The compensations between various processes such as leaf formation and tillering and the component contributing traits such as leaf appearance rate, leaf elongation rate, and leaf elongation duration in grass swards have been much discussed, both theoretically [18,19,20], and from actual data [21,22] but for all that any predictive synthesis remains elusive. It is clear that increased LER is a trait less easily offset by other trade-offs and often associated with increased productivity in population comparisons [22], but in this case high LER of the R population was largely offset by a reduced leaf width and was not associated with greater plant dry weight. A possibility for further investigation is that differing leaf production strategies of these NR and R populations are not directly related to the rhizome formation habit but an independent response to some other feature of the environments where they have respectively evolved. In this case a likely possibility is that the longer leaf length of the R population is an adaptation to intermittent defoliation in an extensively farmed environment whereas the shorter leaf length of the NR population is an adaptation to more intensive pastoral farming. It is known anecdotally, for example that cocksfoot (Dactylis glomerata L) becomes dominant in a grass mixture when kept undefoliated (and is called “Orchard grass” in USA), as it has long leaves that can shade and eventually eliminate neighbouring shorter leaved species in an “umbrella” effect, but does not dominate companion species in the same way when regularly grazed.

4.2. Response to Defoliation

In both NR and R populations, plant size was sharply reduced by defoliation, but the % reduction was greater for the R than for the NR population, as reflected in the significant population × defoliation interaction for total plant dry weight (Table 1). However the growth strategy to achieve size reduction differed between populations and patterns of biomass allocation under defoliation also differed between populations. First, the R plants displayed plasticity, not displayed by NR plants, in showing greater reduction of % biomass allocation to roots and of leaf elongation duration and leaf length, under increased defoliation pressure. This pattern is logically consistent with the hypothesis that the R population has become adapted to intermittent grazing in the environment where it evolved. Thus plasticity resulted in continuing expansion of growing leaves when undefoliated but earlier cessation of leaf elongation when defoliated and which in parallel with that rationed energy by limiting root production after defoliation but continuing root production when undefoliated. This response would provide the guerrilla nutrient exploitation growth strategy with an intuitively desirable “pause when defoliated/resume when assimilate is available” dimension. One of the major reasons for reduced mean tiller size of the R population compared to NR is the higher proportion of tertiary tillers on R plants compared with NR plants which respectively accounted for 55% versus 43% of total tillers on defoliated plants (Table 2). By reason of their younger age tertiary tillers are smaller in size than their secondary counterparts (Figure 1). In spite of this, allocation of plant dry weight to true stem formation increased from 11% to 15% for R plants under defoliation pressure. An explanation for why there is increased tertiary tiller activity in R plants with a guerilla growth strategy would be advantageous and we hypothesize this could arise from a greater parent-to-daughter tiller photoassimilate allocation as was advanced above.

5. Conclusions

The present study adds new insight on the morphology of rhizome production in two tall fescue populations. The distinction between stolons and rhizomes in previous studies is shown to be somewhat arbitrary and in contrasting R and NR populations in this study rhizome formation was found to be much more complex than simple switching on of true stem formation at a particular category of bud sites. In the R population, biomass allocation to rhizomes was not statistically increased and the histogram of true stem internode lengths for the plant as a whole was only subtly shifted in the R compared to the NR population. R plants minimized any cost of increased true stem formation by prioritizing secondary and tertiary tillers within tiller hierarchies as sites for true stem formation, and exhibited some compensation through decreased allocation of biomass to pseudostem, while largely maintaining % biomass allocation to leaves. A hypothesis for further investigation is that this behavior is linked to greater parent-to-daughter photo-assimilate transfer within tiller hierarchies. In this study, compared to the NR population, the R population showed increased biomass allocation to root formation. There was also greater plasticity with reduction in leaf elongation duration resulting in shorter leaves and reduction in root formation under increased defoliation pressure. Logically this is consistent with adaptation to nutrient patch exploitation in a clonal species with a guerilla growth strategy.

Acknowledgments

The plant material for this research was kindly supplied by Alan Stewart of PGG Wrightson seeds.

Author Contributions

All three co-authors were involved in the design and analysis of the experiment. Racheal Bryant conducted the experiment and, alongside Cory Matthew, wrote the paper.

Conflicts of Interest

The authors declare no conflict of interest.

References

  1. Belesky, D.P.; Fedders, J.M. Does endophyte influence the regrowth of tall fescue? Ann. Bot. 1996, 78, 499–505. [Google Scholar]
  2. Volenec, J.J.; Nelson, C.J. Responses of tall fescue leaf meristems to N fertilization and harvest frequency. Crop Sci. 1983, 23, 720–724. [Google Scholar] [CrossRef]
  3. Zarrough, K.M.; Nelson, C.J.; Sleper, D.A. Interrelationships between rates of leaf appearance and tillering in selected tall fescue populations. Crop Sci. 1984, 24, 565–569. [Google Scholar] [CrossRef]
  4. Brock, J.L.; Albrecht, K.A.; Hume, D.E. Stolons and rhizomes in tall fescue under grazing. Proc. N. Z. Grassland Assoc. 1997, 59, 93–98. [Google Scholar]
  5. Neuteboom, J.H.; Lantinga, E.A. Tillering potential and relationship between leaf and tiller production in perennial ryegrass. Ann. Bot. 1989, 63, 265–270. [Google Scholar]
  6. Richards, J.H. Physiology of plants recovering from defoliation. In Proceedings of the XVII International Grassland Congress, Palmerston North, New Zealand, 8–21 February 1993; pp. 85–94.
  7. Jernstedt, J.A.; Bouton, J.H. Anatomy, morphology, and growth of tall fescue rhizomes. Crop Sci. 1996, 36, 407–411. [Google Scholar]
  8. Matthew, C.; Assuero, S.G.; Black, C.K.; Sackville-Hamilton, N.R. Tiller dynamics of grazed swards. In Grassland Ecophysiology and Grazing Ecology; Lemaire, G., Hodgson, J., Moraes, A., Carvalho, P.C.F., Nabinger, C., Eds.; CAB International: New York, NY, USA, 2000; pp. 127–150. [Google Scholar]
  9. Hume, D.E.; Brock, J.L. Morphology of tall fescue (Festuca arundinacea) and perennial ryegrass (Lolium perenne) plants in pastures under sheep and cattle grazing. J. Agric. Sci. 1997, 129, 19–31. [Google Scholar] [CrossRef]
  10. De Battista, J.P.; Bouton, J.H. Greenhouse evaluation of tall fescue genotypes for rhizome production. Crop Sci. 1990, 30, 536–540. [Google Scholar] [CrossRef]
  11. Matthew, C.; Yang, J.Z.; Potter, J.F. Determination of tiller and root appearance in perennial ryegrass (Lolium perenne) swards by observation of the tiller axis, and potential application in mechanistic modelling. N. Z. J. Agric. Res. 1998, 41, 1–11. [Google Scholar] [CrossRef]
  12. Porter, H.L., Jr. Rhizomes in tall fescue. Agron. J. 1958, 50, 493–494. [Google Scholar] [CrossRef]
  13. Lopez, R.R.; Matches, A.G.; Baldridge, J.D. Vegetative development and organic reserves of tall fescue under conditions of accumulated growth. Crop Sci. 1967, 7, 409–412. [Google Scholar] [CrossRef]
  14. Bouton, J.H.; Smith, S.R., Jr.; Battista, J.P. Field screening for rhizome number in tall fescue. Crop Sci. 1992, 32, 686–689. [Google Scholar] [CrossRef]
  15. Ye, X.H.; Yu, F.H.; Dong, M. A trade-off between guerrilla and phalanx growth forms in Leymus secalinus under different nutrient supplies. Ann. Bot. 2006, 98, 187–191. [Google Scholar] [CrossRef] [PubMed]
  16. Herben, T.; Hara, T. Competition and spatial dynamics in clonal plants. In The Ecology and Evolution of Clonal Plants; Kroon, H., de van Groenendael, H., Eds.; Backhuys Publishers: Leiden, The Netherland, 1997; pp. 3331–3357. [Google Scholar]
  17. Thom, E.R.; Sheath, G.W.; Bryant, A.M. Seasonal-variations in total nonstructural carbohydrate and major element levels in perennial ryegrass and paspalum in a mixed pasture. N. Z. J. Agric. Res. 1989, 32, 157–165. [Google Scholar]
  18. Robson, M.J.; Ryle, G.J.A.; Woledge, J.; Nelson, C.J. The grass plant—Its form and function. In The Grass Crop. The Physiological Basis of Production; Jones, M.B., Lazenby, A., Eds.; Chapman and Hall: London, UK, 1988; pp. 25–83. [Google Scholar]
  19. Chapman, D.F.; Lemaire, G. Morphogenetic and structural determinants of plant regrowth following defoliation. In Proceedings of the XVII International Grassland Congress, Palmerston North, New Zealand, 8–21 February 1993; pp. 95–104.
  20. Nelson, C.J. Shoot morphological plasticity of grasses: Leaf growth versus tillering. In Grassland Ecophysiology and Grazing Ecology; Lemaire, G., Hodgson, J., Moraes, A., Carvalho, P.C.F., Nabinger, C., Eds.; CAB International: New York, NY, USA, 2000; pp. 101–126. [Google Scholar]
  21. Van Loo, E.N. Tillering, leaf expansion, and growth of plants of 2 cultivars of perennial ryegrass grown using hydroponics at 2 water potentials. Ann. Bot. 1992, 70, 511–518. [Google Scholar]
  22. Bahmani, I.; Hazard, L.; Varlet-Grancher, C.; Betin, M.; Lemaire, G.; Matthew, C.; Thom, E.R. Differences in tillering of long- and short-leaved perennial ryegrass genetic lines under full light and shade treatments. Crop Sci. 2000, 40, 1095–1102. [Google Scholar] [CrossRef]

