Article

Provenancing Flower Bulbs by Analytical Fingerprinting: Convallaria Majalis

1
RIKILT Wageningen UR, P.O. Box 230, 6700 EV Wageningen, The Netherlands
2
Food Quality and Design Group, Wageningen University, P.O. Box 17, 6700 AA Wageningen, The Netherlands
3
IsoLife B.V., P.O. Box 349, 6700 AH Wageningen, The Netherlands
*
Author to whom correspondence should be addressed.
These authors contributed equally to this work.
Agriculture 2015, 5(1), 17-29; https://doi.org/10.3390/agriculture5010017
Submission received: 31 December 2014 / Revised: 20 January 2015 / Accepted: 22 January 2015 / Published: 29 January 2015

Abstract

:
The origin of agricultural products is gaining in appreciation while often hard to determine for various reasons. Geographical origin may be resolved using a combination of chemical and physical analytical technologies. In the present case of Lily of the Valley (Convallaria majalis) rhizomes, we investigated an exploratory set of material from The Netherlands, three other European (EU) countries and China. We show that the geographical origin is correlated to patterns of stable isotope ratios (isotope fingerprints) and volatile organic carbon (VOC) compounds (chemical fingerprints). These fingerprints allowed clear distinction using exploratory and supervised statistics. Isotope ratio mass spectrometry of 12C/13C, 14N/15N and 16O/18O isotopes separated materials from Europe and China successfully. The VOC patterns measured by Proton Transfer Reaction Mass Spectrometry (PTR-MS) allowed distinction of three groups: material from The Netherlands, the other EU countries and China. This knowledge is expected to help developing a systematic and efficient analytical tool for authenticating the origin of flower bulbs.

1. Introduction

Globalization of markets gives rise to a growing need for analytical tools capable of identifying origins of local products in a reliable and efficient way. Various bio-molecular, chemical and physical technologies have been tried in attempts to link agricultural products to their site of production or origin, also called authentication [1]. Analytical techniques for authenticating local products have been described for a wide range of agricultural and other products, like beef [2], Trappist beers [3], and pharmaceuticals [4]. However, much research is still needed towards the development of a comprehensive system of authentication based on scientific analytical methods. Little knowledge is currently available on the major issue of how to select the appropriate (combination of) analytical techniques that will be the most likely approach towards successful authentication of a particular product. Lilies are commonly kept ornamental flowering plants that are used in holiday celebrations, weddings, and funerals, and in various floral arrangements. Two thirds of the worldwide flower bulb production area is located in The Netherlands. The land area for flower bulb production in The Netherlands is ca. twenty-four thousand hectares in The Netherlands, including ca. twelve thousand hectares of tulips, and five thousand hectares of lilies. The Dutch have been known for their flower bulb production and export over the last 500 years [5]. By 1636, the tulip bulb became the fourth leading export product of The Netherlands—after gin, herring and cheese. The price of tulips skyrocketed because of speculation in tulip futures among people who never saw the bulbs. Many men made and lost fortunes overnight.
The Liliaceae, or lily family, is composed of 280 to 300 genera made up of 4000 to 4600 different species. The numbers vary because botanists differ in how to classify this diversity based on flowering type, ovary position, and distribution. There are ornamental plants within the group (lilies, tulips, hyacinths, daffodils, and amaryllis); food plants (onions, garlic, asparagus, leeks, shallots, and chives); and a variety of toxic species in the family, some of which are quite deadly [6].
Another floral plant associated with lilies is Convallaria majalis, commonly known as Lily of the Valley. Although part of the family Asparagaceae, in earlier classification systems the species were often treated as belonging to the family Liliaceae. It is a poisonous woodland flowering plant native throughout the cool temperate Northern Hemisphere in Asia, Europe and in the southern Appalachian Mountains in the United States. C. majalis is a herbaceous perennial plant that forms extensive colonies by spreading underground stems. These are called rhizomes. In botany, the term ‘bulb’ designates underground plant stems surrounded by modified leaves called scales which store nutrients, while in horticulture and gardening the term refers to any bulbous plant organ or underground stem, be it a corm, tuber, rhizome or true bulb. The C. majalis stems grow to 15–30 cm tall. Flowering stems have two leaves and 5–15 flowers on the stem apex. The flowers are usually white tepals, shaped like small bells, and sweetly scented (Figure 1). Flowering is in late spring (April/May) in the Northern Hemisphere.
C. majalis contains potent cardenolide glycosides, which are often toxic, and specifically heart-arresting [7]. In fact most of the literature on Convallaria deals with its toxic components and their biogenetic synthesis [8].
By nature, agricultural products have a land-based, and therefore geographical origin. Historically, application habits were shaped by socio-cultural factors and available local natural resources [9]. Such links between agricultural produce and territory have disappeared over time by various means. However, the last ten years consumers have a renewed interest in agricultural products strongly identified with a place of origin. The EU has recognized and supported the potential of differentiating quality products on a regional basis [10]. The EU regulation allows the application of the following geographical indications to a food product: Protected Designation of Origin (PDO), Protected Geographical Indication (PGI) and Traditional Specialties Guaranteed (TSG). PDO is the term used to describe foodstuffs that are produced, processed and prepared in a given geographical area using recognized methods. Examples are Roquefort (France), Traditional Balsamic Vinegar of Modena (Italy), and Farmers cheese from Leiden (The Netherlands). The use of geographical indications allows producers to obtain market recognition and often a premium price, not only for food products but also for flowers and bulbs. False use of geographical indications by unauthorized parties is detrimental to consumers and legitimate producers. From this point of view, the development of new and increasingly sophisticated techniques for determining the geographical origin of agricultural products is highly desirable for consumers, agricultural farmers, retailers and authorities. It is an analytically challenging problem that receives much attention in Europe. Reports on analytical methods for determining the geographical origin of agricultural products have been increasing since the 1980s [11]. Food and feed received considerable attention, but to the authors knowledge no authentication approaches have been reported for the provenance of flower bulbs in the scientific literature. Fingerprinting techniques combined with chemometrics are state-of-the-art analytical techniques in product authentication. These fingerprinting techniques aim to find a specific pattern for the authentic product (i.e., for each geographical origin), which might allow discrimination between different products (i.e., those from different geographical origins).
Stable isotope composition (or ‘fingerprint’) has been investigated using isotope ratio mass spectrometry (IRMS) for its utility in authenticating agricultural products, including wine, beer and cheeses [12], but also for pharmaceuticals [13] as well as in forensic studies on drugs [14]. These isotopic ‘fingerprints’ are intrinsic characteristics and built-in in all organic compounds and therefore largely insensitive to adulteration. Other successful applications have been described where stable isotopes serve as internal standards for quantitative Liquid Chromatography-MS [15], as tracers in source-sink studies [16,17,18] and in identifying functional micro-organisms [18,19].
It is well recognized that direct rapid headspace techniques measured by mass spectrometry without chromatographic separation can effectively represent a ‘fingerprint’ of the sample being analyzed and can provide distinct chemical information in relation to product odor, flavor, shelf-life, geographic or genetic origin, processing, and presence of micro-organisms. In the last decade, several non-chromatographic instrumental approaches, such as electronic noses with different types of chemical sensors, headspace mass spectrometry, or real time monitoring using techniques, such as Atmospheric pressure chemical ionization mass spectrometry (APCI-MS), proton transfer reaction mass spectrometry (PTR-MS) or selected ion flow tube mass spectrometry (SIFT-MS) have been applied for the characterization of the volatile compounds of food [20,21].
The aim of this study is a first exploration of two types of analytical fingerprints for their capabilities of differentiating rhizome samples of ‘Lily of the Valley’, Convallaria majalis, of different provenance for which isotope ratio analysis by IRMS and volatile organic compound (VOC) analysis by PTR-MS were selected. Isotope ratio analysis was selected because of the known impact of geology and climatology and thus geography on isotope ratio fingerprints of plant material. PTR-MS was selected because of the known impact of environmental conditions on volatile metabolites in plants and the technique’s sensitivity, rapidity and non-destructive nature. In order to distinguish C. majalis cultivated in The Netherlands, other European countries and in China stable isotope ratios 13C/12C, 15N/14N and 18O/16O determined by IRMS were determined as well as the integral VOC profiles, which were examined in conjunction with advanced statistical methods.

2. Materials and Methods

2.1. Sample Material and Study Design

A total of 34 C. majalis rhizomes samples were collected. The set of samples consisted of samples from The Netherlands (18), three neighboring EU countries (2 from Belgium, 6 from France, 4 from Germany) and from China (4). Representative samples of dry rhizome materials were ground to a powder. These rhizome samples were subjected to stable isotope analysis by IRMS and VOC analysis by PTR-MS. For comparison flowers of a C. majalis plant grown in The Netherlands was analyzed for their volatile composition by PTR-MS as well.

2.2. Stable Isotope Analysis by IRMS

The principles of natural abundance stable IRMS have been described in detail [22], as well as the application of IRMS for geographical origin authentication of foods [23]. This method employs the natural variation in isotope ratios of the chemical elements and is suited for accurate (<0.0002 atom%) analysis of the ratios of isotopes (IR) occurring -in this case- in organic matter, like carbon (C, 13C/12C; 1.1% 13C), nitrogen (N, 15N/14N; 0.3% 15N) and oxygen (O, 18O/16O; 0.2% 18O). In other studies, hydrogen 2H/1H and sulfur 34S/33S/32S have been used [12,23].
Oven-dry samples (1–2 mg) were packed in tin (13C, 15N) or silver foil (18O) for oxidation and analysis using a PDZ Europa ANCA-GSL elemental analyzer interfaced to a PDZ Europa 20-20 isotope ratio mass spectrometer (Sercon Ltd., Cheshire, UK; C and N). Freeze-drying increased the 18O/16O ratio by ~5 per mil. Oxygen isotope analysis was performed using an elementar PyroCube (Elementar Analysensysteme GmbH, Hanau, Germany) interfaced to a PDZ Europa 20-20 isotope ratio mass spectrometer (Sercon Ltd., Cheshire, UK). The long-term standard deviation is 0.2 per mil for 13C (0.0002 atom%) and 0.3 per mil for 15N (0.0003 atom%).
In accordance with international agreements delta-values (δ, in per mil; ‰) provide the deviation relative to the ratio of isotopes of international standards, V-PDB (Vienna Pee Dee Belemnite), V-SMOW (Vienna Standard Mean Ocean Water) and Air for carbon, oxygen and nitrogen, respectively. For information on delta notation and the international references, see e.g., Sharp 2006 [22]. Single analyses were carried out on the 34 samples.

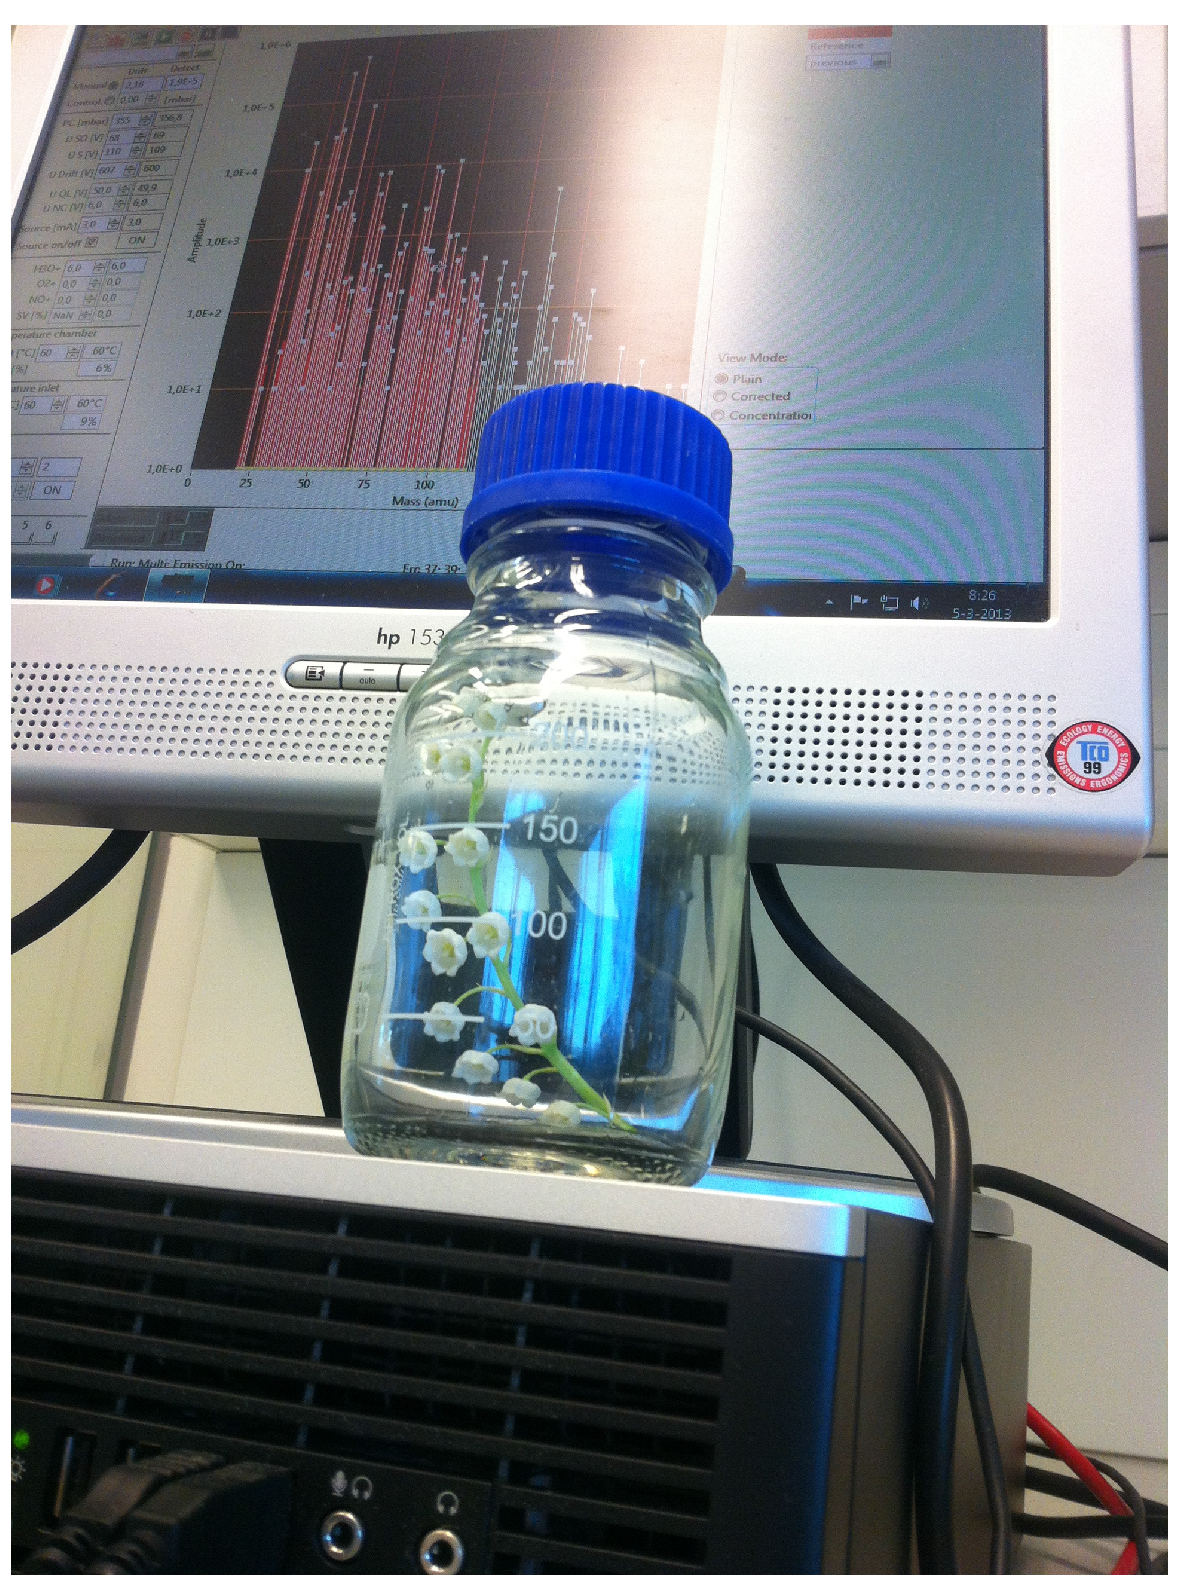
2.3. Volatile Organic Compound Analysis by PTR-MS

The VOC fingerprints were measured by PTR-MS. For this type of analysis the sample headspace is continuously introduced into a drift tube, where it is mixed with H3O+ ions formed in a hollow cathode ion source. VOCs that have proton affinities higher than water (>166.58 kcal/mol) are ionized by proton transfer from H3O+, mass analyzed in a quadrupole mass spectrometer and eventually detected as ion counts/s (cps) by a secondary electron multiplier. By using H3O+ as the proton source, the ionization of most of the common inorganic constituents of air (N2, O2 or CO2) is avoided since they have proton affinities lower than H2O. Furthermore, this soft ionization avoids excessive fragmentation of ions, which makes multicomponent analyte mass spectra simpler and easier to interpret [24].
A total of 2 g of sample (dry powder of rhizomes, or flowering stems) were placed in a 250 mL screw cap glass vial (Figure 1). Samples were equilibrated at 35 °C for at least 30 min in a water bath, in order to assure equilibrium of the VOC between sample and headspace. No further sample preparation was required. Measurements were performed using a commercial High Sensitivity PTR-MS system (Ionicon GmbH, Innsbruck, Austria). The headspace of the samples was delivered directly to the inlet of the PTR-MS system with a flow rate of 50 mL/min. The temperature of the inlet and drift chamber were both maintained at 60 °C to prevent loss of volatiles along the sampling inlet line for on-line analysis. A blank was measured before each sample. Measurements were carried out in the mass full-scan mode and the mass spectra were collected in the range of 20–160 atomic mass units (amu). A dwell time of 0.2 s/mass unit was used, resulting in a cycle time just under 30 s. Sample analyses were carried out in triplicate. For each replicate, a full mass scan was recorded. The data were background and transmission corrected, yielding one corrected mass spectrum per replicate. Then, the three mass spectra of the three replicates of each sample were averaged to obtain a mean mass spectrum per sample. In this manner, a dataset containing mean mass spectra per sample analyzed was compiled for the 34 samples.
Figure 1. Photograph of the sample flask and example mass spectrum of the flowers of C. majalis.
Agriculture 05 00017 g001

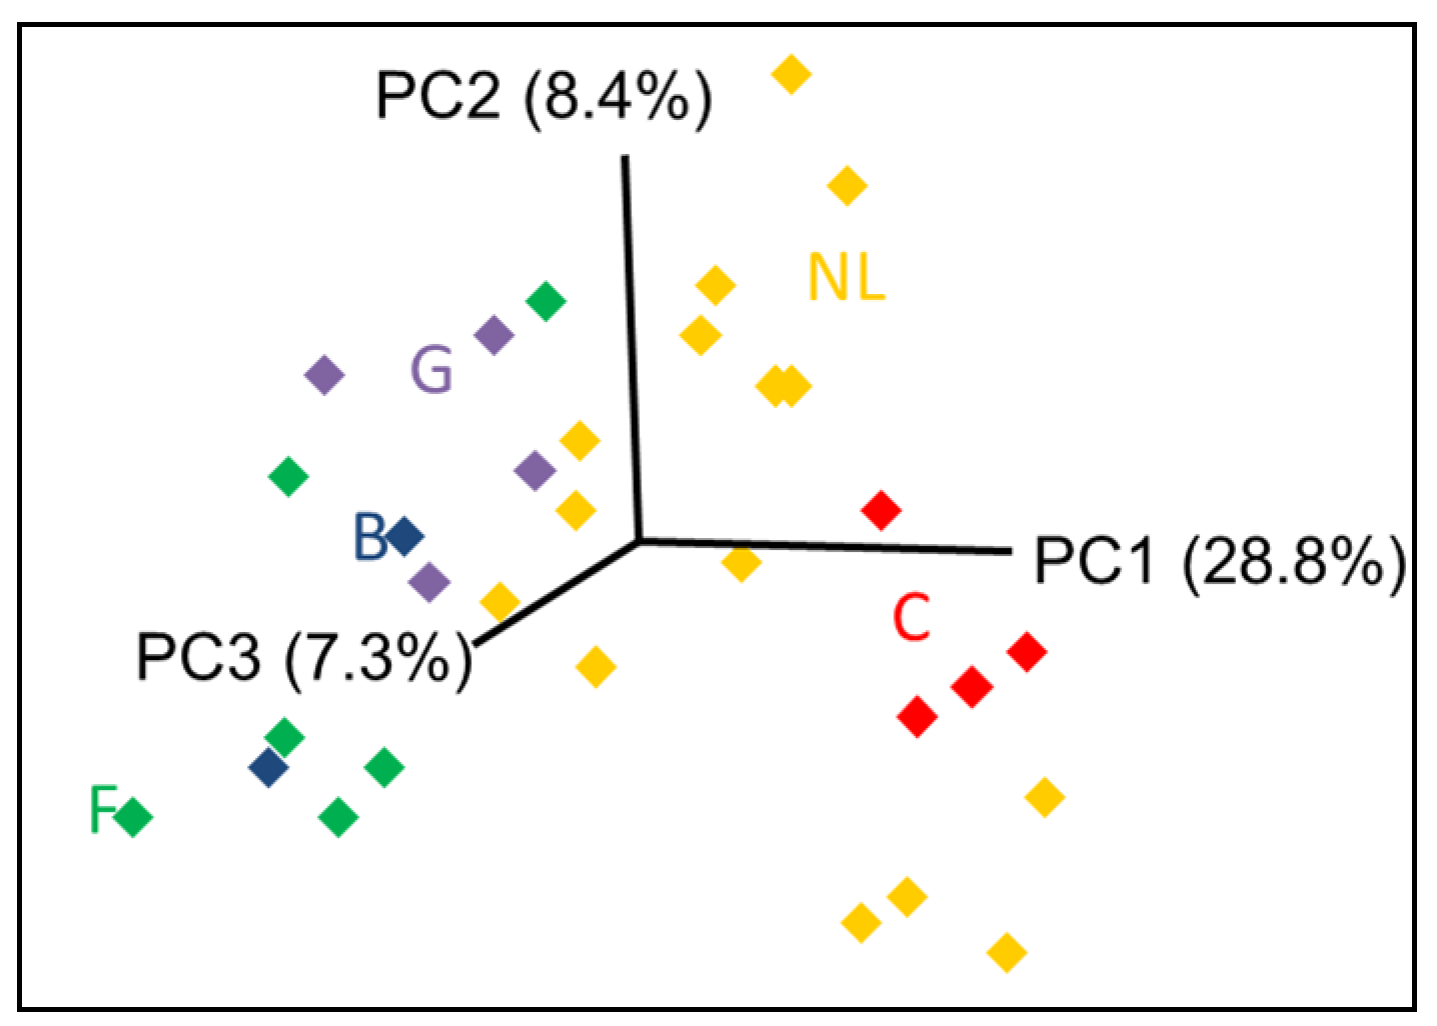
2.4. Statistical Analysis

Multi-factor analysis of variance (MANOVA, factors provenance and samples) and Fisher’s least significant difference (LSD) tests were carried out to determine significant differences among groups for isotope ratio measurements using XLSTAT 2 March 2014 (Addinsoft, Paris, France). MANOVA can assess two or more independent variables for significance of effects on two or more metric dependents. It allows a joint analysis of each dependent rather than performing several univariate tests, thus avoiding multiple testing risks.
For further multivariate modeling and classification, Pirouette 4.0 (Infometrix, Seattle, WA, USA) was used. Principal Component Analysis (PCA) was performed on the PTR-MS data of the 34 samples to screen the multivariate data for outliers and to explore the presence of any natural clustering in the data. PCA performs a reduction in the data dimensionality in order to facilitate the visualization of the multivariate data retaining as much as possible the information present in the original data. Then, Partial Least Squares-Discriminant Analysis (PLS-DA) was used to develop a classification model for samples from The Netherlands versus other origins. PLS-DA is a supervised classification technique that is often used for high dimensional data, especially when the amount of variables greatly exceeds the number of samples. It performs a variable reduction on the data set by calculating new variables (called latent components or factors) combining the variables in the data set, in order to find the maximum correlation between them and the class variable, and thus, the maximum separation among two classes (The Netherlands vs. other provenance). Then, linear discriminant analysis is applied on the reduced variable set (the latent components) to provide the final classification model. Since data pre-processing can have a profound effect on the model results, several ways of data pre-processing were evaluated: none (raw data), auto-scaling (scaling to unit variance), mean centering, and log transformation. The optimal PLS-DA model was then selected and its performance examined by leave-one-out cross validation because of the limited size of the exploratory sample set.

3. Results and Discussion

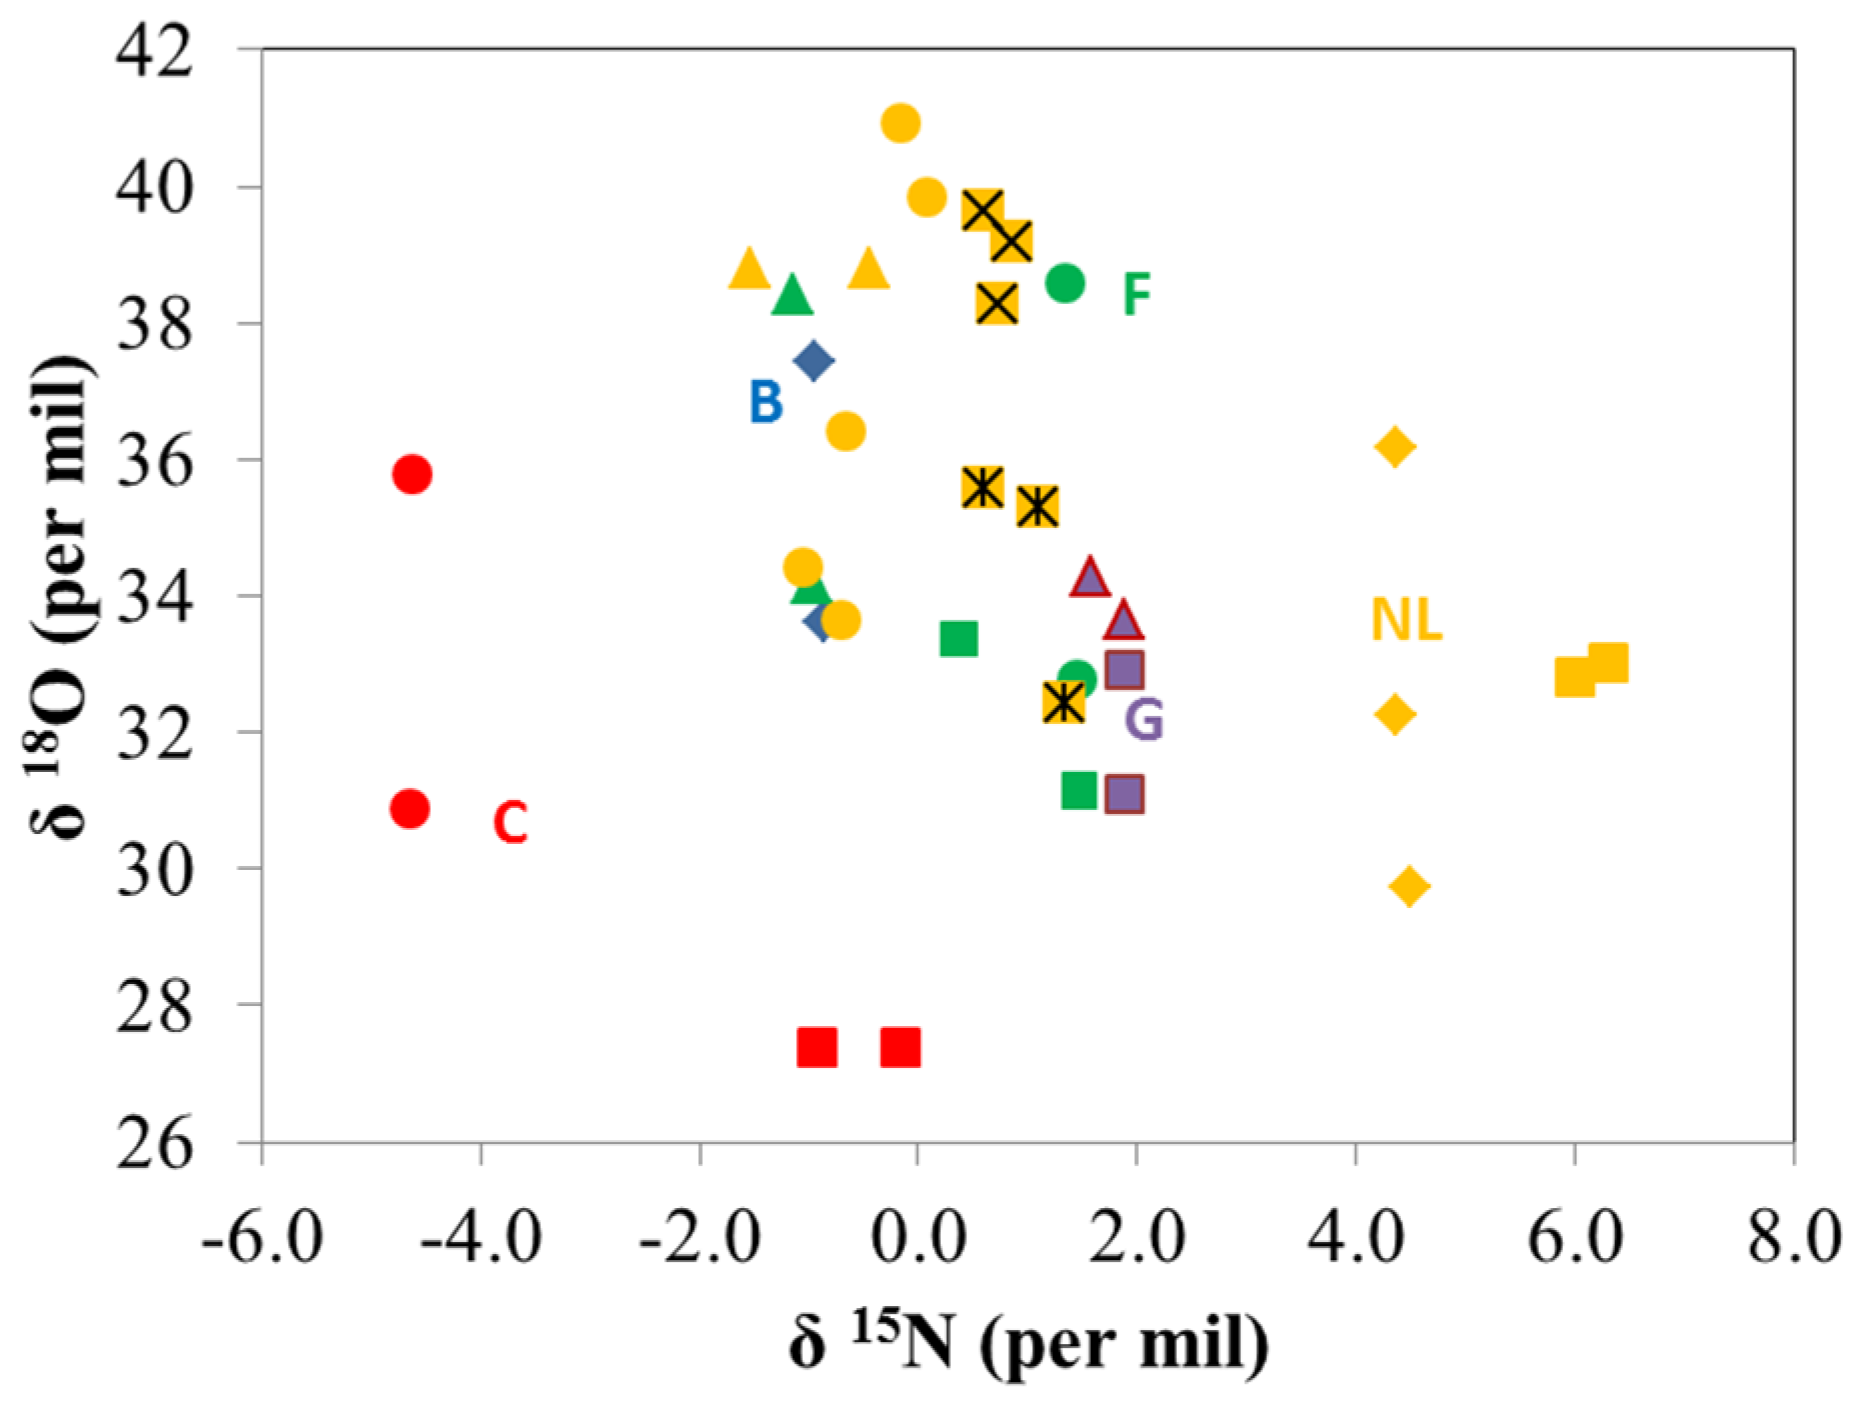
3.1. Stable Isotope Analysis by IRMS

The nitrogen, carbon, and oxygen isotope ratios (delta values) of the 34 samples were determined by IRMS. The isotope ratios were compared for the various provenances (Table 1). Overall, δ-15N varied by 11 per mil, δ-13C varied by 7 per mil, and δ-18O by 12 per mil (sample extremes). MANOVA indicated significant differences in δ-15N values between the C. majalis from China and their European counterparts (France, Germany, The Netherlands) whereas the Belgian products revealed intermediate values. For the δ-13C values mostly overlapping ranges were observed. The δ-18O values showed relatively high values for the rhizomes originating from The Netherlands and low values for those from China, with the other European countries showing intermediate values.
Naturally occurring stable isotope ratios of organic elements like N, C and O measured in this study have characteristic values in relation to their geographical origin. This is due to systematic effects of climate factors like temperature, humidity, precipitation, and geographical factors such as distance to the sea, plant physiological processes, plant genotype, and soil or substrate factors such as fertilizer type. The three isotope ratios that are dealt with here differ in their relation to the main environmental factors related to plant growth. 13C/12C is related plant water use efficiency, via water conditions, including water supply and relative humidity interacting with plant physiological characteristics [25]. 15N/14N varies with the chemical type and origin of the mineral N fertilizer [26], and increases with trophic level in N of organisms [27]. The 18O/16O isotope ratio of atmospheric water is directly related to temperature and inversely related to the dominant down-wind distance from the sea through the mechanism of preferential precipitation of the heavier water molecules (i.e., H218O; [28]), while this oxygen isotope ratio in leaf water (and thus, plant biomass) is affected by local climatic conditions affecting plant transpiration, i.e., mainly temperature and humidity [29].
Table 1. Nitrogen, carbon and oxygen isotope ratio’s (δ values, per mil) for C. majalis of various provenance a; means ± SE.
Provenanceδ-15Nδ-13Cδ-18O
The Netherlands1.5 ± 2.4 x−26.6 ± 2.6 y36.0 ± 3.2 x
Belgium−0.9 ± 0.1 xy−25.5 ± 3.4 xy35.5 ± 2.7 xy
France0.4 ± 1.2 x−24.2 ± 0.7 x34.7 ± 3.1 xy
Germany1.8 ± 0.2 x−24.5 ± 1.3 xy33.0 ± 1.4 xy
China−2.8 ± 2.2 y−26.4 ± 2.0 xy30.4 ± 4.0 y
a Different superscripts (x, y, xy) in a column indicate significant differences (Multi-factor analysis of variance (MANOVA) and Fisher’s least significant difference (LSD) test, p < 0.05).
Since the individual isotopes would not allow full discrimination between C. majalis from The Netherlands, other European countries, and those of Chinese origin, multiple isotopes were compared for their discriminatory properties. The data of the two most discriminating isotopes, 15N and 18O were combined in a 2D plot (Figure 2). The two isotopes display a clear distinction between the rhizomes from Europe and China (red-colored symbols versus others). In the study sample numbers are low and do not represent all variation in real-life, but the results are promising though. Different nitrogen sources for fertilization and water sources are likely to have contributed to the consistencies observed.
Figure 2. 2D-plot of N and O isotopic data of C. majalis rhizomes originating from five countries (Belgium (B, blue), China (C, red), France (F, green), Germany (G, purple) and The Netherlands (NL, yellow)), i.e., stable isotope ratios 18O/16O (δ 18O) and 15N/14N (δ 15N). Different colors indicate different countries, symbol shapes indicate different origins within countries; identical symbols indicate replicate provenance samples; least significant difference (LSD) (p < 0.05) values: 0.7 (δ 15N), 4.6 (δ 18O).
Agriculture 05 00017 g002

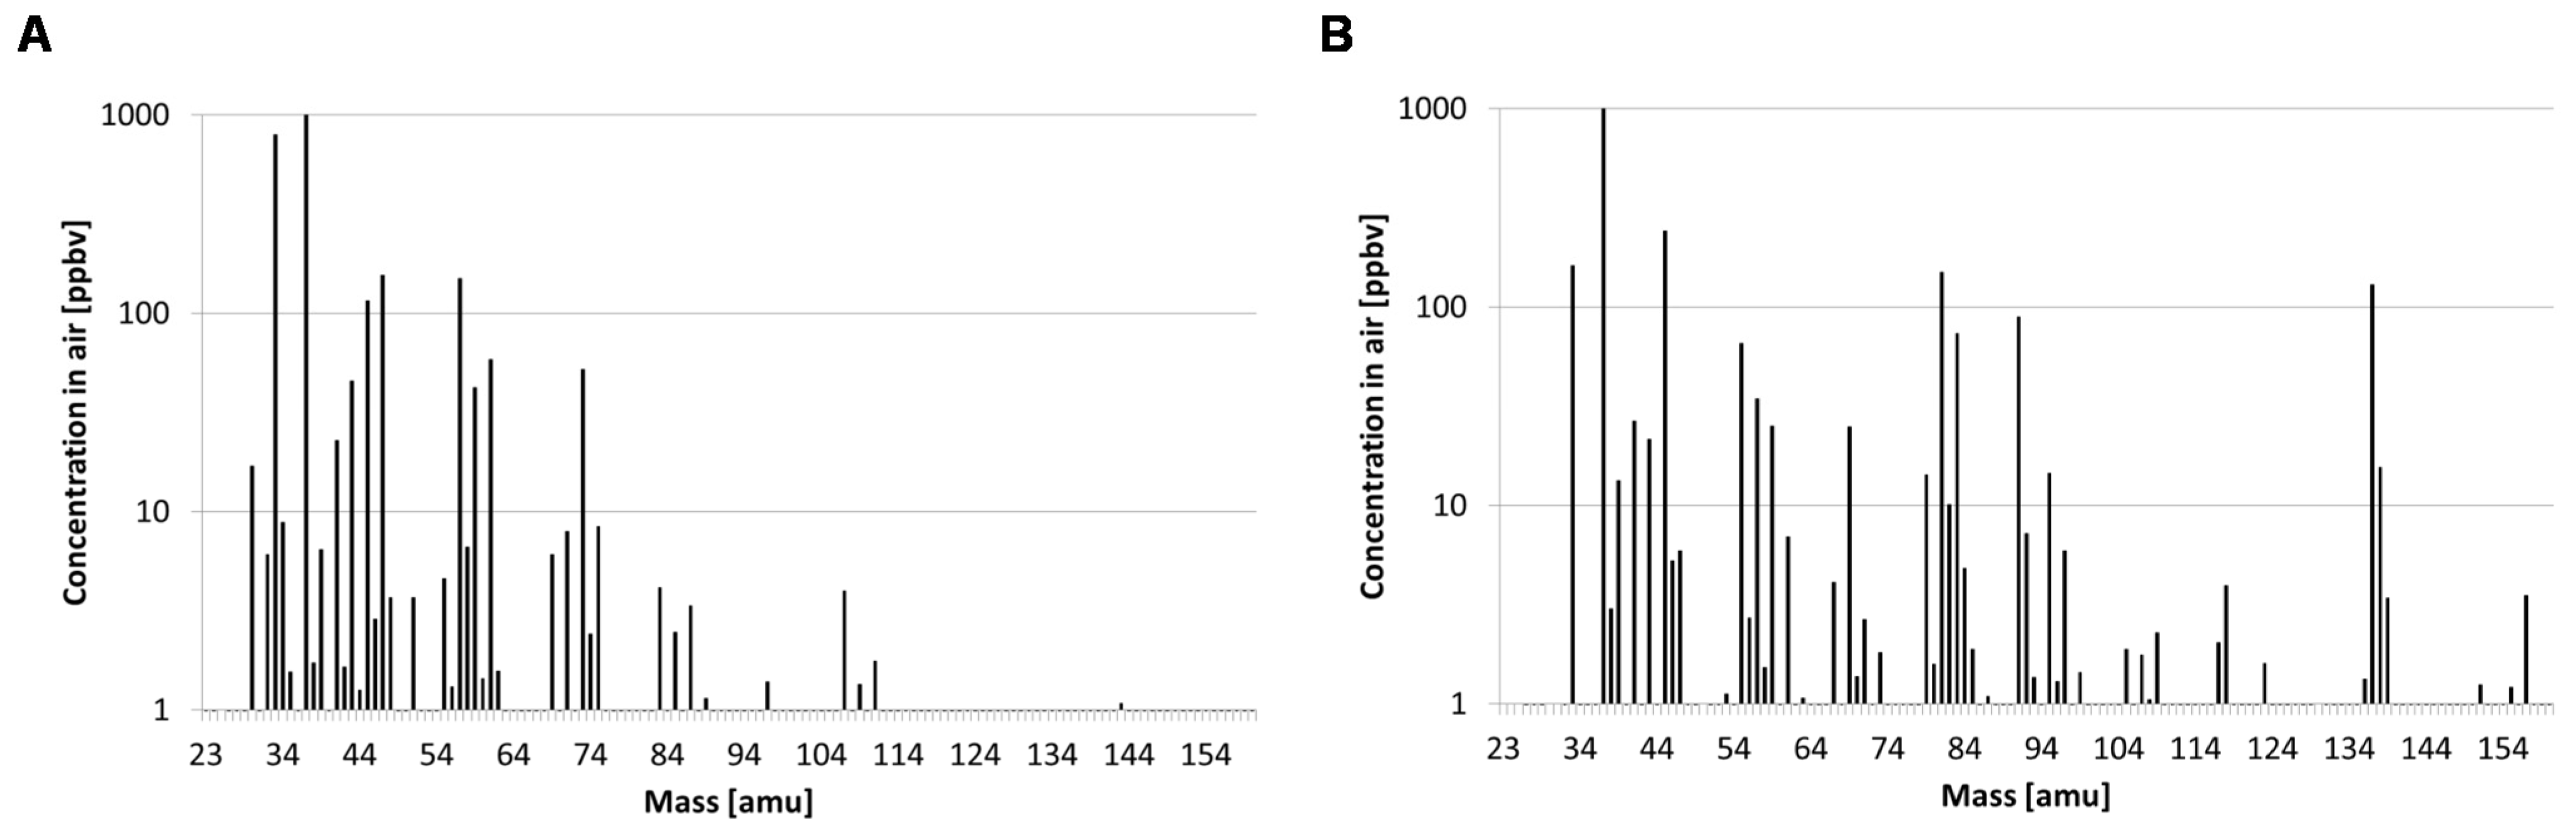
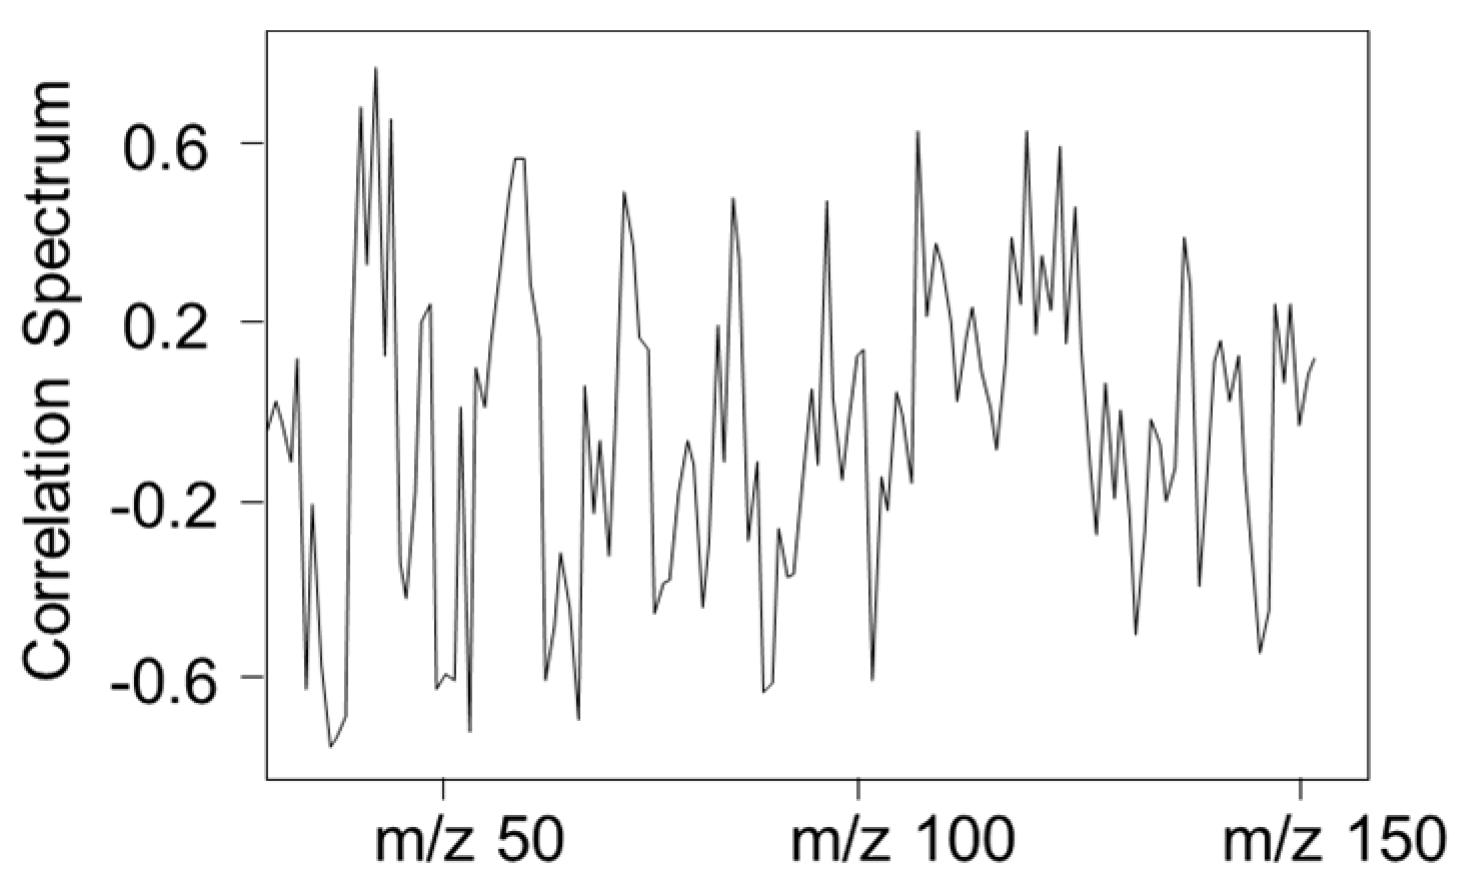
3.2. Volatile Organic Compound Analysis by PTR-MS

VOCs in the headspace of the C. majalis rhizomes and flower samples were analyzed by PTR-MS without prior chromatographic separation and resulted in a spectrum of the VOCs (their mass-to-charge ratios and their intensities). The mean mass spectra of the samples from The Netherlands are presented in Figure 3 for both rhizomes and flowers. Some similarities in groupings of more predominant ions for both types of samples are observed in the lower molecular weight range. On the other hand, the flowers present clearly more higher molecular weight volatile compounds than the rhizomes. In decreasing order, the most abundant mass-to-charge ratios found in the flowers were m/z 37 (water cluster), m/z 45, m/z 33, m/z 81, m/z 137, m/z 91 and m/z 83.
Figure 3. Mean PTR-MS (proton transfer reaction mass spectrometry) spectrum of C. majalis cultivated in The Netherlands: rhizomes (A) and flowers (B).
Agriculture 05 00017 g003
Flowers contain a large variety of volatile organic compounds, just as there are a multitude of colors and forms of flowers. Those compounds with a sufficiently high vapor pressure may have an odor, which is approximately for compounds with a low polarity and up to a molecular weight of around 300 [30]. The odor of Lily of the Valley plays an important role in perfumery. However, very few studies have identified the responsible volatile compounds of the plant. Brunke and co-workers [31] reported the following predominant volatile compounds in the extract of C. majalis analyzed: benzyl alcohol (35%), cis-3-hexen-1-ol (11%), citronellol (10%), geraniol (8%) and cis-3-hexenyl acetate (8%). Benzyl alcohol, citronellol, geraniol would carry floral-rosy-citrus notes, whereas the cis-3-hexen-1-ol and cis-3-hexenyl acetate would be responsible for green-grassy odor notes. They are all compounds with molecular weights of 100 and over, and therefore expected to appear (if present) in the VOC mass spectrum in the mass range of 100–160 amu. The response for mass peak 157 in the flower analysis is likely to be citronellol (mw = 156, ionized response expected at 157 amu). Takahiro et al. [32] identified 148 compounds. They investigated also the enantiomeric ratio of the chiral compounds in C. majalis using multidimensional GC-MS and determined predominantly the (S)-form of citronel, citronellyl acetate, citronellal, and dihydrofarnesol. Due to its pleasant odour various attempts have been made to synthesize Lily of the Valley-like fragrances. Lilial® (3-(4-t-butylphenyl)-2-methylpropanal), Lyrial®, and hydroxycitronellal are the commercially most important compounds of this class of odorants and they show apparent molecular similarities. Dupical® and Mugetanol® are two more recently developed Lily of the Valley odorants. Lillial® is a powerful, fresh, floral note reminiscent of lily of the valley, linden blossom, and cyclamen. Besides its use as a fragrance and fragrance intermediate it is used as an intermediate for the production of fenpropimorph, a biodegradable fungicide. It is produced on a kiloton scale by a multistep synthesis [28,33].
PTR-MS is not primarily used to identify the volatile compounds as isobaric compounds might yield the same m/z signal. Fragmentation in PTR-MS is mostly reduced due to the soft chemical ionization of the compounds; thus, the molecular structure of most volatile compounds is preserved. This allows the spectra to be used as fingerprints. Geographical provenancing using a univariate approach is not always a robust strategy. For instance, even if we found significant differences in the content of a particular volatile among the origins of the rhizomes, basing the verification of them on only this volatile could on the one hand easily lead to incorrect assignment to a particular origin and on the other hand may be the recipe to fraud. Therefore, a multivariate approach was selected for the VOC data.
The VOC fingerprints were examined using chemometric analysis, which is particularly suitable for handling large data sets. PCA was conducted on the VOC data of the 34 samples. The data matrix consisted of 34 rows (samples) and 138 variables (ions). The first three dimensions of the PCA on the normalized and auto-scaled data are presented in Figure 4.
Figure 4. PCA scores plot of the PTR-MS (proton transfer reaction mass spectrometry) data (normalized and auto-scaled) of C. majalis from the five countries (Belgium (B, blue), China (C, red), France (F, green), Germany (G, purple) and The Netherlands (NL, yellow)).
Agriculture 05 00017 g004
Some natural clustering is observed: with groupings of the samples from The Netherlands, the other European samples, and the samples of Chinese origin. Subsequently the data for these three provenance groups were subjected to PLS-DA in order to optimize the classification of the samples by their VOC profiles. The data matrix was the same as for the PCA. A model was built to classify the samples from The Netherlands, from other European countries and from China using the normalized, auto-scaled data. The model’s performance was evaluated by a leave-one-out cross validation and indicated 100% accuracy for the prediction of the origin for the samples from The Netherlands, other European countries and China (Table 2). In order to evaluate the masses contributing to the classification, a correlation spectrum for the masses and the model classifying samples from The Netherlands and the other origins was generated (Figure 5). It shows that many masses are positively or negatively correlated with the origin of the C. majalis samples origin.
Table 2. PLS-DA (Partial Least Squares-Discriminant Analysis) leave-one-out cross validation results: classification of C. majalis from The Netherlands, other EU countries and China by their normalized and auto-scaled PTR-MS (proton transfer reaction mass spectrometry) spectral data.
ProvenancePrediction
The NetherlandsOther EU Countries aChina
The Netherlands100%0%0%
Other EU countries0%100%0%
China0%0%100%
a C. majalis from Belgium, France, and Germany.
Figure 5. Correlation spectrum associated with the PLS-DA (Partial Least Squares-Discriminant Analysis) classification of C. majalis from The Netherlands and other countries presenting the relevance of particular masses analyzed by PTR-MS for the classification.
Agriculture 05 00017 g005

4. Conclusions

Consistent differences in composition between Lily of the Valley rhizomes of different provenances by both their nitrogen and oxygen isotope ratios and their VOC fingerprints were observed in the current set of samples. The isotope ratios allowed discrimination between samples cultivated in Europe and China. The VOC fingerprints differentiated between the samples from The Netherlands, from the other European countries and the samples from China. PTR-MS is a rapid, non-destructive technique that may be suitable as a first on site, screening technique, while the more time-consuming isotope ratio analysis could be used for further confirmation. Since origin may add value to agricultural produce, produce from particular origins may be susceptible to mix-up and substitution. In order to assure genuine trade, purchaser confidence, and therefore future production this type of analytical techniques may have a positive effect in addition to administrative controls. This study is a first step in that direction but the sample set would need to be further extended to build a reliable database for practical use.

Acknowledgments

The authors are grateful to Naktuinbouw for providing the Lily-of-the-Valley sample material, to Alex Koot for technical help with the PTR-MS analyses, and to Sara N. de Visser for graphics support. Furthermore, the authors would like to acknowledge strategic Wageningen University and Research Centre funding from the Dutch Ministry of Economic Affairs in the KB-project Authenticity-traceability, and the EU Operationeel Programma Oost-Nederland EFRO 2007-2013 (GO).

Author Contributions

Ries de Visser contributed primarily to the generation and interpretation of the IRMS data and Saskia van Ruth was mostly involved in the PTR-MS part of the study as well as the statistical calculations. The current manuscript was drafted together.

Conflicts of Interest

The authors declare no conflict of interest.

References

  1. Olsen, P.; Borit, M. How to define traceability. Trends Food Sci. Technol. 2012, 29, 142–150. [Google Scholar] [CrossRef]
  2. Monahana, F.J.; Moloneyb, A.P.; Osorioa, M.T.; Röhrlea, F.T.; Schmidta, O.; Brennanc, L. Authentication of grass-fed beef using bovine muscle, hair or urine. Trends Food Sci. Technol. 2012, 28, 69–76. [Google Scholar] [CrossRef]
  3. Mattarucchi, E.; Stocchero, M.; Moreno-Rojas, J.M.; Giordano, G.; Reniero, F.; Guillou, C. Authentication of Trappist beers by LC-MS fingerprints and multivariate data analysis. J. Agric. Food Chem. 2010, 58, 12089–12095. [Google Scholar] [CrossRef] [PubMed]
  4. Berkowitz, S.A.; Engen, J.R.; Mazzeo, J.R.; Jones, G.B. Analytical tools for characterizing biopharmaceuticals and the implications for biosimilars. Nat. Rev. Drug Discov. 2012, 11, 527–540. [Google Scholar] [CrossRef] [PubMed]
  5. Schama, S. The Embarrassment of Riches: An Interpretation of Dutch Culture in the Golden Age; Alfred A. Knopf: New York, NY, USA, 1987; p. 698. [Google Scholar]
  6. Burrows, G.E.; Tyrl, R.I. The Liliaceae. In Toxic Plants of North America; Burrows, G.E., Tyrl, R.I., Eds.; Iowa State Press: Ames, IA, USA, 2001; pp. 271–295. [Google Scholar]
  7. Fitzgerald, K.T. Lily toxicity in the cat. Top. Companion Anim. Med. 2010, 25, 213–217. [Google Scholar] [CrossRef] [PubMed]
  8. Ogorodnikova, A.V.; Latypova, L.R.; Mukhitova, F.K.; Mukhtarova, L.S.; Grechkin, A.N. Detection of divinyl ether synthase in Lily-of-the-Valley (Convallaria majalis) roots. Phytochemistry 2008, 69, 2793–2798. [Google Scholar] [CrossRef] [PubMed]
  9. Delamont, S. Appetites and Identities: An Introduction to the Social Anthropology of Western Europe; Routledge: London, UK, 1994; p. 272. [Google Scholar]
  10. Dimara, E.; Skuras, D. Consumer evaluations of product certification, geographic association and traceability in Greece. Eur. J. Market. 2003, 37, 690–705. [Google Scholar] [CrossRef]
  11. Luykx, D.M.A.M.; van Ruth, S.M. A review of analytical methods for determining the geographical origin of food products. Food Chem. 2008, 107, 897–911. [Google Scholar] [CrossRef]
  12. Kelly, S.; Heaton, K.; Hoogewerff, J. Review: Tracing the geographical origin of food: The application of multi-element and multi-isotope analysis. Trends Food Sci. Technol. 2005, 16, 555–567. [Google Scholar] [CrossRef]
  13. Jasper, J.P.; Westenberger, B.J.; Spencer, J.A.; Buhse, L.F.; Nasr, M. Stable isotopic characterization of active pharmaceutical ingredients. J. Pharm. Biomed. Anal. 2004, 35, 21–30. [Google Scholar] [CrossRef] [PubMed]
  14. Aguilera, R.; Hatton, C.K.; Catlin, D.H. Detection of epitestosterone doping by isotope ratio mass spectrometry. Clin. Chem. 2002, 48, 629–636. [Google Scholar] [PubMed]
  15. Nakabayashi, R.; Sawada, Y.; Yamada, Y.; Suzuki, M.; Hirai, M.Y.; Sakurai, T.; Saito, K. Combination of liquid chromatography-Fourier transform ion cyclotron resonance-mass spectrometry with 13C-labeling for chemical assignment of sulfur-containing metabolites in onion bulbs. Anal. Chem. 2013, 85, 1310–1315. [Google Scholar] [CrossRef] [PubMed]
  16. De Visser, R.; Vianden, H.; Schnyder, H. Kinetics and relative significance of remobilized and current C and N incorporation in leaf and root growth zones of Lolium perenne after defoliation: Assessment by 13C and 15N steady-state labelling. Plant Cell Environ. 1997, 20, 37–46. [Google Scholar] [CrossRef]
  17. Frost, G.; Sleeth, M.L.; Sahuri-Arisoylu, M.; Lizarbe, B.; Cerdan, S.; Brody, L.; Anastasovska, J.; Ghourab, S.; Hankir, M.; Zhang, S.; et al. The short-chain fatty acid acetate reduces appetite via a central homeostatic mechanism. Nat. Commun. 2014, 29. [Google Scholar] [CrossRef]
  18. Tannock, G.W.; Lawley, B.; Munro, K.; Sims, I.M.; Lee, J.; Butts, C.A.; Roy, N. RNA-stable isotope probing (RNA-SIP) shows carbon utilization from inulin by specific bacterial populations in the large bowel of rats. Appl. Environ. Microbiol. 2014, 80. [Google Scholar] [CrossRef] [PubMed]
  19. Schmidt, O.; Horn, M.A.; Kolb, S.; Drake, H.L. Temperature impacts differentially on the methanogenic food web of cellulose-supplemented peatland soil. Environ. Microbiol. 2014, 16. [Google Scholar] [CrossRef] [PubMed]
  20. Reineccius, G.; Peterson, D. Principles of food flavor analysis. In Instrumental Assessment of Food Sensory Quality; Kilkast, D., Ed.; Woodhead Publishing Ltd.: Cambridge, UK, 2013; pp. 53–102. [Google Scholar]
  21. Heenan, S.; van Ruth, S.M. Emerging flavour analysis methods in food authentication. In Instrumental Assessment of Food Sensory Quality; Kilkast, D., Ed.; Woodhead Publishing Ltd.: Cambridge, UK, 2013; pp. 284–312. [Google Scholar]
  22. Sharp, Z.D. Principles of Stable Isotope Geochemistry; Prentice Hall: Upper Saddle River, NJ, USA, 2006; p. 344. [Google Scholar]
  23. Drivelos, S.A.; Georgiou, C.A. Multi-element and multi-isotope-ratio analysis to determine the geographical origin of foods in the European Union. Trends Anal. Chem. 2012, 40, 38–51. [Google Scholar] [CrossRef]
  24. Hansel, A.; Jordan, A.; Holzinger, R.; Prazeller, P.; Vogel, W.; Lindinger, W. Proton transfer reaction mass spectrometry: On-line trace gas analysis at the PPB level. Int. J. Mass Spectrom. Ion Process. 1995, 149, 609–619. [Google Scholar] [CrossRef]
  25. Seibt, U.; Rajabi, A.; Griffiths, H.; Berry, J.A. Carbon isotopes and water use efficiency: Sense and sensitivity. Oecologia 2008, 155, 441–454. [Google Scholar] [CrossRef] [PubMed]
  26. Flores, P.; Fenoll, J.; Hellín, P. The feasibility of using δ 15N and δ 13C values for discriminating between conventionally and organically fertilized pepper (Capsicum annuum L.). J. Agric. Food Chem. 2007, 55, 5740–5745. [Google Scholar] [CrossRef] [PubMed]
  27. De Visser, S.N.; Freymann, B.P.; Schnyder, H. Trophic interactions among invertebrates in Termitaria in the African savanna: A stable isotope approach. Ecol. Entomol. 2008, 33, 758–764. [Google Scholar]
  28. Miller, D.L.; Mora, C.I.; Grissino-Mayer, H.D.; Mock, C.J.; Uhle, M.E.; Sharp, Z. Tree-ring isotope records of tropical cyclone activity. Proc. Natl. Acad. Sci. USA 2006, 103, 14294–14297. [Google Scholar] [CrossRef] [PubMed]
  29. Helliker, B.R. On the controls of leaf-water oxygen isotope ratios in the atmospheric crassulacean acid metabolism epiphyte Tillandsia usneoides. Plant Physiol. 2011, 155, 2096–2107. [Google Scholar] [CrossRef] [PubMed]
  30. Fráter, G.; Bajgrowicz, J.A.; Kraft, P. Fragrance chemistry. Tetrahedron 1998, 54, 7633–7703. [Google Scholar] [CrossRef]
  31. Takahiro, I.; Tsuyoshi, K.; Kazuhiko, T.; Fumio, M. Volatile components of Lily of the Valley (Convallaria majalis)-CHIRAROMA analysis. Koryo, Terupen oyobi Seiyu Kagaku ni kansuru Toronkai Koen Yoshishu 2006, 50, 79–81. [Google Scholar]
  32. Brunke, E.J.; Ritter, F.; Schmaus, G. New data on trace components with sensory relevance in flower scents. Dragoco Rep. 1996, 1, 5–21. [Google Scholar]
  33. Forsyth, S.A.; Gunaratne, H.Q.N.; Hardacre, C.; McKeown, A.; Rooney, D.W.; Seddon, K.R. Utilisation of ionic liquid solvents for the synthesis of Lily-of-the-Valley fragrance {β-Lilial®; 3-(4-t-butylphenyl)-2-methylpropanal}. J. Mol. Cat. A Chem. 2005, 231, 61–66. [Google Scholar] [CrossRef]

