Article

Optimizing the Genomic Evaluation Model in Crossbred Cattle for Smallholder Production Systems in India

by
Kashif Dawood Khan
1,
Rani Alex
1,
Ashish Yadav
1,
Varadanayakanahalli N. Sahana
1,
Amritanshu Upadhyay
1,
Rajesh V. Mani
2,
Thankappan Sajeev Kumar
2,
Rajeev Raghavan Pillai
2,
Vikas Vohra
1 and
Gopal Ramdasji Gowane
1,*
1
Division of Animal Genetics and Breeding, ICAR-National Dairy Research Institute, Karnal 132001, Haryana, India
2
Kerala Livestock Development Board (KLDB), Gokkulam, Thiruvananthapuram 695004, Kerala, India
*
Author to whom correspondence should be addressed.
Agriculture 2025, 15(9), 945; https://doi.org/10.3390/agriculture15090945
Submission received: 19 February 2025 / Revised: 22 April 2025 / Accepted: 23 April 2025 / Published: 27 April 2025

Abstract

:
Implementing genomic selection in smallholder dairy systems is challenging due to limited genetic connectedness and diverse management practices. This study aimed to optimize genomic evaluation models for crossbred cattle in South India. Data included 305-day first lactation milk yield (FLMY) records from 17,650 cows (1984–2021), with partial pedigree and genotypes for 1004 bulls and 1568 cows. Non-genetic factors such as geography, season and period of calving, and age at first calving were significant sources of variation. The average milk yield was 2875 ± 123.54 kg. Genetic evaluation models used a female-only reference. Heritability estimates using different approaches were 0.32 ± 0.03 (REML), 0.40 ± 0.03 (ssGREML), and 0.25 ± 0.08 (GREML). Bayesian estimates (Bayes A, B, C, Cπ, and ssBR) ranged from 0.20 ± 0.02 to 0.43 ± 0.04. Genomic-only models showed reduced variance due to the Bulmer effect, as genomic data belonged to recent generations. Breeding value prediction accuracies were 0.60 (PBLUP), 0.45 (GBLUP), and 0.65 (ssGBLUP). Using the LR method, the estimates of bias, dispersion, and ratio of accuracies for ssGBLUP were −39.83, 1.09, and 0.69; for ssBR, they were 71.83, 0.83, and 0.76. ssGBLUP resulted in more accurate and less biased GEBVs than ssBR. We recommend ssGBLUP for genomic evaluation of crossbred cattle for milk production under smallholder systems.

1. Introduction

The Indian dairy sector has experienced remarkable growth since independence, with India now ranked as the world’s leading milk-producing nation. In 2023–2024, India achieved an annual milk production of 239.30 million tonnes. Crossbred cows contribute significantly to milk production in India, accounting for 31.11% of total milk production and 56.89% of total cow milk production [1]. According to the 20th livestock census [2], the total cattle population in India is 193.46 million. Exotic and crossbred cattle constitute approximately 26.5% of the total cattle population, with crossbred Jersey holding the largest share at 49.3%, followed by crossbred Holstein Friesian (HF) at 39.3% [3]. The crossbreeding initiatives in India aimed to exploit the milk production potential of exotic breeds while harnessing the disease-resistance traits of indigenous cattle, which are native to the breeding region. In the studied region, Vechur cattle is the indigenous breed, which was primarily used as the recipient breed in which exotic inheritance was introgressed. This was carried out to enhance the milk production potential of the native breed.
Kerala is the southernmost state of India, with a significant number of crossbred cattle reared for dairy farming. The state is bestowed with a large cattle population of around 1.34 million, out of which crossbred cattle constitute 93.8% [2]. The total milk production during the year 2023–2024 in Kerala was 2.58 million tons. Kerala Livestock Development Board (KLDB) is responsible for recording the dairy cattle for milk yield and pedigree information. Crossbreeding has been a key strategy in Kerala’s dairy industry to enhance milk production, adaptability, and overall efficiency of cattle. The state primarily relied on crossbred animals, which combine the high milk yield potential of exotic breeds with the resilience and adaptability of indigenous cattle, Vechur, in the Kerala state of India. Despite the widespread adoption of crossbreeding, the genetic evaluation and selection of superior animals remain challenging due to the complex genetic architecture of crossbreds and the limited availability of genomic data. Dairy cattle breeding in Kerala has traditionally relied on the sire model for evaluation, and progeny testing (PT) has been the gold standard for dairy cattle breeding. Very recently, efforts have been made to include genomic information in the sire evaluation model, as well as the young sire and dam selection program under KLDB. This involves the use of a genomic selection strategy and also developing a model that suits better the existing structure of genetic evaluation. However, the most important question to be addressed is how to model the genomic evaluation of crossbred cattle in a smallholder production system.
Genomic evaluations can significantly enhance smallholder dairy farming by improving milk productivity. With optimization of breeding strategies, genomic tools enable more efficient and sustainable genetic improvement. Best Linear Unbiased Prediction (BLUP) provides unbiased estimates of breeding values in populations under selection, conditional on the inclusion of all information used in the selection decisions [4,5]. Genomic selection [6] has proven to be a valuable tool for enhancing genetic progress, particularly for sex-limited, difficult-to-measure, or low-heritability traits. Approaches like single-step genomic evaluation [7,8] and Bayesian genomic models [8] offer new opportunities for optimizing selection strategies. They are particularly valuable for smallholder systems with limited pedigree data. For example, Ojango et al. [9] reported a genomic selection program in Kenya for a smallholder production system. Major hurdles were the same, that is, individual smallholder farmers keep only a few animals. However, genomic relationships help create linkages under specified environments, providing a large herd group for which a breeding program was implemented. Powell et al. [10] used simulation to show that incorporating genomic information can enable accurate genetic evaluations even in herds with very few cows, demonstrating that genomic evaluations can effectively overcome the lack of strong pedigree records in low-to-middle-income smallholder systems. Similarly, Al Kalaldeh et al. [11] used genomic data in smallholder crossbred dairy farms in India for estimating genomic breeding values, illustrating how genomic data can drive immediate genetic improvement and boost productivity in settings where traditional record-keeping is limited. Gowane et al. [12], using simulated data, could present the improvements in accuracy of prediction for breeding values using shallow pedigree data in addition to genomic data for a smallholder dairy breeding system. Multi-breed evaluations were also shown to be a promising approach when the reference is small for each breed [13].
Genomic selection has revolutionized animal breeding by improving the accuracy of breeding value estimation, especially in crossbred populations. In the past decade, genomic information has been successfully utilized to predict breeding values in dairy cattle [14], leading to significant transformations in the dairy industry. However, applying genomic prediction remains still challenging for smallholder dairy cattle breeding systems [15].
Recent studies have demonstrated improved accuracies and unbiased estimation of GEBV with the single-step method in loose-structured dairy cattle breeding scenarios in India [12,16]. It was observed that ssGBLUP offers several advantages, including simplicity, prevention of double-counting genomic information, and resilience to biased predictions resulting from the pre-selection of young animals [17,18,19,20,21,22,23]. However, implementing genetic improvement strategies in smallholder populations is challenging; the principal reason is poor data recording, very small herd size [22], and variation between the production environments between farms and over time [23]. Smallholder dairy production systems are only found in the Asian and African continents, and hence not much work on this aspect is found in the literature. Trivedi et al. [24] reflect on the state of genetic improvement, where implementing a classical progeny testing (PT) program was considered not feasible; however, the introduction of genomic selection was considered very relevant, given obvious advantages in accuracy. Costilla et al. [25], while working on a smallholder crossbred dairy system, reported that genomic selection can help in enhancing genetic gains; however, the evaluation system needs to be tailored to the local conditions, such as small farm sizes.
In the current study, research gaps were addressed that focused on addressing local issues. Pedigree information for the field crossbreed was not complete, and there were several holes in the pedigree. Genomic information was available only for a small fraction of data (~10%), and integrating these data with a weak pedigree was a challenge. Herd size was very small, and creating an evaluation model was tricky. Efforts were made to model the field-recorded data accurately so that sources of variation are captured in detail. Further, we also aimed to identify and use the most appropriate genomic prediction methodology for obtaining genetic parameters and also genomic estimates of breeding values for the crossbred cattle. Our study fills this gap by developing flexible genetic evaluation models that incorporate both genomic and spatial information, addressing the unique constraints of smallholder systems and advancing breeding strategies in low-to-middle-income contexts.
Accordingly, the objective of the current study was to optimize the genomic evaluation strategy for crossbred cattle in smallholder production systems in India’s southernmost state, Kerala. Until now, only traditional approaches have been used for candidate selection in breeding programs. The novelty of the work lies in the implementation of the genomic evaluation strategy and its continued use in the breeding program for crossbred cattle of Kerala. The findings will contribute to more precise selection decisions, improved genetic gain, and the long-term sustainability of Kerala’s dairy industry.

2. Materials and Methods

2.1. Source of Data

The genotypic data, phenotypic data, and pedigree information on crossbred cattle of Kerala were obtained from Kerala Livestock Development Board Ltd. (KLDB), Gokulam, Pattom, Thiruvananthapuram-695004, Kerala, India.

2.2. Type of Data

2.2.1. Phenotypic Data

The phenotypic data for 305-day milk yield of 17,650 crossbred cattle in their first parity were collected and used for the present study. The typical pedigree structure involved 18,858 animals and 17,650 animals with records; however, 3399 animals had both parents known, 18,769 had the sire known, and only 3402 animals had the dam known. Moreover, 86 animals were without any information about their parents.

2.2.2. Genotypic Data and Quality Control

The genotypic data consisted of 1004 bulls and 1568 cows genotyped using the Affymetrix Axiom 50K genotyping array (Thermo Fisher Scientific, Waltham, MA, USA). Out of the total animals, 941 cattle were genotyped using the Affymetrix Axiom 50K SNP array, 710 cattle were genotyped using the MiniHD SNP array (Axiom Bovine Genotyping array Thermo Fisher Scientific, Waltham, MA, USA), and 921 cattle were genotyped using the Affymetrix Axiom 777K SNP array (Axim Genome-Wide BOD1 Array, Thermo Fisher Scientific, Waltham, MA, USA). A set of common 50K SNPs (51,373 SNPs) based on the rsIDs of 50K SNPs using PLINK 1.9 [26] from all three arrays was used.
The genotypic data were subjected to quality control procedures to ensure consistency and reliability for genetic evaluation. Unmapped SNPs, sex chromosomes, and mitochondrial SNPs were removed from the dataset using PLINK 1.9 [26]. Genotypic call rates less than 90% (<90%) for SNPs were maintained to reduce the amount of missing data and allow a more complete picture of the genetic information. The minor allele frequency (MAF < 1%) was necessary to avoid uninformative SNPs. In addition, Hardy–Weinberg equilibrium (p < 0.0001) was considered as filtering criteria for SNPs to be considered for further analysis.

2.3. Statistical Analysis

The available sources of variation were tested for statistical significance using the general linear model (GLM) procedure in R programming (RStudio v2024.12.1+563 software) with the ‘lsmeans’ package [27] to identify significant factors for further genetic analysis. The following statistical model was used:
yijklmnop = µ + AFCi +POCj + SOCk + Geol + POBm + SOBn + Unito + eijklmnop.
where yijklmnop is the 305-day milk yield; µ is the overall mean of observations; AFCi is the fixed effect of the ith age at first calving; POCj is the fixed effect of the jth period of calving; SOCk is the fixed effect of the kth season of calving; Geol is the fixed effect of the lth geographical region; POBm is the mth period of birth; SOBn is the nth season of birth; Unito is the oth unit (different herds constitute one unit in a village); and eijklmnop is the residual error. The significant fixed effects were further used in the genetic analysis using a mixed model, as shown below.

2.4. Estimation of (Co)variance Components

To estimate (co)variance components based on pedigree and also with genomic information, the following mixed model equation was used:
y = + Zu + e
where y is a vector of observations; b is a vector of fixed effects; a is a vector of direct additive genetic effects of individual animals; b is a vector of residual errors; and X and Z are known incidence matrices for fixed and random effects, respectively. Assumptions in the model were a~N (0, 2a) and e~N (0, I σ2e), where A is the numerator relationship matrix between animals derived from pedigree, I is an identity matrix, and σ2a and σ2e are additive genetic and residual variances, respectively.
The variance components were estimated using the Restricted Maximum Likelihood (REML) procedure with an average information algorithm (AIREML) implemented in the BLUPF90+ family of programs [28]. The pedigree approach used the numerator relationship matrix (A), and genomic methods used the genomic relationship matrix (G) or realized single-step matrix (H), depending on the model for analysis.

2.5. Breeding Value Prediction Models

2.5.1. Pedigree-Based Prediction of Breeding Values

Pedigree and phenotype data were used to estimate the breeding values (EBV), prediction error variance (PEV), and genetic parameters using the animal model as shown in Equation (2) using the BLUPF90+ package [28]. Several fixed effects, such as age at first calving, period of calving, season of calving, and geographical region, were used in the model along with the random additive genetic effect of the animal.

2.5.2. Genomic BLUP (GBLUP)

GBLUP was used to estimate genomic breeding values for genotyped animals. SNPs left after quality control were used to construct a genomic relationship matrix (G) using the BLUPF90 family of programs [28]. The model used for analysis is expressed as follows:
y = Xb + Zg + e
where g is a vector of additive genetic effects of the individual animal, with g~N (0, 2g), and other terms are defined as in Equation (2). G was established as per VanRaden [29].
G = Z Z 2 p j ( 1 p )
where Z is the expression of MP; M is the matrix of genotypes with columns indicating the markers and rows representing the animals; and p is the frequency matrix of the second allele pj, expressed as 2pj.

2.5.3. Single-Step GBLUP (ssGBLUP)

ssGBLUP analysis combined pedigree and genomic information in a single-step procedure. The variance components in the data were estimated first using the AIREML approach and then incorporated in the single-step method. The mixed model Equation (2) is valid; however, u is the vector of direct additive genetic effects of individual animals, assumed to be normally distributed with u~N (0, 2u). The H matrix included both non-genotyped and genotyped individuals [7,30]. Typically, in this dataset, we had 2273 genotyped animals and 18,858 animals with data on pedigree. Other terms are already defined as above. We also scaled G based on A22 by equating the mean of the diagonal of A22 with the mean of the diagonal of G.
H 1 = A 1   +   0 0 0 G 1 A 22 1
where G−1 is the inverse of the genomic relationship matrix and A22−1 is the inverse of the numerator relationship matrix for genotyped animals.

2.5.4. Genomic Evaluation Using the Bayesian Alphabets

A Bayesian approach was used for estimating genetic parameters and predicting breeding values. Here, prior assumptions about the distribution of marker effects were used to obtain the posterior distribution for the marker effects. Genomic prediction models were fitted using four Bayesian specifications, the so-called Bayesian Alphabet [31]: Bayes A, Bayes B, Bayes C, and Bayes Cπ. For these methods, the general statistical model used is expressed as follows:
y = 1   +   Xb   + j = 1 k z j a j + e
where y is an n × 1 vector of trait phenotypes (305-day milk yield); X is an incidence matrix of the fixed effects in b; k is the number of markers fitted; zj is an n × 1 vector denoting the genotypes of the animals for marker j; aj is the effect of marker j; and e is a vector of residual effects. The SNP genotypes were coded as 0, 1, and 2, representing the number of copies of the reference allele in locus j. The vector of residuals e is assumed to be distributed as e~N (0, 2e), where σ2e is the residual variance.
The Bayes A method [6] assumed that the conditional prior distribution of a marker effect aj was Gaussian with null mean and marker-specific variance σaj2, independent from each other. The variance associated with the effect of each marker was assigned a scaled inverse chi-square prior distribution, p(σaj2) = χ−2(σaj2|ν, S2), where ν and S2 are known df and scale parameters, respectively. The marginal prior distribution of each marker effect, p(aj|ν, S2) = ∫ N(σaj|0, σ σaj2)χ−2(σaj2|ν, S2)∂ σaj2, was a t-distribution, that is, p(σaj|v, S2) = t(0, v, S2) [32]. In the Bayes B method, most of the genetic markers had zero effect, and only a few loci contributed some genetic variance [6]. Conditional on the marker-specific variances σaj2, non-null marker effects were assumed to be Gaussian N (aj|0, σaj2). In Bayes C, the prior assumption was that marker effects had identical and independent mixture distributions, where each had a point mass at zero with probability π and a univariate–normal distribution with probability 1 − π having a null mean and variance σ2α, which in turn had a scaled inverse chi-square prior with scale parameter S2α and να degrees of freedom. Then, with π = 0, the marginal distribution of locus effects becomes a multivariate t distribution with null mean, scale matrix S2I, and να degrees of freedom. Bayes Cπ had the proportion “π” (i.e., the proportion of markers without an effect on the trait), which was allowed to vary during the analysis and was estimated from the data. In Bayes Cπ, π was treated as unknown with a uniform prior.

2.5.5. Single Step Bayesian Regression (SSBR)

A single-trait ssBR model with the assumption of all markers having nonzero effects [8] was used as follows:
y 1 y 2 = x 1 x 2 β + z 1 0 0 z 2 M 1 α + ε M 2 α + Wu + e
where subscript 1 denotes non-genotyped individuals and 2 denotes genotyped individuals. y and β represent a vector of phenotype and a vector of fixed effects, respectively. X, Z, and W were design matrices; matrix M2 contains observed marker covariates for genotyped individuals; matrix M1 contains imputed marker covariates for non-genotyped individuals via a linear relationship with M2; α is the vector of random marker effects α~N (0, I σ2α), where I is the identity matrix; ε is the vector of imputation residual deviations ε~N [0, (A11A12 A22−1 A21) (1−ω) σ2g] due to the inaccuracy of imputation [8], where A11, A12, A22, and A21 are the sub-matrices of A; σ2α and σ2g are marker variance and total genetic variance, respectively; w is the ratio of residual polygenic to total additive genetic variance (10%); u is a vector of residual polygenic effects u~N (0, Aw σ2g) that are not captured by markers; and e is a vector of residuals e~N (0, I σ2e).
All Bayesian methods of prediction were conducted using the hiBayes package in R [33]. A total of 2273 genotyped animals having 51,373 SNPs were included for analysis, and the model fitted included both fixed effects and random effects with MCMC iterations of 20,000, burn-in of 12,000, and a thinning interval of 5. In ssBR 18,858 animals were included for analysis, out of which 2273 animals were genotyped.

2.6. Estimated Accuracy

The PEVs obtained from PBLUP, GBLUP, and ssGBLUP were used to estimate the accuracy of EBV and GEBV for the analyzed trait. Accuracies of (G) EBV (ri) from the prediction error variance (PEV) were calculated as follows [34]:
r i = 1 S E P i 2 / σ a 2
where i is the ith number of animals, SEP is the standard error of prediction, and σ a 2 is the direct additive genetic variance for the analyzed trait. PEV is the error deviation range of the EBV and GEBV estimated for each individual. It is the diagonal element of the inverse left-hand side of the mixed model equation of BLUP. All the genetic analyses, namely BLUP, GBLUP, and ssGBLUP, were carried out using the BLUPF90 family of packages [28].

2.7. LR (Linear Regression) Method

To find out the better method for breeding value prediction, a rather simplified approach using the LR (linear regression) method proposed by Legarra and Reverter [35] was used. We defined partial (p) and whole (w) datasets, so the partial dataset contains all information until 2017, and the whole dataset contains all information available for the analysis until 2020. The following three different statistics were obtained:
  • Bias (∆p): The estimator of the bias is obtained from the difference between the mean of GEBVp and the mean of GEBVw, ∆p = up − uw. In the absence of bias, the expected value of this estimator is 0.
  • Dispersion (bp): The estimator of dispersion of GEBV is the slope of the regression of GEBVw on GEBVp, b p = c o v ( u p , u w ) v a r u p . If over- or under-dispersion does not exist, the expected value of the estimator is 1; values of bp < 1 indicate over-dispersion; and values of bp > 1 indicate under-dispersion.
  • Ratio of accuracies (ρw,p): This estimator estimates the inverse of the relative gain in accuracy from GEBVp to GEBVw. It is the correlation between GEBVp and GEBVw, ρ w p = c o v ( u p , u w ) v a r   u p   v a r   u w , and the expected value is accp/accw. A high value of this estimator means a small increase in accuracy, whereas a low value means a large increase in accuracy when we add phenotypic information to genetic evaluations. This can be seen also as the relative increase in accuracy brought by phenotypes is 1 ρ w p − 1.
Looking into the completeness of the data and also agreeable estimates of genetic parameters in this study, LR was carried out for more inclusive methods, ssGBLUP and ssBR.

2.8. Genetic Trend for 305-DMY in Crossbred Cattle

The genetic trend of 305-DMY was obtained by plotting the estimated breeding values (EBV) and GEBV against the year of birth (YOB). Genetic response in the trait was calculated using the formula R  =  iσph2, where R is the direct response expected in the progeny in each generation, h2 is the heritability of the trait, i is the intensity of selection, and σp is the phenotypic standard deviation of the trait.

3. Results

3.1. Descriptive Statistics

A basic data structure including simple arithmetic mean with standard error, standard deviation, and coefficient of variation of 305-DMY for crossbred cattle along with preliminary pedigree information are presented in Table 1.

3.2. Generation of Genotypic Data

A total of 51,373 SNPs were used for the analysis. Quality control (PLINK 1.9) for genotypic call rate (<90%), minor allele frequency (MAF < 0.01), and Hardy–Weinberg equilibrium (HWE < 0.0001) retained 45,585 SNPs for 2273 animals and were used for further analysis.

3.3. Least Squares Analysis for 305-Day Milk Yield (305-DMY) in Crossbred Cattle

The least squares mean for first lactation 305-DMY was 2875 ± 123.54 kg in the studied population. Age at first calving (AFC), period of calving (POC), season of calving (SOC), period of birth (POB), geographical region, and units were found to be highly significant (p < 0.001) sources of variation for milk yield and hence were included in the animal model to estimate genetic parameters and prediction of breeding values. Modeling the fixed effects in the analytical model was the trickiest part. The least squares mean and level of significance of fixed effects are shown in Table 2. The geographical region had a highly significant (p < 0.001) effect on 305-DMY in crossbred cattle. Cows reared in highland geography produced more milk compared to midland and lowland geography. AFC at more than 1402 days showed the highest milk production (Table 2) as compared to other AFC classes. The period of calving was also highly significant (p < 0.001) for 305-DMY. It was observed that with the increasing POC, the milk yield of this population also increased. This can be a result of continuous improvement in management practices and awareness of farmers for the economics of milk production. Animals that calved during the period between the years 2020 and 2022 had the highest milk production as compared to other periods of calving (Table 2). Season of calving (SOC) also had a significant (p < 0.001) effect. Cows that calved during the winter season (January–February) had higher milk production (3171.07 kg) as compared to other seasons. Period of birth (POB) had a significant (p < 0.001) effect on 305-DMY; however, POB showed a fluctuating trend. Units also showed a significant (p < 0.001) effect on 305-DMY, with animals reared in Kattappana having the highest milk production (4005.57 kg) as compared to other units (Table 2).
This study analyzed factors influencing 305-day milk yield (305-DMY) in crossbred cattle under smallholder systems. The average first-lactation 305-DMY of 2875 kg indicated moderate productivity typical of smallholder systems with resource constraints. The probable factor influencing productivity was geography, as highland regions outperformed mid/lowlands likely due to cooler climates reducing heat stress and better forage availability. A similar interpretation can be made for winter yields, as the climate is supportive of production. The older cows calving later (>1402 days) had more productivity, suggesting delayed maturity or suboptimal early-life nutrition in smallholder herds. The Kattappana unit achieved higher yields (4005 kg) as compared to other units, possibly due to localized advantages (e.g., superior management practices and extension services). It will be essential to look into the practices and educate farmers in other villages to adopt them for better productivity. Studies indicate targeted interventions (e.g., heat stress mitigation in lowlands, winter calving support) can enhance productivity in the future progeny. The delay in AFC and its performance in productivity highlights a need for better heifer management to balance productivity and economic returns. We understand that the smallholder milk production systems are shaped by environmental, managerial, and temporal factors. Addressing these through context-specific strategies could harbor productivity gains while acknowledging systemic constraints.

3.4. Genetic Parameter Estimation

Genetic parameters were estimated using AIREML. Pedigree-based estimation used a relationship matrix from 18,858 animals in the pedigree. However, due to the loosely structured dairy cattle breeding system, there were several holes in the pedigree. Moreover, 86 animals did not have information on both parents, and 15,456 animals did not have information on dams. This situation is common across most of the field genetic evaluation schemes and brings a plethora of problems for the construction of an accurate relationship matrix. Genomic REML was used for 2273 genotyped animals, which used GRM-based relationships. We also used a single-step procedure where genomic information using the H matrix for 18,858 animals was used for single-step GREML estimation. The heritability estimates for 305-DMY were 0.32 ± 0.03 using a numerator relationship matrix (NRM)-based approach. The estimate was slightly higher when ssGREML was used for estimation (0.40 ± 0.03). The estimates from ssGREML could reduce the error variance from the model, and thus the additive variance for using genomic information was more for the entire dataset. For GREML estimation, data on 2273 genotyped animals were for a relatively recent time period. Due to consistent selection over the period, the additive variance as well as phenotypic variance declined as a result of the Bulmer effect [36]. The heritability estimate using only genomic information was 0.25 ± 0.08. For GREML, total variance as well as additive variance was significantly reduced as compared to complete data (Table 3).
The estimates of heritability and variance components using different Bayesian models are depicted in Table 3. The estimates using Bayes A were similar to the estimates obtained from GREML, owing to similar prior assumptions; however, for other approaches, the estimates were lower. The ssBR approach with Bayes A had an estimate that was similar to the ssGREML approach owing to the inclusion of a complete pedigree dataset and the inclusion of genomic information for recently genotyped animals. Legarra [37] reviewed the methods for genetic parameter estimates. The models that used pedigree data (REML, ssGREML) could more accurately trace back to the base allele frequency, and hence estimates were similar. GREML or other Bayes methods that used only genomic data on recent animals had real allelic frequency. The estimates were therefore based on current allele frequency.
The pedigree-based approach had significant gaps. Such incomplete pedigrees are typical in smallholder systems due to informal breeding practices, reducing the accuracy of traditional genetic evaluations. Pedigree-inclusive methods (REML/ssGREML/ssBR) traced base population allele frequencies, while genomic-only methods reflected current allele frequencies. This divergence explains differences in heritability estimates, as genomic methods capture recent selection pressures. Integrating genomic data with traditional pedigrees (via ssGREML) offers the most robust parameter estimates for smallholder systems, addressing pedigree gaps while accounting for selection effects.

3.5. Prediction of Breeding Value

We obtained the breeding values for the sires using PBLUP, GBLUP, ssGBLUP, Bayes A, Bayes B, Bayes C, Bayes Cπ, and ssBR. Average accuracies for prediction of breeding values for all animals in the data were 0.60 ± 0.001 for PBLUP, 0.45 ± 0.002 for GBLUP, and 0.65 ± 0.001 for ssGBLUP, respectively. We could see that the overall accuracy for GBLUP was low as compared to PBLUP and ssGBLUP approaches, and the highest accuracy or reliability of prediction of breeding value was obtained using the ssGBLUP method. The limited genotyped animals (2273) in GBLUP lead to a reduction in genomic information density. In addition, out of 2273, only 1070 animals had records. Other animals were either males or young candidates and hence did not contribute to the BLUP solutions of the random effect. Exclusion of ungenotyped animals, omitting pedigree context, also leads to lower prediction accuracy in the GBLUP. Higher accuracy in ssGBLUP was obvious due to an extra source of information (genomic) in addition to pedigree, which helped to gain real allele frequencies in current generations and could also trace them back to the base allele frequency using pedigree information. ssGBLUP is best suited for fragmented smallholder systems, where pedigree gaps and recent genomic data coexist. Bayesian frameworks (e.g., MCMC sampling) do not directly compute the inverse of the mixed model equations (MME), unlike REML-based methods. ssGBLUP’s higher accuracy justifies investments in genotyping key animals and digitizing pedigree records. Henderson [38] showed that the inverse of the LHS of the MME can be easily used to obtain the standard error of prediction (SEP), thus leading to the development of obtaining the prediction error variance (PEV) and hence the accuracy of breeding value for REML-based methods (Figure 1).

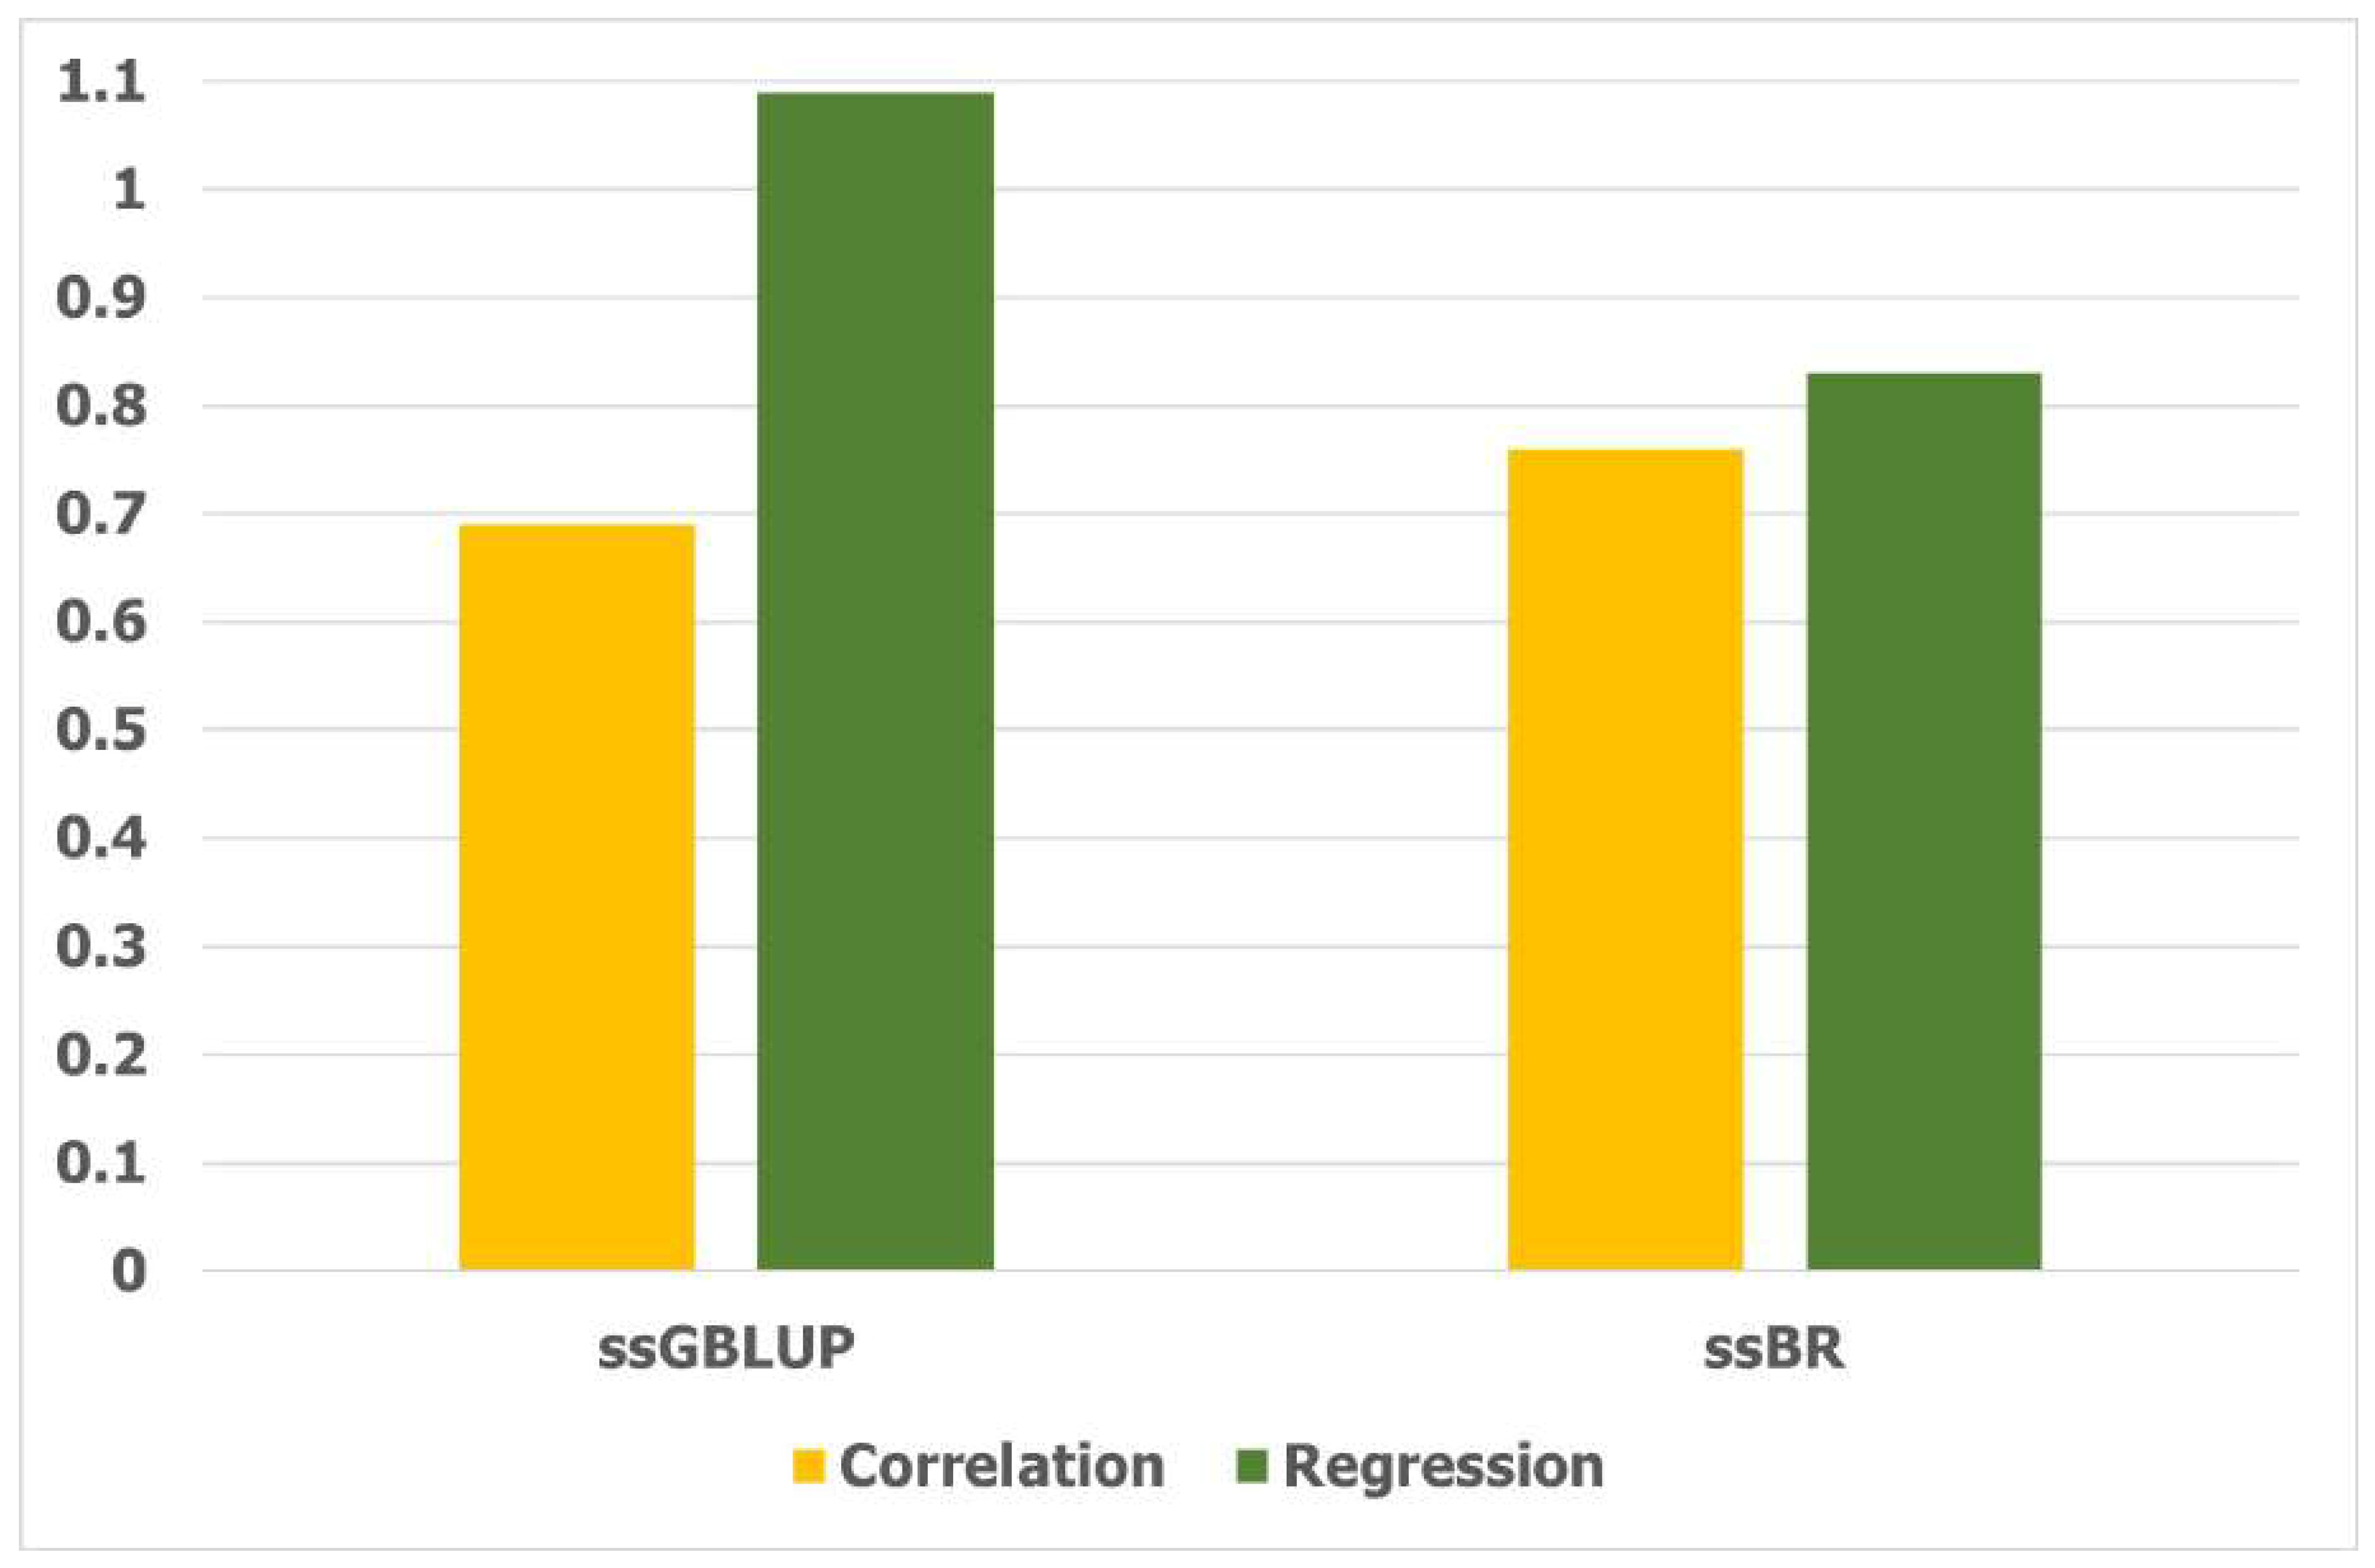
3.6. LR Method for Accuracy of Prediction for GEBV
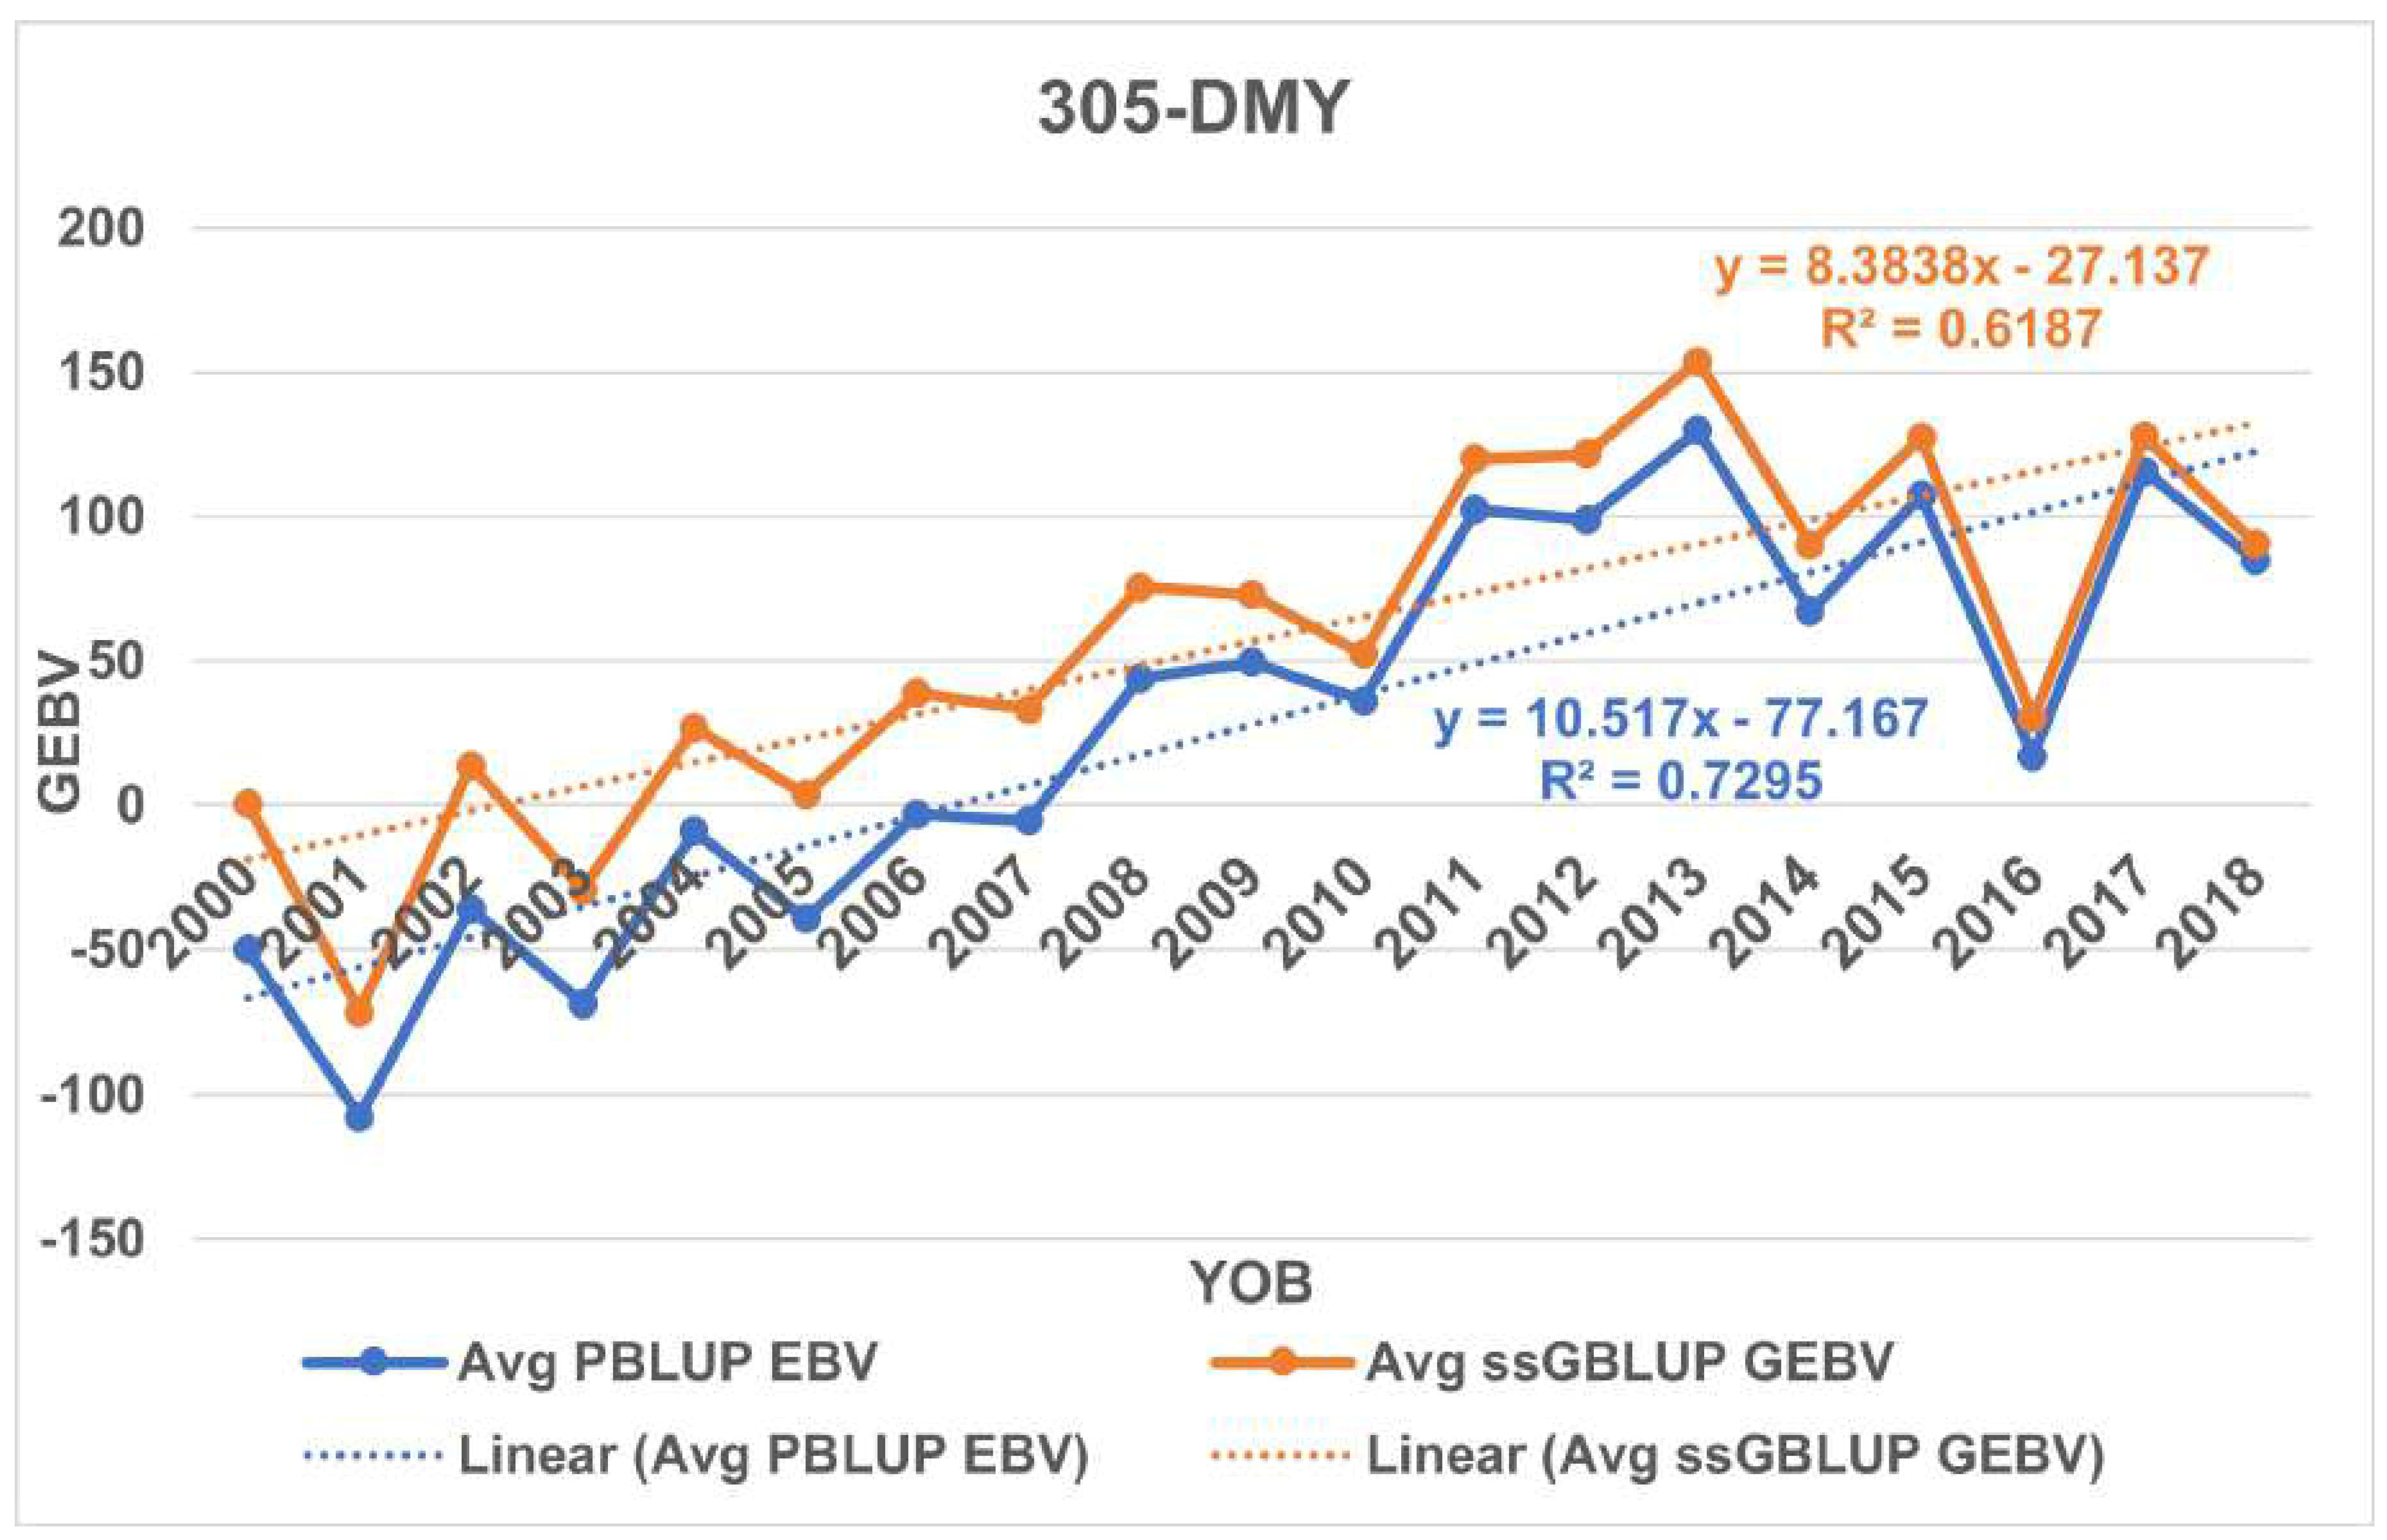
On the basis of PEV-based accuracy, the ssGBLUP method results in more accurate GEBV. ssBR resulted in similar estimates of heritability as that of ssGREML; however, we cannot estimate PEV for BV generated out of that method. Therefore, in order to select the better method of breeding value prediction from ssGBLUP and ssBR, we have implemented the LR method to obtain accuracy, bias, and dispersion for sires using whole and partial data (Figure 2).
For ssGBLUP, the value of the estimate for bias was −39.83. The negative value of the bias indicates that the GEBV for the partial dataset was under-evaluated. The dispersion of the GEBV, which is the slope of the whole on the partial dataset, was 1.09, which clearly indicates that the GEBV was unbiased. The ratio of accuracies obtained through correlation was high (0.69), indicating accurate genomic estimated breeding values using the ssGBLUP method. The relative increase in accuracy brought by phenotypes for ssGBLUP was 0.45. For the Bayesian approach ssBR, the GEBV estimates were highly biased, with an estimate for slope as 0.83 with a bias of 71.83 units. The accuracy obtained using LR for ssBR was 0.76, with a relative increase in accuracy for ssBR of 0.31. Results clearly indicate that the ssGBLUP method remains a method of choice owing to unbiased estimates of GEBV.
ssGBLUP’s integration of phenotypes (relative gain +0.45) is vital in systems where genomic data are sparse but field records are available. This indicates resource efficiency of the method. Unbiased GEBVs also prevent long-term stagnation from skewed selection. ssBR’s bias could lead to inflated expectations and poor genetic gains. We could also infer that ssGBLUP’s computational simplicity and reliance on proven BLUP methodology align with smallholder constraints, unlike ssBR’s complex Bayesian priors and MCMC requirements.

3.7. Genetic Trend

The genetic trend for 305-DMY was plotted for the present study (Figure 3). We have ignored the data from 2019 to 2021 due to the low number of observations. Figure 3 shows the genetic trend of 305-DMY using PBLUP EBVs and ssGBLUP GEBV in crossbred cattle. Genetic gains of 10.52 kg per year and 8.38 kg per year were reported using PBLUP and ssGBLUP, respectively, for 305-DMY in crossbred cattle. The genetic trend for 305-DMY does show the positive impact of the selection. ssGBLUP provides a more accurate and sustainable foundation for genetic improvement in smallholder systems. The true potential of genomic selection is likely yet to unfold, promising enhanced gains as adoption grows and data quality improves. This aligns with the need for equitable, long-term productivity gains in resource-limited settings.

4. Discussion

This study tried to emphasize the impact of the implementation of genomic selection in resource-constrained conditions. The broader objective was to see the gains in terms of accuracy of prediction of breeding values in smallholder production systems for crossbred cattle under varying management conditions. We could observe that the trait of interest (305 DMY) was very sensitive to the sources of variation, and hence construction of an accurate model for estimation of the genetic parameters and estimation of breeding value was very important. This was due to the field recording of animals. As resources available to every farmer affect the resource allocation to the animals, their performance was also affected to the same degree. We could see the differences in production level from region to region and season to season depending on the natural resource availability for animals. This is very important from the Indian perspective, as dairy cattle breeding is not intensively managed, and hence the availability of natural resources affects the milk production ability of the animals significantly. Lessons learned from this study can be further used for point-of-care solutions to differential management, geography, and other significant factors. A detailed study by Al Kalaldeh et al. [11] also emphasizes the importance of incorporating SNP genotyping along with smallholder data recording while constructing a genetic evaluation model in a smallholder production system. Mrode et al. [39,40] also demonstrated that incorporating genomic information enables genetic evaluations with limited pedigree data and supports the initiation of breed improvement programs aimed at enhancing productivity.
In pedigree-based genetic evaluation, it is presumed that individuals in the base population are not selected, having nearly zero inbreeding coefficient [41]. Under the infinitesimal genetic model, all subsequent selection is conditional on the unselected base population and is accounted for in BLUP [4], provided all data are used for analysis. However, when genomic prediction relies solely on genotyped animals, this condition is not satisfied, leading to biased predictions. This bias, as illustrated in the GBLUP scenarios in this study, manifests as an under-dispersion of the GEBVs.
The estimate of heritability using only genomic data was low (0.25 ± 0.08) compared to PBLUP and ssGBLUP models. This aligns with previous studies suggesting that heritability estimates based on the G matrix tend to be lower than those based on the A matrix [42,43]. We could also see high estimates of additive genetic variance in ssGBLUP models as compared to the GBLUP model. As genomic-only methods reflected current allele frequencies and possibly the Bulmer effect [44,45], which captures recent selection pressures, lower estimates were expected. The crossbred cattle of Kerala were under selection since the pedigree information was used for the progeny testing program. This study revealed the importance of ssGREML as the most robust parameter estimation method for smallholder systems, addressing pedigree gaps while accounting for selection effects. Similar findings but with a slight increase in heritability and increase in additive genetic variance components using pedigree methods were earlier reported [45,46]. The choice of method to estimate genetic parameters was very important.
A study by Peters [47] in Canadian Holstein cows reported an overall mean estimate of heritability from PBLUP, GBLUP, and Bayes B models as 0.31, 0.13, and 0.13, respectively, for 305-day milk yield. Veerkamp et al. [46] reported estimates of heritability for milk traits in Dutch Holstein cattle in the range of 0.41 to 0.48 for milk yield. Estimates of heritability using the GRM based on the bovine HD Bead chip were 0.31, 0.39, and 0.51 [48] and 0.21, 0.33, and 0.40 [49] for MY, FY, and PY, respectively, in Danish Holstein populations. Karimi [50] predicted the reliability and the prediction bias of the GBLUP method for Canadian Holstein bulls and estimated heritability of 0.41 for MY. All these estimates reveal that milk yield is a moderately heritable trait, which is also seen in our study. This gives us a clear indication of further progress in genetic improvement if proper selection strategies are applied in the breeding program.
One important aspect of this study was also to choose the most accurate as well as unbiased method of estimation for prediction of genomic breeding values. This has a broader implication. Retention of bias in GEBV and predicting inaccurate GEBVs lead to wrong selection decisions and may ultimately lead to losses to the producers. If the accuracy is low, there is a greater risk that the (G)EBVs are not reliable, and if the bias of prediction is high, then there is a risk of selecting an animal with an inflated or deflated breeding value. We observed higher accuracy as well as the least biased estimation using the ssGBLUP method. This can have an impact on future selection of the progeny where selection candidates in the breeding program will be chosen. This will also lead to a higher as well as a faster pace of genetic improvement. The accuracy of genomic prediction largely depends on the size of the reference population [21,51], the relationship between animals in the reference population and the target animals to be predicted [52], selective genotyping for creation of reference [21], the quantum of linkage disequilibrium (LD) between the SNPs and QTL in the population and the distribution of the QTL effects [53], the heritability of the trait, and, of course, the prediction method used. All of these can be changed to improve accuracy. Our study found that ssGBLUP caused an 8.33% and 44.44% increase in accuracy compared to the PBLUP and GBLUP, respectively, for milk yield in crossbred cattle. The gain for ssGBLUP over PBLUP was only 8.33%. This was due to significant missing relationships in the pedigree; the H matrix in single-step was not able to impute very accurate genomic relationships to the individuals in the pedigree. However, we still see that with holes in the pedigree, ssGBLUP performs better than PBLUP. Similar results were reported earlier in a simulation study [12], where the use of ssGBLUP, even with shallow pedigree information, led to an extra gain in the accuracy of prediction for GEBV.
The average accuracy for prediction of breeding values for all animals in the data using prediction error variance was 0.60 ± 0.001 for PBLUP, 0.45 ± 0.002 for GBLUP, and 0.65 ± 0.001 for ssGBLUP, respectively. Brown et al. [54] reported an accuracy of prediction from 0.32 to 0.41 for milk yield with a reference population of 1013 crossbred Kenyan cows. Nayee [55] compared the methods of various sire evaluation, for the first lactation milk yield in Holstein–Friesian crossbred cattle. They compared PBLUP and ssGBLUP for three sets of data for all sires, genotyped sires, and non-genotyped sires and found that ssGBLUP was more accurate than that of PBLUP. Christensen and Lund [30] compared the accuracy of breeding value for ssGBLUP, PBLUP, and GBLUP for a simulated dataset and found that the accuracy of GEBV was 65.98%, 35.37%, and 58.69% for ssGBLUP, PBLUP, and GBLUP. Gowane et al. [15] showed the superiority of ssGBLUP over GBLUP and PBLUP under an intensive selection program, where accuracy was 0.45 for PBLUP (10,000 animals), 0.47 for GBLUP with 1000 selectively genotyped animals, and 0.59 for ssGBLUP.
Thompson [56] discussed methodologies for the statistical validation of genetic models for evaluation [57,58]. Today, different genetic considerations may lead to varying prediction models, in particular in the area of genomic selection. Thus, the question “Which model is the best?” is more important currently than ever. Earlier reports have shown concern regarding bias for the genomic predictions of young bulls [59,60]. Reverter et al. [61] presented three statistics related to dispersion, accuracy, and genetic gain, obtained from subsets of EBV of successive evaluations. The LR method is developed over the ideas of Reverter et al. [61]. With the help of standard BLUP theory, it is possible to infer biases and also accuracies at the population level by comparing old and new EBV [35]. In our study, the estimates of bias, dispersion, and ratio of accuracies for ssGBLUP were −39.83, 1.09, and 0.69, respectively, which clearly showed more accurate and less biased estimates of GEBV. However, the estimates of LR for ssBR yielded highly biased estimates of GEBV as compared to ssGBLUP. Lopez-Correa et al. [40], in their study of Holstein cattle, found that all models were biased, but all methods showed a bias of ~100 for validation bulls.
This study focused on crossbred cattle in Kerala’s smallholder systems, and we could propose a model for genetic evaluation in the breeding program. It underscored the potential of ssGBLUP for genetic improvement in resource-constrained systems. However, the limitation of this study is that it is locally important, and the findings may not fully apply to other agroecological zones, breeds, or production systems with distinct management practices, genetic backgrounds, or environmental stressors. Spatial differences in resource availability, farmer practices, and trait prioritization can affect the efficacy of genomic selection models. Regional and seasonal variations were studied and incorporated while modeling the data in this study; however, recording and using significant covariates (e.g., feed quality, heat stress indices, or disease prevalence) in the GS models can influence the model’s accuracy significantly. Future studies need to focus on these aspects. The missing pedigree relationships and selective genotyping are the key issues in this study. Earlier studies using simulated data [12] indicated the bias introduced by these factors, even for ssGBLUP estimates. We understand that these data may have introduced residual biases. This study’s reliance on field-recorded data, although practical, poses a risk of inconsistencies in phenotyping.
Future work in the smallholder system of Kerala crossbreeding needs to bridge technical advancements with practical, farmer-centric solutions to ensure equitable and sustainable gains. Genotype–environment interactions, nonadditive genomic modeling, and differential genomic backgrounds of the animals are some of the issues that need emphasis in this population to exploit maximum gains from using genomic selection for smallholder production systems. Negative impacts of the genomic selection were usually seen on fitness traits if they were intensively selected for production [62,63]. Keeping in view the wide impact of the genomic selection for fitness, future breeding policies must also keep a fitness trait in the selection index along with milk production for crossbred cattle of Kerala.

5. Conclusions

Setting up a model of genetic evaluation for loose-structured dairy cattle breeding is not straightforward. We learned and suggested that the prediction model should include all the possible sources of variation and model them accurately, especially when the data are recorded from a field with a very small herd size per owner with several holes in pedigree. The heritability estimate for the milk yield was moderate, indicating further scope for selection to enhance milk production potential of crossbred cattle of Kerala. This study concluded that it is feasible to use ssGBLUP in this population to perform the genomic evaluation due to more accurate and unbiased estimates of GEBV as compared to other methods of prediction. In a typical animal breeding program of crossbred cattle, with resource constraints and incomplete pedigree, we recommend the use of the ssGBLUP model for routine genomic evaluation and selection of potential candidates for successful implementation of a genomic selection program. In also recommend that a fitness trait needs to be considered in addition to the milk yield for selecting potential candidates for breeding so that inclusive selection is carried out for production as well as the welfare of the crossbred cattle.

Author Contributions

Conceptualization: G.R.G. and R.A.; data generation: R.V.M., T.S.K. and R.R.P.; methodology: G.R.G., K.D.K. and R.A.; formal analysis: K.D.K., V.N.S. and A.Y.; original draft preparation: K.D.K. and A.U.; writing, review, and editing: G.R.G., R.A., V.V. and R.R.P.; supervision: G.R.G. All authors have read and agreed to the published version of the manuscript.

Funding

The research was supported by the Kerala Livestock Development Board and ICAR- NDRI, Karnal.

Institutional Review Board Statement

Not applicable.

Data Availability Statement

The data presented in this study are available upon request from the corresponding author.

Acknowledgments

The authors thank the Director of ICAR-National Dairy Research Institute, Karnal, India, and the Kerala Livestock Development Board for providing the necessary facilities to conduct this study.

Conflicts of Interest

The authors declare no conflicts of interest.

References

  1. Basic Animal Husbandry Statistics of India 2023–2024; Department of Animal Husbandry and Dairying, Ministry of Fisheries, Animal Husbandry and Dairying, Government of India: New Delhi, India, 2024.
  2. 20th Livestock Census Report of India; Department of Animal Husbandry, Dairying and Fisheries, Ministry of Fisheries, Animal Husbandry & Dairying, Government of India: New Delhi, India, 2019.
  3. Breed Wise Report of Livestock and Poultry 2022; Department of Animal Husbandry and Dairying, Ministry of Fisheries, Animal Husbandry and Dairying, Government of India: New Delhi, India, 2022.
  4. Henderson, C.R. Best linear unbiased estimation and prediction under a selection model. Biometrics 1975, 31, 423–447. [Google Scholar] [CrossRef] [PubMed]
  5. Sorensen, D.A.; Kennedy, B.W. Estimation of response to selection using least-squares and mixed model methodology. J. Anim. Sci. 1984, 58, 1097–1106. [Google Scholar] [CrossRef]
  6. Meuwissen, T.H.; Hayes, B.J.; Goddard, M. Prediction of total genetic value using genome-wide dense marker maps. Genetics 2001, 157, 1819–1829. [Google Scholar] [CrossRef] [PubMed]
  7. Aguilar, I.; Misztal, I.; Johnson, D.L.; Legarra, A.; Tsuruta, S.; Lawlor, T.J. Hot topic: A unified approach to utilize phenotypic, full pedigree, and genomic information for genetic evaluation of Holstein final score. J. Dairy Sci. 2010, 93, 743–752. [Google Scholar] [CrossRef]
  8. Fernando, R.L.; Dekkers, J.C.; Garrick, D.J. A class of Bayesian methods to combine large numbers of genotyped and non-genotyped animals for whole-genome analyses. Genet. Sel. Evol. 2014, 46, 50. [Google Scholar] [CrossRef]
  9. Ojango, J.M.; Mrode, R.; Rege JE, O.; Mujibi, D.; Strucken, E.M.; Gibson, J.; Mwai, O. Genetic evaluation of test-day milk yields from smallholder dairy production systems in Kenya using genomic relationships. J. Dairy Sci. 2019, 102, 5266–5278. [Google Scholar] [CrossRef]
  10. Powell, O.; Mrode, R.; Gaynor, R.C.; Johnsson, M.; Gorjanc, G.; Hickey, J.M. Genomic evaluations using data recorded on smallholder dairy farms in low-to middle-income countries. JDS Commun. 2021, 2, 366–370. [Google Scholar] [CrossRef]
  11. Al Kalaldeh, M.; Swaminathan, M.; Gaundare, Y.; Joshi, S.; Aliloo, H.; Strucken, E.M.; Ducrocq, V.; Gibson, J.P. Genomic evaluation of milk yield in a smallholder crossbred dairy production system in India. Genet. Sel. Evol. 2021, 53, 73. [Google Scholar] [CrossRef]
  12. Gowane, G.R.; Alex, R.; Mukherjee, A.; Vohra, V. Impact and utility of shallow pedigree using single-step genomic BLUP for prediction of unbiased genomic breeding values. Trop. Anim. Health Prod. 2022, 54, 339. [Google Scholar] [CrossRef]
  13. Gowane, G.R.; Alex, R.; Worku, D.; Chhotaray SMukherjee, A.; Vohra, V. Optimizing multi-breed joint genomic prediction issues in numerically small breeds for sex-limited trait in a loosely structured dairy cattle breeding system. Trop. Anim. Health Prod. 2025, 57, 149. [Google Scholar] [CrossRef]
  14. VanRaden, P.M.; Tassell, C.P.; Wiggans, G.R.; Sonstegard, T.S.; Schnabel, R.D.; Taylor, J.F. Invited Review: Reliability of genomic predictions for North American dairy bulls. J. Dairy Sci. 2009, 92, 16–24. [Google Scholar] [CrossRef] [PubMed]
  15. Gowane, G.R.; Lee, S.H.; Clark, S.; Moghaddar, N.; Al-Mamun, H.A.; van der Werf, J.H. Effect of selection and selective genotyping for creation of reference on bias and accuracy of genomic prediction. J. Anim. Breed. Genet. 2019, 136, 390–407. [Google Scholar] [CrossRef] [PubMed]
  16. Nayee, N.; Su, G.; Gajjar, S.G.; Sahana, G.; Saha, S.; Trivedi, K.R.; Sudhakar, A.; Guldbrandtsen, B.; Lund, M.S. Genomic prediction by single-step genomic BLUP using cow reference population in Holstein crossbred cattle in India. In Proceedings of the 11th World Congress on Genetics Applied to Livestock Production, Auckland, New Zealand, 11–16 February 2018. [Google Scholar]
  17. Patry, C.; Ducrocq, V. Accounting for genomic pre-selection in national BLUP evaluations in dairy cattle. Genet. Sel. Evol. 2011, 43, 30. [Google Scholar] [CrossRef] [PubMed]
  18. Vitezica, Z.G.; Aguilar, I.; Misztal, I.; Legarra, A. Bias in genomic predictions for populations under selection. Genet. Res. 2011, 93, 357–366. [Google Scholar] [CrossRef]
  19. VanRaden, P.M.; Wright, J.R. Measuring genomic pre-selection in theory and in practice. Interbull Bull. 2013, 47, 147–150. [Google Scholar]
  20. Legarra, A.; Christensen, O.F.; Aguilar, I.; Misztal, I. Single Step, a general approach for genomic selection. Livest. Sci. 2014, 166, 54–65. [Google Scholar] [CrossRef]
  21. Gowane, G.R.; Kumar, A.; Nimbkar, C. Challenges and opportunities to livestock breeding programmes in India. J. Anim. Breed. Genet. 2019, 136, 329–338. [Google Scholar] [CrossRef]
  22. Ducrocq, V.; Laloe, D.; Swaminathan, M.; Rognon, X.; Tixier-Boichard, M.; Zerjal, T. Genomics for ruminants in developing countries: From principles to practice. Front. Genet. 2018, 9, 251. [Google Scholar] [CrossRef]
  23. Rao, C.K.; Bachhman, F.; Sharma, V.; Venkataramaiah, P.; Panda, J.; Rathinam, R. Smallholder Dairy Value Chain Development in India and Selected States (Assam and Bihar): Situation Analysis and Trends; ILRI Project Report; International Livestock Research Institute: Nairobi, Kenya, 2014. [Google Scholar]
  24. Trivedi, K.R.; Nayee, N.G.; Saha, S.; Gajjar, S.G.; Kishore, G.; Namjoshi, M.; Sudhakar, A.; Gupta, R.O. Genetic improvement of cattle and buffaloes in smallholder production systems in India. Indian J. Anim. Sci. 2020, 90, 1270–1278. [Google Scholar] [CrossRef]
  25. Costilla, R.; Zeng, J.; Al Kalaldeh, M.; Swaminathan, M.; Gibson, J.P.; Ducrocq, V.; Hayes, B.J. Developing flexible models for genetic evaluations in smallholder crossbred dairy farms. J. Dairy Sci. 2023, 106, 9125–9135. [Google Scholar] [CrossRef]
  26. Chang, C.C.; Chow, C.C.; Tellier, L.C.; Vattikuti, S.; Purcell, S.M.; Lee, J.J. Second-generation PLINK: Rising to the challenge of larger and richer datasets. Gigascience 2015, 4, s13742-015. [Google Scholar] [CrossRef] [PubMed]
  27. Lenth, R.V. Least-squares means: The R package lsmeans. J. Stat. Softw. 2016, 69, 1–33. [Google Scholar] [CrossRef]
  28. Misztal, I.; Tsuruta, D.; Lourenco, D.; Masuda, Y.; Aguilar, I.; Legarra, A.; Vitezica, Z. Manual for BLUPF90 Family of Programs; Animal and Dairy Science; University of Georgia: Athens, GA, USA, 2014. [Google Scholar]
  29. VanRaden, P.M. Efficient methods to compute genomic predictions. J. Dairy Sci. 2008, 91, 4414–4423. [Google Scholar] [CrossRef] [PubMed]
  30. Christensen, O.F.; Lund, M.S. Genomic prediction when some animals are not genotyped. Genet. Sel. Evol. 2010, 42, 1–8. [Google Scholar] [CrossRef]
  31. Gianola, D.; De Los Campos, G.; Hill, W.G.; Manfredi, E.; Fernando, R. Additive genetic variability and the Bayesian alphabet. Genetics 2009, 183, 347–363. [Google Scholar] [CrossRef]
  32. Rosa, G.J.M.; Padovani, C.R.; Gianola, D. Robust linear mixed models with normal/independent distributions and Bayesian MCMC implementation. J. Math. Methods Biosci. 2003, 45, 573–590. [Google Scholar] [CrossRef]
  33. Yin, L.L.; Zhang, H.H.; Li, X.Y.; Zhao, S.H.; Liu, X.L. Hibayes: An R Package to Fit Individual-Level, Summary-Level and Single-Step Bayesian Regression Models for Genomic Prediction and Genome-Wide Association Studies. bioRxiv 2022. [Google Scholar] [CrossRef]
  34. Mrode, R. Linear Models for the Prediction of Animal Breeding Values, 3rd ed.; CABI: Oxfordshire, UK, 2014. [Google Scholar]
  35. Legarra, A.; Reverter, A. Semi-parametric estimates of population accuracy and bias of predictions of breeding values and future phenotypes using the LR method. Genet. Sel. Evol. 2018, 50, 53. [Google Scholar] [CrossRef]
  36. Bulmer, M. The effect of selection on genetic variability. Am. Nat. 1971, 105, 201–211. [Google Scholar] [CrossRef]
  37. Legarra, A. Comparing estimates of genetic variance across different relationship models. Theor. Popul. Biol. 2016, 107, 26–30. [Google Scholar] [CrossRef]
  38. Henderson, C.R. Applications of Linear Models in Animal Breeding; University of Guelph: Guelph, Italy, 1984; Volume 462. [Google Scholar]
  39. Mrode, R.; Ojango, J.; Ekine-Dzivenu, C.; Aliloo, H.; Gibson, J.; Okeyo, M.A. Genomic prediction of crossbred dairy cattle in Tanzania: A route to productivity gains in smallholder dairy systems. J. Dairy Sci. 2021, 104, 11779–11789. [Google Scholar] [CrossRef] [PubMed]
  40. López-Correa, R.D.; Legarra, A.; Aguilar, I. Modelling missing pedigree with metafounders and validating single-step genomic predictions in a small dairy cattle population with a great influence of foreign genetics. J. Dairy Sci. 2024, 107, 4685–4692. [Google Scholar] [CrossRef] [PubMed]
  41. Falconer, D.S. Introduction to Quantitative Genetics; Pearson Education: Zamin, India, 1996. [Google Scholar]
  42. Haile-Mariam, M.; Nieuwhof, G.J.; Beard, K.T.; Konstatinov, K.V.; Hayes, B.J. Comparison of heritabilities of dairy traits in Australian Holstein-Friesian cattle from genomic and pedigree data and implications for genomic evaluations. J. Anim. Breed. Genet. 2013, 130, 20–31. [Google Scholar] [CrossRef]
  43. Loberg, A.; Dürr, J.W.; Fikse, W.F.; Jorjani, H.; Crooks, L. Estimates of genetic variance and variance of predicted genetic merits using pedigree or genomic relationship matrices in six Brown Swiss cattle populations for different traits. J. Anim. Breed. Genet. 2015, 132, 376–385. [Google Scholar] [CrossRef]
  44. Misztal, I.; Aguilar, I.; Lourenco, D.; Ma, L.; Steibel, J.P.; Toro, M. Emerging issues in genomic selection. J. Anim. Sci. 2021, 99, skab092. [Google Scholar] [CrossRef]
  45. Jensen, J.; Su, G.; Madsen, P. Partitioning additive genetic variance into genomic and remaining polygenic components for complex traits in dairy cattle. BMC Genet. 2012, 13, 44. [Google Scholar] [CrossRef]
  46. Veerkamp, R.F.; Mulder, H.A.; Thompson, R.; Calus, M.P.L. Genomic and pedigree-based genetic parameters for scarcely recorded traits when some animals are genotyped. J. Dairy Sci. 2011, 94, 4189–4197. [Google Scholar] [CrossRef]
  47. Peters, S.O.; Kızılkaya, K.; Ibeagha-Awemu, E.M.; Sinecen, M.; Zhao, X. Comparative accuracies of genetic values predicted for economically important milk traits, genome-wide association, and linkage disequilibrium patterns of Canadian Holstein cows. J. Dairy Sci. 2021, 104, 1900–1916. [Google Scholar] [CrossRef]
  48. Buitenhuis, A.J.; Sundekilde, U.K.; Poulsen, N.A.; Bertram, H.C.; Larsen, L.B.; Sørensen, P. Estimation of genetic parameters and detection of quantitative trait loci for metabolites in Danish Holstein milk. J. Dairy Sci. 2013, 96, 3285–3295. [Google Scholar] [CrossRef]
  49. Poulsen, N.A.; Buitenhuis, A.J.; Larsen, L.B. Phenotypic and genetic associations of milk traits with milk coagulation properties. J. Dairy Sci. 2015, 98, 2079–2087. [Google Scholar] [CrossRef]
  50. Karimi, Z.; Sargolzaei, M.; Robinson, J.A.B.; Schenkel, F. Assessing haplotype-based models for genomic evaluation in Holstein cattle. Can. J. Anim. Sci. 2018, 98, 750–759. [Google Scholar] [CrossRef]
  51. Daetwyler, H.D.; Kemper, K.E.; Van Der Werf, J.H.J.; Hayes, B.J. Components of the accuracy of genomic prediction in a multi-breed sheep population. J. Anim. Sci. 2012, 90, 3375–3384. [Google Scholar] [CrossRef] [PubMed]
  52. Clark, S.A.; Hickey, J.M.; Daetwyler, H.D.; van der Werf, J.H. The importance of information on relatives for the prediction of genomic breeding values and the implications for the makeup of reference data sets in livestock breeding schemes. Genet. Sel. Evol. 2012, 44, 4. [Google Scholar] [CrossRef] [PubMed]
  53. Hayes, B.J.; Bowman, P.J.; Chamberlain, A.J.; Goddard, M.E. Invited review: Genomic selection in dairy cattle: Progress and challenges. J. Dairy Sci. 2009, 92, 433–443. [Google Scholar] [CrossRef]
  54. Brown, A.; Ojango, J.; Gibson, J.; Coffey, M.; Okeyo, M.; Mrode, R. Genomic selection in a crossbred cattle population using data from the dairy genetics East Africa project. J. Dairy Sci. 2016, 99, 7308–7312. [Google Scholar] [CrossRef]
  55. Nayee, N. GS appeared promising in bull selection for HFCB for 1st lactation Milk Yield. In Proceedings of the World Congress on Genetics Applied to Livestock Production, Auckland, New Zealand, 11–16 February 2018; Volume 825. [Google Scholar]
  56. Thompson, R. Statistical validation of genetic models. Livest. Prod. Sci. 2001, 72, 129–134. [Google Scholar] [CrossRef]
  57. Reverter, A.; Golden, B.L.; Bourdon, R.M.; Brinks, J.S. Detection of bias in genetic predictions. J. Anim. Sci. 1994, 72, 34–37. [Google Scholar] [CrossRef]
  58. Boichard, D.; Bonaiti, B.; Barbat, A.; Mattalia, S. Three methods to validate the estimation of genetic trend for dairy cattle. J. Dairy Sci. 1995, 78, 431–437. [Google Scholar] [CrossRef]
  59. Spelman, R.J.; Arias, J.; Keehan, M.D.; Obolonkin, V.; Winkelman, A.M.; Johnson, D.L.; Harris, B.L. Application of genomic selection in the New Zealand dairy cattle industry. In Proceedings of the 9th World Congress on Genetics Applied to Livestock Production, Leipzig, Germany, 1–6 August 2010; pp. 1–6. [Google Scholar]
  60. Sargolzaei, M.; Chesnais, J.; Schenkel, F. Assessing the bias in top GPA bulls. Can. Dairy Netw. Open Ind. Sess. 2012, 30, 1–9. [Google Scholar]
  61. Reverter, A.; Golden, B.L.; Bourdon, R.M.; Brinks, J.S. Method R variance components procedure: Application on the simple breeding value model. J. Anim. Sci. 1994, 72, 2247–2253. [Google Scholar] [CrossRef]
  62. Misztal, I.; Lourenco, D. Potential negative effects of genomic selection. J. Anim. Sci. 2024, 102, skae155. [Google Scholar] [CrossRef]
  63. Misztal, I.; Gowane, G. Estimation of heritabilities and genetic correlations by time slices using predictivity in large genomic models. Genetics 2025, iyaf066. [Google Scholar] [CrossRef]
Figure 1. Average estimated accuracy for genomic prediction of breeding values obtained by REML-based models for 305-DMY in crossbred cattle.
Agriculture 15 00945 g001
Figure 2. Ratio of accuracy and slope of regression (dispersion) by LR method.
Agriculture 15 00945 g002
Figure 3. Genetic trend of 305-DMY using PBLUP EBV and ssGBLUP GEBV for crossbred cattle of Kerala.
Agriculture 15 00945 g003
Table 1. Basic data statistics of 305-DMY in crossbred cattle.
Particulars305-Day Milk Yield (305-DMY)
Number of records17,650
Total number of sires764
Total number of dams2998
Maximum paternal family size127
Maximum maternal family size6
Total number of individuals21,407
Mean ± SE3130.49 ± 7.05 kg
Phenotypic standard deviation936.88 kg
Coefficient of variation29.93%
Table 2. Least squares mean and level of significance of fixed effects for 305-DMY.
Factors305-DMY
ClassificationLS Mean (µ) 2875 ± 123.54
Age at first calving ***
(AFC)
≤8163149.16 a
817–9333092.25 a
934–10503093.33 a
1051–11673106.85 a
1168–12843154.25 a
1285–14013106.36 a
≥14023330.48 b
Period of calving ***
(POC)
2004–20072729.48 a
2008–20112868.40 b
2012–20153144.40 c
2016–20193334.86 d
2020–20223459.50 e
Season of calving ***
(SOC)
Jan–Feb (Winter season)3171.07 b
March–May (Hot season)3060.30 a
June–Sept (S–W monsoon)3141.00 b
Oct–Dec (N–E monsoon)3157.04 b
Period of birth ***
(POB)
≤20062808.77 b
2007–20103006.96 c
2011–20143294.56 d
2015–20183380.44 e
2019–20212671.94 a
Geography ***Highland3748.75 c
Midland3050.94 b
Lowland2957.44 a
Units ***Kanjirappally2987.70 cde
Kannur2905.97 cd
Kattappana4005.57 g
Kottayam3090.33 de
Kozikhode2599.78 b
Mavellikkara2950.30 cde
Vaikom2825.08 c
Wayanad3167.76 ef
Kulathupuzha2274.89 a
Mattuppatty2987.08 cde
Peerumed3303.59 f
Levels of significance: ‘***’ p≤ 0.001, a–f: values with different superscripts are significantly different from each other.
Table 3. Variance and heritability estimate for 305-DMY using NRM-based REML, GREML, ssGREML, and Bayesian approaches.
ModelNo. of AnimalsVg ± S. EVe ± S. Eh2 ± S. E
NRM-based18,858240,310 ± 23,377518,820 ± 19,2170.32 ± 0.03
GREML2273181,300 ± 56,904533,220 ± 54,0940.25 ± 0.08
ssGREML18,858308,610 ± 26,109463,150 ± 20,7030.40 ± 0.08
Bayes A2273342,353.42 ± 20,675.49531,114.77 ± 35,345.170.26 ± 0.02
Bayes B2273258,336.79 ± 22,878.80596,264.24 ± 37,406.550.20 ± 0.02
Bayes C2273301,447.29 ± 60,795.20565,125.75 ± 56,612.600.23 ± 0.05
Bayes Cπ2273310,940.72 ± 57,625.16556,776.70 ± 55,074.720.24 ± 0.04
ssBR Bayes A18,858326,225.72 ± 27,231.98439,324.73 ± 28,051.430.43 ± 0.04
Abbreviations: Vg = genetic variance; Ve = residual variance; S.E = standard error; h2 = heritability.
Disclaimer/Publisher’s Note: The statements, opinions and data contained in all publications are solely those of the individual author(s) and contributor(s) and not of MDPI and/or the editor(s). MDPI and/or the editor(s) disclaim responsibility for any injury to people or property resulting from any ideas, methods, instructions or products referred to in the content.

