Article

Measurement of Production Efficiency and Analysis of Influencing Factors in Major Sugarcane-Producing Regions of China

1
College of Agriculture, Guangxi University, Nanning 530004, China
2
Business School, Riddle Hall, Queen’s University Belfast, International Business, Belfast BT7 1NN, UK
*
Author to whom correspondence should be addressed.
Agriculture 2025, 15(8), 885; https://doi.org/10.3390/agriculture15080885
Submission received: 16 March 2025 / Revised: 8 April 2025 / Accepted: 16 April 2025 / Published: 18 April 2025
(This article belongs to the Section Agricultural Economics, Policies and Rural Management)

Abstract

:
Enhancing production efficiency in major sugarcane-producing regions is of strategic significance for ensuring the security of China’s sugar industry and promoting its industrial upgrading. Using the DEA–Malmquist–Tobit modeling framework, this study dynamically evaluates production efficiency from 2011 to 2023, spanning China’s 12th to 14th Five-Year Plan periods, with a focus on the primary sugarcane-producing regions: Guangdong, Guangxi, Yunnan, and Hainan. Results indicate a U-shaped fluctuation in national comprehensive technical efficiency, with a historical low in 2022 due to a collapse in scale efficiency, pinpointing scale management as the central constraint. Regionally, Guangdong consistently maintained optimal dual efficiency. Yunnan stabilized its efficiency through rigid policy mechanisms. Guangxi experienced setbacks due to competition between eucalyptus and sugarcane cultivation, while Hainan faced a precipitous decline in scale efficiency following industry exits. Total factor productivity (TFP) analysis revealed that stagnation in technological advancement was the primary cause of productivity decline, leading to asynchronous regional technology diffusion and subsequent reliance on scale adjustments. During the 12th Five-Year Plan, Hainan led in TFP growth but experienced a sharp downturn in the 13th period due to policy tightening. In contrast, Guangdong achieved notable TFP growth in the 14th period through technological breakthroughs, whereas Yunnan lagged behind Guangxi due to technological inertia. Analysis of the driving mechanisms showed that urbanization rates significantly boosted efficiency through intensified land use.

1. Introduction

The sugar industry is an important industry for the national economy and people’s livelihoods, which is closely related to people’s daily lives. At the same time, it has a key impact on the security of national agricultural supply and industrial upgrading [1,2]. China is one of the world’s major sugar importers and exporters. However, due to the continuous growth of the domestic demand for sugar, China’s sugar imports have been high [1], with approximately one-third of its sugar supply reliant on foreign imports [3]. This increasing external dependence poses a serious threat to China’s food security and economic stability [3]. Although China is a large producer of sugar, the development of the sugarcane industry is affected by a variety of factors, such as government policies, market demand, climate change, and international cooperation [4]. Between 2012 and 2020, high production costs and low levels of mechanization led to a decline in the profitability of farming, prompting farmers to switch to other, more economically viable crops [5]. This further reduced the economic benefits of sugarcane cultivation, directly affecting farmers’ willingness to continue planting [5,6]. In addition, with the rapid rise of domestic labor costs, the planting of sugarcane, China’s main sugar crop, has become a bottleneck that seriously restricts the sustainable development of China’s sugar industry [7,8]. Between 2001 and 2020, the total cost per unit area of sugarcane production in China increased significantly, with an accelerated growth trend starting in 2010. The growth rate peaked at 21.67% in 2012, and as costs rose faster than revenues, the national cost/profit ratio for sugarcane declined from its 2010 peak to 10.9% in 2020 [9]. To date, China’s sugar industry modernization has progressed slowly, characterized by low technological advancement [3], weak organizational capacity [5], poor market bargaining power [1], and a lack of brand influence [10]. These factors have trapped the sugarcane cultivation sector in a vicious cycle of “low scale—low profit—low willingness—low scale”.
In recent years, China has placed significant emphasis on sugar industry development, both in top-level policy design and practical implementation. The 14th Five-Year Plan for National Economic and Social Development and the Long-Range Objectives for 2035, along with the Central No. 1 Document, have explicitly included sugar as a key agricultural product alongside grain, cotton, oil, meat, and dairy in the national security framework. President Xi Jinping has repeatedly underscored the importance of advancing the sugar industry toward high-end, intelligent, and green development, calling for increased investment in technological innovation and new variety breeding [11]. Measures such as subsidies for virus-free seedling propagation in newly planted sugarcane fields have been introduced to support industrial upgrading and increase farmers’ incomes. Under the national policy framework to safeguard arable land and prevent its non-agricultural and non-food crop conversion, the State Council has mandated that general farmland should primarily be used for essential agricultural products, including grain, cotton, oil, sugar, vegetables, and forage crops, thereby ensuring stable sugarcane cultivation areas [12]. With continued optimization of the entire industrial chain and the sustained release of policy benefits, China’s sugar industry is expected to achieve further improvements in production efficiency, planting scale, and market competitiveness. The healthy development of this sector not only strengthens domestic sugar supply security but also supports rural economic revitalization, enhances farmers’ incomes, and reinforces national agricultural product security.
China’s sugarcane cultivation is primarily concentrated in economically underdeveloped western regions, serving as both a crucial pillar of local economic development and the primary livelihood for approximately 40 million sugarcane farmers [13]. Despite the importance of sugarcane in ensuring the security of the national sugar industry, there is a scarcity of existing academic research, with only a small amount of literature pointing to the sugar industry’s low and declining security in China [3,14,15], with most discussions on sugarcane cultivation behavior limited to isolated regional case studies, lacking a systematic research framework [9,16,17]. Internationally, sugarcane research has advanced significantly, focusing on improving cultivation efficiency and sustainability while exploring its potential as a bioenergy source. Key factors influencing sugarcane cultivation include policy and political support [18,19], market demand, land and resource allocation [20,21], and shifts in socioeconomic dynamics [18]. These elements drive the industry’s development by either promoting or restricting commercialization, land use, and labor dynamics [19,21,22]. The global sugar market is intricately linked to sugarcane cultivation, with fluctuations in sugar supply and demand directly impacting price volatility and production decisions, ultimately shaping cultivation patterns. Additionally, national policies and trade restrictions exert significant influence. In recent years, rising global demand for biofuels—particularly ethanol—and fluctuations in international sugar markets have driven large-scale sugarcane cultivation and exports [20,21]. Moreover, government subsidies, increasing market demand, and advancements in cultivation and processing technologies have further accelerated sugarcane expansion [23]. For sugarcane producers, the sugarcane industry, as the primary raw material for sugar, faces two major challenges: a shrinking domestic sugar market and depressed global sugar prices. On one hand, factors such as increasing consumer health awareness have led to a decline in domestic sugar consumption [24], while the rise in sugar imports has further exerted downward pressure on sugar prices [25]. On the other hand, the competition from low-priced sugar in international markets has exacerbated the difficulties for the domestic sugar industry, with global sugar price fluctuations hindering the growth of exports and market prices falling below production costs [24]. Structural adjustments and protective measures by the government and industry organizations are essential to support the sugarcane industry [24]. These insights suggest that international research has extensively examined the interdependencies among cultivated area, yield, costs, and profitability [26,27,28].
There are not many thorough and long-term dynamic evaluations of production efficiency in China’s main sugarcane-producing regions since the majority of the research currently in publication concentrates on regional analyses or single components [9,17]. Comprehensive research on the changes in production efficiency under the influence of multiple factors, including policy shifts, technological advancements, and regional differences, is still lacking, despite the fact that prior studies have highlighted issues such as high costs [3,5], low mechanization [3], and declining yields and profits in China’s sugar industry [6]. In order to close this gap, this study uses the DEA–Malmquist index to assess the various policy settings of the 12th to 14th Five-Year Plans in order to assess the production efficiency and its dynamic evolution across China’s primary sugarcane-producing areas from 2011 to 2023. To further highlight regional variations and connections in technology advancement and scale expansion, the study also uses cluster analysis. Lastly, the Tobit model is used to study regional differences in production efficiency and the underlying mechanisms that drive them, as well as to determine the major variables impacting efficiency changes. Compared to earlier research, this study takes a more comprehensive and integrated approach, providing fresh perspectives for regional cooperation, policy optimization, and guaranteeing national sugar security. It also discusses the issues of sustainable growth and efficiency improvement in associated businesses and offers useful information for global comparative research on sugarcane production efficiency.

2. Materials and Methods

2.1. Sources of Data

The four primary sugarcane-producing regions of China are Guangxi, Yunnan, Guangdong, and Hainan, which account for over 90% of the nation’s total sugarcane yield and growing area [29]. Data from Guangdong, Guangxi, Hainan, and Yunnan, as well as data from the National Compilation of Agricultural Product Cost–Benefit Statistics and provincial sugar industry organizations (2011–2023), were used for analysis based on data representativeness and availability. Sugarcane yield per mu (tons) is used as the output indicator at the national level as well as in the provinces of Guangdong, Guangxi, Hainan, and Yunnan [30,31]. The input indicators are labor costs per mu (CNY), land costs per mu (CNY), and material and service expenses per mu (CNY) [30,31].

2.2. Research Techniques

2.2.1. DEA Model

Charnes, Cooper, and Rhodes introduced Data Envelopment Analysis (DEA) in 1978, a non-parametric method for assessing the relative efficiency of decision-making units by constructing a production frontier [32]. The ratio of each decision-making unit’s weighted sum of inputs-to-weighted sum of outputs is known as “relative efficiency” in DEA. By choosing weights using linear programming, the maximum efficiency score that may be achieved is kept below 1. To assess the effectiveness of resource use, DEA has been widely used in industries including education [33], healthcare [34] and banking [35]. The DEA approach does not need weight assumptions or the formulation of mathematical input/output functional connections. Rather, it leverages observable input/output data to produce a composite scalar value that enables the assessment of the relative efficacy of various decision-making units [33]. Common DEA models include the CCR model, which assumes constant returns to scale, and the BCC model, which incorporates variable returns to scale for a more flexible representation of production processes. Given that sugarcane production is a multi-input, multi-output industry characterized by variable returns to scale, this study adopts an input-oriented BCC model to better align with research needs [31]. The specific model is as follows:
s . t . min θ ε e T S + e T S + j = 1 n X j λ j + S = θ X 0 j = 1 n Y j λ j S + = Y 0 λ j 0 , S , S + 0
In this context, θ represents the efficiency value of a decision-making unit, ε denotes an infinitesimal non-Archimedean value, and S and S + correspond to input and output slack variables, respectively. The index j represents decision-making units within the range [1,n], while λj denotes the combination coefficient. X and Y represent input and output variables, respectively. A decision-making unit is termed DEA-efficient if θ = 1 and S = S + = 0. S ≠ 0 or S + ≠ 0, but θ = 1 indicates that the unit is weakly DEA-efficient. When θ < 1, the decision-making unit is classed as non-DEA-efficient.

2.2.2. Malmquist Index

This study not only evaluates the current efficiency of sugarcane production but also examines its dynamic trends and influencing factors through longitudinal time-series comparisons. A measure of productivity change, the Malmquist index was first developed by Caves, Christensen, and Diewert in response to Malmquist’s (1953) research on quantity indices and distance functions [36,37]. The DEA method, in conjunction with the Malmquist index, computes the ratio of a function-to-the-production frontier, enabling dynamic analysis of the total factor production efficiency of decision-making units (DMUs) in productivity and total factor efficiency change (Tfpch) studies [38]. This methodology offers an all-encompassing structure for comprehending how efficiency evolves over time [38]. It is also extensively used since it can break down increases in total factor productivity (Tfpch) into a number of different components [31,36,39]. Using Data Envelopment Analysis, the Malmquist index can be further decomposed into comprehensive technical efficiency change (Effch) and technological progress (Techch). Furthermore, comprehensive technical efficiency change (Effch) can be subdivided into pure technical efficiency (Pech) and scale efficiency (Sech) [40]. To put it briefly, the total factor productivity change index (Tfpch) measures changes in overall productivity, the efficiency change index (Effch) shows variations in resource utilization efficiency, and the technical change index (Techch) and pure technical efficiency change index (Pech) show changes in managerial performance and shifts in the production frontier over time, respectively [40]. The effect of returns to scale on production efficiency is captured by the scale efficiency change index (Sech). Thus, the following is a clear expression of the link between these indicators: Tfpch = Effch × Techch = Pech × Sech × Techch [41]. The specific model is as follows:
M 0 t , t + 1 = D 0 t x t + 1 , y t + 1 D 0 t x t , y t × D 0 t + 1 x t + 1 , y t + 1 D 0 t + 1 x t , y t 1 2
In this model, M 0 t , t + 1 represents the Malmquist index measuring productivity change from time t to t + 1. The distance functions D 0 t ( x t , y t ) and D 0 t + 1 ( x t + 1 , y t + 1 ) denote the relative efficiency of production units at times t and t + 1 with respect to the current technological frontier. Here, x t and x t + 1 represent inputs at times t and t + 1, while y t and y t + 1 represent outputs. If M 0 t , t + 1 > 1, it indicates an improvement in total factor productivity; if M 0 t , t + 1 = 1, total factor productivity remains unchanged; if M 0 t , t + 1 < 1, total factor productivity declines.

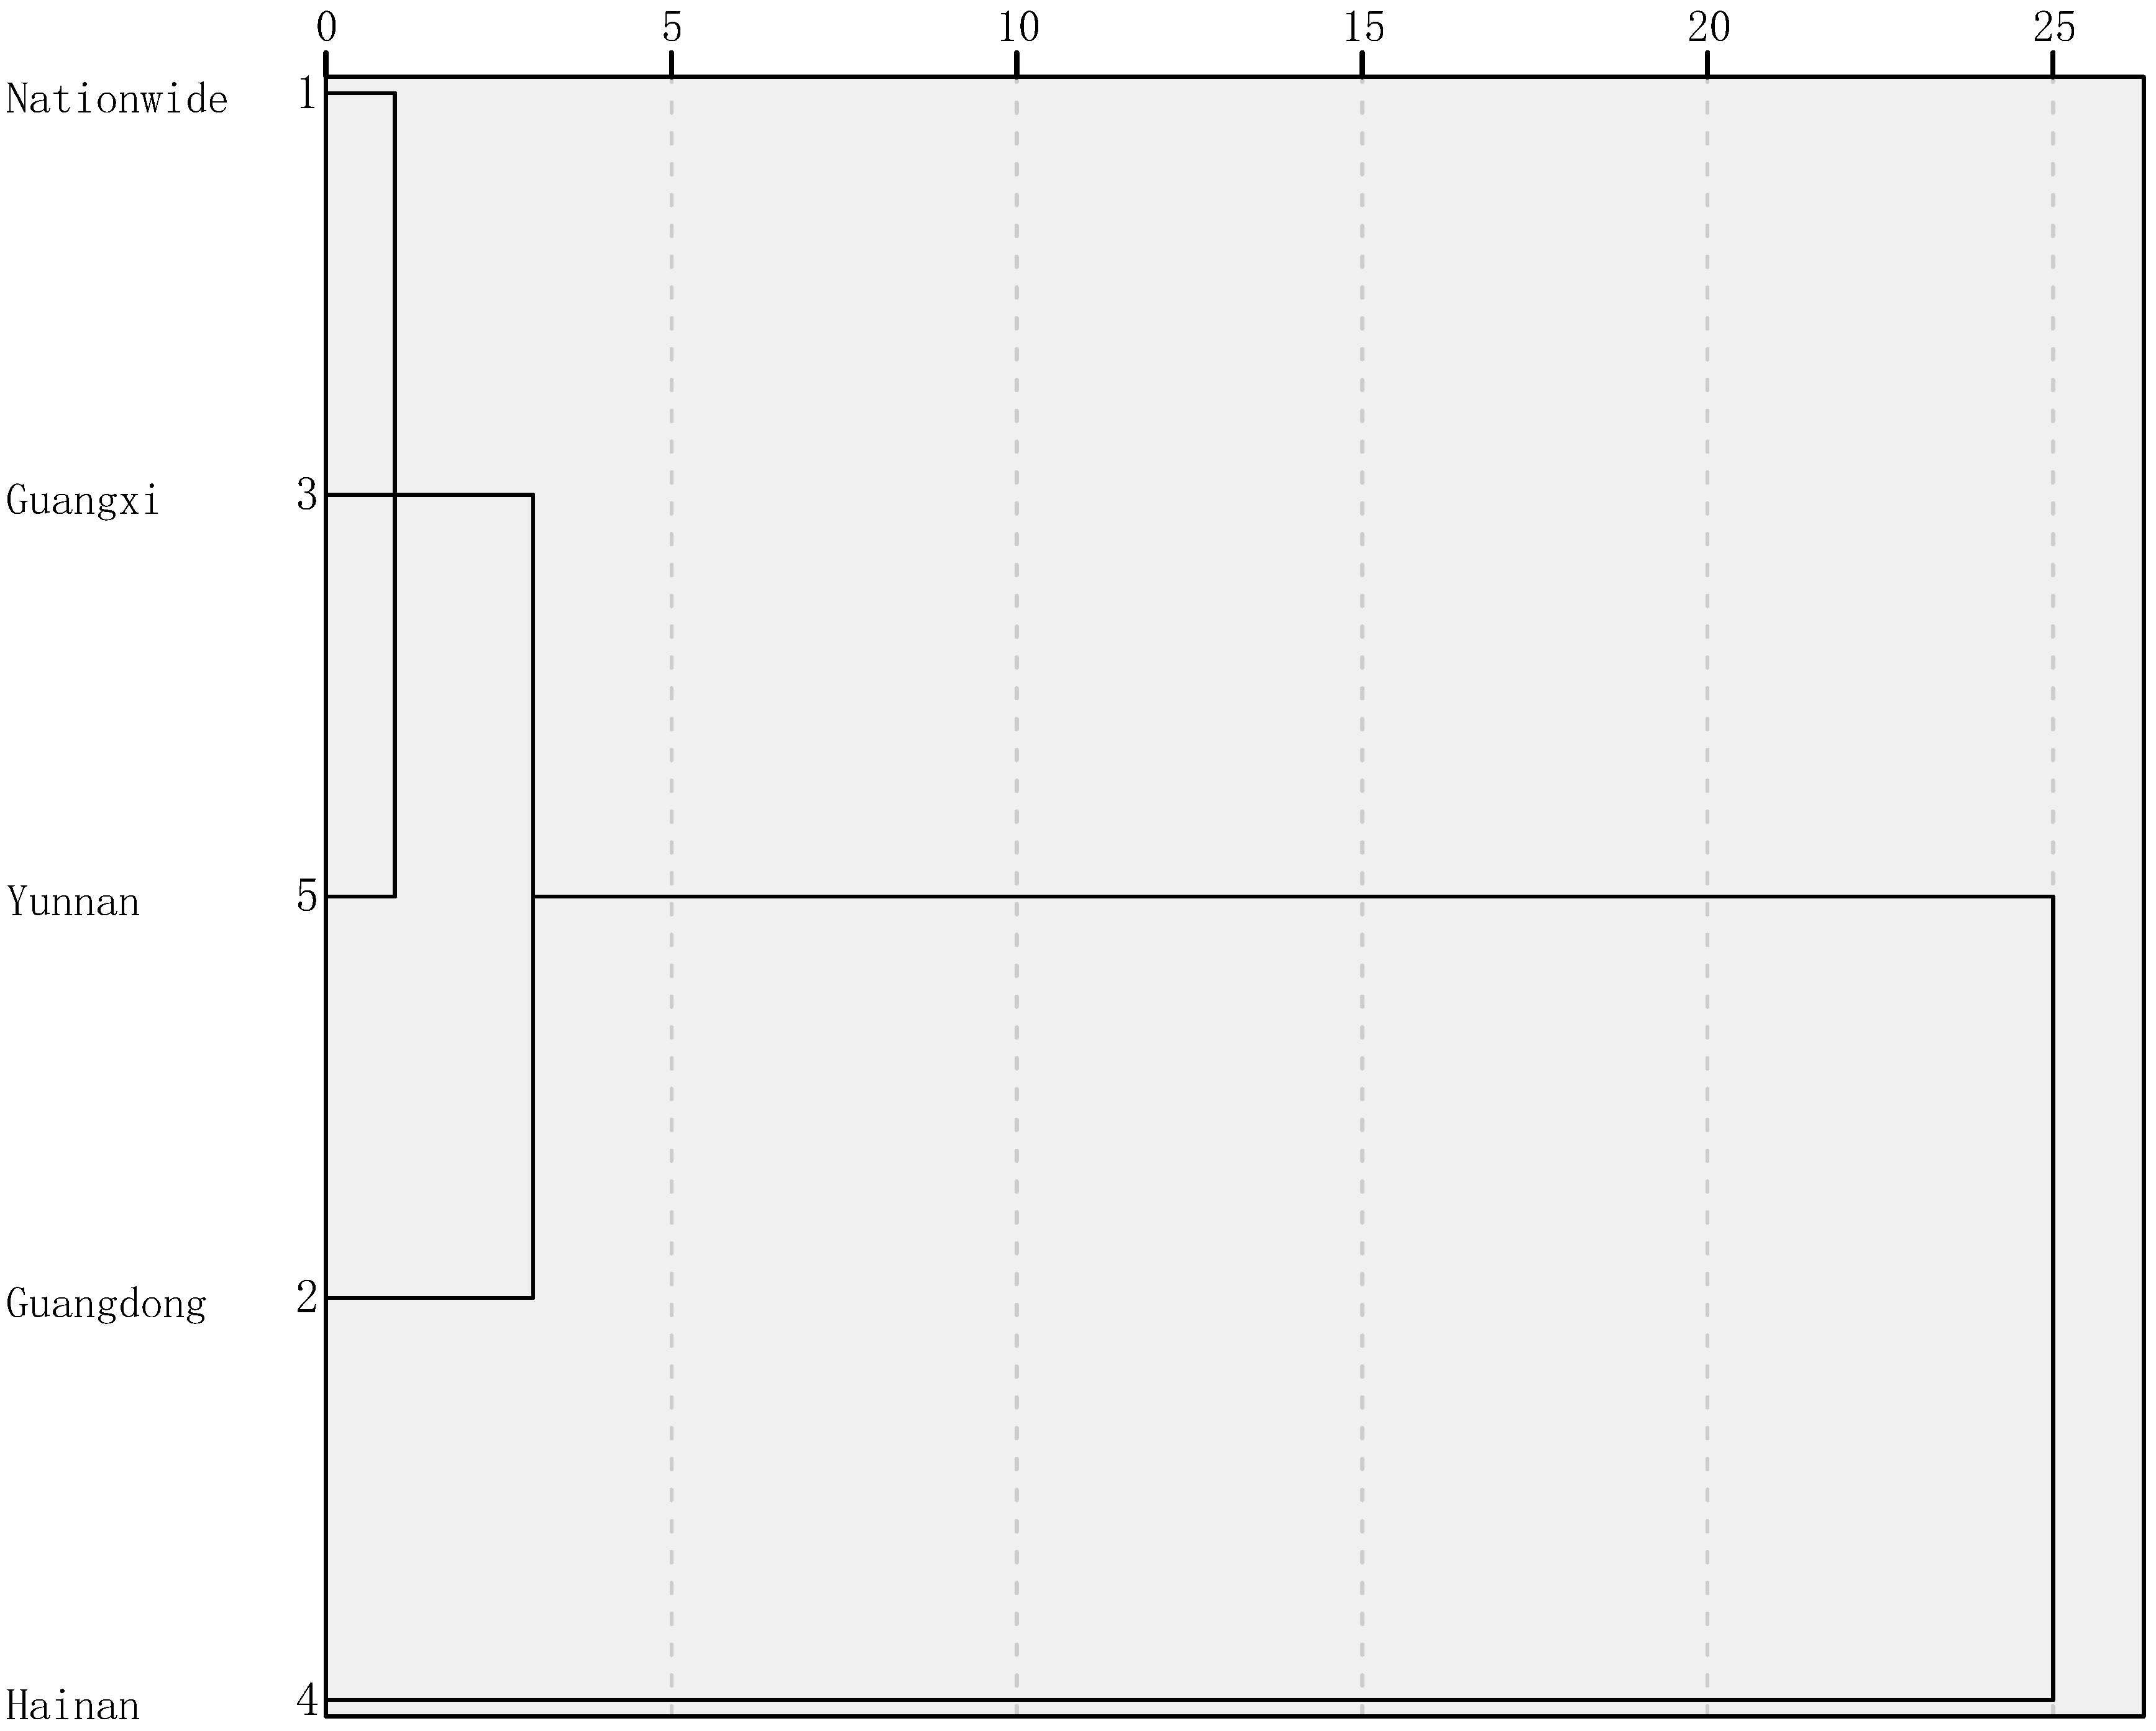
2.2.3. Cluster Analysis

Cluster analysis is not attributed to a specific individual or a particular year; rather, it is a data analysis method that classifies data based on “distance”, ensuring minimal intra-group differences and maximal inter-group differences [42]. This approach effectively reveals the underlying structure within a dataset and is widely applied in fields such as data classification, pattern recognition, and feature extraction [43]. In order to classify regional kinds and improve our comprehension of the features of sugarcane production in various locations, we use cluster analysis to find similarities and variations in efficiency structures throughout the main sugarcane-producing regions. In this study, the Euclidean distance is used as the metric, calculated as follows:
d ( x , y ) = i = 1 n ( X i Y i ) 2
where d represents the distance between samples, X and Y denote two sample points, i indicates the dimension of the sample features, X i and Y i are their coordinates in the i-th dimension, and n is the total number of dimensions.

2.2.4. Tobit Model

While the DEA–Malmquist model allows for the analysis of both static and dynamic efficiency at the national level and in key sugarcane-producing regions, it does not allow for a thorough examination of specific influencing factors [44]. Given that comprehensive technical efficiency values range between 0 and 1 and are censored data, using an ordinary least squares regression could result in estimation bias. The Tobit model, which was forwarded by James Tobin in 1958, may be used to handle such difficulties by employing maximum likelihood estimation to successfully remove the bias of the deletion of dependent variables [45]. The regression model is specified as follows:
Y i = C + α i β i + ε
where Y i represents the dependent variable, C denotes the intercept term, β i represents relevant factors influencing allocation efficiency, α i represents the coefficients to be estimated, and ε is the random error term.

3. Results and Analysis

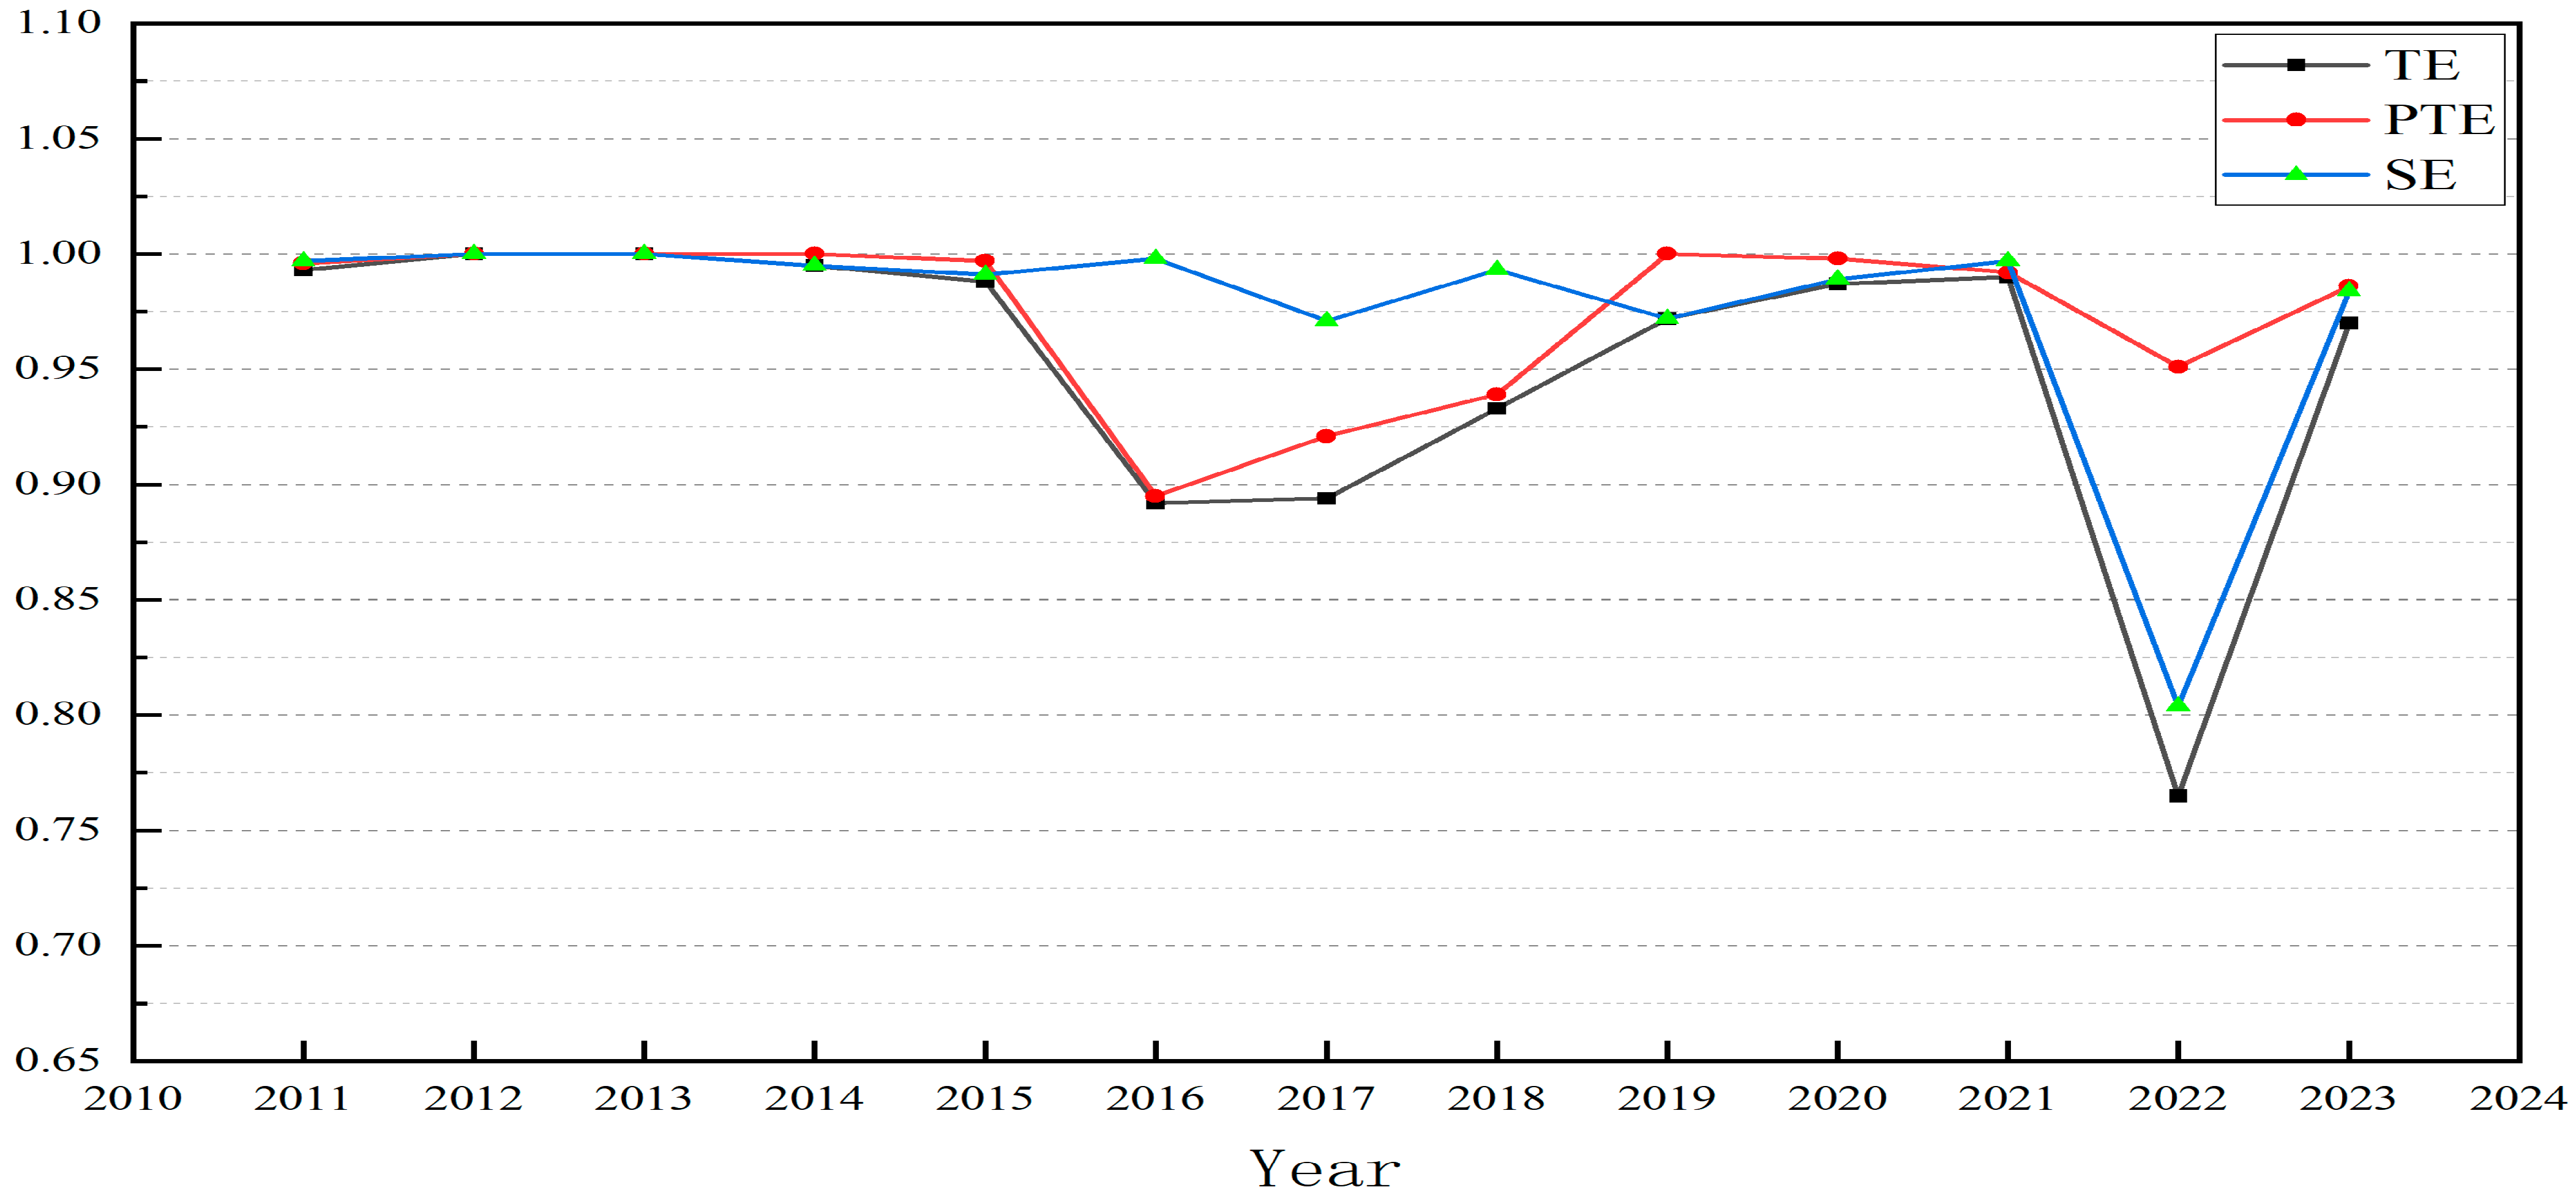
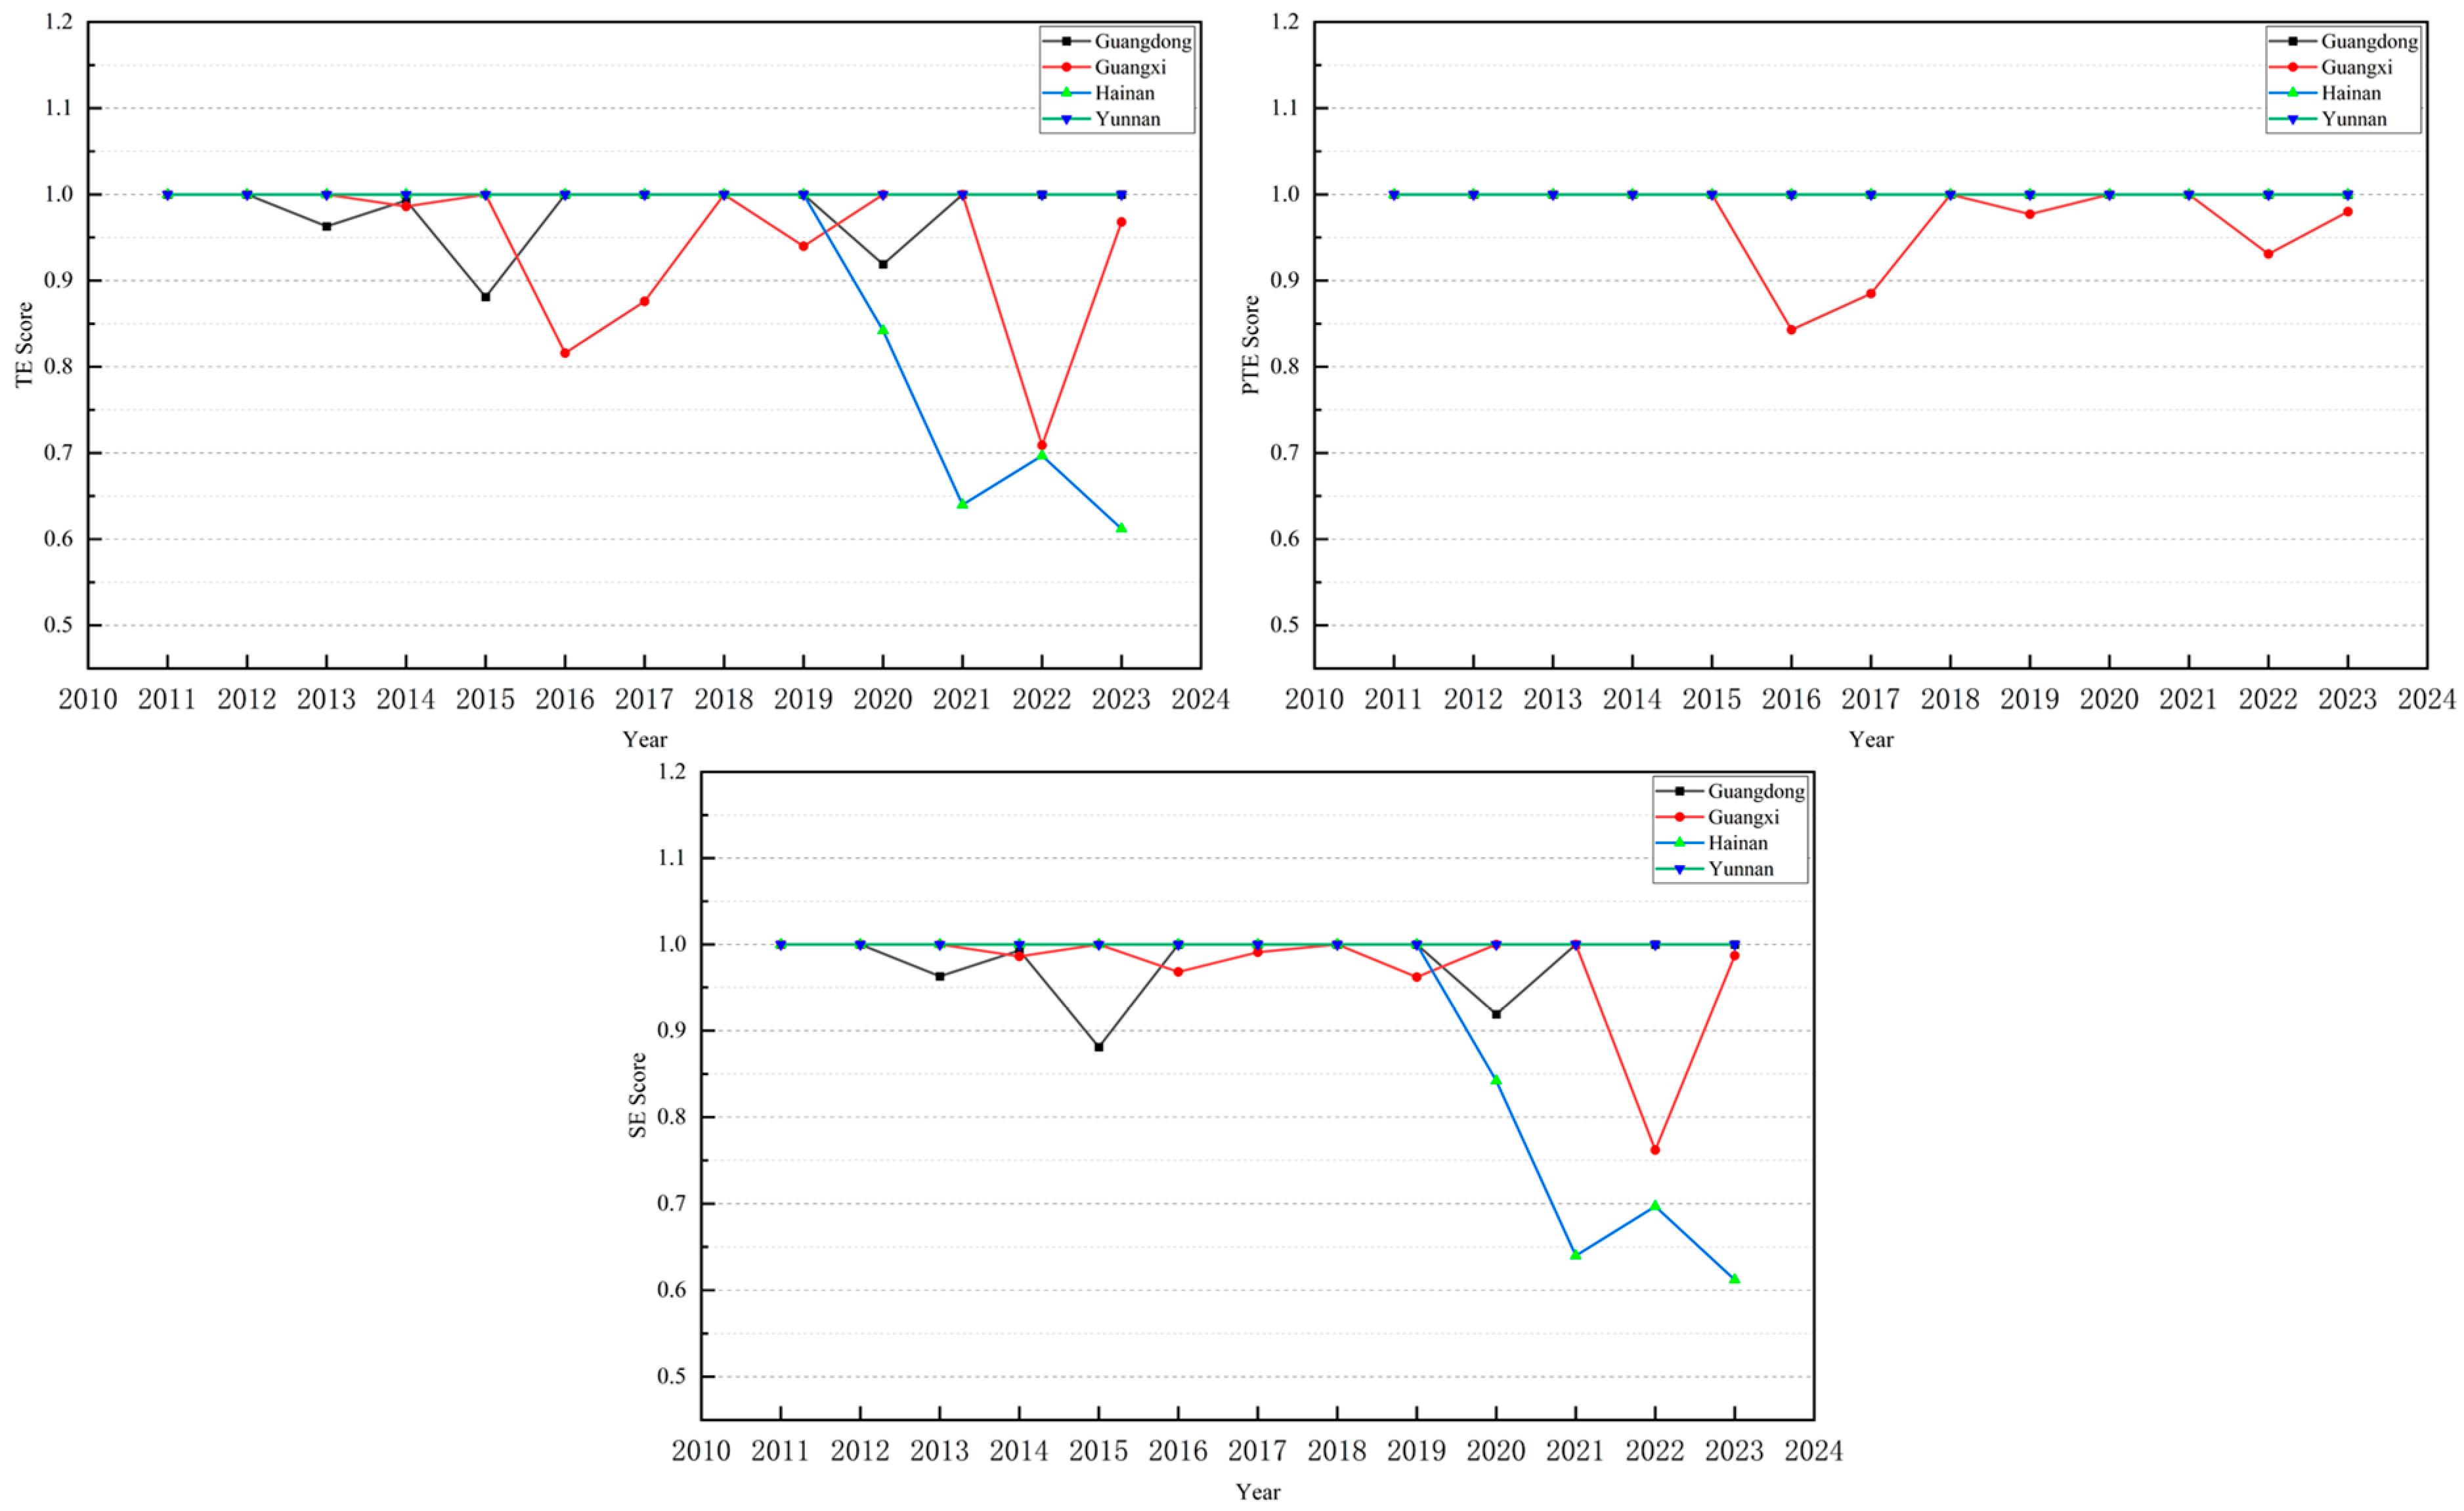
3.1. Analysis of DEA Model Results

We used DEAP 2.1 software [30] and the BCC model [46,47] to look at the changes in the overall technical efficiency (PE), pure technical efficiency (PTE), and scale efficiency (SE) of sugarcane production in Guangdong, Guangxi, Hainan, and Yunnan provinces as well as the national level. Technical efficiency (TE) is a key metric for evaluating the effectiveness of resource allocation. It is the ratio of actual output-to-ideal output under specified inputs. The efficiency resulting from solely managerial and technological elements after scale effects are eliminated is known as PTE (pure technical efficiency), and it represents the operating level of a production unit at a constant size. The degree to which the existing production scale matches the ideal size is measured by SE (scale efficiency) [31]. An operation is more efficient if its efficiency value is closer to 1, and the relationship between these three metrics is PE = PTE × SE [48]. The results and trends are shown in Table 1, Figure 1, Figure 2 and Figure 3.
From 2011 to 2022, sugarcane production efficiency in China displayed a pronounced “U-shaped” fluctuation. Measurements based on the DEA model indicate that the national total (comprehensive) TE declined from 0.993 in 2011 to 0.765 in 2022, undergoing three distinct phases. The first phase (2011–2015) was characterized by consistently high efficiency, with TE remaining above 0.988, while PTE and SE both exceeded 0.990. Nonetheless, a trend of decreasing returns to scale had already emerged, signifying diminishing marginal benefits of input growth. The second phase (2016–2019) saw an efficiency stall, with TE plunging by 11.2% to 0.892 in 2016—its first inflection point. This downturn arose from the dual pressures of PTE falling below the 0.900 threshold (0.895) for the first time and SE remaining below 0.993, exposing a compounded challenge of delayed technological advancements and redundant scale. Notably, a 3.6% drop in PTE was accompanied by an 8.2% decline in SE, underscoring the amplifying effect of scale efficiency on technological regression. During the third phase (2020–2022), the impact of the COVID-19 pandemic, coupled with contracting consumer demand and a reversal in global sugar supply and demand, caused China’s sugar price index to fall below RMB 5480 per ton by mid-2020 [49]. Although PTE remained relatively high at 0.951, SE plummeted from 0.989 to 0.804, ultimately driving TE to a historic low of 0.765 in 2022. This outcome confirms that, under mounting pressure from inverted international sugar prices, passive capacity contraction can trigger a systemic collapse in scale efficiency. Further analysis reveals that structural imbalances in input and output constitute the primary constraint: under stable planting acreage, annual fluctuations in per mu material and service expenditures, labor costs, and land costs (−7% to 15%, −4% to 30%, and −5% to 16%, respectively) were significantly broader than those in main product yield (−4% to 14%). Rising costs and limited yield gains combined to create a “high-cost, low-output” scissors effect [30], causing the coefficient of variation for SE (0.073) to be 2.1 times that of PTE and highlighting scale management as the chief efficiency risk. An analysis of returns to scale further indicates that in years of increasing returns to scale (IRS)—such as 2016 and 2020–2021—TE rose by an average of 4.3%, whereas in years of decreasing returns to scale (DRS)—including 2017–2019 and 2022—TE fell by 9.8%. These findings suggest that establishing a capacity elasticity adjustment mechanism could offset approximately 21.3% of efficiency fluctuations.
As one of China’s leading provinces in science and technology, Guangdong has consistently remained at the forefront of technological innovation, superior variety promotion, mechanized production, and standardized management, supported by a comprehensive research system [50]. With the exception of 2013, 2014, 2015, and 2020, Guangdong’s total (comprehensive) TE, PTE, and SE were maintained at 1.000, indicating optimal performance in both technological application and scale management for sugarcane production. However, the steep decline in international sugar prices between 2013 and 2014 severely affected the domestic market—purchase prices in major producing regions such as Zhanjiang dropped by 14.4%, resulting in a sharp decrease in growers’ incomes and dampening their enthusiasm for cultivation. Simultaneously, a substantial increase in labor costs (14.1%) further squeezed profit margins and impeded the widespread adoption of advanced technologies and management practices [51]. It is also noteworthy that Guangdong typically employs a “1-year new planting plus 1-year ratooning” production model [52]. The relatively short ratooning cycle, limited ratoon capacity, and elevated incidence of pests, diseases, and lodging constrain both yield and quality [52]. Nonetheless, the introduction and dissemination of new, pest- and disease-resistant varieties are gradually propelling Guangdong’s sugarcane industry toward higher performance, laying a solid foundation for sustaining optimal efficiency over the long term.
With its sugarcane planting area and sugar output making up over 60% of the country’s total for 20 consecutive crushing seasons [53], Guangxi is the largest sugarcane cultivation base in China and has been dubbed the “Sugar Bowl” of China. In contrast to the national trend, Guangxi’s production efficiency showed a “double-peaked” volatility between 2011 and 2023. Supported by technical advancements, variety development, and systemic changes in the sugar sector, Guangxi, like the rest of the nation, achieved the production frontier (TE = 1.000) between 2011 and 2013 [54]. However, Guangxi’s efficiency saw a more severe reduction (TE = 0.816) in 2016, when the national TE fell by 10.8% to 0.892, exposing systemic weaknesses in this important producing area. Reforms to the sugarcane purchase price temporarily increased TE to 0.876 in 2017, but the concurrent decline in SE (0.962; drs) and PTE (0.977) in 2019 suggests that the marginal impacts of policy interventions are waning. By 2022, Guangxi’s TE reached a historic low of 0.709, widening the gap relative to the national level (0.765). This efficiency decrease suggests a twofold process. On the technological component, Guangxi’s PTE (0.931) underperformed the national level (0.951) by 0.020 points, showing a mismatch between reported indicators—such as a mechanization rate of 71.8% and an improved-variety coverage of 98.62%—and their actual usefulness. On the scale dimension, the economic benefits and reduced input needs of eucalyptus [55] promoted “land competition” between eucalyptus and sugarcane, leading to spatial mismatches [56] that pushed SE down to 0.762. The ensuing deficiency in raw material availability curtailed sugar mills’ output capacity and degraded overall efficiency. Although returns to scale research suggests a need to boost output (IRS), Guangxi’s actual planted area has not achieved the ideal threshold. In order to encourage more producers to use premium varieties, the local government has simultaneously tried to increase farmers’ excitement through subsidy schemes, including as rewards for recently planted virus-free healthy seed cane [57]. However, these activities create a “policy incentive–market response”—a paradox of decision-making. A deeper contradiction lies in the self-reinforcing nature of efficiency fluctuations. Signals from returns to scale and subsidy policies showed an average delay of approximately 3.2 years at critical junctures, such as 2014 (DRS) and 2022 (IRS). The growing annual shortfall of PTE in comparison to the national level—which reached 0.020 in 2022—further highlights the urgency of strengthening disaster-resilient technological infrastructure. Under this dual “technology–scale” constraint, the “Sugar Bowl”, which provides 60% of China’s sugar production, instead becomes a crucial weak link in the overall efficiency of the industry.
Hainan has steadily emerged as one of China’s new sugarcane-growing regions since the Eighth Five-Year Plan was introduced [58]. However, Hainan’s planting area only accounts for 2.6% of the country’s total, in contrast to more established significant production hubs like Guangxi. Surprisingly, Hainan continuously maintained optimal levels of PTE, TE, and SE at 1.000 from 2011 to 2019. Due to its scale-based competitive advantages and highly scattered production structure, sugarcane is grown in all 18 of the province’s cities (counties), with the exception of Sansha [59]. Despite having a small sugarcane area, Hainan has the second-highest comparative scale advantage in the country, according to Wu et al. (2017), who studied China’s sugarcane production trends [60]. This finding suggests that Hainan has successfully combined technology and resources on a local scale. Nevertheless, PTE stayed at 1.000, while TE fell to 0.842 in 2020 and then to 0.612 in 2023, highlighting the increasing significance of scale efficiency as a limiting factor. In order to promote industrial restructuring, Hainan decided to drastically reduce sugarcane acreage in favor of higher-value crops and leisure activities during the Thirteenth Five-Year Plan. These low-yield crops had per mu net revenues below RMB 600. Consequently, the province’s acreage planted to sugarcane decreased from 69.1 thousand hectares in 2003 to barely 13.7 thousand hectares. This pattern is consistent with research by Zhan et al. (2024), which indicates that since 2016, Hainan’s advantage in sugarcane resources has been eroding [61], coupled with growers’ profit margins continuing to be limited by the combination of fluctuating sugarcane prices and consistently high labor and logistical expenses. According to national data, sugarcane’s cost/profit ratio was just 1.83% in 2020, whereas Guangdong, Guangxi, Hainan, and Yunnan had respective cost/profit ratios of 16.89%, −1.13%, −12.23%, and 4.79%. Even though Hainan maintains high levels of pure technical efficiency, it will be difficult to optimize resource inputs and outputs without successfully incorporating mechanization and improved varieties into large-scale production. This could lead to Hainan further withdrawing from the sugarcane industry.
With its abundance of light and heat resources, Yunnan is a perfect place to grow sugarcane in China. Its sugar industry has grown quickly, second only to “the two tobaccos”, and is now the country’s second-largest biological resource pillar industry [62]. Yunnan has long maintained high levels of planting area and sugar output, demonstrating significant economies of scale and playing a crucial role in China’s sugarcane sector [63]. Between 2011 and 2023, its PTE and SE both steadily stayed at 1.000, while comprehensive technical efficiency also continued to run at an optimal level. This outstanding accomplishment is largely due to Yunnan’s exceptional natural resources and ongoing policy support. The Yunnan Provincial Government has released several plans to revitalize the sugar industry, incorporating them into the Belt and Road Initiative to access larger domestic and international markets [62], and the Ministry of Agriculture and Rural Affairs and the National Development and Reform Commission have actively encouraged the development of “high-yield and high-sugar” sugarcane bases [62]. Simultaneously, Yunnan focuses on growing sugarcane in its primary production regions. By integrating resources and upgrading technology, sugar companies are consistently increasing economies of scale, showcasing their great industrial competitiveness and regional advantages. As a result, a thorough upstream and downstream industrial chain has been established [64], guaranteeing the sugarcane industry’s steady, effective, and sustainable growth. Notably, Yunnan has maintained optimal technological and scale efficiency over a long period, driven by its favorable Southeast Asian location and rising export demand.

3.2. Comparative Analysis of Malmquist Indices

3.2.1. Holistic Analysis

While the Malmquist index dynamically measures changes in total factor productivity (TFP) over time, PE, PTE, and SE generated from DEA provide static, cross-sectional snapshots of production efficiency. For efficiency analysis, they combine to create a complementary static–dynamic framework [48]. The TFP index, which reflects both resource use and technical advancement, is essential to tracking changes in the efficiency of sugarcane production within this framework [40,41].
Based on estimates using Table 2, Tfpch in China’s main sugarcane-producing areas showed a general declining trend between 2011 and 2023, with TFP values below 1 in every region (nationally, Guangdong, Guangxi, Hainan, and Yunnan, 0.977, 0.988, and 0.979, respectively). This loss in efficiency was mostly caused by stagnating technical advancement. In particular, technical regression (Techch < 1) occurred to some extent in all manufacturing regions. The nation’s extreme gap in technological innovation, including variety enhancement and automation, was highlighted by Hainan’s lowest Techch rating (0.922), which was 5.7 percentage points lower than the national average (0.979). Second, a global technological bottleneck was suggested by the fact that Guangdong and Yunnan’s Techch values stayed below the 1.0 threshold despite exhibiting very slight technical impediments. From the standpoint of efficiency structure, Guangdong and Yunnan both stabilized both scale efficiency (1.000) and pure technical efficiency (1.000), resulting in zero losses in comprehensive technical efficiency (Effch = 1.000). The deeper impact of land intensification disparities on production efficiency was highlighted by the fact that, in Hainan, a significant deterioration in scale efficiency (Sech = 0.960, a 4.0% decline) brought Effch down to 0.960, while, in Guangxi and throughout the country, slight decreases in scale efficiency (Sech decreased by 0.1%) caused a slight overall efficiency drop. According to a regional comparison, Guangdong, which has the highest Tfpch value (0.988), is an efficiency standard since it has no resource allocation losses and few technical setbacks. Even with its second-best Tfpch of 0.979, Yunnan is still limited by a lack of technical advancement, which keeps it from moving over the manufacturing frontier. A Tfpch of 0.977 is recorded by both Guangxi and the national average, suggesting that concurrent advancements in technology and scale efficiency are required. Hainan’s lowest Tfpch (0.885), on the other hand, shows a substantial efficiency gap—it is behind Guangdong by 11.4 percentage points—which is caused by both diseconomies of scale and technical lag.
SPSS software 24 was used for hierarchical cluster analysis [42] of changes in the country’s and the four main production areas’ total factor productivity index, technological development index, and comprehensive technical efficiency index (Figure 3). To quantify sample differences during grouping, the Euclidean distance was used. Based on standardized data, the clustering structure was made easier to read and understand by using an inter-cluster distance criteria of 5 to maximize differences between groups while preserving similarities within groups. If the inter-cluster distance is set to 5, the nation and each province (autonomous region) are divided into two groups: the first cluster, which comprises the country, Guangdong, Yunnan, and Guangxi, and the second cluster, which comprises Hainan. The setting can more clearly show the variations in the efficiency structure of China’s primary sugarcane-producing regions because it blends theoretical rationality with empirical robustness. The resultant categorization is a heuristic tool for evaluating regional similarities in efficiency structures, which is appropriate given the narrow scope of study topics and the essentially descriptive purpose of the hierarchical cluster analysis. Using the K-means method, a consistency test was conducted to assess the resilience of this clustering strategy. The findings show a consistent categorization structure, which further bolsters the validity of the clustering technique used in this investigation.
A trait of “technology-efficiency-driven synergistic optimization” is displayed by the first cluster. All four areas (Guangdong, Yunnan, the entire country, and Guangxi) have comprehensive technical efficiency change indices that are close to the ideal value of 1.000 (Guangdong and Yunnan at 1.000, countrywide at 0.998, and Guangxi at 0.997). This shows their leadership position in China’s production management and technical resource allocation, which shows a notable synergy between scale efficiency and pure technical efficiency. Despite the fact that none of these regions have exceeded the efficiency frontier (Techch < 1), as indicated by the mean technological progress index of 0.981 (Guangdong: 0.988; Yunnan: 0.979; Guangxi: 0.979; nationwide: 0.979), technology diffusion in these regions is still relatively synchronized (with a standard deviation of only 0.003). Together, increased resilience to disasters and the encouragement of automation support their steady effectiveness. Regarding development models, Guangdong and Yunnan depend on intensive technological innovations, like highly resistant sugarcane varieties and precision irrigation, while Guangxi and the national average take advantage of significant planting-scale advantages (which account for more than 65% of all acreage nationwide), creating a strategy known as “optimized scale + technological fallback”. Overall factor productivity increase (Tfpch = 0.98) is constrained by the cluster’s common bottleneck of stagnant technical advancement. Additionally, Guangxi’s and the country’s scale efficiency values are approaching their threshold, which suggests a danger of declining land-based marginal returns.
There is a “low-efficiency conundrum driven by imbalanced scale” in the second cluster (Hainan). Due mainly to concurrent delays in comprehensive technical efficiency (0.960) and technological development efficiency (0.922), its total factor productivity (0.885) is much lower than the mean of the first cluster. The diseconomies inherent in a smallholder production model are revealed by the collapse of scale efficiency (Sech = 0.960) caused by a combination of factors such as limited arable land, high transportation and logistics costs, highly fragmented land holdings, and frequent natural disasters, despite the fact that the tropical climate provides ideal natural conditions for sugarcane cultivation. These difficulties have been made worse by cyclical shifts in industrial support objectives and policy investment, which have increased instability in Hainan’s sugarcane industry and prevented any significant productivity advances over the research period. On the other hand, a paradox of “high individual-level proficiency but low systemic effectiveness” has resulted from the lack of large-scale organization, even though individual farmers possess 1.000 pure technical efficiency, indicating that they meet technical standards. Hainan’s isolated categorization draws attention to the unbreakable “low-technology, small-scale, low-output” vicious loop that results from institutional and natural limits. In order to overcome these obstacles, the province urgently needs to deploy resilience-oriented technical solutions and consolidate its territory.

3.2.2. Decomposition Analysis

Changes in the corresponding production efficiencies were examined over time in order to further examine the effects of Effch, Techch, Pech, and Sech on Tfpch both nationally and in the major sugarcane-producing regions. The findings are displayed in Table 3.
While Guangdong is one of the top three sugarcane-producing regions in China, its technological development has shown significant stage-specific variations. According to longitudinal data, during the 12th Five-Year Plan period, Guangdong’s Techch was at 0.897 and Tfpch was at 0.869, both ranking last nationally; over the 13th Five-Year Plan, Techch improved to 0.931 and Tfpch increased to 0.911; by the 14th Five-Year Plan, Guangdong had achieved a significant technological breakthrough, with Techch reaching 1.015 (third highest nationally) and Tfpch rising to 1.015, placing it at the forefront. At the same time, the province’s overall sugarcane mechanization rate increased from 58.1% in 2020 to 63.5% in 2022—an average annual growth of approximately 2.7%—confirming the “technology leadership” attribute suggested by Li Danxia (2024) [65]. The main driver of Guangdong’s total factor productivity during these three periods was still technological advancement, demonstrating the vital role that innovation plays in accelerating TFP growth and the significance of bolstering agricultural R&D and extension initiatives to improve the efficiency of the sugarcane industry [66]. However, even with a significant increase in R&D intensity during the 14th Five-Year Plan, Guangdong’s Tfpch growth rate of 1.9% was still lower than Guangxi’s 2.1%, indicating that institutional bottlenecks and factor allocation restrictions hinder the diffusion of technology. In the future, a coordinated system that includes technology distribution, varietal renewal, and scale operations will be necessary to more dynamically link technical innovation with industrial practice.
Through a number of governmental measures, such as the “Double-High” sugarcane base project and the “Second Takeoff” program, Guangxi’s sugarcane sector saw significant restructuring and upgrading throughout the research period. The 14th Five-Year Plan (Techch = 1.020), which ranked top among the areas studied, saw notable advancements in technology as a result of these initiatives. However, the primary factor limiting the rise of Tfpch is now variations in technical efficiency. Particularly, Guangxi’s overall Effch increased to 1.052 during the 13th Five-Year Plan, bolstered by concurrent gains in Sech (1.008) and Pech (1.044), which drove the country’s sole positive Tfpch growth. However, by the 14th Five-Year Plan, Effch had dropped to 0.984 and Sech was still decreasing; while technical advancements caused a little increase in Tfpch, the growth rate had significantly slowed down from the previous time. Significantly, Sech decreased from 1.008 in the 13th Five-Year Plan to 0.993 in the 14th, partly due to the long-standing land dispute between sugarcane and eucalyptus, which is preferred for its lower inputs and greater returns. Pech, which was only 0.990 during the 14th Five-Year Plan, is further limited by Guangxi’s ongoing structural problems of “high per mu costs and relatively low yields” [52], which make it the biggest sugarcane-producing area among the four major bases. The results show that even though Guangxi made significant strides in technology in the latter part of the study period, the cyclical variations in technical efficiency—a 5.2% rise in the 13th Five-Year Plan and a 1.6% fall in the 14th—show weaknesses in scale management and resource allocation. Optimizing the land competition mechanism and stabilizing technology promotion routes will be necessary to address these problems and maintain the synergy between efficiency gains and technological advancement.
There is a noticeable “policy intervention–technological decline” paired attenuation route in Hainan’s sugarcane Tfpch when compared to the other three main producing regions. Hainan’s Tfpch fell from a nationally leading level of 0.983 during the 12th Five-Year Plan to a last-place ranking of 0.822 in the 13th; even though it slightly improved to 0.943 in the 14th, it stayed at the bottom throughout the three periods that were observed, demonstrating the resounding effects of endogenous technological setbacks and industry contraction policies. The Hainan Provincial Department of Agriculture announced intentions in 2015 to maximize agricultural structure by reducing sugarcane acreage by 20,000 hectares in three years [31]. Then, during a provincial agricultural restructuring conference in 2016, officials made it clear that sugarcane production would be phased out over three to five years. As a result, Sech fell sharply from 1.000 in the 12th Five-Year Plan to 0.958 in the 13th (the lowest nationwide). As sugarcane cultivation continued to be marginalized, production factors continued to leave the region, and the Techch fell from 0.983 (the highest in the country) in the 12th Five-Year Plan to 0.858 (the lowest) in the 13th and stayed at the bottom (0.965) in the 14th. These events made Hainan the only region to experience two consecutive periods of technological regression. In the 13th Five-Year Plan, this vicious cycle of “scale-efficiency contraction → collapse in technological investment” was especially noticeable. Scale efficiency decreased by 4.2%, and technological advancement decreased by 14.2%, which together pulled Tfpch down by 17.8%, significantly more than declines in other significant production areas.
Both Techch and Sech stayed at 1.000 for Yunnan, the country’s second-largest sugarcane-growing province, from the 12th to the 14th Five-Year Plans, creating the only “dual-efficiency, zero-loss” framework in the country. However, the only factor influencing Tfpch variability was found to be small variations in the Techch rate. Declining Techch caused Tfpch to drop to 0.966 during the 12th Five-Year Plan, demonstrating the limited ability of strict efficiency to protect against technological regression. The short-term benefit of stable efficiency was highlighted by the fact that Yunnan was the only major production region to keep its Tfpch decline below 1% during a period of overall technological stagnation. By the 13th Five-Year Plan, a near-equilibrium Techch (0.996) combined with sustained maximum efficiency propelled Tfpch to 0.996. However, a slight technical advance (Techch = 1.003) during the 14th Five-Year Plan fell well short of Guangdong (1.015) and Guangxi (1.020), pushing Yunnan’s Tfpch to fourth position and exposing a competitive bottleneck originating from low-level technological equilibrium. In contrast to Guangdong and Guangxi, which saw significant swings in their technical development (intertemporal standard deviations of 0.064 and 0.032, respectively), Yunnan’s technological development had extremely consistent behavior (standard deviation of 0.019). An “efficiency comfort zone” may develop when technological advancement continuously lingers close to the production frontier (Techch ≈ 1), which could lead to Yunnan’s 14th Five-Year Plan technological progress rate ranking only above that of Hainan. Thus, while this “efficiency-first” model can reduce productivity losses during times of macro-level technological stagnation, it may also stifle innovation momentum.

3.3. Analysis of Influencing Factors

The term “agricultural production efficiency” describes the ratio of input resources (land, labor, capital, technology, etc.) to output (food, cash crops, etc.) in agricultural production [67]. This ratio reflects both economic and resource efficiency or the extent to which input factors and output capacity are utilized. It is impacted by a number of factors that affect resource utilization and production capacity, including market demand, sustainable development, technical proficiency, resource inputs, managerial ability, and governmental support [67,68]. Combined with the findings of previous studies, the dependent variable was determined to be the overall technical efficiency of the primary sugarcane-producing regions, while the independent variables were the effective irrigated area of sugarcane, rural residents’ per capita disposable income, average years of education, disaster rate, and urbanization rate.
First, increasing the area that is efficiently irrigated is essential for guaranteeing China’s food security, given the declining total cultivated land area and the restricted capacity for numerous crops in key grain-producing regions [69]. Based on a Stochastic Frontier Analysis (SFA) model, Hua Li also discovered a strong and positive correlation between agricultural output efficiency and the area that is efficiently watered [70]. Sugarcane is especially reliant on irrigation conditions because of its lengthy growth season and high water requirements [4]. In addition to reflecting the quality of the local water infrastructure, the area that is efficiently watered has a significant impact on the output and quality of sugarcane. As a result, using this indicator makes it easier to quantify the precise effect of irrigation on the productivity of sugarcane production.
Second, farmers’ income has two effects on agricultural technical efficiency. On the one hand, it can increase the ability of farmers to upgrade agricultural machinery, buy high-quality seedlings, and adopt new technologies, which will increase efficiency; on the other hand, it may result in labor shortages or higher costs in the agricultural sector, which will hinder agricultural technical efficiency [71]. Changes in revenue frequently affect farmers’ desire to plant and the level of their investments in the sugarcane sector, which has a lengthy cultivation period and significant labor input requirements [55]. Therefore, incorporating rural inhabitants’ per capita disposable income into the model enables a thorough analysis of its multifaceted influence on the efficiency of sugarcane production.
Third, agricultural efficiency is greatly increased when rural education levels are raised [71,72]. Better-educated workers are typically better at implementing new technologies and streamlining management as the technological and professional demands of the sugarcane business continue to grow. As a result, one important control variable in this study is the average number of years of education among rural populations.
Fourth, sugarcane is extremely vulnerable to changes in the climate and natural disasters [4], and repeated calamities can have a big impact on output and income. The current study shows that agriculture technological efficiency is adversely affected by the frequency of natural catastrophes [73,74]. To counteract the negative impact of disasters on productivity, a relatively comprehensive disaster prevention and compensation system can be put in place in areas that profit from government subsidies, insurance payouts, or the introduction of disease- and stress-resistant varieties [71]. In order to assess the effect of natural disasters on the efficiency of sugarcane production, this study incorporates the disaster rate.
Fifth, as a key measure of social and economic advancement, the rate of urbanization may also have an impact on the productivity of sugarcane production. Huang Jingqiu used a coupling coordination model to examine the relationship between new-type urbanization and agricultural production efficiency in Jiangsu Province [75]. Her findings showed that urbanization generally improved agricultural efficiency and that overall coordination between the two was favorable [75]. However, too much urbanization might cause rural regions to “hollow out” and leave farmers without enough workers, which would reduce output efficiency [76]. In order to assess the urbanization rate’s effect on the overall technical efficiency of the sugarcane sector, this study incorporates it.
The China Statistical Yearbook only provides information on the urbanization rate and the per capita disposable income of rural people; the other five cannot. Therefore, the input index is transformed into the following formula using the methodology of Tian Hongyu et al. [77] and Ju Liping [78]:
Years of education per capita (years) = (number of people with elementary school education level × 6 + number of people with junior high school education level × 9 + number of people with senior high school education level × 12 + number of people with college and above education level × 16)/total number of people over 6 (and people at all the above stages of education are employed in the countryside).
Effective irrigated area of sugarcane (thousands of hectares) = area under sugarcane cultivation × (effective irrigated area/total area of crops sown).
Crop damage rate (%) = (affected area/total crop area).
The details are shown in Table 4.
Based on the above analysis, the following hypotheses are proposed:
Hypothesis 1: 
The effective irrigation area of sugarcane has a significant positive effect on sugarcane production efficiency.
Hypothesis 2: 
Per capita disposable income of rural residents has a significant positive effect on sugarcane production efficiency.
Hypothesis 3: 
The average years of education in rural areas have a significant positive effect on sugarcane production efficiency.
Hypothesis 4: 
The disaster rate has a significant negative effect on sugarcane production efficiency.
Hypothesis 5: 
The urbanization rate has a significant positive effect on sugarcane production efficiency.
To determine whether there is significant multicollinearity among the indicators in the table, we employed the Variance Inflation Factor (VIF) test. The results are displayed in Table 5, where all of the indicators’ VIF values are less than 5, indicating that there is not any significant multicollinearity among the indicators [79]. We employed a random-effects panel Tobit model, as the fixed-effects Tobit model was unable to produce conditional maximum likelihood estimates due to individual variability. The Stata program (StataMP18) was then used to perform the estimation. The detailed results are shown in Table 6.
The regression results showed that while rural per capita disposable income (x2), average years of education in rural areas (x3), and urbanization rate (x5) showed statistically significant effects, sugarcane effective irrigation area (x1) and disaster rate (x4) failed the significance test. This suggests that while effective irrigation area and disaster rate are not significantly correlated with differences in efficiency, rural per capita disposable income, educational attainment, and urbanization have a significant correlation to sugarcane production efficiency. Consequently, null Hypotheses 1–4 are disproved, whereas null Hypothesis 5 is approved.
According to the study, the overall technical efficiency of sugarcane production is somewhat impacted, albeit negatively, by rural per capita disposable income. Although theoretically, increased incomes can increase the ability to invest in agriculture, the problem of misallocation of resources has become more pronounced with increased mechanization, which lacks the appropriate technical support to effectively improve productivity. In reality, families with increased incomes are more willing to transfer their labor to non-agricultural industries, which results in labor shortages and aging in the sugarcane plantation industry. For China’s sugar industry, this means a loss of labor and lower productivity, further affecting the production capacity and market competitiveness of the entire industry and jeopardizing the stability of domestic sugar prices and the industry. Meanwhile, at the 1% significance level, the average number of years of schooling in rural regions is inversely correlated with sugarcane efficiency, illustrating the “education paradox” that increasing educational attainment has not resulted in increased efficiency. Many highly educated people leave sugarcane farming for non-agricultural or urban jobs, leaving others who stay comparatively older or with fewer skill sets. Furthermore, the technological requirements of agriculture are not met by the basic education curriculum, which further reduces the potential efficiency gains of formal education. Additionally, those with greater education levels typically choose more profitable or diversified employment routes, which lowers their labor and resource commitment to the production of sugarcane. Insufficient young, skilled workers and specialized farmers hinder productivity, which raises the cost of producing cane. This exacerbates production pressures in the domestic sugar industry and raises security risks for China’s sugar industry, given the volatility of global sugar prices and the escalating competition from imported sugar.
Due in large part to the transmission of technological improvements and economies of scale in land activities, the rate of urbanization has a notably positive impact. Modern agricultural practices, such as intelligent irrigation and better seed types, are more easily incorporated into rural areas as urban-driven industrial chains grow, and rapid land consolidation creates scale economies that lower production costs per unit. Insufficient maintenance or unequal distribution may result in low facility utilization, and inadequate water-saving measures may cause resource waste or soil degradation, negating potential gains from acreage expansion. However, increasing the effective irrigated area for sugarcane has not significantly improved efficiency, indicating a mismatch between infrastructure development and management capacity. The sugarcane industry in China is a labor-intensive sector that depends significantly on infrastructure. Poor management results in low productivity, which raises input costs and compromises production stability.
The somewhat beneficial impact of disasters on productivity is especially noteworthy, suggesting a resilience mechanism in key producing regions. By spurring technological advancements, a well-established disaster defense system—which includes, for instance, insurance payouts and the development of disaster-resistant varieties—can lessen or even reverse the negative effects of natural disasters. Farmers gain adaptive expertise as a result of numerous disasters, such as modifying planting schedules, which increases total production stability, thereby maintaining sugarcane production.

4. Discussions

In the context of sugar industry security, this study uses a DEA–Malmquist–Tobit model framework for a detailed analysis of the dynamic production efficiency in China’s main sugarcane-producing areas from 2011 to 2023. The study shows the intricate patterns of changes in TFP (total factor productivity) and TE (technical efficiency). The findings highlight the complex interrelationships between external economic constraints, economies of scale, technical developments, and policy changes by demonstrating notable temporal and regional variations in sugarcane production efficiency. The study examines how factors like effective irrigation area, rural residents’ per capita disposable income, average years of education in rural areas, disaster rates, and urbanization rates affect production efficiency. This helps to emphasize how important innovation and efficient resource allocation are to raising production efficiency.

4.1. Production Efficiency Variations Among China’s Principal Sugarcane-Producing Regions

According to the research findings, Guangdong Province continuously maintains high levels of technological and scale efficiency, performing very well in these areas. This suggests that in order to maintain high production efficiency, Guangdong’s increase in sugarcane production efficiency depends on both technology developments and successful scale management [65]. However, Hainan Province is seeing a sharp drop in production efficiency, especially in scale efficiency, which might be directly linked to regional industry exit regulations as well as other outside influences [59]. Research by Ye Jie (2015) on the efficiency of sugarcane production in China’s main sugarcane-producing regions from 2004 to 2012 found that the production efficiency of the dominant sugarcane areas decreased annually [30]. Accordingly, over the overlapping period of 2011–2012, the current analysis discovered a preliminary reduction in national comprehensive technological efficiency [30]. Over the course of the lengthy research period (until 2023), this trend further developed into a more intricate “U-shaped deepening” pattern, which reflected the fact that the main influencing element was the fact that the rise in sugarcane production costs significantly surpassed the development in yield.
Scale efficiency is a key factor in the fluctuations of overall efficiency, and the contributions of technological advancement and scale efficiency to sugarcane production efficiency differ across regions. This finding is consistent with Zhang Zhixin’s (2021) empirical results and is characterized by a distinct regional efficiency divergence [29]. With “seed promotion + mechanization” (PTE = 1.000 in this study, PTE = 0.998 in Zhang Zhixin’s study), Guangdong Province has successfully maintained the technical frontier and sustained productivity development under high-scale efficiency [65]. According to Xie Yuan’s (2024) examination of Yunnan’s stability, Yunnan, on the other hand, depends on strict regulatory assurances to achieve steady scale efficiency (SE = 1.000 in both studies) [31]. However, Guangxi’s production efficiency has suffered due to inappropriate resource allocation brought on by extreme geographical fragmentation [56]. Furthermore, this study discovered that the industrial exit policy had a significant negative impact on Hainan Province’s scale efficiency, which stands in stark contrast to the increase in scale efficiency noted in Zhang Zhixin’s study of Hainan [29]. This underscores the disruptive effect of shifting policy directions on efficiency trajectories.

4.2. Empirical Findings for Additional Crops in the Same Areas

In areas like Guangdong, Guangxi, Hainan, and Yunnan, rice is a vital agricultural commodity and one of China’s main food crops. As the nation’s economy continues to grow, increasing the efficiency of rice production and guaranteeing food security have emerged as key objectives of national agricultural strategy [80]. As with studies on the efficiency of sugarcane production, increasing the efficiency of rice production is essential to China’s food security. Wang Heng et al. (2020) [80] gathered cost and income panel data from 1998 to 2015 for their study on China’s key rice-producing regions. The research examined these provinces’ production efficiency using the DEA–Malmquist index. Using DEAP 2.1 software, the study dynamically evaluated the efficiency of rice production across provinces, identifying patterns in regional variations in efficiency and delving deeper into the effects of resource allocation, scale management, and technological advancement on rice production efficiency. The findings showed that the four areas’ overall rice production efficiency was high, with Guangdong and Yunnan standing out for their superior technical innovation and scale management [80]. In these areas, however, rice production efficiency was far greater than sugarcane production efficiency. This discrepancy may be attributed mostly to the sugarcane industry’s vulnerability, namely to the processing and scale management of the highly variable crops. The scale efficiency of sugarcane production in Guangdong varies much more than the 9.3% variability observed in rice production, although the industrial departure strategy in Hainan has a significant impact on sugarcane output’s scale efficiency, as evidenced by a further decline to 0.612 in 2022. This demonstrates the challenges of establishing large-scale operations in the sugarcane industry, whereas the rice production sector shows greater stability with less variation in scale efficiency, indicating that the value chain of the rice industry is more developed in terms of scale management and technological advancement. Additionally, there is a considerable amount of volatility in the production of sugarcane in Guangxi and Hainan, particularly in Guangxi, where land fragmentation has a negative influence on the scale efficiency of sugarcane production, resulting in inconsistent production efficiency. However, because of the rice industry’s advantages in terms of technical advancement, resource allocation, and scale management, these problems are less common in rice production.
In a similar vein, the fruit sector, which is likewise a profitable crop, has higher production efficiency stability than the sugarcane industry. The fruit industry’s Tfpch in Guangdong, Guangxi, Hainan, and Yunnan was 1.025, 1.024, 1.022, and 1.059, respectively, according to data from 2011 to 2018 [81]. Production efficiency had a consistent upward trend over this time, driven mostly by scale efficiency and technical advancement. In contrast, during the 12th Five-Year Plan period (2011–2015), the TFP of the sugarcane industry in the four provinces failed to reach the threshold of 1.000 (Table 3). A further decomposition analysis of the Tfpch of the fruit industry in the four provinces revealed that improvements in technical efficiency and scale efficiency played a significant role in boosting the Tfpch of the fruit industry [81]. This stands in contrast to the situation in the sugarcane industry, demonstrating the favorable development of the fruit industry driven by both scale and technological advances.

4.3. Comparison of the World’s Principal Sugarcane-Producing Regions

In addition to China, India and Brazil are major producers of sugarcane worldwide [82]. Large tracts of sugarcane are also grown in the United States and Australia, both of which have highly mechanized sugarcane farming systems that greatly increase crop yields and production efficiency [81]. Due to their large territories or concentrated land resources, these international main sugarcane-producing countries have comparatively low land costs, which are frequently insignificant when viewed from the standpoint of cost/input [83]. Despite the high levels of mechanization in the US and Australia, it is challenging to drastically lower production costs due to their comparatively high labor expenses. These prices are still cheaper than those in China, however. Brazil and India, on the other hand, have a certain cost advantage because of their lower labor expenses as a result of their lower levels of economic development [84]. China has comparatively high sugarcane cultivation expenses, especially when it comes to material and service expenditures per mu, which are significantly higher than those in other nations [2]. China’s total input costs are 6 times higher than India’s and 3.5 times higher than the US [83]. However, these high inputs have not resulted in high outputs to match. China produced only 9.87 million tons of sugar during the 2022–2023 sugar season, which accounted for 15% of Asia’s total production and one-fifth of Brazil’s, while India produced 31.739 million tons, or 43.7% of Asia’s total, according to IHS Markit data from November 2023 [85]. The United States produces 8.435 million tons of sugar, which is a little less than China’s, but its input/output ratio is still far lower [83,85]. The security of China’s sugar sector is seriously threatened by these issues, which also lead to a lack of worldwide competitiveness, relatively poor production efficiency, and higher local sugar prices relative to imported sugar.

4.4. Limitations

The four main sugarcane-producing regions of Guangxi, Guangdong, Hainan, and Yunnan—which together make up over 90% of China’s total sugarcane output and planted area—are the subject of this research [29]. These regions represent comparatively considerable regional variations and policy backgrounds. Despite the fact that sugarcane is grown in other producing regions as well, no thorough analysis is carried out for these regions because of the lack of higher resolution city or county data and the main reliance on provincial statistics, which makes it challenging to capture changes at the micro level. Although DEA and Malmquist indices were adopted, potential spatial effects and endogeneity issues have not been thoroughly explored. To address these limitations, future research could expand the scope to a nationwide level, including smaller and more dispersed planting areas, thereby enhancing the study’s generalizability. At the same time, incorporating higher-resolution data (such as remote sensing and on-farm surveys) would improve the depth and accuracy of the analysis. Moreover, introducing spatial econometric models or simultaneous equation approaches could help account for cross-regional spillover effects and endogeneity, ultimately building a more targeted and explanatory framework for evaluating sugarcane industry efficiency.

5. Conclusions and Recommendations

5.1. Conclusions

This study employs the DEA model, Malmquist index analysis, cluster analysis, and Tobit regression model to empirically study the productivity and its influencing factors of the entire country as well as the four major sugarcane-producing areas, namely Guangdong, Guangxi, Yunnan, and Hainan, from 2011 to 2023. The findings are based on the pertinent statistical yearbook data of China’s main producing areas and combine the sugarcane production data of each region.
(1) There are notable geographical differences in the efficiency of China’s sugarcane sector. A “high-cost–low-output” scissors effect was highlighted in 2022 when total technical efficiency (TE) hit a historic low of 0.765 at the national level, primarily due to the collapse of SE (0.804). Guangdong is at the top with PTE and SE at 1.000, but further advancements are hampered by its low level of mechanization. Although Yunnan faces technological inertia, it depends on policy dividends to maintain strict efficiency (PTE = SE = 1.000). Guangxi, which makes up 60% of the total capacity, experienced a reduction in efficiency, with TE falling 9.8% to 0.709 in 2022 as a result of the decline in SE and the delayed policy measures. As a result of exit regulations, SE in Hainan drastically decreased (from 1.000 to 0.762), and a cost/profit ratio of -12.23 percent suggests a higher danger of abandoning sugarcane farming.
(2) The Malmquist index results from 2011 to 2023 show that, on the one hand, stalling technical advancements are mostly to blame for the overall drop in total factor productivity (TFP) throughout China’s key sugarcane-producing areas (national average 0.977). Resource allocation efficiency (Effch), on the other hand, stayed relatively constant or marginally higher than 1. On the other hand, a comparison of the two cluster types shows notable differences in their policy goals, technical advancement levels, and efficiency drivers (Table 1). Although the first cluster has a lot of potential for sustainable development because it depends on regional coordination of technical efficiency and scale, it must intensify cross-regional technological collaboration, particularly in varietal innovation and digital agriculture, and be on the lookout for technological inertia. However, because of its unbalanced scale, the second cluster experiences “efficiency collapse” and needs outside assistance to reorganize its production processes. To overcome ingrained low-efficiency paths, priority should be given to adopting targeted disaster-resilience technologies and testing land-transfer reforms.
(3) Urban/rural resource movements and technical innovation are the two main factors influencing the efficiency of sugarcane production. Higher incomes and educational attainment point to possible advantages in human and capital resources, but labor outflows and technology disconnection can undo these benefits, underscoring the more profound paradoxes associated with the “talent siphoning effect” in rural regions. Through the dissemination of technology and increased output, urbanization promotes efficiency benefits; nonetheless, its sustainability relies on the management of ecological costs. The latent adaptation ability to catastrophes shown in major producing regions suggests that systemic resilience, not isolated disaster avoidance, is the key to production efficiency. Facilitating bidirectional resource flows between urban and rural regions is crucial at the policy level. Examples of this include increasing the efficiency of irrigation infrastructure and providing incentives for the return of trained agricultural workers. Furthermore, implementing a comprehensive “disaster alert—insurance compensation—technology upgrade” framework can support sustainable resource use and efficiency gains.

5.2. Recommendations

5.2.1. Encourage Technological Innovation, Improve Integrated Technical Efficiency, and Practice Optimal Resource Management

Prioritizing technological innovation and optimizing resource management is necessary to improve overall technical efficiency in the main sugarcane-producing zones to establish a three-tiered improved-variety breeding system to foster innovation and technological extension, with a focus on fostering high-sugar, stress-resistant cultivars like Guiliu 05-136 and Guitang 42. To create high-efficiency sugarcane farming methods suited to various soil types and climates, encourage cooperation between businesses and research institutes. To increase mechanization, increase expenditures for cutting-edge agricultural equipment. For instance, create stepwise harvesters that are appropriate for steep terrain to save labor expenses and increase production. Simultaneously, use a “Double-High” base design to simultaneously implement IoT sensors and remote sensing systems, supporting AI-based pest and disease monitoring and integrated water/fertilizer precision irrigation. By taking these steps, water usage should be reduced to 0.27 tons per ton of cane, which is comparable to industry standards. Use a “small plots into large tracts” land-transfer program to maximize resources, giving continuous bases larger than 500 mu fiscal benefits. To increase land-use efficiency, scientifically plan land transfers and utilization, distribute production variables, and maximize labor and capital inputs. Create a circular economy framework to make the most of by-products by turning bagasse into environmentally friendly dinnerware, processing sugarcane leaves into animal feed, and refining sugarcane molasses into yeast extracts, achieving a “clean slate” of resources.

5.2.2. Differentiated Regional Policymaking to Support District Development Based on Local Circumstances

Create region-specific policies for Guangdong, Guangxi, Yunnan, and Hainan, adjusting strategies to local circumstances and promoting focused growth in each. Give Guangxi’s digital sugar industry and the combined growth of the primary, secondary, and tertiary sectors top priority. Promote blockchain-based traceability and improve the “Sugar Cloud” platform’s capability to reach 100% electronic contracting. Use important industrial parks, including the Chongzuo Sugar Industrial Park and the Laibin Circular Economy Park, to set up test sites for sophisticated bagasse processing and high-value uses. Create cultural and tourist initiatives with a sugarcane theme at the same time to increase value-added advantages. Maintain a balanced emphasis on size and technology in Yunnan by promoting professionalized, intense production and furthering innovation. For foreign agriculture that supports domestic output, expand cross-border capacity collaboration with Myanmar and Laos. Create uniform sugarcane farms with more than 10,000 mu, spread seedlings free of viruses, and use environmentally friendly pest management techniques. These initiatives seek to prevent efficiency losses brought on by postponed technological upgrades and stabilize the use of technological advancements. In order to rationally increase planting areas and improve scale efficiency, Guangdong should facilitate land transfers and cooperative-based activities in order to maximize its production scale. In order to promote the cooperative growth of upstream and downstream segments and, eventually, increase the region’s overall competitiveness in the sugarcane industry, strengthen industry-chain coordination at the same time. Hainan may pursue zero-carbon projects like sugarcane-based plant water and bioethanol by utilizing the free trade port’s regulatory benefits. Encourage the simultaneous integration of tourism and agriculture, as demonstrated by the Danzhou Sugarcane Expo Park, to increase overall returns.

5.2.3. Increasing the Income and Educational Attainment of Rural Residents by Fortifying External Environmental Support

Boost external support systems to increase the productivity of sugarcane production. Increase farmers’ ability to invest in productive farming methods by, on the one hand, raising rural household incomes through market-based tactics and diversification. To increase productivity, promote investments in cutting-edge equipment and technologies. Raising the general level of knowledge in rural regions, professionalizing and intensifying agricultural operations, and expanding agricultural training programs are all ways to improve farmers’ capacity to embrace and use contemporary practices. Implement a “technical specialist residency” scheme concurrently to encourage water-saving irrigation methods and precision fertilizing. On the other hand, to protect sustainable industrial development, coordinate financial, educational, and fiscal policies, and create specialized funding for the sugar business that is intended to promote smart agricultural infrastructure and better seed development. Expand the coverage of sugarcane price-index insurance to all producing locations and increase the percentage of government-subsidized insurance premiums by extending the “insurance + futures” paradigm. Additionally, to ensure that policies are carried out correctly and efficiently, optimize policy implementation mechanisms by continuously monitoring and evaluating land-transfer procedures and contract performance risks.

5.2.4. Encourage Cooperation Among Industry Chains and Marketization to Boost Industrial Competitiveness

Encourage supply-chain coordination and market-oriented growth in the sugarcane sector, emphasizing brand-building and transaction systems. Enhance the information system for the sugarcane market to boost transparency and make resource allocation more effective. Encourage farmers to increase their output and hasten the modernization of the sector by offering them market-based incentives. Develop connections between upstream and downstream businesses to create industrial clusters and increase overall competitiveness by fortifying cooperation throughout the sugarcane value chain. In order to expand the value chain, improve value-added activities, and accomplish sustainable growth, assist sugarcane deep-processing businesses. Improve customer awareness, boost product value, and improve market competitiveness by implementing advanced branding methods for sugarcane goods. The productivity and competitiveness of the sugarcane sector may be successfully raised by strengthening supply-chain cooperation and improving market processes.

5.2.5. Enhancing Readiness and Reaction to Disasters to Guarantee Consistent Output

To sustain steady sugarcane production efficiency, bolster catastrophe reaction and prevention. Enhance natural disaster emergency protocols by implementing strong early-warning systems throughout the main sugarcane growing regions. Such actions provide prompt reactions to possible hazards and the creation of recovery plans informed by science, enabling production to quickly recover and reducing variations in efficiency. In order to improve growing conditions and lessen the influence of natural catastrophes on production, it is also important to increase investments in agricultural infrastructure and promote infrastructure development in the main sugarcane-producing regions. Utilize digital technology to guarantee consistency in production efficiency and strengthen the agriculture sector’s resistance to risk. The long-term sustainability of the sugarcane sector may be ensured by creating a thorough disaster-response strategy and improving infrastructural resilience.

Author Contributions

C.Y.: Conception; Data organization; Analysis; Resources; Software; Validation; Original manuscript. X.L. and J.W.: Funding acquisition; Validation; Supervision. L.Z.: Revision; Supervision. Z.L.: Data management; Testing. All authors have read and agreed to the published version of the manuscript.

Funding

General Report on the Preliminary Research of the 15th Five-Year Plan for Agricultural and Rural Development in Guangxi (Grant NO: GXZC2024-C3-005884-JZZB), Research on Rural Construction and Governance and the Construction of Target index System for Rural Development during the 15th Five-Year Plan Period (Grant NO: GXZC2024-C3-005884-JZZB).

Institutional Review Board Statement

Studies not involving humans or animals.

Data Availability Statement

The raw data supporting the conclusions of this article will be made available by the authors upon request.

Conflicts of Interest

The authors declare no conflicts of interest.

References

  1. Zhou, H.X. Research on the Impact of the Surge in Sugar Imports on China’s Sugar Industry. Master’s Thesis, Heilongjiang University, Harbin, China, 2023. [Google Scholar]
  2. Zhang, X.Y. Research on the Impact of Sugar Price Fluctuations in China from the Perspective of Import Security. Master’s Thesis, Heilongjiang University, Harbin, China, 2023. [Google Scholar]
  3. Shu, D.Z. Dilemmas and countermeasures for high-quality development of Guangxi sugar industry. Guangxi Sugar Ind. 2022, 42, 35–38. [Google Scholar]
  4. Li, S.; Feng, X.F. A Study on Market Power in China’s Sugar Import Trade; Price Monthly: Jiangxi Province, China, 2021; pp. 40–47. [Google Scholar]
  5. Wei, J.N. Analysis on changes and influencing factors of sugarcane production layout in Guangxi. Chin. J. Trop. Agric. 2023, 43, 126–131. [Google Scholar]
  6. Xie, G.X.; Su, Q.Q.; Yang, N.; Yang, S.; Huang, Q.; Qu, T. Analysis of changes in Guangxi’s leading agricultural economic industries and countermeasure suggestions. J. Anhui Agric. Sci. 2024, 52, 255–259. [Google Scholar]
  7. Lu, P. Investigation on the Current Development and Influencing Factors of Mechanized Sugarcane Harvesting in Guangxi. Master’s Thesis, Guangxi University, Nanning, China, 2023. [Google Scholar]
  8. Hu, Z.H.; Yin, Y.L.; Zhang, T.F.; Li, J.Q.; Wei, X.; Yan, Q.Y. Feasibility and economic benefit analysis of sugarcane step-by-step mechanical harvesting. Sugar Crops China 2023, 45, 70–80. [Google Scholar]
  9. Liu, X.X.; Yan, C.Y.; Li, T.H. Investigation and analysis on influencing factors and cost-benefit of sugarcane planting behavior in Guangxi. Sugar Crops China 2020, 42, 59–66. [Google Scholar]
  10. Zhang, J.Y.; Li, F.N.; Wei, L. Analysis of Strategies for the Brand Development of the Sugar Industry in Guangxi. Guangxi Sugar Ind. 2023, 43, 28–31. [Google Scholar]
  11. Lei, C.B. Building a New Ecological Model of Harmonious and Win-Win Development for China’s Sugar Industry—Research on the Development of China’s Sugar Industry during the 14th Five-Year Plan Period. Guangxi Sugar Ind. 2021, 42, 38–44. [Google Scholar]
  12. Du, Z.X.; Zhang, H.Y.; Zhu, J.; Lin, W.; Luo, B. Further Deepening Rural Reform and Improving the Support System for Strengthening, Benefiting, and Enriching Agriculture—Explanations by Authoritative Experts on the 2024 Central Economic Work Conference and the Central Rural Work Conference. China Rural Econ. 2025, 3–19. [Google Scholar] [CrossRef]
  13. National Sugarcane Industry Technology System. Chinese Modern Agricultural Industry Sustainable Development Strategy Research: Sugarcane Volume; Agriculture Press: Beijing, China, 2018. [Google Scholar]
  14. Liu, Z.X. Evaluation and international comparison of China’s sugar industry security under open conditions. Issues Agric. Econ. 2012, 33, 77–84. [Google Scholar]
  15. Wei, J.P.; Zhou, X.R.; Huang, Y.Z. Development Status and Strategies of Guangxi Sugar Industry from the Perspective of Strategic Reserve Security. Guangxi Sugar Ind. 2024, 44, 61–66. [Google Scholar]
  16. Chen, Y.H. Analysis of Influencing Factors of Farmers’ Willingness to Plant Sugarcane in Binyang County, Guangxi. Master’s Thesis, Zhongkai University of Agriculture and Engineering, Guangzhou, China, 2018. [Google Scholar]
  17. Li, H. Investigation and analysis of sugarcane planting behaviors of farmers in Longchuan County Yunnan. Sugarcane Canesugar 2022, 51, 34–39. [Google Scholar]
  18. Rossetto, R.; Ramos, N.P.; de Matos Pires, R.C.; Xavier, M.A.; Cantarella, H.; de Andrade Landell, M.G. Sustainability in sugarcane supply chain in Brazil: Issues and way forward. Sugar Tech 2022, 24, 941–966. [Google Scholar] [CrossRef]
  19. Hiban, I.D.; Nugraha, D.; Dwirayani, D. Analysis of Factors Affecting Sugarcane Farmers’ Income (Case Study: PT. PG Rajawali II Unit PG. Sindanglaut). Asian J. Manag. Entrep. Soc. Sci. 2024, 4, 73–83. [Google Scholar]
  20. Picoli, M.C.A.; Machado, P.G. Land use change: The barrier for sugarcane sustainability. Biofuels Bioprod. Biorefin. 2021, 15, 1591–1603. [Google Scholar] [CrossRef]
  21. da Silva, G.J.; Berg, E.C.; Calijuri, M.L.; dos Santos, V.J.; Lorentz, J.F.; do Carmo Alves, S. Aptitude of areas planned for sugarcane cultivation expansion in the state of São Paulo, Brazil: A study based on climate change effects. Agric. Ecosyst. Environ. 2021, 305, 107164. [Google Scholar] [CrossRef]
  22. Bahati, I.; Martiniello, G.; Abebe, G.K. The implications of sugarcane contract farming on land rights, labor, and food security in the Bunyoro sub-region, Uganda. Land Use Policy 2022, 122, 106326. [Google Scholar] [CrossRef]
  23. Fischer, G.; Teixeira, E.; Hizsnyik, E.T.; Van Velthuizen, H. Land Use Dynamics and Sugarcane Production//Sugarcane Ethanol; Wageningen Academic: Wageningen, The Netherlands, 2008; pp. 29–62. [Google Scholar]
  24. Dubb, A. Commodity Study: Small-Scale Sugar Production. 2020. Available online: http://hdl.handle.net/10566/5214 (accessed on 13 January 2025).
  25. Zheng, J. Current Status of China’s Sugarcane (Sugar) Industry and Prospects for Cooperation with Thailand. EDP Sci. 2024, 142, 01011. [Google Scholar] [CrossRef]
  26. Upreti, P.; Singh, A. An economic analysis of sugarcane cultivation and its productivity in major sugar producing states of Uttar Pradesh and Maharashtra. Econ. Aff. 2017, 62, 711–718. [Google Scholar] [CrossRef]
  27. Naeem, M.K.; Bashir, M.K.; Hussain, B.; Abbas, M. Assessment of profitability of sugarcane crop in Faisalabad district. Pak. J. Life Soc. Sci. 2007, 5, 30–33. [Google Scholar]
  28. Abnave, V.B. Economic viability of sugarcane cultivation: A comparative analysis. J. Sugarcane Res. 2021, 10, 158–173. [Google Scholar] [CrossRef]
  29. Zhang, Z.X.; Lin, L.; Huang, H.R. Technological progress, scale operation, and production efficiency in major sugarcane-producing regions of China. China Agric. Resour. Reg. Plan. 2021, 42, 251–259. [Google Scholar]
  30. Ye, J.; Xu, L.P. Empirical study on production efficiency of sugarcane advantageous regions in China based on DEA. Jiangsu Agric. Sci. 2015, 43, 476–480. [Google Scholar]
  31. Xie, Y.; Chen, R.K.; Chen, N.; Que, Y. An empirical investigation on the relationship between fertilizer inputs and production efficiency in the main sugarcane planting areas in China. Sugar Tech 2024, 26, 376–386. [Google Scholar] [CrossRef]
  32. Charnes, A.; Cooper, W.W.; Rhodes, E. Measuring the efficiency of decision making units. Eur. J. Oper. Res. 1978, 2, 429–444. [Google Scholar] [CrossRef]
  33. Sun, L.X.; Liang, J.J. Analysis of Fiscal Investment Efficiency and Its Influencing Factors in Senior Education under the Context of High-Quality Development. Res. Educ. Dev. 2025, 45, 19–27. [Google Scholar]
  34. Lan, Y. Evaluation of Public Health Fiscal Expenditure Efficiency—An Empirical Study of 12 Provinces in Western China. Stat. Decis. 2023, 39, 147–151. [Google Scholar]
  35. An, H.; Zhang, F. Innovation-Driven, Interest Rate Liberalization, and Efficiency Improvement in the Banking Industry. Reform 2017, 139–149. [Google Scholar]
  36. Yang, S.Y. Theory and Empirical Research on Total Factor Productivity. Master’s Thesis, Tianjin University, Tianjin, China, 2006. [Google Scholar]
  37. Gu, H.; Meng, L.J. Growth and Composition of Agricultural TFP in China. Quant. Econ. Tech. Econ. Res. 2002, 1518. [Google Scholar]
  38. Han, Y.H.; Zhang, F.; Zhu, C.W. Re-estimation and Dynamic Evolution Analysis of Total Factor Productivity in Chinese Cities—Based on the Perspectives of Common Frontier and Regional Production Technology Heterogeneity. Sci. Sci. Manag. ST 2025, 46, 62–75. [Google Scholar]
  39. Yan, C.Z.; Yin, L.J.; He, B. Logistics Industry Agglomeration, Spatial Spillover Effects, and Agricultural Green Total Factor Productivity—An Empirical Analysis Based on Provincial Data. China Circ. Econ. 2022, 36, 3–16. [Google Scholar]
  40. Min, C.; Xinjie, P. Evaluation on the spatial differences and temporal changes of infrastructure investment efficiency of cities at prefecture level or above in China based on DEA and malmquist index. Manag. Rev. 2017, 29, 225. [Google Scholar]
  41. Guan, L.J.; Zhao, W. Evaluation of Rural Infrastructure Supply Efficiency Based on DEA-Malmquist. Stat. Decis. 2020, 36, 172–175. [Google Scholar]
  42. Zhang, C.X.; Shang, Y.; Aubli, T. Dynamic comparison of wheat production efficiency between Xinjiang and major wheat-producing areas in China based on DEA-Malmquist method. Sci. Technol. Cereals Oils Foods 2024, 32, 227–234. [Google Scholar]
  43. Zhang, Y.L.; Zhou, Y.J. A review of clustering algorithms. J. Comput. Appl. 2019, 39, 1869–1882. [Google Scholar]
  44. Yao, J.; Liao, Y.H.; Zhang, H.D.; He, J.P.; Wang, Z.Q. Evaluation of passenger check-in efficiency in railway transit operations based on DEA-Malmquist-Tobit model. Railw. Transp. Econ. 2025, 47, 156–164+190. [Google Scholar] [CrossRef]
  45. Xia, C.F. Research on the Green Economic Development Efficiency of Various Prefectures in Xinjiang Based on DEA-Tobit Model. Master’s Thesis, Kashgar University, Kashgar, China, 2022. [Google Scholar]
  46. Liao, Q.H.; Chen, T.; Sun, Y.; Tao, Z.M. Generalized Additive Fuzzy DEA-BCC Efficiency Evaluation Model and Its Application. Stat. Decis. 2016, 24, 74–76. [Google Scholar]
  47. Gomes, E.G.; Meza, L.A.; Neto, L.B. Alguns paradoxos em modelos dea-bcc: Eficiências negativas e inexistência de retornos de escala. In Proceedings of the XXVIII ENCONTRO NACIONAL DE ENGENHARIA DE PRODUÇÃO, Rio de Janeiro, Brazil, 13–16 October 2008. [Google Scholar]
  48. Ni, P.; Shi, L.G.; Ren, X.H.; Wang, J.; Tang, Z.; Xu, L. Evaluation of Surgical Department Operational Efficiency Based on DEA-BCC and Malmquist Index Models. Chin. J. Health Stat. 2024, 41, 901–904. [Google Scholar]
  49. Shan, B.; Zhou, H.L.; Tang, H.W.; Qin, Q.; Tang, X.; Pang, X.; Tang, S.; Zhou, Q. Impact of COVID-19 epidemic on Guangxi sugarcane industry and corresponding countermeasures. Chin. J. Trop. Agric. 2020, 21–24. [Google Scholar]
  50. Yang, J. Promoting Mechanized Harvesting of Sugarcane Through Diversified Strategies; China Agricultural Mechanization Herald: Beijing, China, 2024. [Google Scholar]
  51. Zhang, Y.; Liu, Y.Q.; Xiao, G.J.; Wan, Z.; Xie, J. Development status and policy suggestions for Guangdong sugarcane industry in 2014. Guangdong Agric. Sci. 2015, 42, 4–8. [Google Scholar]
  52. Liu, X.X.; Wang, J.; Zhou, J.Y. Dynamic evolution and influencing factors of sugarcane cost-benefit in China from 2001 to 2020. Sugarcane Canesugar 2023, 52, 55–70. [Google Scholar]
  53. Cen, Q. Guangxi Sugar Output Accounts for 60% of the National Total for 20 Consecutive Sugar Seasons, with an Estimated Sugarcane Planting Area of over 11.3 Million mu in 2024. Guangxi Daily. 2024; p. 20. Available online: http://nynct.gxzf.gov.cn/xwdt/ywkb/t18581478.shtml (accessed on 6 April 2025).
  54. Zhao, R.F.; Wang, W.; Liu, H.M.; Xue, W. Analysis on independent innovation capacity of Guangxi sugar industry. China Mark. 2011, 171–173. [Google Scholar]
  55. Chen, H.J.; Qin, D.S.; Yuan, S.H.; Huang, M.; Liang, J.; Wei, H.; Li, B.; Zhu, W. Analysis of planting efficiency of sugarcane, eucalyptus, and citrus in Guigang. Guangxi Sugar Ind. 2024, 44, 16–21. [Google Scholar]
  56. Gan, J.W.; Zhou, Y.F.; Mo, S.F. Implementation of farmland chief system and stabilization of sugarcane base in Laibin City. South China Nat. Resour. 2023, 12–15. [Google Scholar]
  57. Cen, Q.; Xiong, M.Z. Guangxi promotes comprehensive development of sugar industry through multi-point efforts. China Food Saf. Newsp. 2024. [Google Scholar] [CrossRef]
  58. He, F.; Fu, X.Y. Development situation and strategies of sugarcane in Hainan. Sugarcane 1998, 32–34. [Google Scholar]
  59. Zhong, Y.K.; Ou, B.; Deng, J. Current situation and countermeasures of sugarcane industry in Hainan Province. Sugar Crops China 2016, 38, 74–76. [Google Scholar]
  60. Wu, D.G.; Wu, J.T.; Xie, J.; Wang, Q.; Qiu, Y. Analysis on development trend of sugarcane production in China. Guangdong Agric. Sci. 2017, 44, 154–160. [Google Scholar]
  61. Zhan, L.; Xu, Z.H.; Huang, Z.G. Analysis on regional comparative advantages of sugarcane industry in China. Chin. J. Trop. Agric. 2025, 45, 132–139. [Google Scholar]
  62. Yu, H.X.; Tian, C.Y.; Jing, Y.F.; An, R.D.; Lang, R.B.; Dong, L.H.; Tao, L.A.; Sun, Y.F.; Yang, L.H.; Bian, X.; et al. SWOT analysis of sugar industry development in Yunnan. Sugar Crops China 2022, 44, 81–88. [Google Scholar]
  63. Zou, X.; Fu, M.; Wang, X.; Chen, F. Spatio-temporal changes and regional advantage analysis of sugarcane production in China from 1985 to 2018. J. China Agric. Univ. 2022, 27, 120–131. [Google Scholar]
  64. Qin, L.J. Research on the Development of Sugarcane Industry in Yunnan. Master’s Thesis, Guangdong Ocean University, Zhanjiang, China, 2021. [Google Scholar]
  65. Li, D.X.; Yin, Q.; Fang, W. Analysis on the production situation of Guangdong sugarcane industry in 2023. Sugarcane Canesugar 2024, 53, 66–74. [Google Scholar]
  66. Wan, C.X.; Hu, Z.D. Discussion on promoting modernization of sugarcane industry through agricultural science and technology innovation. Countrys. Agric. Farmers 2023, 35–37. [Google Scholar]
  67. Zhang, X.D. Analysis of Agricultural Production Efficiency and Its Influencing Factors in Hebei Province. Master’s Thesis, Hebei University, Baoding, China, 2008. [Google Scholar]
  68. He, X.L. Empirical Study on Agricultural Carbon Emissions, Agricultural Production Efficiency, and Economic Development in China. Master’s Thesis, Lanzhou University, Lanzhou, China, 2018. [Google Scholar]
  69. Mei, X.Y. The Importance of Ensuring and Expanding Effective Irrigation Area for Food Security. People’s Forum Acad. Front. 2022, 87–95. [Google Scholar]
  70. Hua, L. Analysis of the Influencing Factors of Agricultural Production Efficiency in Six Provinces of Central China. Guangxi Qual. Superv. Bull. 2021, 75–76. [Google Scholar]
  71. Zeng, M.Y.; Song, S.M. Can Farmers’ Income Promote Agricultural Production Technical Efficiency?—Path Analysis Based on Labor Price Distortion and Technological Innovation. Xinjiang Agric. Reclam. Econ. 2023, 1–12+77. [Google Scholar]
  72. Bin, L.H.; Liu, C.Y. Analysis of Sugarcane Production Efficiency and Its Influencing Factors in Guigang City. Hunan Agric. Sci. 2017, 105–109. [Google Scholar]
  73. Wang, L.N. Measurement and Analysis of the Influencing Factors of Agricultural Green Production Efficiency in China. Technol. Econ. Manag. Res. 2022, 37–41. [Google Scholar]
  74. Deng, J.M.; Dong, K.J.; Wang, X. Study on the Impact of Agricultural Meteorological Disasters on Food Production Efficiency. South. Metrop. J. 2023, 43, 101–108. [Google Scholar]
  75. Huang, J.Q.; Ding, P.F. Research on the Coordination of Agricultural Production Efficiency in Jiangsu Province under the Background of New-Type Urbanization. Jiangsu Bus. Rev. 2024, 99–102. [Google Scholar]
  76. Chen, C.B.; Han, Z.B. Rural Hollowing, Farmers’ Drought, and the Cultivation of Professional Farmers. J. China Univ. Geosci. 2013, 13, 7. [Google Scholar]
  77. Tian, H.Y.; Zhu, Z.Y. Analysis of China’s Grain Production Efficiency and Influencing Factors—Based on DEA-Tobit Two-Step Method. China Agric. Resour. Zoning 2018, 39, 161–168. [Google Scholar]
  78. Ju, L.P. Study on Wheat Production Efficiency and Its Influencing Factors in Hebei Province. Master’s Thesis, Jilin Agricultural University, Changchun, China, 2023. [Google Scholar]
  79. Wang, M.Y. Study on the Impact of Agricultural Industry Clustering on Agricultural Green Total Factor Productivity. Master’s Thesis, Shanxi University of Finance and Economics, Taiyuan, China, 2024. [Google Scholar]
  80. Wang, H.; Gao, M. Regional Differences and Spatio-Temporal Variation of Rice Production Efficiency in China—An Empirical Analysis Based on Major Rice-Producing Areas. China Agric. Sci. Technol. Bull. 2020, 22, 1–11. [Google Scholar]
  81. Bai, L.; Liu, L. Study on Total Factor Productivity of Fruit Production in China—Analysis Based on DEA-Malmquist Index Method. Product. Res. 2021, 106–109. [Google Scholar]
  82. Solomon, S. The Indian sugar industry: An overview. Sugar Tech 2011, 13, 255–265. [Google Scholar] [CrossRef]
  83. Tan, J.J. Analysis of Sugarcane Production Cost Structure and International Competitiveness Comparison in China. Agric. Technol. 2018, 38, 161–164. [Google Scholar]
  84. Qian, Y.L.; Kuang, Z.M.; Zhao, X.F.; Zhang, Y.H.; He, Y.B. Evolution of Global Sugarcane Planting and Sugar Production Circulation. Sugarcane Ind. 2024, 53, 68–81. [Google Scholar]
  85. Liu, X.X.; Li, W.; Meng, W.Y. Investigation of Global Sugar Production Layout Characteristics and Evolution of Major Producing Countries. Sugarcane Ind. 2024, 53, 49–65. [Google Scholar]
Figure 1. Trends of national comprehensive technical efficiency, pure technical efficiency, and scale efficiency in sugarcane production during 2011–2023.
Agriculture 15 00885 g001
Figure 2. Comparative trends of comprehensive technical efficiency, pure technical efficiency, and scale efficiency in major sugarcane-producing regions during 2011–2023.
Agriculture 15 00885 g002
Figure 3. Spectrum of cluster analysis for the whole country and the four main sugarcane production areas.
Agriculture 15 00885 g003
Table 1. Relative values of comprehensive technical efficiency, pure technical efficiency, and scale efficiency, along with changes in returns to scale in major sugarcane-producing regions during 2011–2023.
Year2011201220132014201520162017201820192020202120222023
NationwideTE0.9931.0001.0000.9950.9880.8920.8940.9330.9720.9870.9900.7650.970
PTE0.9961.0001.0001.0000.9970.8950.9210.9391.0000.9980.9920.9510.986
SE0.9971.0001.0000.9950.9910.9980.9710.9930.9720.9890.9970.8040.984
DRS--DRSIRSDRSIRSDRSDRSIRSIRSIRSIRS
GuangdongTE1.0001.0000.9630.9930.8811.0001.0001.0001.0000.9191.0001.0001.000
PTE1.0001.0001.0001.0001.0001.0001.0001.0001.0001.0001.0001.0001.000
SE1.0001.0000.9630.9930.8811.0001.0001.0001.0000.9191.0001.0001.000
--DRSIRSIRS----IRS---
GuangxiTE1.0001.0001.0000.9861.0000.8160.8761.0000.9401.0001.0000.7090.968
PTE1.0001.0001.0001.0001.0000.8430.8851.0000.9771.0001.0000.9310.980
SE1.0001.0001.0000.9861.0000.9680.9911.0000.9621.0001.0000.7620.987
---DRS-IRSIRS-DRS--IRSIRS
HainanTE1.0001.0001.0001.0001.0001.0001.0001.0001.0000.8420.6400.6970.612
PTE1.0001.0001.0001.0001.0001.0001.0001.0001.0001.0001.0001.0001.000
SE1.0001.0001.0001.0001.0001.0001.0001.0001.0000.8420.6400.6970.612
---------IRSIRSIRSIRS
YunnanTE1.0001.0001.0001.0001.0001.0001.0001.0001.0001.0001.0001.0001.000
PTE1.0001.0001.0001.0001.0001.0001.0001.0001.0001.0001.0001.0001.000
SE1.0001.0001.0001.0001.0001.0001.0001.0001.0001.0001.0001.0001.000
-------------
DRS indicates decreasing returns to scale, IRS represents increasing returns to scale, and “-” denotes that an optimal scale has been achieved.
Table 2. Malmquist productivity index and its components for the whole country and four sugarcane dominant producing regions during 2012–2021.
Technical Efficiency Change
(Effch)
Technical Progress Change
(Techch)
Pure Technical Efficiency Change
(Pech)
Scale Efficiency Change
(Sech)
Total Factor Productivity Change
(Tfpch)
AreaIndex ValueRankIndex ValueRankIndex ValueRankIndex ValueRankIndex ValueRank
Nationwide0.99820.97920.99920.99920.9773
Guangdong1.00010.98811.00011.00010.9881
Guangxi0.99730.97920.99830.99920.9773
Hainan0.96040.92231.00010.96030.8854
Yunnan1.00010.97921.00011.00010.9792
Average0.9910.9691.0000.9910.961
Table 3. Malmquist productivity index and its components for the country as a whole and for the four sugarcane-producing areas in which sugarcane is dominant, from the 12th to the 14th Five-Year Plan periods.
TimeAreaTechnical Efficiency Change
(Effch)
Technical Progress Change
(Techch)
Pure Technical Efficiency Change
(Pech)
Scale Efficiency Change
(Sech)
Total Factor Productivity Change
(Tfpch)
Index ValueRankIndex ValueRankIndex ValueRankIndex ValueRankIndex ValueRank
12th Five-Year PlanNationwide0.99920.93131.00010.99920.9303
Guangdong0.96930.89751.00010.96930.8695
Guangxi1.00010.92641.00011.00010.9264
Hainan1.00010.98311.00011.00010.9831
Yunnan1.00010.96621.00011.00010.9662
Average0.9930.9401.0000.9930.934
13th Five-Year PlanNationwide1.02520.96121.02820.99830.9853
Guangdong0.97940.93141.00030.97940.9114
Guangxi1.05210.95531.04411.00811.0041
Hainan0.95850.85851.00030.95850.8225
Yunnan1.00030.99611.00031.00020.9962
Average1.0020.9391.0140.9880.941
14th Five-Year PlanNationwide0.99021.01720.99720.99321.0072
Guangdong1.00011.01531.00011.00011.0151
Guangxi0.98431.02010.99030.99321.0043
Hainan0.97740.96551.00010.97730.9435
Yunnan1.00011.00341.00011.00011.0034
Average0.9901.0040.9970.9930.994
Table 4. Defines the factors affecting production efficiency in the primary catchment region and at the national level.
NormIndicator Symbols
Implicit VariableIntegrated technical efficiency of sugarcane (TE)y
Independent VariableEffective irrigated area of sugarcane (thousands of hectares)x1
Per capita disposable income of rural residents (CNY)x2
Average years of schooling in rural areas (year)x3
Disaster rate (%)x4
Urbanization rate (%)x5
Table 5. VIF test results of influencing factors of sugarcane production efficiency.
VariableVIF1/VIF
Effective irrigated area of sugarcane (thousands of hectares)1.030.968688
Per capita disposable income of rural residents (CNY)3.100.322423
Average years of schooling in rural areas (year)2.080.480392
Disaster rate (%)1.370.728967
Urbanization rate (%)3.530.283603
Mean VIF2.220.5568146
Table 6. Tobit regression results on factors influencing the nation’s and the four major sugarcane-producing areas’ production efficiency.
VariableCoefficientStd. Err.zp > |z|
x1−0.000020.00004−0.460000.64800
x2−0.000010.00000−2.850000.00400 **
x3−0.092710.02714−3.420000.00100 ***
x40.024040.094640.250000.80000
x50.548630.17934 3.060000.00200 **
C1.497140.17319 8.64000 0.00000 ***
Note: ***, **, and * denote significance at the 1%, 5%, and 10% levels, respectively. Results in tables are treated with five decimal places.
Disclaimer/Publisher’s Note: The statements, opinions and data contained in all publications are solely those of the individual author(s) and contributor(s) and not of MDPI and/or the editor(s). MDPI and/or the editor(s) disclaim responsibility for any injury to people or property resulting from any ideas, methods, instructions or products referred to in the content.

