Article

Non-Destructive Prediction of Apple Moisture Content Using Thermal Diffusivity Phenomics for Quality Assessment

1
Department of Biosystems Engineering, Chungbuk National University, Cheongju 28644, Republic of Korea
2
The School of Public Science, Jeonbuk National University, Jeonju 54896, Republic of Korea
*
Author to whom correspondence should be addressed.
These authors contributed equally to this work.
Agriculture 2025, 15(8), 869; https://doi.org/10.3390/agriculture15080869
Submission received: 18 March 2025 / Revised: 1 April 2025 / Accepted: 15 April 2025 / Published: 16 April 2025

Abstract

:
With the surge in digital farming, real-time quality management of fresh produce has become essential. For apples (Malus domestica Borkh.), consumer demand extends beyond sweetness, texture, and appearance to internal quality factors such as moisture content. Existing non-destructive methods, however, involve costly equipment, complex calibration, and sensitivity to environmental conditions. This study hypothesizes that thermal diffusivity indices derived from surface heating and cooling patterns can accurately predict apple moisture content non-destructively. A total of 823 apples from seven varieties were analyzed using a thermal imaging sensor in a 120-s process comprising 40 s of heating and 80 s of cooling. Key thermal diffusivity indices—minimum, maximum, mean, and max–min values—were extracted and correlated with actual moisture content measured via the drying method. Multiple linear regression and leave-one-out cross-validation confirmed that mean temperature-based models provided the most stable predictions ( R C V 2 ≥ 0.90 for some varieties). Frame optimization and artificial neural networks further improved prediction accuracy for varieties exhibiting higher variability. The proposed method is cost-effective, requires minimal calibration, and is less affected by surface reflectance, outperforming conventional optical methods (e.g., NIR spectroscopy, hyperspectral imaging), especially regarding robustness against surface reflectance variability and calibration complexity. This offers a practical solution for monitoring apple freshness and quality during sorting and distribution processes, with expanded research on sugar content and acidity expected to accelerate commercialization.

1. Introduction

With the onset of the Fourth Industrial Revolution, interest in digital farming has been growing worldwide. The integration of digital technologies in agriculture has advanced beyond precision agriculture, incorporating big data, the Internet of Things, and artificial intelligence (AI), thereby transforming the entire production, distribution, and consumption process [1,2]. In particular, the expansion of online purchases and direct delivery services for fresh produce has made real-time quality management tailored to consumer demands an essential component of digital farming [3,4].
Among fruits, apples (Malus domestica Borkh.) are a major commodity in both production and consumption, marketed not only as fresh produce but also as a key ingredient in processed products such as juice, jam, and dried fruit [5,6]. In recent years, consumer trends have increasingly shifted toward a comprehensive evaluation of apple quality, considering not only sweetness, texture, and appearance but also freshness [7], thereby driving demand for internal quality information [8]. However, current packaging labels primarily indicate attributes such as origin, grade, and weight, with limited provision of detailed quality indicators such as sugar content, acidity, and moisture levels [9]. To address this information asymmetry, various efforts to assess internal quality using non-destructive technologies are gaining traction [10,11].
Non-destructive internal quality assessment techniques widely introduced in research include near-infrared (NIR) spectroscopy, hyperspectral imaging (HSI), thermal imaging, and electronic nose technologies [12,13]. However, these methods have limitations, such as high equipment costs, sensitivity to measurement environments, and the need for complex calibration models. For instance, NIR spectroscopy is highly influenced by the sample surface’s reflectance properties and ambient light conditions [14], while HSI requires extensive data processing and costly spectral equipment [15]. The electronic nose technique primarily detects specific volatile organic compounds, making it less effective for quantifying the overall physical and chemical quality of apples [10]. Recent studies have also explicitly reported these limitations. Hyperspectral imaging combined with a Back Propagation Neural Network (BPNN) has been applied to predict apple firmness [16]. However, this approach risks significant overfitting with complex datasets. Moreover, it requires extensive computational time, limiting its practicality for large-scale, real-time applications. Additionally, recent research on NIR-based sweetness prediction models has identified increased prediction errors for samples with high variability, severely limiting their practical applicability in industrial settings [17]. Therefore, research into new non-destructive quality assessment techniques capable of overcoming these specific and contemporary limitations of existing methods is essential.
Apple moisture content (%), a key quality factor, is closely related to freshness, texture, and shelf life [11,17,18,19,20]. Traditionally, it has been measured accurately using destructive methods such as the dry weight method. However, there is a growing need for non-destructive technologies capable of real-time evaluation. Recently, research on thermal diffusivity-based techniques has increased, highlighting the potential of thermal imaging for fruit quality assessment [21,22]. Thermal imaging visualizes surface temperature distribution and has evolved beyond simply detecting surface defects or external appearance to examining correlations with internal properties such as moisture content and density [23].
Thermal diffusivity phenomics is a non-destructive approach that quantitatively analyzes the temporal and spatial thermal changes observed when heat (through heating and cooling) is applied to the apple surface to infer internal quality. Apples with a higher moisture content exhibit greater heat capacity, requiring more time for temperature changes and displaying different heat transfer characteristics, which can be captured through thermal imaging data [24,25]. This study applies a thermal diffusivity phenomics approach to predict apple moisture content by combining thermal imaging measurements with the dry weight method across various apple varieties. The correlation between thermal diffusivity data and actual moisture content was validated using multiple linear regression (MLR). Through this validation, the feasibility and effectiveness of thermal diffusivity-based non-destructive moisture assessment were examined. This study aims to provide an alternative to existing non-destructive techniques by offering a more cost-effective and simplified system for apple quality evaluation.

2. Materials and Methods

2.1. Apple Samples and Experimental Design

This study, conducted in 2022, was carried out using seven apple varieties commonly cultivated in South Korea: ‘Aori’, ‘Arisu’, ‘Hongro’, ‘Yanggwang’, ‘Myanmar’, ‘Fubrax’, and ‘Fuji’. A total of 823 apple samples were commercially purchased from local markets, representing typical storage apples available to general consumers. Therefore, specific information about the growth conditions, harvest timing, and maturity levels of the purchased apples was not available. To ensure freshness and uniform experimental conditions, all apples were temporarily stored at 4 °C, then stabilized at room temperature (26 °C) for at least one day before experiments. Subsequently, the apples underwent both thermal imaging measurements and moisture content analysis using the dry weight method (Figure 1) [26,27].

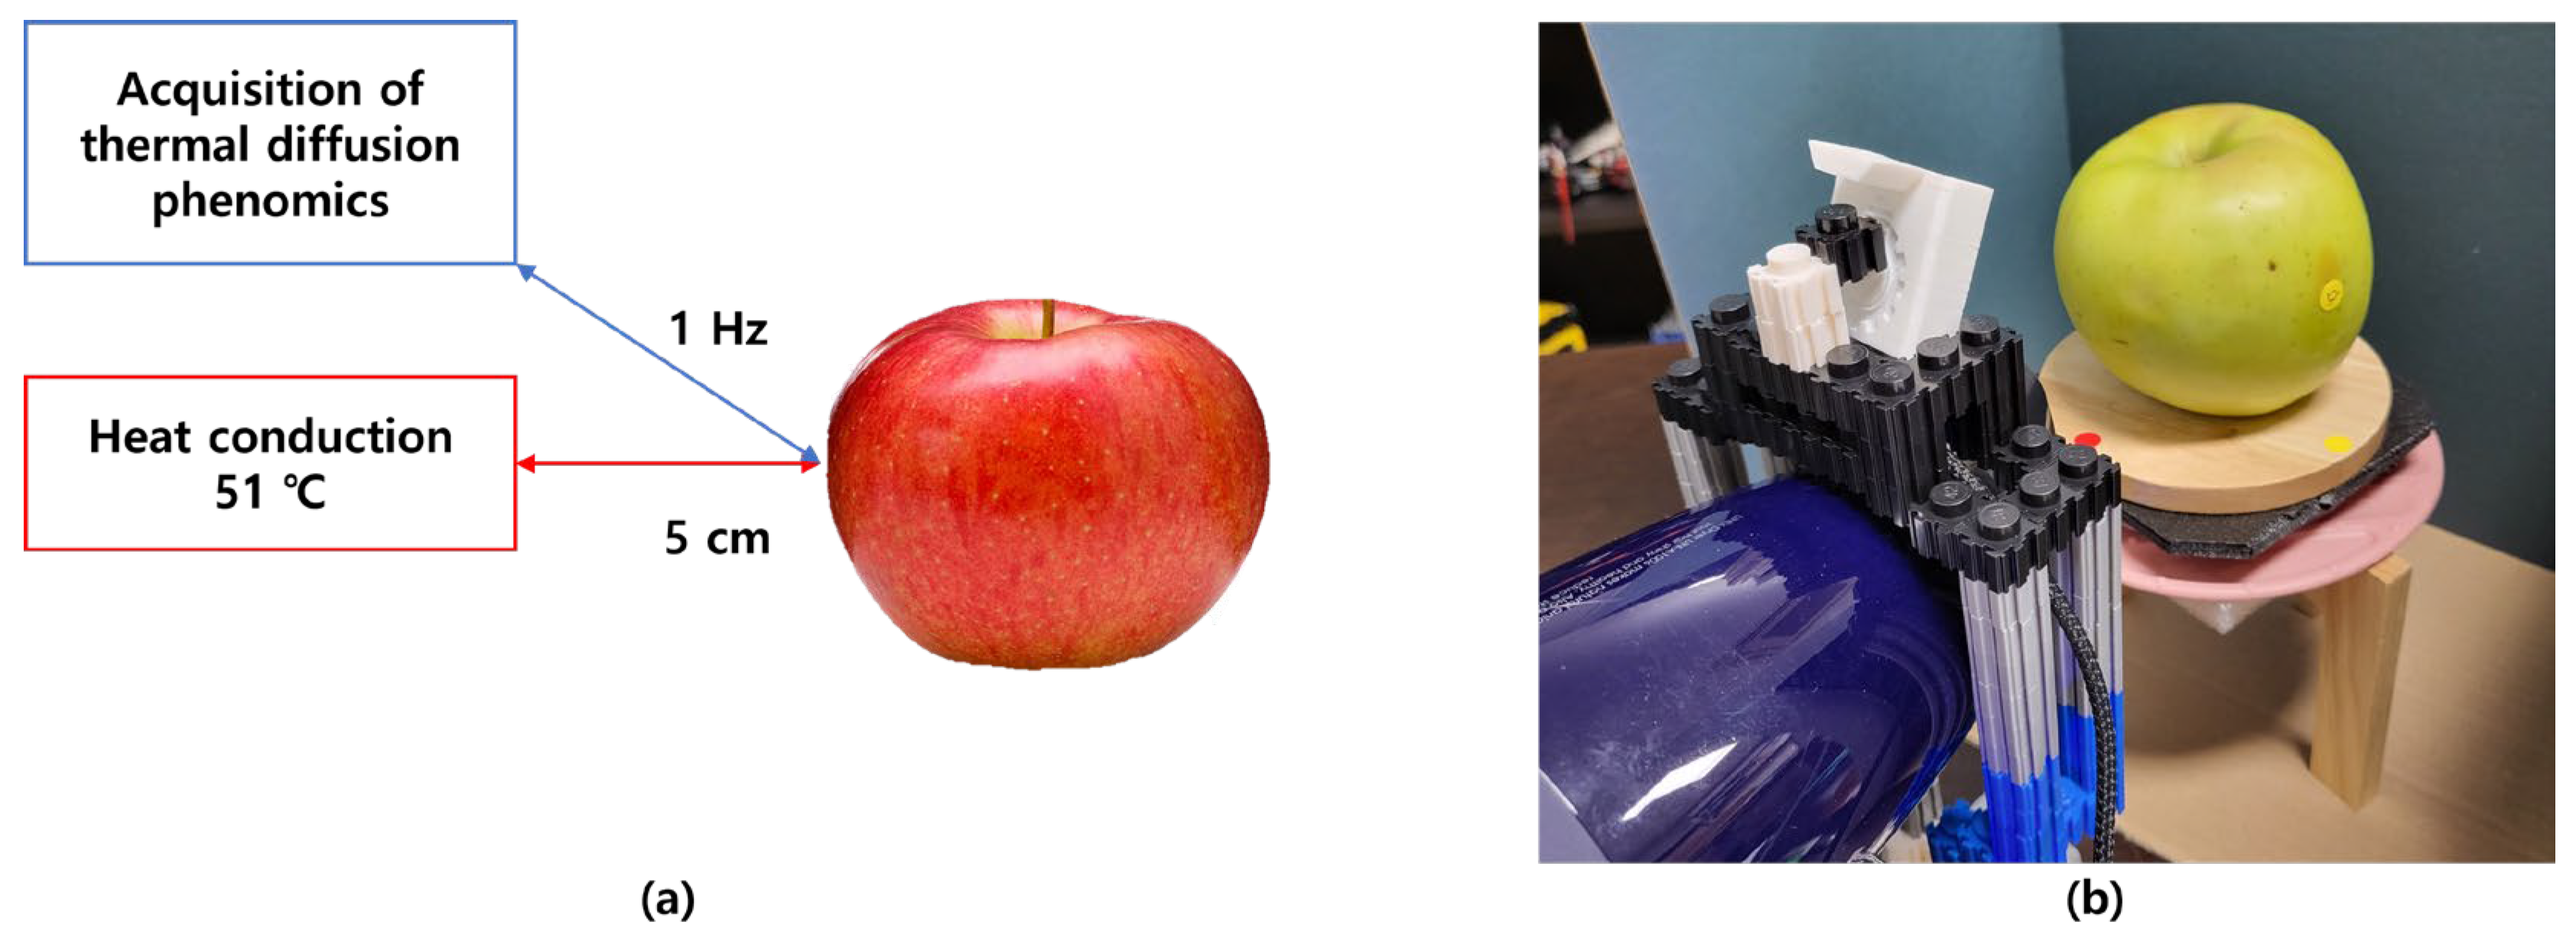
2.2. Fabrication of the Thermal Imaging Measurement System

A custom-built measurement system was developed to collect thermal diffusivity phenomics data. This system integrated a FLIR Lepton 3.0 thermal imaging sensor (Teledyne FLIR, Wilsonville, OR, USA) with a Purethermal 2 board (GroupGets LLC, Reno, NV, USA). The sensor has a 160 × 120 resolution and detects infrared radiation within the 8–14 µm wavelength range at a maximum frame rate of 9 Hz. The Purethermal 2 board facilitates real-time transmission of thermal image data to a PC via a USB interface. Thermal images were acquired at 1 Hz, with frames captured every second throughout the 120-s experimental period.

2.3. Thermal Diffusivity Data Collection via Heating and Cooling

To observe the thermal properties of the apple surface, a dryer set to approximately 51 °C (with ±1 °C temperature deviation confirmed through repeated preliminary tests) and a wind speed of 8.5 m/s was positioned 5 cm away to heat each apple individually for 40 s. To minimize temperature deviations and accidental measurement errors, only a single measurement per apple was conducted, with at least a 5-min stabilization interval between consecutive measurements. After heating, the dryer was removed, and apples underwent natural cooling for 80 s. Thus, the total data acquisition time was 120 s (40 s heating, 80 s cooling), with images captured at 1 Hz. The resultant thermal images were used for thermal diffusivity phenomics analysis (Figure 2).
For easier visual interpretation and quantitative analysis, the collected infrared (IR) data were converted into an RGB color map. The IR data obtained from the FLIR Lepton 3.0 sensor were first represented as grayscale images. The pixel temperature values were then normalized and mapped to a color scale to generate RGB images (Figure 3). This conversion assigned high-, medium-, and low-temperature regions to red (R), green (G), and blue (B) components, respectively. This approach enabled a more intuitive and quantitative analysis of temperature variation patterns and thermal diffusivity, which were later utilized in post-processing algorithms for moisture content.
The collected thermal imaging data reflect the temporal and spatial thermal response characteristics of the apple surface during heating and cooling. Thermal diffusivity patterns at each stage were quantified to capture variations in surface structure and heat transfer behavior. These patterns are closely related to moisture content and other quality indicators, serving as fundamental data for correlation analysis. Additionally, temperature rise patterns during heating and heat diffusion behavior during cooling define the apples’ thermal properties, providing crucial data for quality evaluation and the development of non-destructive moisture assessment models. This heating and cooling process was designed to analyze thermal characteristics in detail and compare thermal responses across different samples (Figure 4).

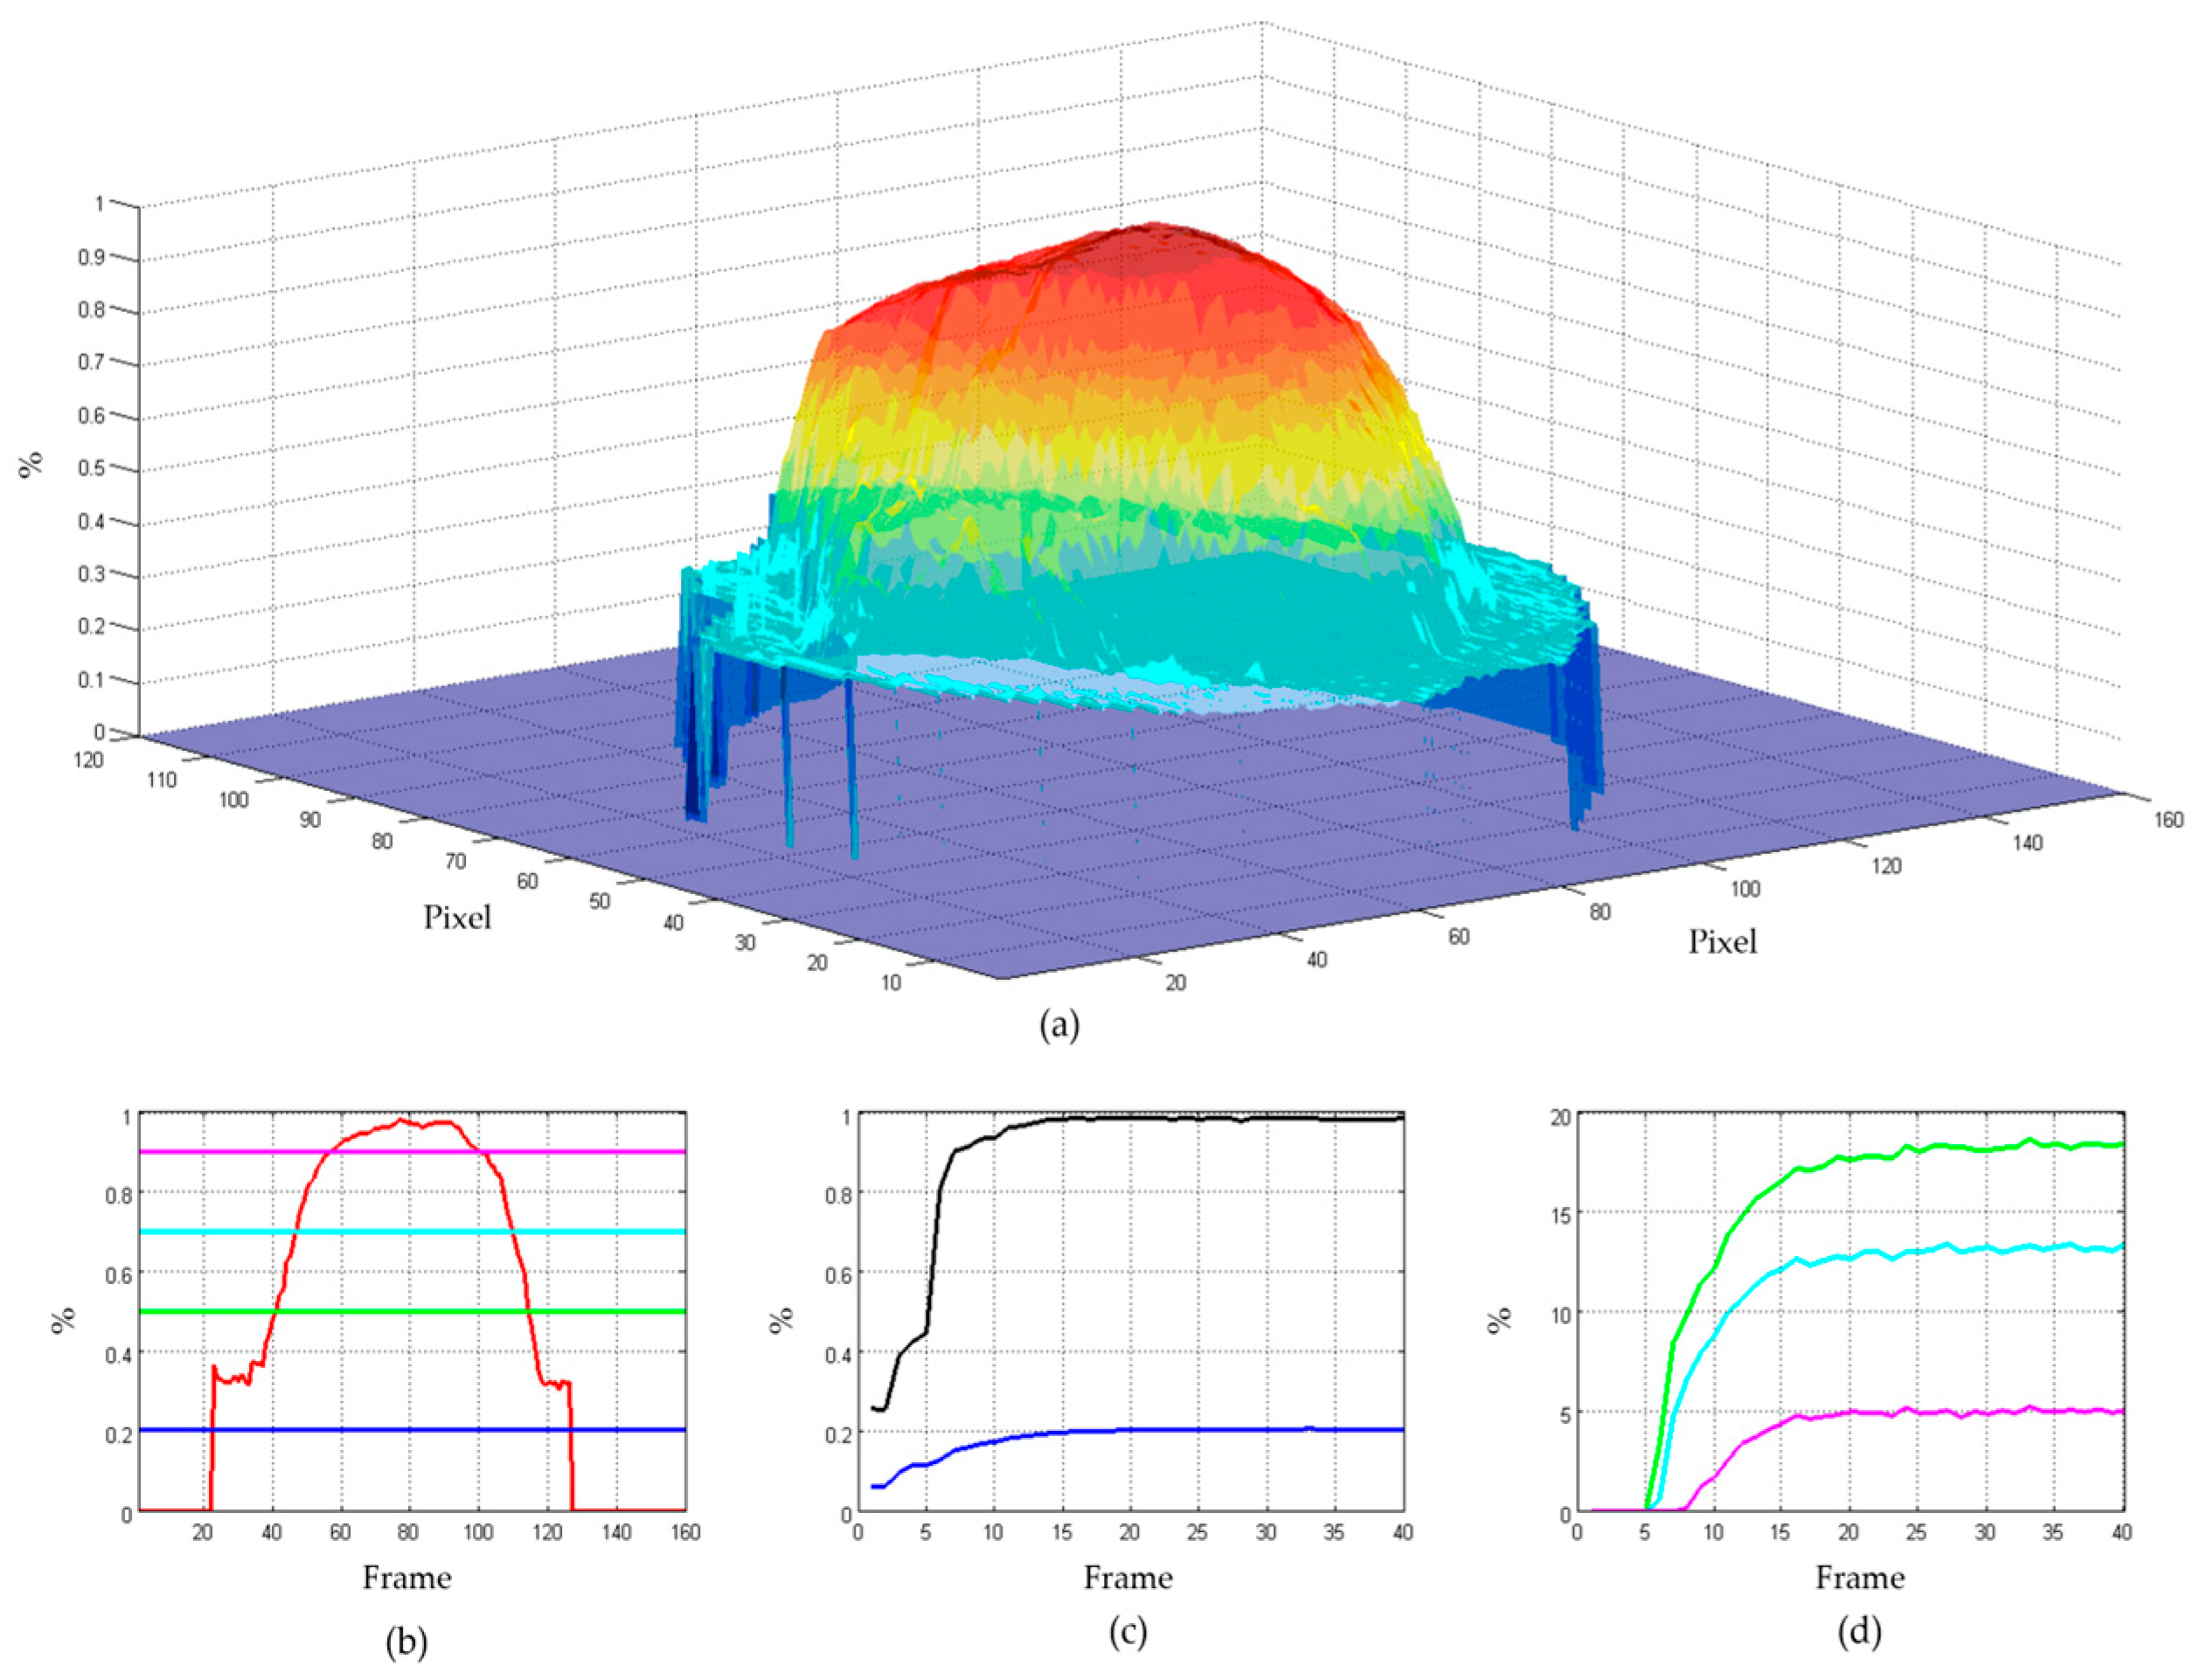
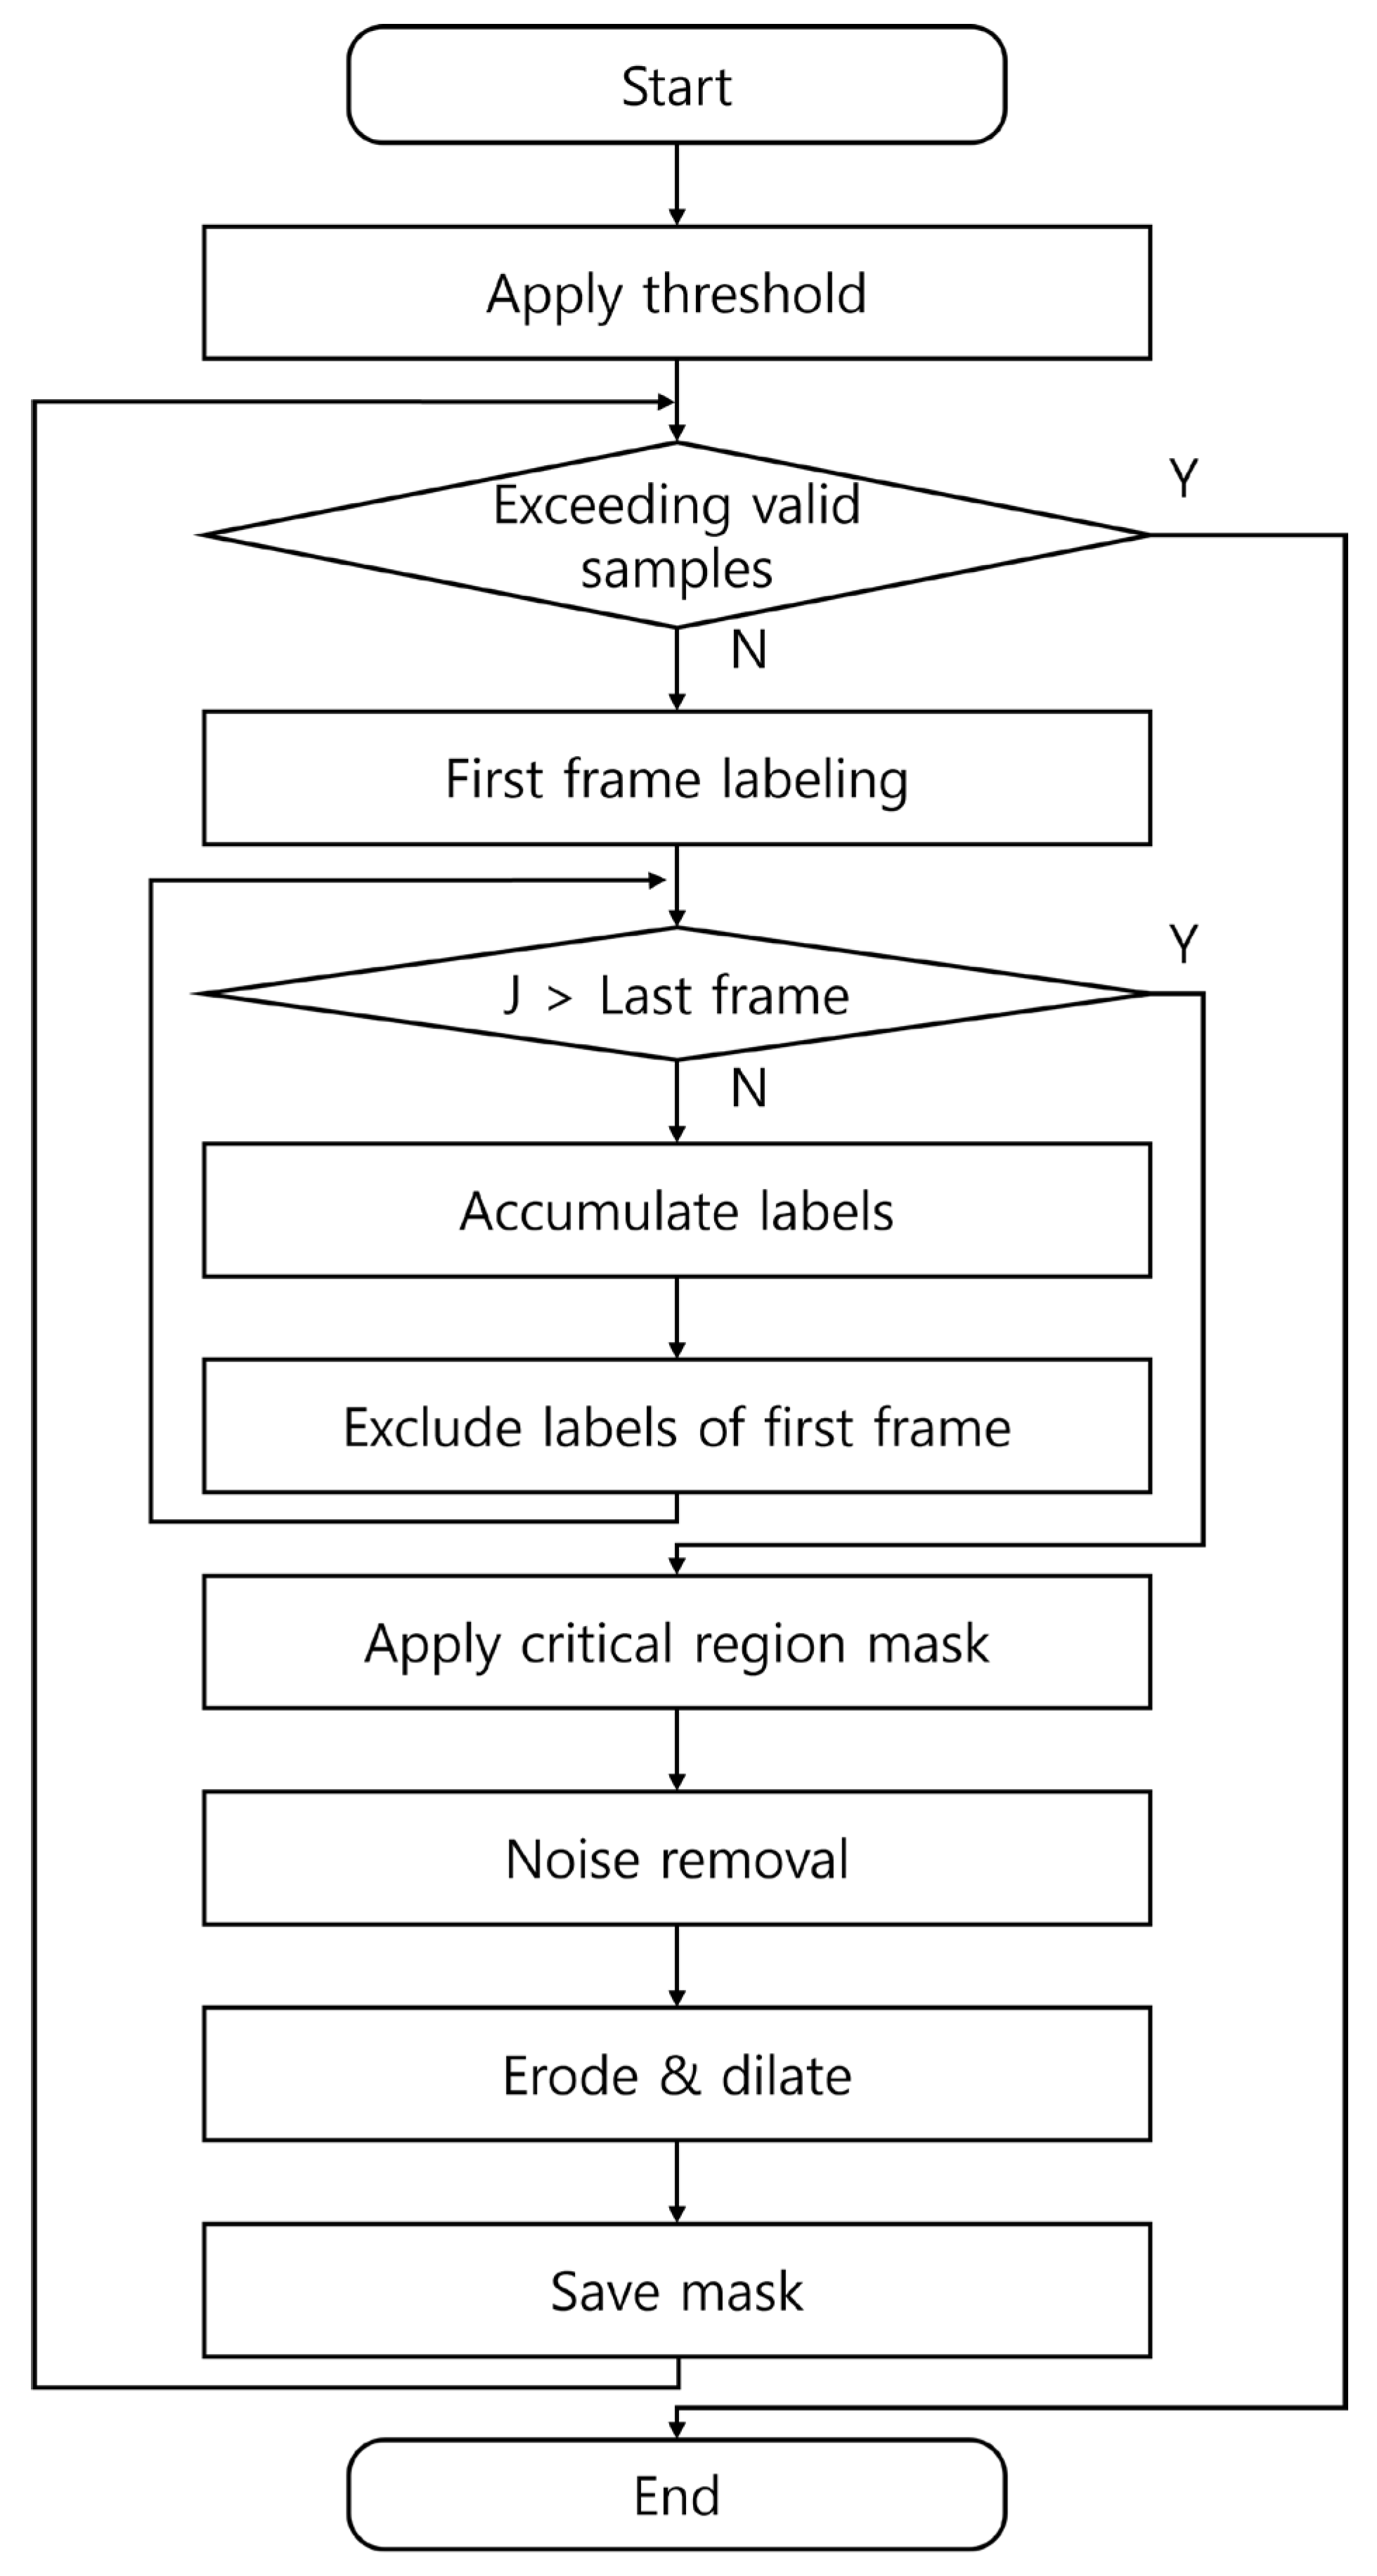
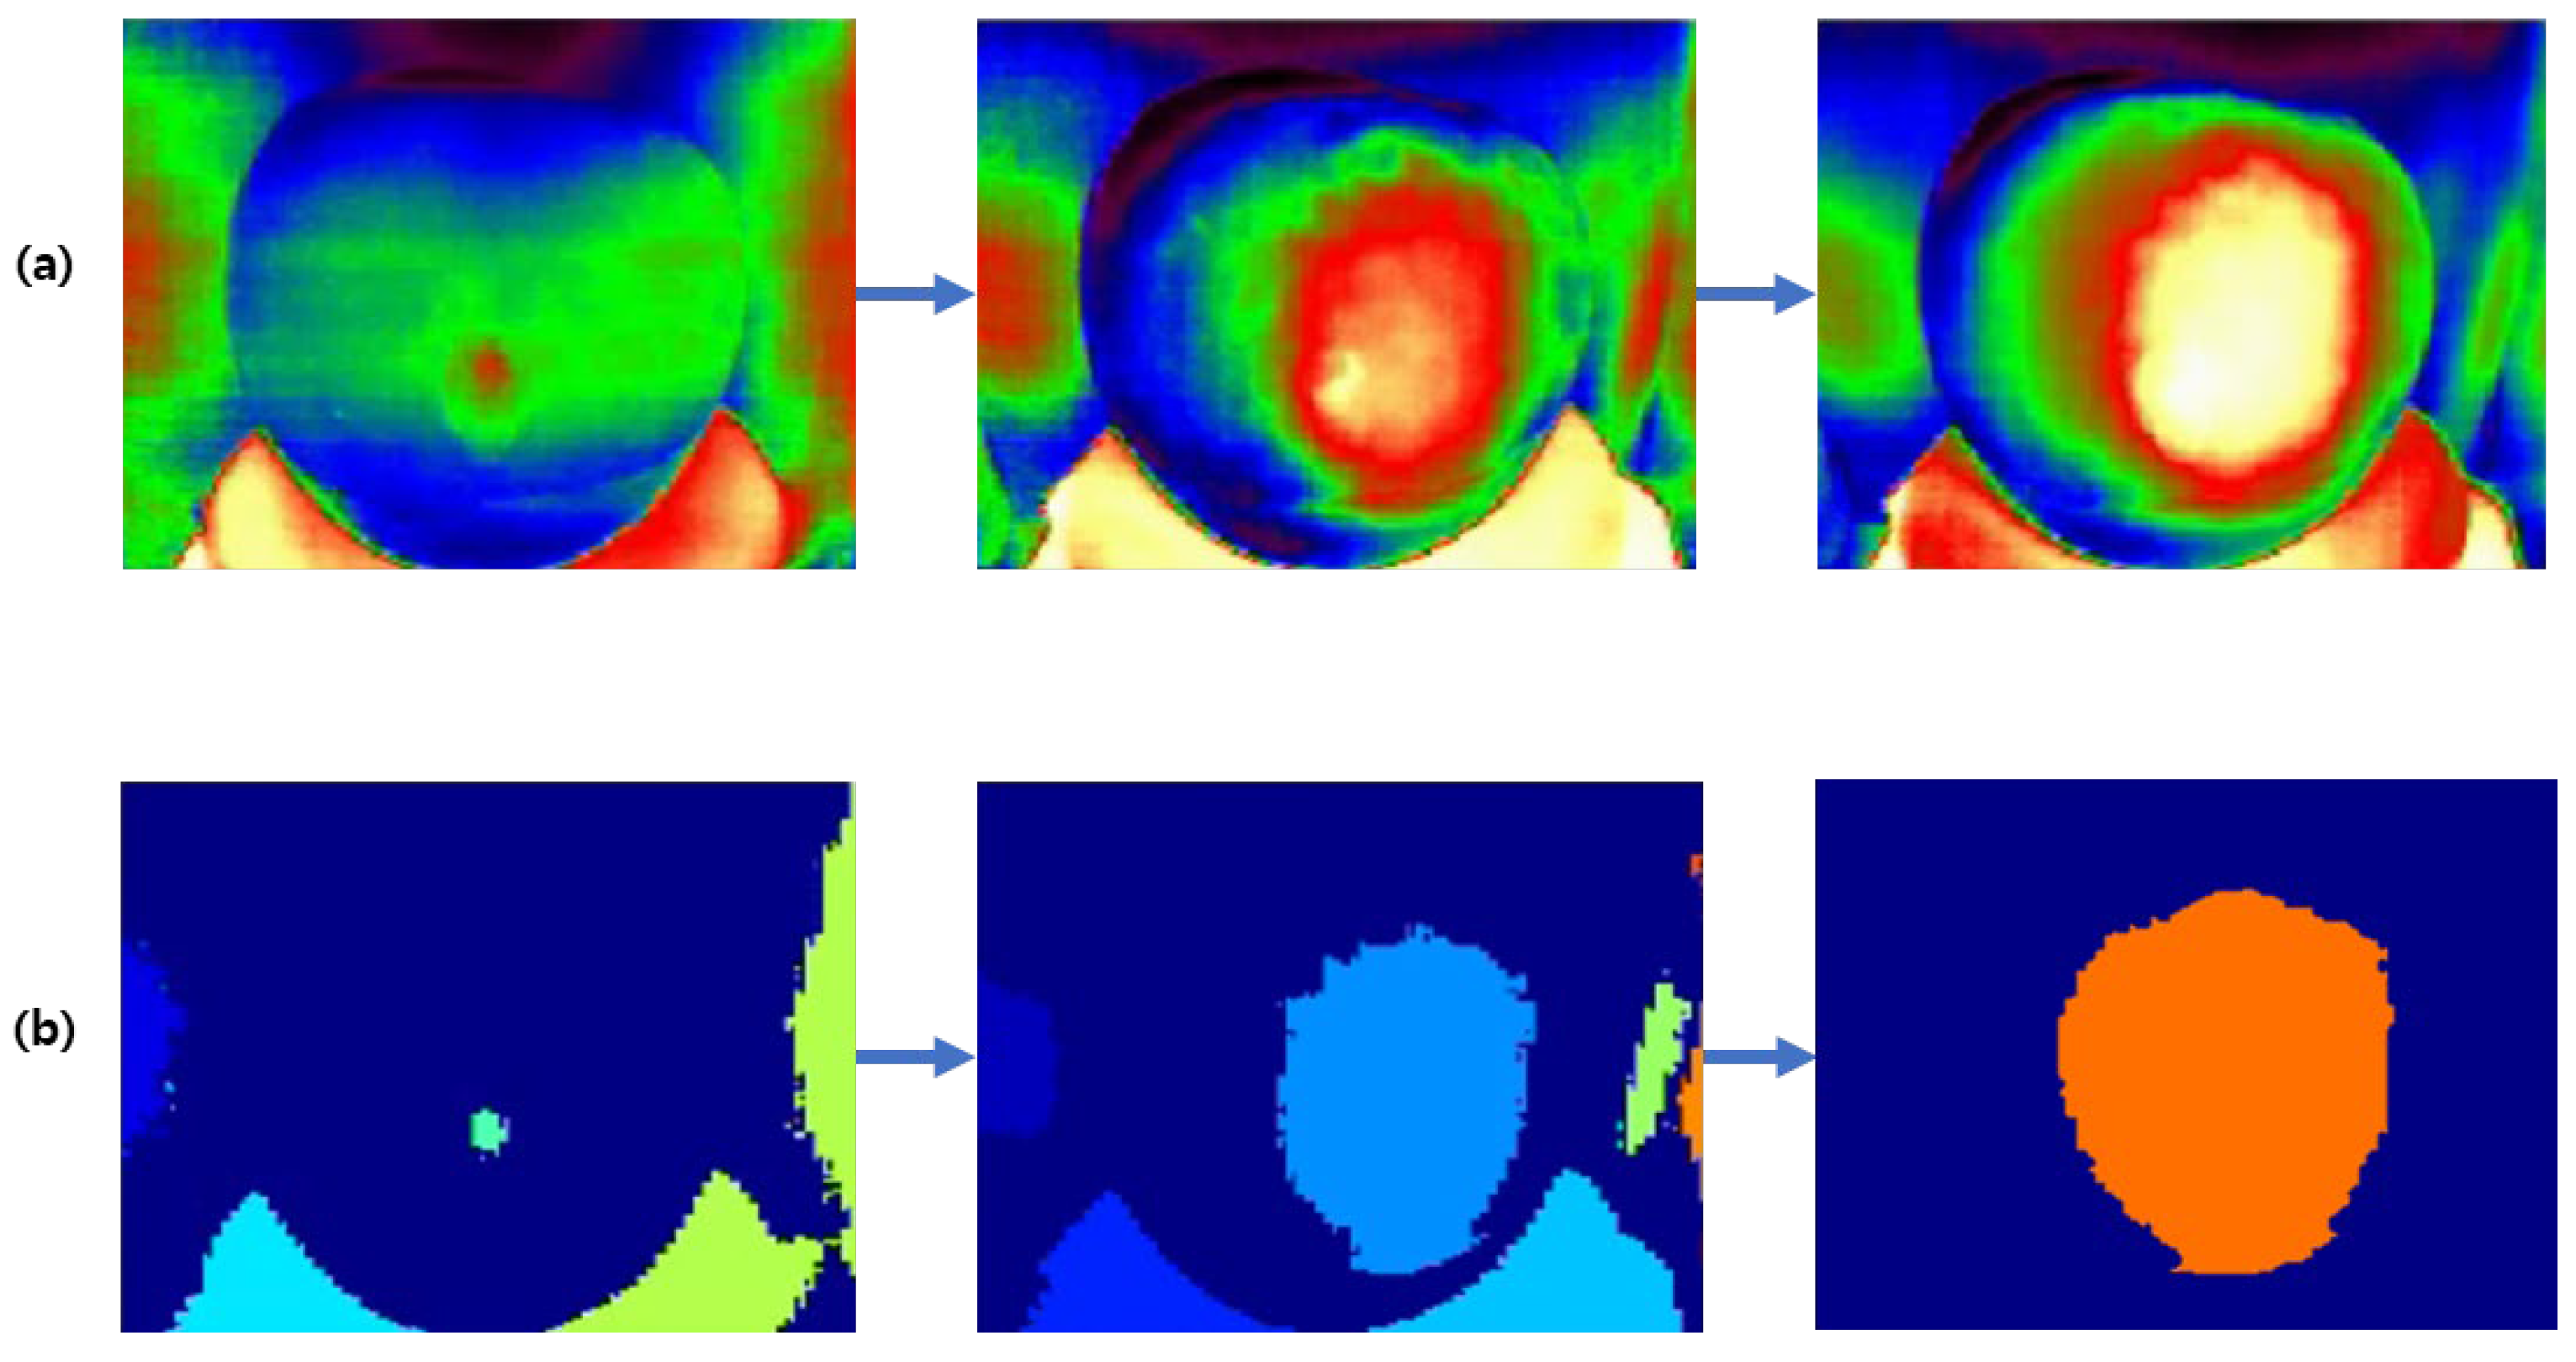
2.4. Masking and Effective Frame Selection

To minimize interference from surrounding environmental factors, such as the support stand, background, and temperature, in the collected thermal images, pixel-based mask images were generated [28,29,30,31,32,33]. Threshold-based filtering was applied to isolate the apple region, and its corresponding RGB values were used for analysis (Figure 5). To determine the mask, threshold-based filtering was applied to assign labels to pixel values exceeding a predefined threshold. The threshold for mask generation was determined empirically through preliminary tests, where segmentation performance at thresholds of 10–50% in 10% increments was evaluated. Thresholds at 20% and 40% clearly introduced segmentation errors (either excessive background noise or incomplete apple area), leading to the selection of 30% as optimal for robust and consistent apple segmentation. A threshold set at 30% of the RGB values was used to filter out regions exceeding this threshold, and cumulative labeling was performed to generate the mask. In the initial frame, mask determination was disrupted by high-temperature interference from surrounding objects, such as the support stand, due to repeated experiments. To address this, the mask region in the first frame was converted from 1 to 0. During the masking process from the 2nd to the 120th frame, unnecessary labels were removed to extract a valid mask region. From the second frame onward, a temporary mask was created and accumulated for regions where thermal variations exceeded the threshold. The final mask was generated by including all overlapping labels within the threshold region. To reduce noise, small 0-valued regions within the final mask were converted to 1, eliminating minor noise artifacts. Additionally, the connected components of the final mask were analyzed. Large noise-affected regions identified as 0 were also converted to 1, ensuring that missing regions within the mask were filled, preserving complete image information (Figure 6).
Furthermore, due to manual initiation of heating and recording, slight synchronization discrepancies occurred, causing inter-sample variability in the exact timing of peak temperature. To compensate for this and standardize analytical conditions across samples, frame optimization was empirically conducted, defining the “valid region” as a 69-frame window centered on a uniform peak temperature frame (specifically adjusted to the 35th frame), with 34 frames on each side. This adjustment compensated for minor variations in experimental conditions and ensured that the thermal response region, centered around peak heating, was uniformly captured across all samples.

2.5. Moisture Content Measurement

After thermal imaging, each apple was partially sliced for moisture content measurement. The initial weight (fresh weight) of the sample was measured using a precision scale before drying. The sample was then dried in a 105 °C oven for at least 24 h, after which the dry weight was measured. Moisture content was calculated using Equation (1):
M C = m 1 m 2 m 1 × 100 ,
where M C is moisture content, and m is the mass. The weight measurements before and after drying were repeated at least twice per sample, and the average value was used. To minimize measurement error, consistent slice thickness was maintained for each sample.

2.6. Thermal Diffusivity Data Analysis and Regression Model Development

The pixel values extracted from the masked thermal images were mapped along the time axis for each frame during the heating and cooling phases of the thermal diffusivity curve. To predict moisture content by analyzing thermal diffusivity variations within the masked images, four key indices were calculated: minimum value (lowest temperature), maximum value (highest temperature), mean value (average temperature), and max–min value (temperature difference between the highest and lowest temperatures). These indices were set as independent variables (predictors), and MLR was performed with moisture content (%) as the dependent variable.
The model was trained using the entire dataset, and its generalization performance was evaluated through leave-one-out cross-validation. The cross-validation results were assessed using the coefficient of determination and root mean square error (Equations (2) and (3)).
R C V 2 = 1 i = 1 n ( y i y ^ i ) 2 i = 1 n ( y i y ¯ ) 2
R M S E C V = 1 n i = 1 n ( y i y ^ i ) 2 ,
where y i is the actual moisture content, y ^ i is the moisture content predicted using cross-validation, y ¯ is the mean actual moisture content, and n denotes the number of validation samples.

2.7. Application of AI Models (Supplementary Analysis)

For certain apple varieties, the MLR model exhibited low goodness of fit, suggesting the necessity for an expanded dataset or the incorporation of nonlinear characteristics. To address this, an artificial neural network (ANN) was implemented. The ANN model employed a single hidden layer consisting of 200 neurons with the ReLU activation function. Model training utilized the L-BFGS-B solver, a regularization coefficient (α) of 0.0001, and a maximum of 2000 iterations. The input variables for the ANN model consisted of the previously defined thermal diffusivity indices, while the output variable was moisture content (%). To assess model performance, leave-one-out cross-validation was employed.

3. Results

3.1. Distribution of Apple Moisture Content

The mean moisture content of the 823 apple samples was calculated at 85.21%, with a standard deviation of 2.28 and a coefficient of variation (CV) of 2.67%. CV represents relative variability, expressed as a percentage, calculated by comparing the standard deviation to the mean. Since CV is independent of units, it is particularly useful for comparing variability across different datasets. This result indicates that apple moisture content remains consistently high, providing favorable conditions for identifying temperature response variations associated with moisture content differences in thermal diffusivity analysis (Table 1).

3.2. MLR Model Results

Table 2, Table 3, Table 4 and Table 5 summarize the cross-validation results of the MLR model for each apple variety based on the thermal diffusivity indices (minimum, maximum, mean, and max–min values). While the overall model across all varieties exhibited a low coefficient of determination ( R C V 2 : 0.1–0.14) due to heterogeneity in thermal response, prediction accuracy varied significantly when applied to each variety individually, depending on the selected thermal diffusivity index, as follows:
  • The mean-value-based model consistently yielded the most stable and highest coefficient of determination. For example, the model for ‘Yanggwang’ (Type 4) demonstrated high accuracy in non-destructive moisture content prediction, with R C 2 and R C V 2 values of 0.973 and 0.904, respectively.
  • The minimum-value-based analysis showed R C V 2 exceeding 0.9 for some varieties (e.g., ‘Aori’) but dropped below 0.3 for varieties with high variability in density and appearance (e.g., ‘Arisu’ and ‘Hongro’).
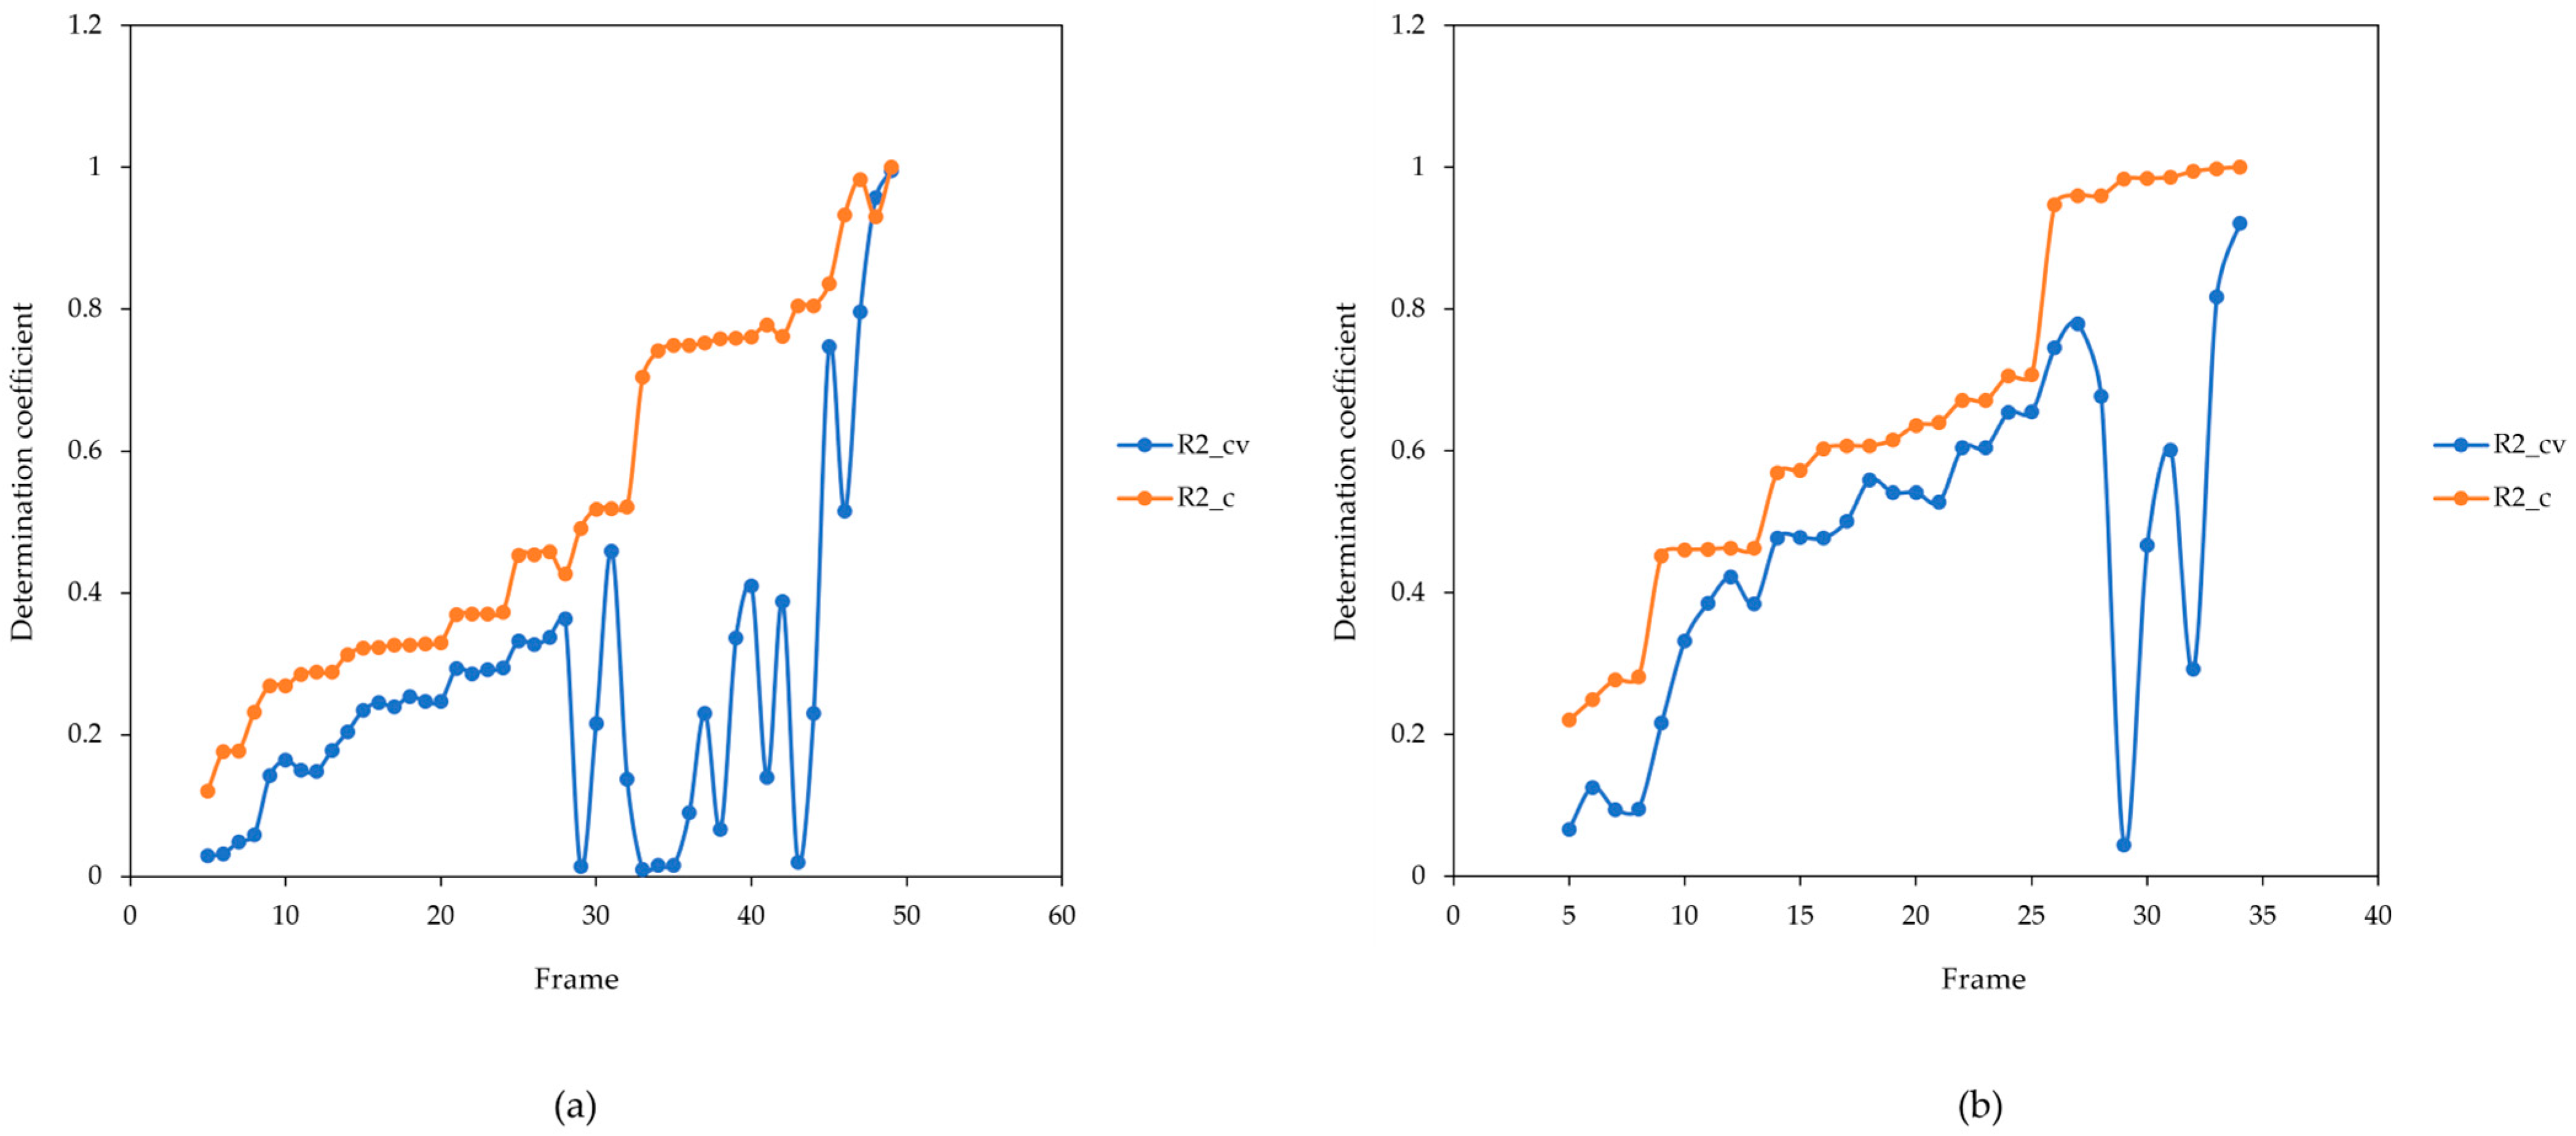
  • The maximum-value-based analysis exhibited underfitting in varieties with small sample sizes (‘Yanggwang’ and ‘Fubrax’), with R C V 2 converging to 1.0. However, after applying frame optimization, the results stabilized within the 0.7–0.9 range.
  • The max–min-value-based analysis effectively captured moisture-related temperature fluctuations in certain varieties but generally exhibited a lower coefficient of determination compared with that of the mean-value-based analysis.
Overall, the mean-value-based model demonstrated the most stable predictive performance. This is likely because mean temperature reflects the overall heat distribution across the apple surface, providing a more holistic representation of thermal diffusivity characteristics. In contrast, extreme values (e.g., minimum and maximum temperatures) may reflect localized thermal anomalies, which can be influenced by slight variations in distance from the heat source or localized surface properties. By averaging thermal responses across the entire apple surface, the mean-value-based model enhances robustness and improves model reliability.

3.3. Frame Optimization and Underfitting Solution

In the initial analysis, ‘Yanggwang’ (Type 4) and ‘Fubrax’ (Type 6) had small sample sizes (50 and 34 samples, respectively), resulting in unrealistic underfitting. To address this, a frame optimization approach was applied by adjusting the number of frames in the heating and cooling phases. The valid frame count was set to 47 for ‘Yanggwang’ and 33 for ‘Fubrax,’ enhancing cross-validation stability. As shown in Figure 7, the prediction accuracy for ‘Yanggwang’ improved significantly ( R C V 2 = 0.904) in the mean-value-based analysis, as did that for ‘Fubrax’ ( R C V 2 = 0.982) in the maximum-value-based analysis.

3.4. Supplementary Analysis Using ANN

For ‘Arisu’ (Type 2) and ‘Hongro’ (Type 3), the MLR model exhibited lower prediction accuracy, presumably due to higher density and greater variability in external appearance, both of which affect heat transfer properties. To address this, mean thermal diffusivity values over observation length (in seconds) were used as input features for an ANN model. As shown in Figure 8, after 21 s, R C V 2 improved significantly to above 0.95. This suggests that once the heat accumulation pattern in apples stabilizes below a certain temperature, differences in thermal diffusivity due to moisture content become more pronounced. Applying ANN increases model complexity, enabling it to learn nonlinear relationships and improving the accuracy of moisture content predictions for varieties where MLR alone struggles to perform reliably.

4. Discussion

The development of non-destructive quality assessment techniques for apples has been recognized as a key strategy to reduce waste in production and distribution stages while enhancing consumer trust. Conventional optical-based techniques, such as NIR spectroscopy and HSI, offer the advantage of directly measuring internal quality parameters (e.g., sugar content, acidity, and moisture content). However, these methods require expensive equipment and complex calibration procedures and are overly sensitive to measurement conditions and surface properties [12]. In contrast, thermal diffusivity-based techniques provide a more practical alternative, as they involve simplified equipment, lower maintenance costs, and reduced sensitivity to surface color or reflectance [21].
The thermal diffusivity phenomics approach proposed in the current study analyzes spatial and temporal temperature distribution changes as the apple surface is heated and subsequently cools naturally, utilizing this information for moisture content prediction. Since high-moisture samples with greater heat capacity absorb and release thermal energy at a slower rate, their thermal responses can be quantified using thermal imaging. Experimental results indicated that the mean-value-based model achieved high prediction accuracy, with R C V 2 exceeding 0.9 across varieties. This performance was comparable or superior to previous NIR-based studies ( R C V 2 ≈ 0.9) [14,15].
Several limitations of this study and corresponding directions for future research have been identified and summarized in the following three aspects:
  • Variability in sample density and external characteristics: The lower prediction accuracy observed in certain varieties (e.g., ‘Hongro’ and ‘Arisu’) may result from differences in physical properties, including flesh density, heat capacity, and internal moisture distribution, all of which directly affect thermal diffusivity. Future studies incorporating explicit measurements of these factors and statistical outlier detection methods (e.g., Grubbs’ test) would further enhance model robustness and predictive reliability.
  • Integration with additional quality indicators: expanding the model to include sugar content, acidity, and firmness would enhance its applicability.
  • Multisensor fusion: combining thermal diffusivity data with NIR spectroscopy, electronic nose technology, and other sensor-based approaches could enable a more comprehensive analysis of fruit quality in future studies.
Despite these limitations, thermal diffusivity phenomics-based moisture content prediction shows strong potential as a cost-effective, simple-to-implement, and relatively robust analytical approach. Among the four thermal diffusivity indices, the mean-value-based model proved to be the most stable across all varieties, while the max–min-value-based model was the most effective for specific varieties. Additionally, incorporating nonlinear models such as ANNs further improved prediction accuracy, highlighting the potential of this approach for enhancing non-destructive apple quality assessment.

5. Conclusions

This study proposed a non-destructive moisture content prediction model for apples using thermal diffusivity phenomics data, specifically thermal imaging recorded during the heating and cooling phases. The actual moisture content of various apple varieties was measured using the dry weight method, and MLR analysis was performed based on thermal diffusivity indices (minimum, maximum, mean, and max–min values). The mean-value-based model provided the most stable and accurate predictions overall. Additionally, the maximum-value-based approach was effective for certain varieties, while incorporating ANNs as a supplementary method improved prediction accuracy by capturing nonlinear thermal relationships.
Thermal diffusivity phenomics presents practical advantages, as it is less affected by surface color and reflectance and requires lower equipment and operational costs. The findings of this study highlight its potential as an alternative method for freshness monitoring and quality enhancement in apple sorting and distribution processes. Future research should integrate additional quality parameters, such as sugar content and firmness. Developing real-time online monitoring systems could also enhance the commercial feasibility of this method. Nevertheless, practical challenges remain, including fruit size variability influencing heat uniformity, synchronization discrepancies due to manual operation. Future research should address these challenges by developing automated measurement systems and real-time environmental compensation techniques.

Author Contributions

Conceptualization, D.-H.L.; methodology, J.-K.L. and M.-K.K.; data curation, J.-K.L. and M.-K.K.; writing—original draft, J.-K.L. and M.-K.K.; writing—review and editing, J.-K.L. and M.-K.K.; supervision, D.-H.L. All authors have read and agreed to the published version of the manuscript.

Funding

This research was supported by the Commercialization Promotion Agency for R&D Outcomes (COMPA) funded by the Ministry of Science and ICT (MSIT) (RS-2024-00425728, IP Enhancement and Commercialization for the Deployment of an AI-Based Screening System of Measuring Moisture and Sugar Content in Agricultural Products).

Institutional Review Board Statement

Not applicable.

Data Availability Statement

The datasets presented in this article are not readily available due to privacy and/or ethical restrictions.

Conflicts of Interest

The authors declare no conflicts of interest.

References

  1. Singh, S.; Reddy, K.S.; Bhowmick, M.K.; Srivastava, A.K.; Kumar, S.; Peramaiyan, P. Accelerating climate adaptation with big data analytics and ICTs. In Advances in Agric-Food Systems; Pathak, H., Lakra, W.S., Gopalakrishnan, A., Bansal, K.C., Eds.; Springer Nature: Singapore, 2025; Volume 1, pp. 179–196. [Google Scholar] [CrossRef]
  2. Bhardwaj, L.K.; Jodder, P.K.; Priya, R.; Rath, P.; Jain, H.; Thakur, S.; Yadav, P.; Purohit, S.; Sharma, B. Resilience in the digital age: Emerging technologies for climate adaptation. In Sustainable Synergy: Harnessing Ecosystems for Climate Resilience; Choudhury, M., Dixit, G., Majumdar, S., Eds.; Springer Nature: Cham, Switzerland, 2025; pp. 165–175. [Google Scholar] [CrossRef]
  3. Xiao, L.; Zhang, Y.; Fu, B. Exploring the moderators and causal process of trust transfer in online-to-offline commerce. J. Bus. Res. 2019, 98, 214–226. [Google Scholar] [CrossRef]
  4. Tong, J. AOD-Net: A lightweight real-time fruit detection algorithm for agricultural automation. J. Food Meas. Charact. 2025, 27, 1–13. [Google Scholar] [CrossRef]
  5. Senka, V.; Aleksandrak, T.H.; Jelena, V.; Zdravko, S.; Aleksandra, G.; Anita, V. Apple. In Valorization of Fruit Processing By-Products; Galanakis, C.M., Ed.; Academic Press: Cambridge, MA, USA, 2020; pp. 17–42. [Google Scholar]
  6. Shalini, R.; Gupta, D.K. Utilization of pomace from apple processing industries: A review. J. Food Sci. Technol. 2010, 47, 365–371. [Google Scholar] [CrossRef]
  7. Péneau, S.; Hoehn, E.; Roth, H.R.; Escher, F.; Nuessli, J. Importance and consumer perception of freshness of apples. Food Qual. Prefer. 2006, 17, 9–19. [Google Scholar] [CrossRef]
  8. Hussein, M.; Silva, A.; Fraser, I. Linking intrinsic quality attributes of agricultural produce to revealed consumer preferences. Food Qual. Prefer. 2015, 41, 180–188. [Google Scholar] [CrossRef]
  9. Fernández-Serrano, P.; Tarancón, P.; Besada, C. Consumer information needs and sensory label design for fresh fruit packaging. An exploratory study in Spain. Foods 2020, 10, 72. [Google Scholar] [CrossRef]
  10. Abasi, S.; Minaei, S.; Jamshidi, B.; Fathi, D. Development of an optical smart portable instrument for fruit quality detection. IEEE Trans. Instrum. Meas. 2021, 70, 1–9. [Google Scholar] [CrossRef]
  11. Guan, Y.; Hua, Z.; Cheng, Y.; He, J.; Zhang, Y.; Guan, J. Monitoring of water content of apple slices using low-field nuclear magnetic resonance during drying process. J. Food Process Eng. 2023, 46, 1–10. [Google Scholar] [CrossRef]
  12. Guo, Z.; Wang, M.; Agyekum, A.A.; Wu, J.; Chen, Q.; Zuo, M.; El-Seedi, H.R.; Tao, F.; Shi, J.; Ouyang, Q.; et al. Quantitative detection of apple watercore and soluble solids content by near infrared transmittance spectroscopy. J. Food Eng. 2020, 279, 109955. [Google Scholar] [CrossRef]
  13. Kheiralipour, K.; Jayas, D. Applications of near infrared hyperspectral imaging in agriculture, natural resources, and food in Iran. In Proceedings of the 15th National Congress and the 1st International Congress of Biosystem Mechanical Engineering and Agricultural Mechanization, Karaj, Iran, 20–22 September 2023. [Google Scholar]
  14. Ma, T.; Xia, Y.; Inagaki, T.; Tsuchikawa, S. Rapid and nondestructive evaluation of soluble solids content (SSC) and firmness in apple using vis–NIR spatially resolved spectroscopy. Postharvest Biol. Technol. 2021, 173, 111417. [Google Scholar] [CrossRef]
  15. Kavuncuoğlu, E.; Çetin, N.; Yildirim, B.; Nadimi, M.; Paliwal, J. Exploration of machine learning algorithms for pH and moisture estimation in apples using VIS-NIR imaging. Appl. Sci. 2023, 13, 8391. [Google Scholar] [CrossRef]
  16. Zude, M.; Herold, B.; Roger, J.M.; Bellon-Maurel, V.; Landahl, S. Non-destructive tests on the prediction of apple fruit flesh firmness and soluble solids content on tree and in shelf life. J. Food Eng. 2006, 77, 254–260. [Google Scholar] [CrossRef]
  17. Li, S.; Chen, Y.; Zhang, X.; Wang, J.; Gao, X.; Jiang, Y.; Chen, C. Back Propagation Neural Network model for analysis of hyperspectral images to predict apple firmness. Food Innov. Adv. 2025, 4, 1–9. [Google Scholar] [CrossRef]
  18. Tran, H.D.T.; Tran, A.T. The modeling of non-invasive measurement of fruit sweetness using near-infrared (NIR) spectroscopy method. J. Phys. Conf. Ser. 2025, 2949, 012024. [Google Scholar] [CrossRef]
  19. Butkeviciute, A.; Viskelis, J.; Viskelis, P.; Liaudanskas, M.; Janulis, V. Changes in the biochemical composition and physicochemical properties of apples stored in controlled atmosphere conditions. Appl. Sci. 2021, 11, 6215. [Google Scholar] [CrossRef]
  20. Tanaka, F.; Hayakawa, F.; Tatsuki, M. Flavor and texture characteristics of ‘Fuji’ and related apple (Malus domestica L.) cultivars, focusing on the rich watercore. Molecules 2020, 25, 1114. [Google Scholar] [CrossRef]
  21. Varith, J.; Hyde, G.M.; Baritelle, A.L.; Fellman, J.K.; Sattabongkot, T. Non-contact bruise detection in apples by thermal imaging. Innov. Food Sci. Emerg. Technol. 2003, 4, 211–218. [Google Scholar] [CrossRef]
  22. Kale, R.S.; Shitole, S. Non-destructive fruit quality assessment: A review on emerging trends in thermal imaging technology. J. Comput. Anal. Appl. 2024, 33, 326–341. [Google Scholar]
  23. Baranowski, P.; Mazurek, W.; Witkowska-Walczak, B.; Sławinski, C. Detection of early apple bruises using pulsed-phase thermography. Postharvest Biol. Technol. 2009, 53, 91–100. [Google Scholar] [CrossRef]
  24. Xu, T.; Wei, Z.; Li, Z.; Xu, X.; Rao, X. Bruise detection of apples based on passive thermal imaging technology. J. Food Meas. Charact. 2024, 18, 9123–9131. [Google Scholar] [CrossRef]
  25. Kwak, D.; Lee, H. Identification for potato plant abiotic stress through thermal-RGB imaging based on deep learning. In Proceedings of the Sensing for Agriculture and Food Quality and Safety XVI, SPIE, Bellingham, WA, USA, 13 June 2024; p. PC1306008. [Google Scholar] [CrossRef]
  26. Tomasz, H.; Beata, B.; Jan, G.; Klaudia, C. The Effect of Pre-Treatment on the Rehydration of Dried Apple Cube. Appl. Sci. 2025, 15, 1377. [Google Scholar] [CrossRef]
  27. Tepe, T.K. Convective drying of golden delicious apple enhancement: Drying characteristics, artificial neural network modeling, chemical and ATR-FTIR analysis of quality parameters. Biomass Convers. Biorefin. 2024, 14, 13513–13531. [Google Scholar] [CrossRef]
  28. Kim, S.H.; Lee, S.-M.; Lee, S.-J. Using the Multiple-Sensor-Based Frost Observation System (MFOS) for Image Object Analysis and Model Prediction Evaluation in an Orchard. Atmosphere 2024, 15, 906. [Google Scholar] [CrossRef]
  29. Yang, L.; Mu, D.; Xu, Z.; Huang, K. Apple Surface Defect Detection Based on Gray Level Co-Occurrence Matrix and Retinex Image Enhancement. Appl. Sci. 2023, 13, 12481. [Google Scholar] [CrossRef]
  30. Shurygin, B.; Smirnov, I.; Chilikin, A.; Khort, D.; Kutyrev, A.; Zhukovskaya, S.; Solovchenko, A. Mutual Augmentation of Spectral Sensing and Machine Learning for Non-Invasive Detection of Apple Fruit Damages. Horticulturae 2022, 8, 1111. [Google Scholar] [CrossRef]
  31. Agarla, M.; Napoletano, P.; Schettini, R. Quasi Real-Time Apple Defect Segmentation Using Deep Learning. Sensors 2023, 23, 7893. [Google Scholar] [CrossRef]
  32. Giménez-Gallego, J.; González-Teruel, J.D.; Blaya-Ros, P.J.; Toledo-Moreo, A.B.; Domingo-Miguel, R.; Torres-Sánchez, R. Automatic Crop Canopy Temperature Measurement Using a Low-Cost Image-Based Thermal Sensor: Application in a Pomegranate Orchard under a Permanent Shade Net House. Sensors 2023, 23, 2915. [Google Scholar] [CrossRef]
  33. Stasenko, N.; Shukhratov, I.; Savinov, M.; Shadrin, D.; Somov, A. Deep Learning in Precision Agriculture: Artificially Generated VNIR Images Segmentation for Early Postharvest Decay Prediction in Apples. Entropy 2023, 25, 987. [Google Scholar] [CrossRef]
Figure 1. Schematic diagram of experimental design.
Agriculture 15 00869 g001
Figure 2. Measurement method. (a) Thermal diffusion phenomics acquisition method. (b) Thermal diffusion experiment.
Agriculture 15 00869 g002
Figure 3. Color map conversion process in the infrared range. (a) Grayscale conversion. (b) Feature detection. (c) RGB color conversion.
Agriculture 15 00869 g003
Figure 4. Thermal level characteristics and visualization. (a) Thermal level at max segmented label. (b) Temperature variations at center horizon. (c) Temporal variations of mean and maximum temperature. (d) 50, 70, 90% higher area variations of temperature.
Agriculture 15 00869 g004
Figure 5. Flow chart of mask detection process.
Agriculture 15 00869 g005
Figure 6. Mask label changes according to thermal changes. (a) Thermal image. (b) Mask per frame.
Agriculture 15 00869 g006
Figure 7. R2C and R2CV changes over observation length. (a) Type 4 (n = 50). (b) Type 6 (n = 34).
Agriculture 15 00869 g007
Figure 8. R2 change over observation length (s) in the artificial neural network model. (a) Type 2 (‘Arisu’). (b) Type 3 (‘Hongro’). Red arrows indicate the point where R2 stabilizes.
Agriculture 15 00869 g008
Table 1. Moisture content distribution for each apple type; “All” indicates the combined dataset of all samples. Types 1 to 7 correspond to the following apple cultivars: Aori, Arisu, Hongro, Yanggwang, Myanmar, Fubrax, and Fuji, respectively.
TypeAverage MCSTDCV
All85.172.282.67%
184.525.076.00%
284.871.441.69%
385.591.872.17%
486.151.011.17%
585.551.501.76%
684.421.762.09%
783.521.591.91%
Table 2. Results of minimum value-based MLR analysis.
TypeR2CR2CVRMSECRMSECV
All0.1350.1202.1152.134
10.9860.9150.5971.467
20.2920.3001.2051.199
30.3070.3141.5501.550
41.0001.0000.0000.000
50.6960.6940.9240.828
61.0001.0000.0000.000
70.8280.5850.6571.021
RMSE, root mean square error
Table 3. Results of maximum value-based MLR analysis.
TypeR2CR2CVRMSECRMSECV
All0.1360.1192.1142.135
10.9760.5940.7823.207
20.2970.3171.4421.184
30.3370.2731.5161.588
41.0001.0000.0000.000
50.7370.5950.7670.952
61.0001.0000.0000.000
70.8470.6820.6200.894
RMSE, root mean square error.
Table 4. Results of mean value-based MLR analysis.
TypeR2CR2CVRMSECRMSECV
All0.1010.0722.1572.192
10.9970.9270.2601.358
20.3070.2691.1921.225
30.2630.2111.5981.654
41.0001.0000.0000.000
50.7010.6040.8180.942
61.0001.0000.0000.000
70.9000.7810.5020.742
RMSE, root mean square error.
Table 5. Results of max–min value-based MLR analysis.
TypeR2CR2CVRMSECRMSECV
All0.1400.1062.1092.151
10.7970.2500.7328.214
20.2670.2701.2261.224
30.3650.3501.4831.501
41.0001.0000.0000.000
50.6500.5670.8860.984
61.0001.0000.0000.000
70.8930.9200.5180.449
RMSE, root mean square error.
Disclaimer/Publisher’s Note: The statements, opinions and data contained in all publications are solely those of the individual author(s) and contributor(s) and not of MDPI and/or the editor(s). MDPI and/or the editor(s) disclaim responsibility for any injury to people or property resulting from any ideas, methods, instructions or products referred to in the content.

