Abstract
Innovation is central to the Zero Hunger agenda, yet its distributional links to agricultural performance and policy in Eastern Europe remain unclear. This study investigates whether national innovation performance, proxied by the Global Innovation Index, is associated with agriculture’s macroeconomic weight and with public budget orientation in Bulgaria, Czechia, Hungary, Poland, Romania, and Slovakia across the past decade and a half. Using panel quantile regression with country fixed effects and bootstrapped standard errors, we estimate effects at the lower, median, and upper parts of the outcome distributions for three indicators: agriculture value added share of gross domestic product, the agriculture orientation index for government expenditures, and the agriculture share of government expenditure. Results show a robust negative association between innovation and the agricultural share of gross domestic product that strengthens toward the upper quantiles, consistent with structural transformation that reallocates value added toward higher-productivity sectors. For the orientation index, innovation is unrelated at the lower and median parts but becomes positive in mid–upper regimes, fading again at the extreme upper tail. No systematic relationship emerges for the budget share. Land endowment is positively associated with agricultural weight, while population size is negatively associated. We conclude that economy-wide innovation aligns with structural change, whereas shifting agricultural budget shares requires targeted, sector-specific policy instruments.
1. Introduction
Global agriculture stands at a crossroads where productivity, resilience, and sustainability must converge to ensure food security for a growing population. Despite decades of progress, the global community remains far from achieving Sustainable Development Goal 2 (SDG 2)—“Zero Hunger”—which calls for ending hunger, achieving food security, and promoting sustainable agriculture [1]. Recent disruptions such as climate change, geopolitical conflicts, and the COVID-19 pandemic have exposed the vulnerability of food systems and slowed down progress toward this goal [2,3]. As agricultural systems face increasing uncertainty, innovation has emerged as a crucial lever for transforming traditional models of production and governance into resilient, knowledge-based, and resource-efficient systems [4].
Innovation in agriculture encompasses technological, organizational, and institutional changes that improve productivity and environmental performance while maintaining economic viability [5]. Beyond introducing new technologies, it represents the broader capacity of societies to generate, diffuse, and apply knowledge to the agricultural sector. Empirical studies show that innovation can enhance resource efficiency, reduce waste, and accelerate the transition toward low-carbon and climate-smart practices [6,7]. Moreover, innovation acts as a catalyst for structural transformation, helping economies move from input-intensive to knowledge-intensive agriculture, while maintaining the sector’s contribution to food security [8].
However, progress has been uneven across regions. Advanced economies have rapidly integrated digital technologies, biotechnology, and precision farming tools, while developing and transition economies often lag behind due to limited access to finance, weak R&D systems, and fragmented governance [9]. In Eastern European countries, the agricultural sector continues to navigate the legacies of transition—fragmented land ownership, limited innovation ecosystems, and fluctuating public support [10]. These countries, despite being major food producers within the European Union, often display contrasting paths in terms of innovation adoption, rural modernization, and policy orientation toward sustainable agriculture. Institutional fragmentation is reflected in the weak coordination of national CAP innovation measures and the uneven uptake of EIP-AGRI operational groups across Member States [11,12]. These institutional asymmetries limit policy coherence and constrain the translation of innovation potential into agricultural modernization and sustainable development.
Understanding how innovation influences the sustainability and performance of agriculture within these economies is both timely and policy relevant. In the context of the European Green Deal and the Common Agricultural Policy (CAP) 2023–2027, innovation is identified as a cornerstone for improving productivity, biodiversity, and climate resilience [13]. Yet, the translation of innovation potential into tangible agricultural outcomes remains underexplored, particularly for post-transition economies where structural and institutional challenges persist [14].
A growing body of research explores the interconnection between innovation and agricultural development, focusing on technological adoption, green productivity, or digitalization [15,16]. These studies generally confirm that innovation positively influences productivity and sustainability but rarely account for distributional heterogeneity—the idea that innovation may affect low-performing and high-performing agricultural systems differently. Conventional econometric approaches, such as mean-based regression, often overlook this heterogeneity and mask critical policy insights [17]. Thus, a more nuanced approach is needed to capture the varying intensity of innovation’s influence across different performance levels.
The present study contributes to this literature by focusing on the heterogeneous impact of innovation on agricultural sustainability across Eastern European Union countries. Unlike traditional analyses that focus on average effects, this research employs quantile regression on a balanced panel spanning 2010–2023 to investigate how the relationship between innovation and agricultural outcomes differs across countries with distinct performance profiles. This method allows for a deeper understanding of whether innovation primarily benefits lagging agricultural systems—by boosting efficiency and productivity—or reinforces advantages in already developed and well-financed sectors.
From a policy perspective, exploring this relationship is essential. If innovation predominantly benefits countries or regions with stronger institutional frameworks, it may exacerbate existing disparities within the European Union, challenging the principle of cohesion. Conversely, if innovation yields greater marginal benefits in less advanced agricultural systems, it could serve as a tool for convergence and resilience. Identifying these dynamics provides valuable insights for designing targeted innovation policies aligned with SDG 2 and the EU’s broader sustainability objectives.
In addition to its methodological contribution, this research offers a regional and temporal perspective that remains scarce in the literature. While numerous global studies assess the drivers of sustainable agriculture, few focus specifically on post-socialist EU member states, where agricultural modernization interacts with innovation systems still in development [18]. By covering more than a decade of data, this study captures both the pre- and post-pandemic evolution of innovation systems and their agricultural implications—a period marked by increasing digital transformation and the acceleration of sustainability agendas across Europe [19].
The originality of this study lies in three main aspects. First, it integrates the concept of innovation as a systemic driver of agricultural sustainability, linking national innovation capacity with the performance of agricultural systems under the SDG 2 framework. Second, it applies a distribution-sensitive econometric approach (quantile panel regression) to reveal the non-linear and asymmetric effects of innovation across countries at different development levels. Third, it focuses on a region often overlooked in global sustainability debates—Eastern European countries—where both agricultural transition and innovation diffusion are still ongoing. Together, these features enable a more comprehensive understanding of how innovation can be leveraged to strengthen the agricultural dimension of sustainable development.
2. Literature Review
A large and fast-growing literature argues that agricultural sustainability in the twenty-first century will hinge on how quickly farming systems internalize innovation across technologies, institutions, and value chains. The innovation canvas is purposely broad: it spans digital and data-driven tools, biotechnologies and nanomaterials, circular-economy solutions, microbiome-based inputs, mission-oriented policy frameworks, and new research–farmer interfaces.
Digitalization is frequently portrayed as the backbone of “Agriculture 4.0,” where connected devices, analytics and automation steer decisions from field to fork. Reviews of the Internet of Things (IoT), big data and AI in agri-food detail how sensor networks, greenhouse monitoring, intelligent machinery and drone imaging enable traceability, quality control and risk management at scale [2,3,20]. Broader “Agriculture 4.0” perspectives warn, however, that technology pathways can exclude certain actors unless they are embedded in responsible innovation processes that anticipate distributional effects and remain adaptive to mission-oriented sustainability goals [21]. Precision-agriculture surveys emphasize the promise—and the bottlenecks—around data governance, interoperability, adoption costs and workforce skills [22]. In policy discourse, leading international bodies still frame digital agriculture primarily through a productivity lens, often assuming automatic spillovers to food security; ecosystem-services scholars urge evaluations that also capture regulatory and cultural services and the trade-offs digitalization can generate [23].
Overall, the reviewed literature indicates that innovation domains differ in their relative contribution to agricultural sustainability. Digital and data-driven technologies primarily enhance resource-use efficiency and information precision, thereby improving productivity and input optimization. Biotechnological and microbiome-based innovations contribute to long-term resilience by improving stress tolerance, soil health, and biodiversity outcomes. In parallel, circular-economy and material innovations (such as bioplastics, wastewater nutrient recovery, and bio-based fertilizers) play a decisive role in closing resource loops and reducing environmental externalities. Together, these technological pathways reinforce the systemic dimension of sustainability—where productivity, ecological balance, and policy coordination converge—thus providing the conceptual foundation for the empirical analysis that follows.
At farm level, uptake is far from automatic. EU evidence shows “smart farming technologies” adoption is higher among larger arable farms; many adopters remain ambivalent after first-hand experience, while non-adopters cite availability, relevance and impartial advice as barriers [24]. Extension and advisory systems have themselves transformed—toward pluralistic, networked models that blend public and private financing and leverage ICTs and farmer groups for diffusion [25]. On-Farm Experimentation (OFE) reframes research as co-creation in real management settings, with digital tools enabling experimentation at new scale and complexity [26]. A socio-cyber-physical framework further clarifies conditions for a responsible digital transformation in agriculture—ensuring access to technologies while navigating system complexity and clarifying accountability for outcomes [27]. Media/policy narratives in high-income contexts often celebrate a “fourth agricultural revolution,” prioritizing productivity/environmental benefits and paying less attention to social consequences; qualitative evidence suggests both benefits and negative externalities, calling for more balanced policy appraisals [28]. Technically, privacy-preserving learning techniques (e.g., local differential privacy for deep learning) are increasingly relevant for sensitive agricultural data streams [29], and supply-chain studies show how IoT–blockchain architectures plus advanced deep learning models can support provenance, digitalization and smart contracts in food systems [30].
Remote sensing has become the workhorse of field-scale phenotyping and variable-rate management. Reviews of multispectral/hyperspectral imaging and data fusion (including LiDAR) chart how crop status can be quantified accurately for prescriptive management and even plant-component monitoring, while also cataloging method strengths, drawbacks and use-case fit [31]. Drone (UAV) platforms have moved from mapping to spraying and targeted interventions, increasingly coupled with AI pipelines for detection and decision support [32]. At the automation frontier, the environmental footprint of industrial robots is coming into view; cross-country evidence suggests robot adoption can lower carbon intensity through productivity and factor-mix channels, with heterogeneous effects across sectors and country groups [33]. Smart-city literature—relevant to peri-urban agriculture—surveys IoT/edge/fog architectures and deep learning for urban services that intersect with food, logistics and environmental monitoring [34].
Biotechnology and plant science continue to deliver step-changes in sustainability traits. A landmark demonstration of hybrid potato via genome design illustrates how breaking linkage drag and managing deleterious mutations can accelerate gains in yield uniformity and resilience [35]. Reviews on climate–stress interactions in forestry underscore how compound biotic–abiotic stresses are becoming more frequent with climate change, elevating the importance of research- and innovation-driven mitigation strategies transferable to perennial agriculture [36]. In staple crops and irrigated drylands, meta-analysis shows that conservation-agriculture components—zero tillage with residue retention—raise yields, water-use efficiency and profits while reducing the global-warming potential, though effects are system- and soil-specific [37]. Field/system modeling in salt-affected drylands indicates conservation-agriculture plus optimized water/nitrogen strategies can mitigate salinity and improve multiple sustainability indicators, with system-specific patterns between rice-wheat and cotton-wheat rotations [38]. While most empirical and experimental advances in biotechnology originate from Western European and global research hubs, their applicability to Eastern European agriculture is gradually increasing through EU-supported innovation programs and cross-border research partnerships. However, the pace of adoption remains limited due to structural constraints—such as small and fragmented farm holdings, lower private R&D investment, and uneven biosafety regulations. Regional evidence suggests that progress is most visible in biofortified cereals, microbiome-based soil amendments, and conservation-agriculture trials co-financed under CAP innovation measures. These developments illustrate both the opportunities and the institutional gaps that shape biotechnology integration in the region’s agricultural sustainability trajectory. Farmer-behavior work, extending the Theory of Planned Behavior, finds knowledge and perceived climate risks among the strongest determinants of conservation-agriculture intention, highlighting the leverage of extension and risk communication [39,40,41].
Plant–soil microbiomes are increasingly positioned as core levers of sustainable intensification. Reviews document how microbiome diversity and network structure regulate nutrient cycling, pathogen suppression and growth promotion; translating this into biological products requires integrating host genotype, agronomic practices and environmental modulators [42]. Holistic, microbiome-based approaches replace single-microbe inoculants with consortia tuned to functional diversity and nutrient flux through plant–soil systems [41]. Beyond cereals, microbiome science has matured methodologically, opening avenues from diagnostics to engineered interventions across ecology and agriculture [42]. Biofortification potential via Fe/Zn-solubilizing microbes and rhizosphere engineering is receiving focused attention [43]. In the broader bioeconomy, advanced biorefineries are central to valorizing agricultural, forestry and aquaculture biomass; emerging priorities include non-carbohydrate streams (proteins, lignin), on-site enzyme production, and data-driven integration for environmental and economic feasibility [44]. Circular-economy plastics are another frontier: bio-based PHAs produced from diverse renewable feedstocks are being scaled for applications from packaging to agriculture, framed explicitly as a response to fossil-based externalities [45].
Nanotechnology has diffused across industrial domains, including agriculture and food, with claims of productivity, safety and functional gains [46]. Sector-specific assessments cover nanofood, nanosensors, nanopackaging, nanofertilizers and nanopesticides, highlighting opportunities (e.g., preservation, controlled release) and the need for rigorous risk/benefit analysis [47]. Regulatory science is catching up: harmonized definitions, testing guidelines and databases are still evolving, while micro-/nanoplastics trigger new toxicology and environmental-behavior questions. In parallel, policy perspectives on primary microplastics and substitutes emphasize measurable, enforceable restrictions and the careful design of incentives to spur safer materials [48]. At product interface, polysaccharide hydrogels illustrate how bio-based materials can serve as carriers, barriers and functional ingredients across food, pharma and agriculture [49]. The broader plastic footprint of agriculture is now a mainstream concern; proposals range from rational use and recovery to biodegradable substitutes and phasing out hazardous additives, with explicit links to negotiations under a UN plastics treaty framework [50]. Despite their promising applications, nanotechnologies in agriculture and food systems also raise important concerns regarding safety, regulation, and long-term environmental behavior. The European Chemicals Agency (ECHA) and the European Food Safety Authority (EFSA) both have noted gaps in testing standards and harmonized risk assessment protocols for nanoform substances used in fertilizers and packaging. These uncertainties underline the need for balanced governance approaches that combine innovation incentives with precautionary oversight, ensuring that nanotechnology adoption aligns with sustainability and consumer-safety objectives [51,52].
Resource-recovery analytics show that municipal wastewater contains water, nutrients (N, P, K) and energy that—if recovered—can meet a meaningful share of agricultural demand and household electricity, while reducing eutrophication and moving systems toward net-zero processes [53]. Bibliometric mapping of agricultural waste research reveals a decades-long shift toward circularity and bioeconomy narratives, driven by policy realignments and technological innovation [54]. At the same time, urban agriculture and food-access innovations during the pandemic highlighted how sociopolitical barriers—racism, infrastructure gaps—shape outcomes; community-centered strategies can better align food justice with green infrastructure [55].
Innovation is not only about artifacts; it is equally about systems, missions and directionality. A mission-oriented lens on agricultural innovation systems (AIS) maps how forces and networks catalyze or block food-system transformation, asking researchers to reflect on how digital agriculture, agroecology, vertical farming or protein transitions align with societal missions [56]. Three tenets—people, production, planet—are offered to guide responsible intensification, supported by multi-actor co-innovation to ensure social sustainability is co-equal with productivity and environmental goals [57]. In China, Agriculture Green Development frames an economy-wide strategy to shift from resource-intensive to high-efficiency, low-impact systems via interdisciplinary innovation and whole-chain improvements—lessons relevant to other transitioning economies [51]. Industrial-organization and political-economy work cautions that chemical-dependent weed management (e.g., glyphosate) can become locked-in through interlocking technological, market and regulatory dynamics, underscoring the need for diverse non-chemical pathways [58].
Systematic arguments for pesticide-free paradigms identify five integrated strategies—from redesigning cropping systems to biocontrol business models and machinery goals—that demand coupled innovations and interdisciplinary projects [59]. Reviews of technology adoption under uncertainty parse how learning dynamics shape farm decisions and welfare distribution between producers and consumers [60]. Empirical analyses also connect financial inclusion and gender gaps to agricultural performance and sustainable development outcomes, advocating digital finance and gender-responsive instruments to unlock smallholder potential [61]. In rural development, e-commerce can catalyze industry restructuring and non-farm employment, altering land–labor allocations and accelerating rural revitalization [62]. A complementary systems view proposes a rural innovation system with technology, institutional/management and community-platform pillars to address urban–rural disparities and anti-poverty goals [63]. In South Africa, adoption and intensity of climate-change adaptation strategies are strongly influenced by education, extension access, training, and ICT-enabled information flows—clear levers for policy [64]. These findings offer valuable parallels for Central and Eastern European countries, where structural and institutional constraints similarly limit adaptive capacity. Strengthening vocational training, digital advisory systems, and innovation-extension linkages across CEE agriculture could thus yield comparable sustainability gains, aligning with the EU’s CAP modernization agenda.
Energy transitions in agriculture are spatial as well as technological. Provincial panel analyses for China suggest agricultural industrial agglomeration can raise agricultural energy efficiency, with policy implications for functional zoning and farm-scale innovation diffusion [65]. Upstream, small-satellite constellations promise near-daily imagery at low cost, multiplying applications for agriculture, forestry and disaster response [66]. At the sensing–diagnostics interface, lateral-flow immunoassays (LFIA) exemplify low-cost, point-of-care platforms with growing roles in veterinary and agricultural biosecurity [67]. Protease biotechnology—scaled through omics and protein engineering—expands sustainable options in food processing, waste management and animal husbandry [68]. At the frontier of green and Industry 4.0 convergence, food-system reviews map how AI, big data, smart sensors, robotics and blockchain can pair with greener processing to deliver environmental, economic and social gains; yet uptake remains uneven [69]. Looking ahead, space-enabled and data-centric “smart agriculture” in developing regions is framed as essential for closing productivity gaps by 2030 [51].
Sustainable land-use transitions—from China’s Loess Plateau ecological restoration to national urban-agglomeration planning—illustrate the institutional and multi-level coordination required to align economic development with ecosystem protection and SDGs [70,71]. Soil health is repeatedly identified as a linchpin that interlinks multiple SDGs, from poverty and nutrition to water, energy, climate and life on land; achieving targets entails managing physical, chemical and biological processes and scaling initiatives such as “4 per 1000” [72]. At the input frontier, algal biofertilizers and nanofortified mineral delivery systems are explored as nutrient-efficient alternatives with potential in soilless cultivation and bio-based circularity [73]. Vegetation-index-based phenotyping, UAVs and spectral tools close the loop by supplying the diagnostics needed for responsive management and breeding [74]. Finally, cross-cutting concerns about agricultural plastics—use, recovery, biodegradable options and hazardous additives—are synthesized with concrete policy proposals for monitoring, incentives and education [31].
Beyond farms, innovation propagates through supply chains. Advanced biorefineries aim to valorize all biomass components and integrate on-site enzyme production with data analytics to make circular bioeconomy plants environmentally and economically viable [31]. In emerging economies, blockchain adoption in agricultural supply chains is influenced by green/lean practices, integration, risk, regulatory support and innovation capability; adoption, in turn, improves sustainable performance. More generally, AI’s contribution to SDGs is visible through poverty-mapping, finance inclusion and logistics—touchpoints with rural livelihoods and agri-education in developing contexts [75].
Across these streams, three messages recur. First, innovation’s sustainability dividend is conditional: technologies must be embedded in mission-oriented, socially inclusive pathways, supported by advisory systems, responsible governance and fair data practices. Second, biological levers—from microbiomes to conservation agriculture and genome design—offer scalable gains in resource efficiency and resilience when coupled to diagnostics and remote sensing. Third, circularity and material innovations—wastewater nutrient recovery, bioplastics/PHAs, biodegradable alternatives, and bio-based hydrogels—can decouple output growth from environmental pressure if regulation and markets co-evolve. Together, this evidence base motivates research that examines not only whether innovation correlates with sustainable agricultural outcomes, but how and where its marginal effects are strongest across the performance distribution—precisely the question addressed empirically in this paper.
Beyond a catalog of technological advances, the literature collectively suggests that agricultural innovation operates through distinct causal mechanisms that integrate knowledge creation, policy design, and institutional coordination. The performance of agricultural systems depends not only on technological diffusion but also on how innovation systems align research, governance, and stakeholder incentives. Empirical studies [11,12,76] show that weak policy coherence and fragmented institutional frameworks can limit the impact of innovation on sustainability outcomes. Within the European Union, the Common Agricultural Policy’s innovation pillar and the European Innovation Partnership for Agricultural Productivity and Sustainability (EIP-AGRI) exemplify multi-actor approaches that integrate science, advisory systems, and governance mechanisms. These findings reinforce the view that systemic and institutional innovations are as critical as technological ones for achieving SDG 2 and enhancing agricultural resilience.
Accordingly, this study positions innovation not merely as a technological factor but as a systemic process shaped by policy instruments, research networks, and institutional capacity. This theoretical alignment provides the foundation for the empirical investigation that follows, linking national innovation performance to agricultural sustainability outcomes across Eastern European countries.
3. Materials and Methods
3.1. Data Description
The empirical analysis relies on a balanced panel dataset covering six Eastern European countries—Bulgaria, Czech Republic, Hungary, Poland, Romania, and Slovakia—over the period 2010–2023. These countries share similar structural and historical characteristics, including their transition from centrally planned to market economies, integration into the European Union, and exposure to common agricultural and innovation policies. The panel covers the period 2010–2023, allowing for comparison between the pre-pandemic years (2010–2019) and the post-pandemic years (2020–2023). Given the limited number of observations in the latter period, no explicit COVID-19 dummy variable was introduced in the model. Instead, potential structural changes linked to the pandemic are indirectly captured by country fixed effects and the use of bootstrapped standard errors, which account for cross-period heterogeneity in the distributional estimates. Data were collected from internationally recognized and harmonized sources to ensure cross-country comparability and temporal consistency. The time coverage of fourteen consecutive years allows for a robust assessment of medium-term dynamics and structural trends. All variables, presented in Table 1, are expressed in annual terms and drawn from official international databases, including the United Nations SDG Indicators Database, the World Bank’s World Development Indicators (WDI), and the World Intellectual Property Organization (WIPO). The resulting panel supports the application of advanced econometric methods, including quantile regression analysis.

Table 1.
Description of variables and data sources used in the empirical model.
The study uses three dependent variables representing key indicators of SDG 2: Zero Hunger, which collectively captures the performance and policy orientation of the agricultural sector. First, the Agriculture Value Added Share of GDP (AVAS_GDP) measures the relative contribution of agriculture to national economic output, expressed as a percentage of gross domestic product. This indicator reflects the structural importance of agriculture within the overall economy and its evolution over time. Second, the Agriculture Share of Government Expenditure (ASGE) quantifies the proportion of total public spending allocated to agriculture, thereby indicating the degree of fiscal support and government prioritization of the sector. Third, the Agriculture Orientation Index for Government Expenditures (AOIG) represents the ratio between the agricultural share in government expenditure and the agricultural share in GDP. This index captures how strongly a country’s fiscal policy is oriented toward agriculture relative to its economic weight, offering an integrated measure of budgetary alignment and policy intent.
The main explanatory variable is the Global Innovation Index (GII), published annually by the World Intellectual Property Organization (WIPO). The GII provides a comprehensive measure of a country’s innovation performance based on multiple dimensions, including human capital, research infrastructure, knowledge creation, technology diffusion, and business sophistication. It is expressed on a 0–100 scale, where higher scores indicate stronger national innovation systems and a greater capacity to generate, absorb, and apply new knowledge.
To account for structural and macroeconomic differences across countries, three control variables are included. The first, GDP per capita growth (annual %), reflects the pace of economic expansion and captures the influence of overall macroeconomic performance on agricultural outcomes. The second, Population (millions of inhabitants), controls for market size and demographic pressure, which can shape both production capacity and policy decisions. The third, Agricultural land (% of total land area), represents the share of arable and permanent cropland in each country’s territory and serves as a proxy for natural resource endowment and agricultural potential.
It is important to note that ratio-based indicators such as the Agriculture Value Added Share of GDP or the Agriculture Share of Government Expenditure are interpreted in this study as markers of structural transformation, not as direct proxies of sectoral well-being. A decline in the agricultural GDP share, for example, may reflect a shift toward higher-productivity sectors rather than a deterioration of sustainability. The econometric framework accounts for this distinction by including GDP growth and land endowment as control variables, thereby isolating the structural component of innovation effects.
3.2. Methodological Process
This study employs a panel quantile regression (PQR) framework to examine how innovation performance influences agricultural sustainability across six Central and Eastern European countries—Bulgaria, Czech Republic, Hungary, Poland, Romania, and Slovakia—over the period 2010–2023. Unlike traditional mean-based estimators such as Ordinary Least Squares (OLS), quantile regression (QR), initially introduced by Koenker and Bassett [80], allows the estimation of conditional relationships at different points of the distribution of the dependent variable. This approach is particularly suitable when the relationship between innovation and agricultural outcomes is heterogeneous across countries or over time, and when error terms are non-normally distributed or heteroskedastic.
The use of quantile regression is theoretically motivated by the non-linear and asymmetric nature of the innovation–agriculture nexus. Innovation may exert stronger effects in countries with higher levels of agricultural efficiency or policy orientation (upper quantiles), while weaker or insignificant effects might appear in lower-performing economies (lower quantiles). By focusing on different quantiles (for instance, τ = 0.10, 0.20,…), the analysis captures such distributional dynamics, offering a more comprehensive picture than conventional mean regressions.
The traditional probability distribution function of a set of n observations on a random variable Y is:
where = 1, if is true or otherwise.
The quantile associated with this probability distribution function is given by:
where ρτ represents the check function which weights positive and negative values asymmetrically.
This formulation is extended by the quantile regression equation to allow for regressors X as follows:
where β(τ) is the vector of coefficients associated with the τ-th quantile.
Therefore, the equation for the conditional quantile regression estimator takes the following form:
In order to use quantile regression equation, normality, cross-section dependence and heteroscedasticity tests are made to the linear regression equation. The results of these tests are presented below.
Given the moderate sample size and the panel nature of the data, fixed effects quantile regression (FEQR) was applied to control for unobserved heterogeneity across countries that may influence both innovation capacity and agricultural outcomes, such as institutional quality or agricultural policies. This estimator, developed by Koenker [81], enables the separation of country-specific effects from the distributional analysis of the dependent variables. To verify robustness, results were compared with pooled OLS and fixed-effects mean regression models [82].
The analysis was conducted in EViews 12, which supports quantile panel regressions through iterative weighted least squares algorithms. For each dependent variable, the regression was estimated at τ = 0.10, 0.20,…, 0.90 representing the lower, median, and upper levels of agricultural sustainability performance. The coefficients were interpreted as conditional quantile effects, showing how changes in innovation performance (GII) influence the agricultural sector differently across its distribution.
The choice of panel quantile regression is particularly suitable for this dataset because it accounts for distributional heterogeneity across countries and performance levels. The descriptive statistics revealed non-normality and heteroskedasticity, conditions under which mean-based estimators such as OLS may provide biased or incomplete results. Quantile regression, combined with country fixed effects and bootstrapped errors, therefore offers a robust way to capture the asymmetric influence of innovation on agricultural sustainability indicators.
Finally, several diagnostic tests were implemented. The Breusch–Pagan test [83] confirmed the presence of heteroskedasticity, reinforcing the appropriateness of QR methods. Serial correlation was examined through the Wooldridge test [79] for autocorrelation, while cross-sectional dependence was tested using Pesaran’s CD test, ensuring model reliability [84,85,86,87]. Bootstrapped standard errors with 1000 replications were computed to enhance inference accuracy [88,89].
Although the panel quantile regression framework effectively captures distributional heterogeneity, future research could extend this approach by integrating instrumental-variable or common-correlated-effects quantile models to further assess robustness to endogeneity and cross-sectional dependence. Such extensions would provide complementary insights into the structural mechanisms that underpin the innovation–agriculture nexus in post-transition economies.
Based on the literature reviewed and the structural characteristics of Eastern European agriculture, the study advances the following hypothesis: H1: The impact of national innovation performance on agricultural sustainability indicators is heterogeneous across the performance distribution—being stronger and more positive in higher-performing agricultural systems that possess greater institutional capacity, absorptive ability, and policy coherence, while weaker or statistically insignificant in lower-performing systems constrained by resource and governance limitations.
4. Results
Before proceeding to the regression estimation, we provide a concise overview of the dataset prior to estimation. Table 2 reports descriptive statistics for the study variables over a balanced panel of six Eastern European countries (Bulgaria, Czech Republic, Hungary, Poland, Romania, Slovakia) from 2010 to 2023. The dependent variables—AVAS_GDP, ASGE, and AOIG—summarize the sector’s macroeconomic weight and budgetary prioritization under the SDG 2 framework. The main explanatory variable is the Global Innovation Index (GII), while GDP per capita growth (GDP), population in logs (lnPOP), and agricultural land (% of land area, AGRLAND) serve as controls. All variables are annual and harmonized across countries to ensure comparability. We report central tendency, dispersion, and shape (skewness, kurtosis), alongside the Jarque–Bera normality test, to diagnose non-normality, outliers, and heterogeneity that motivate our panel quantile regression approach and the use of fixed effects with bootstrapped standard errors in the subsequent analysis.
Table 2.
Descriptive statistics of the variables.
The descriptive evidence portrays an agricultural sector that is modest in macroeconomic weight yet marked by nontrivial cross-country and intertemporal heterogeneity. On average, agriculture accounts for 3.21% of GDP (median 3.12%), with values ranging from 1.54% to 5.95%, indicating that—despite structural convergence in the region—there remains meaningful dispersion in sectoral relevance. Public support to agriculture is comparatively lower: the share of government expenditure averages 1.78% (median 1.56%; range 0.54–4.57%), a gap that helps explain why the Agriculture Orientation Index (AOIG)—the ratio of the budget share to the GDP share—averages 0.62 (median 0.43). An AOIG below unity in central tendency signals that, for most country-years, budgetary prioritization lags the sector’s economic weight, with a few high-orientation episodes (maximum 2.46) pulling the mean upward.
Innovation performance is relatively stable across the panel. The GII centers around 41.29 (out of 100), with a moderate spread (32.20–51.32) and near-symmetric shape (skewness 0.32). This suggests that any distributional differences uncovered later by the quantile regressions will more likely reflect heterogeneity in agricultural outcomes and policy choices rather than extreme swings in innovation inputs themselves. Demography, captured by lnPOP, exhibits the expected inertia (mean 16.29, sd 0.66), consistent with gradual population dynamics in the six CEE economies. By contrast, GDP per capita growth is volatile (mean 2.88%, sd. 2.84%, range –5.53% to 8.82%), reflecting the cyclical environment and episodic shocks over 2010–2023 that can propagate into agriculture via demand, prices, and fiscal space. The share of agricultural land is high by international standards (mean 49.05%, range 38.00–61.53%), confirming substantial natural endowments even where agriculture’s GDP weight is modest.
Distributional diagnostics reinforce the case for moving beyond mean-based inference. AOIG is strongly right-skewed (skewness 1.87) and leptokurtic (kurtosis 6.30), with the Jarque–Bera test decisively rejecting normality (p ≈ 0.0000). ASGE also deviates from normal (p = 0.0148), while lnPOP shows mild non-normality (p = 0.0218), consistent with its bounded, policy-driven trajectory. In contrast, GII does not reject normality (p = 0.4311), and AVAS_GDP is close to symmetric with a non-rejected JB at the 5% level (p = 0.1076). GDP growth and AGRLAND are borderline at conventional thresholds (p ≈ 0.0967 and p ≈ 0.0603), suggesting potential tail behavior without severe departures. Taken together, these patterns—skewness, heavy tails for AOIG, and heterogeneous dispersion across variables—justify the use of quantile regression to map the conditional relationship between innovation and agricultural outcomes across the entire distribution, rather than at the mean alone.
Substantively, three messages stand out. First, the combination of low ASGE and AOIG below one in central tendency suggests that budgetary commitment to agriculture typically trails the sector’s macroeconomic footprint. This may attenuate the transmission of innovation capacity into measurable sectoral outcomes where fiscal co-financing and public goods (research, extension, infrastructure) are complementary to private adoption. Second, the wide AOIG and ASGE ranges (with occasional spikes) imply episodic policy pushes—potentially linked to specific reforms, shocks, or EU programming cycles—that create fertile ground for heterogeneous marginal effects of innovation along the distribution of outcomes; quantile estimates are precisely suited to detect whether innovation pays off more in “high-orientation” regimes. Third, the volatility of GDP growth introduces macro-cyclical noise that can either amplify or dampen innovation’s effect, especially in upper quantiles where better-performing agricultural systems might leverage cyclical upswings more effectively.
Figure 1 illustrates the evolution and dispersion of key variables across the six Eastern European countries during 2010–2023. The patterns confirm a relatively modest but persistent contribution of agriculture to GDP (AVAS_GDP), fluctuating between 2% and 6%, and a generally declining trend in agricultural expenditure shares (ASGE). The Agricultural Orientation Index (AOIG) mirrors these fluctuations, displaying sporadic peaks in specific years—often associated with programming cycles or policy realignments under the Common Agricultural Policy (CAP). These oscillations highlight the non-linear and context-dependent nature of agricultural policy commitment in the region.
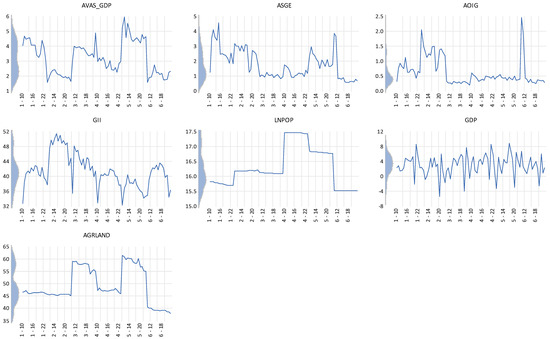
Figure 1.
Trends in agricultural and innovation indicators.
The Global Innovation Index (GII) shows moderate interannual variability, indicating stable yet uneven innovation performance among the analyzed countries. Demographic stability (lnPOP) contrasts with the pronounced cyclical nature of GDP growth, which alternates between contraction and expansion phases. The share of agricultural land (AGRLAND) reveals a slow but consistent reduction in most countries, suggesting structural change in land-use patterns. Overall, the descriptive evidence underscores heterogeneity in agricultural and innovation dynamics—precisely the motivation for employing a quantile regression framework capable of capturing distributional effects beyond the mean.
Table 3 reports three standard diagnostics for cross-section dependence (CD) in panel regression residuals—Breusch–Pagan LM, Pesaran scaled LM, and Pesaran CD—under the null of no cross-section correlation. Non-zero cross-section means were detected and removed prior to correlation computation; hence, any remaining significance reflects genuine residual co-movement rather than mean shifts.
Table 3.
Residual Cross-Section Dependence Test.
For the first model (where AVAS_GDP is the dependent variable), all tests reject the null decisively (Breusch–Pagan LM = 43.8642, df = 15, p = 0.0001; Pesaran scaled LM = 5.2698, p = 0.0000; Pesaran CD = 5.9578, p = 0.0000). This points to pervasive residual co-movements across countries after conditioning on covariates and fixed effects. Economically, such dependence is consistent with common shocks (e.g., commodity prices, regional weather anomalies), EU-wide policy cycles, or other omitted common factors that jointly affect agricultural value added in the CEE economies over 2010–2023. For AOIG as dependent variable, cross-section dependence is even more pronounced (Breusch–Pagan LM = 55.8353, df = 15, p < 0.0001; Pesaran scaled LM = 7.4554, p = 0.0000; Pesaran CD = 4.8343, p = 0.0000). Given the right-skewed distribution of AOIG documented in the descriptive statistics, these results suggest that budget-orientation dynamics are influenced by shared fiscal or regulatory impulses (e.g., multiannual programming, conditionalities, or synchronized CAP reforms), leading to positively correlated residuals across countries. For ASGE, the pattern persists (Breusch–Pagan LM = 37.2657, df = 15, p = 0.0012; Pesaran scaled LM = 4.0651, p = 0.0000; Pesaran CD = 3.5581, p = 0.0004). Although the LM statistic is somewhat smaller than for AOIG, all three diagnostics still reject the null, indicating systematic co-movement in the agriculture budget share that is not fully absorbed by controls.
The presence of CD implies that naïve standard errors can be downward biased, inflating significance if cross-section correlation is ignored. In our quantile-regression context, two concrete mitigations are warranted and feasible in EViews: (i) include time fixed effects (year dummies) alongside country fixed effects to absorb common shocks; and (ii) use clustered/bootstrapped standard errors tailored to the panel structure (e.g., block bootstrap by year and/or by country, ≥1000 replications). As an additional robustness layer, we will report mean-regression counterparts with Driscoll–Kraay standard errors (robust to CD) to confirm the sign and order of magnitude of core coefficients. Where possible, we will also experiment with a common-correlated-effects (CCE) proxy—adding cross-section averages of the dependent and key regressors—to approximate latent common factors within the quantile framework.
Jointly, these diagnostics confirm that agriculture outcomes and policy orientation in the CEE region are shaped by shared regional forces. Methodologically, this strengthens the case for our panel quantile approach augmented with time effects and robust inference; substantively, it anticipates distribution-dependent impacts of innovation (GII) that interact with common shocks—an issue we address explicitly in the next section through cross-quantile comparisons and robustness checks.
The likelihood-ratio diagnostics for cross-section heteroskedasticity, presented in Table 4, point unambiguously to groupwise variance in the residuals across countries. For the specification with AVAS_GDP, the LR statistic is 29.2819 (df = 6; p = 0.0001), rising sharply to 123.2737 for AOIG (df = 6; p < 0.0001) and remaining large at 61.3056 for ASGE (df = 6; p < 0.0001). In each case, the unrestricted log-likelihood—allowing country-specific residual variances—improves materially over the restricted version (AVAS_GDP: −66.7080 vs. −81.3490; AOIG: 16.3019 vs. −45.3349; ASGE: −85.2647 vs. −115.9176), confirming that residual dispersion differs systematically across cross-sections rather than reflecting pure sampling noise. Substantively, this pattern is consistent with the region’s heterogeneous exposure to agro-climatic shocks, commodity–price cycles and policy rhythms (e.g., multiannual programming), which can generate unequal volatility regimes in agricultural outcomes (AVAS_GDP) and, even more so, in budgetary orientation (AOIG) and agriculture’s budget share (ASGE).
Table 4.
Panel Cross-section Heteroskedasticity LR Test.
From an econometric standpoint, ignoring such heteroskedasticity risks downward-biased standard errors and spurious significance. Our strategy addresses this on two fronts. First, the core estimations rely on panel quantile regression, which is intrinsically robust to general forms of heteroskedasticity by minimizing the check loss rather than squared residuals; inference is based on bootstrapped standard errors (≥1000 replications) aligned to the panel structure. Second, for mean-regression benchmarks, we report fixed-effects models with heteroskedasticity-robust covariances (e.g., White cross-section, and Driscoll–Kraay in robustness) to verify that signs and orders of magnitude are not artifacts of variance misspecification. Taken together with the previously documented cross-section dependence, these LR results reinforce the case for distribution-sensitive methods with robust inference: they ensure that the heterogeneity we attribute to innovation’s effects across the outcome distribution is not confounded by unmodeled variance heterogeneity across countries.
The panel quantile regressions results reveal a clear separation between outcome (AVAS_GDP) effects and policy-orientation (AOIG, ASGE) effects of innovation, as shown in Table 5. For AVAS_GDP, the coefficient on GII is negative and highly significant (–0.083; p < 0.001), indicating that higher national innovation performance is associated with a lower agricultural share in GDP, conditional on controls. Economically, a 10-point increase in GII correlates with a ≈0.83 pp decline in AVAS_GDP, which is sizeable given the sample mean of 3.21%. This is consistent with structural transformation: innovation tends to expand higher–value added sectors outside primary agriculture, reducing agriculture’s share even if agricultural value added can still grow in levels. The land endowment proxy is strongly positive (AGRLAND = 0.119; p < 0.001): a 10 pp increase in agricultural land share is associated with ≈1.19 pp higher AVAS_GDP, underlining the first-order role of resource endowments in shaping agriculture’s macro footprint. lnPOP is negative and significant (–0.328; p = 0.023), suggesting that larger populations are linked to smaller agricultural shares—plausibly through urbanization and diversification effects. GDP growth is positive but not significant (p = 0.332). Overall fit is high for a quantile model (Pseudo-R2 ≈ 0.51; adjusted ≈ 0.49), indicating that the covariates explain a meaningful portion of the conditional median (or reported τ) variation in AVAS_GDP.
Table 5.
Panel Quantile regression results.
By contrast, at the same quantile, innovation does not display a systematic association with budget orientation. For AOIG, the GII slope is small and statistically insignificant (0.017; p = 0.332), and so are lnPOP, GDP, and AGRLAND. The very low Pseudo-R2 (≈0.045) and negative adjusted value point to limited explanatory power at this quantile: budget orientation appears dominated by factors not captured here (e.g., multiannual programming cycles, EU conditionalities, political cycles, or common shocks previously evidenced by strong cross-section dependence). Given AOIG’s heavy right tail in the descriptive diagnostics, it is plausible that innovation effects—if any—manifest in the upper part of the distribution; the absence of effects at the reported quantile should therefore not be read as evidence of neutrality across all regimes. This motivates reporting and discussing higher quantiles (e.g., τ = 0.75/0.90) in robustness.
For ASGE, the pattern echoes AOIG with one notable exception. GII remains statistically null (0.010; p = 0.846), as do lnPOP and GDP, but AGRLAND is positive and significant (0.050; p = 0.028). Substantively, countries with greater agricultural land shares tend to allocate marginally larger budget shares to agriculture (a 10 pp rise in AGRLAND associates with ≈0.50 pp higher ASGE), even though general innovation capacity does not shift that share at the reported quantile. The Pseudo-R2 is low (≈0.021), consistent with substantial residual variation in year-to-year budget shares—again in line with the earlier evidence of heteroskedasticity and cross-section co-movement.
Taken together, these results suggest that general innovation (GII) correlates strongly with the structure of the economy (AVAS_GDP) but not with budgetary prioritization (AOIG, ASGE) at the reported quantile. The negative association with AVAS_GDP reflects the canonical reallocation out of primary sectors as innovation rises, while the non-results for AOIG/ASGE imply that innovation alone does not reorient the public budget toward agriculture. Instead, land endowments show consistent, intuitive effects (raising agriculture’s GDP share and budget share), highlighting that resource structure remains a key driver of agricultural weight and fiscal commitment.
Two implications follow for the subsequent analysis. First, distribution matters: given AOIG’s skewness and the previously documented cross-section dependence, upper-quantile estimates are essential to test whether innovation effects emerge only in high-orientation regimes, where complementary policies and institutional capacity may unlock budget responses. Second, policy inferences should distinguish between economy-wide innovation capacity (GII) and agriculture-specific instruments (e.g., agri-R&D, extension, targeted CAP measures): the former is associated with structural transformation, whereas the latter are more likely to influence ASGE and AOIG. Accordingly, the next subsection reports a quantile profile of the GII slope across τ (including upper tails) and robustness with time effects and bootstrap inference, to validate whether these patterns persist beyond the reported quantile.
Table 6 reports the quantile-process estimates for the coefficient on GII obtained from panel quantile regressions of AVAS_GDP, AOIG, and ASGE evaluated at τ = 0.10, 0.20, …, 0.90. For each outcome and quantile, the table displays the estimated slope and its p-value, based on the same baseline specification used earlier (country fixed effects and the controls lnPOP, GDP growth, AGRLAND). p-values are computed from bootstrapped standard errors (1000 replications). Coefficients are interpreted as the marginal change in the τ-th conditional quantile of the dependent variable associated with a one-point increase in GII, holding other covariates constant. By tracing the GII slope across quantiles, Table 6 reveals whether the innovation–agriculture relationship is concentrated in the lower, median, or upper parts of the outcome distributions, thereby complementing the single-quantile (baseline) results with a full distributional profile.
Table 6.
Quantile Process Estimates for the explanatory variable GII.
For AVAS_GDP, the quantile profile confirms and sharpens the baseline finding of a negative association at the median (τ = 0.50: −0.0835, p < 0.001). The GII coefficient is small and insignificant at the lower tail (τ = 0.10: −0.0272, p = 0.231), but becomes negative and significant from τ = 0.20 onward (τ = 0.20: −0.0606, p = 0.0008; τ = 0.30: −0.0749, p < 0.001; τ = 0.40: −0.0799, p < 0.001). Importantly, the magnitude intensifies toward the upper tail, reaching −0.1026 (p < 0.001) at τ = 0.80 and −0.1512 (p = 0.0001) at τ = 0.90. Economically, a 10-point increase in GII correlates with roughly −0.61 pp in AVAS_GDP at τ = 0.20 and up to −1.51 pp at τ = 0.90, which is sizable relative to the sample mean (3.21%). This distributional gradient is consistent with structural transformation: stronger national innovation capacity is associated with a faster reallocation of value added toward non-primary, higher–value sectors, an effect that is weak at the bottom of the distribution but strong and increasing where agriculture already occupies a larger GDP share.
For AOIG, the baseline median estimate was statistically null (τ = 0.50: 0.0173, p = 0.332). The quantile process reveals no association in the lower half (τ = 0.10–0.40: coefficients between −0.0040 and 0.0022; all p > 0.69) and no effect at the median, but a positive and statistically significant association in the mid–upper range: τ = 0.60: 0.0391 (p = 0.015), τ = 0.70: 0.0448 (p = 0.004), τ = 0.80: 0.0382 (p = 0.018). The effect then vanishes at the extreme upper tail (τ = 0.90: 0.0031, p = 0.910). These dynamics suggest that higher innovation performance is associated with stronger budget orientation toward agriculture only in mid-high AOIG regimes—contexts where policy prioritization is already meaningful and innovation likely complements capable institutions and established planning processes. At the very top of the distribution, the loss of significance may reflect policy saturation/ceilings, multiannual allocation constraints, or small-sample uncertainty in the extreme tail.
For ASGE, the GII coefficient is statistically insignificant at all quantiles, with signs fluctuating but p-values consistently large (e.g., τ = 0.20: −0.0205, p = 0.572; τ = 0.60: 0.0574, p = 0.312; τ = 0.80: −0.0122, p = 0.739; τ = 0.90: −0.0089, p = 0.769). Taken together with the AOIG profile, this pattern is informative: where AOIG rises in the mid–upper quantiles, it likely does so not because governments raise the budget share for agriculture (ASGE), but rather because the denominator of AOIG—agriculture’s share in GDP—declines as innovation increases (as shown by the increasingly negative AVAS_GDP slopes). In other words, innovation can be associated with a higher relative budget orientation without a commensurate increase in the absolute budget share for agriculture.
Overall, the quantile processes indicate heterogeneous and regime-dependent effects of innovation. First, the negative AVAS_GDP slope that steepens with τ corroborates a distribution-sensitive structural shift out of agriculture: the reallocation is strongest where the sector’s macroeconomic weight is initially high. Second, AOIG’s positive association emerging only at τ = 0.60–0.80 points to complementarity between innovation capacity and policy orientation in intermediate-to-high regimes; yet, the absence of any systematic effect on ASGE implies that this “orientation” improvement is achieved without broad increases in the agriculture budget share. From a policy perspective, this disconnect suggests that if the objective is to protect or raise agriculture’s budget in absolute terms while innovation reconfigures the economy, sector-specific instruments (agri-R&D, extension, innovation adoption incentives, targeted CAP measures) will be more effective than relying on general innovation capacity alone. Conversely, in countries/years located at the lower quantiles, where we find negligible links between GII and both AOIG and ASGE, policy makers may need to build foundational capacity (implementation quality, co-financing, administrative capability) before innovation gains can translate into discernible changes in agricultural policy orientation.
5. Discussions
The results presented above are further interpreted in the context of existing theoretical and empirical research. This discussion aims to link the distributional patterns identified through the quantile regression to broader debates on innovation-driven agricultural transformation and sustainability. By comparing these findings with previous studies in both advanced and transition economies, I highlight how innovation capacity contributes differently across institutional and performance contexts in the pursuit of the Zero Hunger (SDG 2) objectives.
Our distributional evidence portrays a differentiated innovation–agriculture nexus in six CEE economies, one that cannot be captured by mean-based estimators alone. The increasingly negative slope of the Global Innovation Index (GII) for the agricultural value-added share of GDP (AVAS_GDP) toward the upper tail indicates that where agriculture still weighs heavily in GDP, marginal gains in national innovation capacity align with larger declines in agriculture’s macro share. This is a hallmark of structural transformation: productivity differentials across sectors and faster factor reallocation shift value added toward higher-productivity industry and services as innovation ecosystems deepen [4,5,8,18]. In this sense, our results are consistent with the broader innovation-and-growth narrative in Europe and with the CEE transition experience documented in policy reviews and diagnostics [3,5,10]. The implication is not that innovation “hurts agriculture,” but that it reshapes relative shares. With appropriate sectoral policy, agricultural levels (yields, total factor productivity) and incomes can still rise even as the macro share declines [4,5,18].
Turning to policy orientation, the quantile process shows that GII is unrelated to the Agriculture Orientation Index (AOIG) at the bottom and median, but becomes positive and statistically significant in mid–upper regimes before fading again at the extreme top. A natural interpretation is absorptive capacity: where budget institutions, planning routines, and evidence systems are solid, broader innovation capacity is more likely to be recognized and translated into sectoral prioritization. In CEE, this often means effective programming under the CAP, credible medium-term budget frameworks, and integration of digital tools and data into expenditure decisions [3,9,13]. This framing resonates with the literature on mission-oriented and responsible innovation in agri-food systems, which emphasizes that the benefits of digitalization and AI are contingent on governance quality, stakeholder inclusion, and program coherence [21,23,27,29,56,57]. Conversely, in low-orientation contexts, weak administrative capability and fragmented advisory systems can mute the transmission from economy-wide innovation to agricultural prioritization—consistent with the flat GII–AOIG relationship at lower quantiles [3,10,25].
The absence of a systematic GII effect on ASGE (the agriculture share of total government expenditure) across the distribution is particularly informative about channels. By definition, AOIG is a ratio of ASGE to agriculture’s GDP share; thus, AOIG can rise even if ASGE is flat when the denominator (AVAS_GDP) falls through structural transformation—precisely what we observe [1,76]. This helps reconcile our findings with extensive evidence that public investments in agricultural R&D, extension, and knowledge systems yield high social returns and are normatively desirable [3,5,14,25]. Our estimates suggest that general innovation performance is not the binding lever for raising the agriculture budget share; rather, sector-specific decisions and institutions determine ASGE. Hence, to protect or lift ASGE during structural change, governments need targeted instruments—public agri-R&D lines, advisory and digital knowledge systems, risk and climate services—embedded in CAP-consistent, mission-oriented packages [3,13,56,57].
From an innovation systems perspective, the observed heterogeneity across quantiles reflects differences in the structural and institutional capacity of national innovation systems. The Global Innovation Index encompasses not only technological outcomes but also the governance quality, research infrastructure, and policy coordination mechanisms that shape innovation diffusion within agriculture. This implies that countries with stronger institutional linkages between research, policy, and practice are better positioned to translate innovation capacity into sustainable agricultural performance and coherent budgetary orientation.
In practical terms, the results point toward the need for targeted use of CAP 2023–2027 instruments to translate innovation potential into measurable sustainability outcomes. The Eco-schemes offer a direct mechanism to reward farmers who adopt environmentally beneficial practices such as precision nutrient management, biodiversity-friendly rotations, or low-emission technologies—all areas where innovation effects were found to be most significant in higher-performing systems. In parallel, the Agricultural Knowledge and Innovation Systems (AKIS) framework can enhance knowledge transfer and institutional cooperation between research bodies, advisory services, and farmers, addressing the systemic gaps identified in lower-performing countries. Integrating these instruments more coherently at national level would help bridge innovation disparities and advance the sustainability goals of the region under the SDG 2 framework.
Several common shocks—commodity prices, regional weather anomalies, EU programming cycles—likely contribute to the strong cross-section dependence and groupwise heteroskedasticity we document. This co-movement suggests that national choices are partly shaped by EU-wide and market-wide signals, reinforcing the case for stabilization devices that preserve agricultural missions across the cycle (e.g., contingency lines, countercyclical buffers) and for EU-level knowledge infrastructures that diffuse innovation benefits more evenly across member states [3,10,11]. The heteroskedastic residuals point to unequal volatility regimes—some countries experiencing more lumpy policy adjustments or more variable outcomes—underscoring the need to tailor support intensity, sequencing, and risk management to country-specific volatility patterns.
Our evidence also dovetails with studies documenting heterogeneous adoption of digital and precision technologies. Studies across Europe find clear adoption gradients by farm size, production system, and capability, with mixed perceptions and sometimes uncertain cost–benefit ratios [22,24]. Without impartial advisory, robust data governance, and peer learning networks, diffusion can stall or become regressive, reinforcing performance gaps [21,25,27,28]. This helps explain why a fiscal “echo” of innovation (higher AOIG) appears only in mid–upper regimes where institutions already function reasonably well. Strengthening AKIS (Agricultural Knowledge and Innovation Systems), investing in digital public goods and interoperable data platforms, and expanding on-farm experimentation are pragmatic steps to translate general innovation capacity into broad-based sectoral benefits [9,21,25,26].
At the same time, parts of the literature would predict positive links between innovation and agricultural budgeting—where governments crowd in public agri-R&D, bioeconomy programs, or climate-smart agriculture to meet sustainability goals [1,14,15,16]. Our null ASGE–GII profile does not contradict these studies; it indicates that economy-wide innovation metrics are too coarse to proxy sectoral budget decisions, which hinge on fiscal rules, CAP co-financing envelopes, political priorities, and revenue cycles not fully captured here [10,13]. Hence, policy should separate the levers: use GII-type investments to drive overall modernization and competitiveness, while dedicated agricultural instruments shape ASGE and safeguard rural resilience [3,13,25].
Sustainability and the European Green Deal add another layer. Pathways like conservation agriculture, water-smart rotations in saline or drylands, and soil-health innovations show robust agronomic and environmental benefits, but they require predictable funding and advisory capacity to scale [37,38,72]. Microbiome-based inputs and bio-based solutions offer promise yet depend on R&D pipelines and regulatory clarity [40,41,42,43,44]. Digital and sensing innovations—from hyperspectral crop monitoring and UAV phenotyping to supply-chain traceability via blockchain—can raise efficiency and transparency, but they also entail data protection and interoperability challenges that must be managed to earn trust and ensure equitable access [29,30,31,32,74]. In the CEE context, aligning these toolkits with CAP eco-schemes and national innovation priorities can yield coherent missions that are fiscally defensible and socially legitimate [9,13].
We also acknowledge contradictory or cautionary findings. Concerns about technological “lock-ins,” corporate concentration, or input-path dependencies—e.g., in weed management—suggest that not all innovation pathways are socially optimal without deliberate governance [58]. Calls for pesticide-free transition strategies emphasize systemic co-innovation and social sustainability, reminding that productivity and environmental aims must be matched by people-centered design [57,59]. These perspectives reinforce our inference that institutions matter: where governance is strong, innovation is more likely to produce balanced outcomes across productivity, environment, and inclusion—precisely the regimes where our AOIG response is most visible [21,56,57].
From a practical standpoint, three operational steps follow for CEE authorities. Diagnose the regime: if a country-year sits at high AVAS_GDP quantiles, prioritize measures that lift farm productivity and facilitate diversification along value chains while acknowledging that the macro share will likely fall with rising innovation [4,5,18]. If AOIG is already mid–high, leverage the observed complementarity by pairing innovation investments (digital public goods, experimentation networks) with budget-execution quality to lock in durable orientation gains—without expecting an automatic rise in ASGE [13,21,25,26]. In low-orientation settings, first build foundational capability (program budgeting, co-financing management, impartial advisory, data governance) before expecting general innovation to shift fiscal priorities [3,10,25]. Across the board, protect inclusion by easing SMEs’ access to precision tools, skills, and fair data arrangements [21,24,29].
The observed distributional effects confirm that innovation can serve as an indirect driver of the Zero Hunger (SDG 2) goal by enabling structural transformation that raises productivity and stabilizes food systems. In higher-performing agricultural regimes, innovation aligns with fiscal and institutional mechanisms that sustain food security, while in lower-performing contexts, innovation capacity remains a prerequisite for achieving equitable progress toward hunger reduction.
6. Conclusions
Using a balanced panel and panel quantile regression, we document a distribution-dependent innovation–agriculture nexus. Higher national innovation performance (GII) is associated with a smaller agricultural value-added share of GDP (AVAS_GDP), with the magnitude increasing toward the upper quantiles of the outcome distribution. In contrast, the agriculture orientation index (AOIG) shows no association at the lower tail and median, but a positive and significant link in mid–upper quantiles (≈0.60–0.80), while the agriculture budget share (ASGE) is not systematically related to GII at any quantile. Land endowment consistently raises AVAS_GDP (and, modestly, ASGE), whereas larger populations are associated with smaller AVAS_GDP. Together with strong evidence of heteroskedasticity and cross-section dependence, these results justify a distributional approach and caution against mean-only inference. These findings reinforce the relevance of innovation policy for the Zero Hunger agenda, demonstrating that progress toward SDG 2 depends not only on increased agricultural output but also on how effectively innovation systems translate knowledge, technology, and governance improvements into sustainable food security outcomes.
Overall, the results underscore that fostering innovation is not only an economic imperative but also a social and environmental one. By enhancing productivity, improving resource efficiency, and aligning fiscal priorities with sustainability goals, innovation directly supports the Zero Hunger (SDG 2) agenda. In the context of the European Green Deal and the CAP 2023–2027, strengthening innovation systems in Eastern Europe can accelerate progress toward sustainable food systems, reduce rural disparities, and ensure long-term food security.
Innovation policy will likely accelerate structural transformation, shifting value added toward higher-productivity non-primary sectors and thereby reducing agriculture’s macro share, especially where that share is already high. Success should therefore be judged by productivity, resilience, and rural incomes, not by preserving the sector’s GDP share. If the goal is to sustain or lift agriculture’s fiscal priority, economy-wide innovation capacity is insufficient on its own: AOIG improves with GII only where institutional capacity is already stronger, and ASGE remains unresponsive. Governments should pair national innovation strategies with sector-targeted instruments—public agri-R&D, extension and digital advisory, risk and climate services, and well-designed CAP measures—while strengthening absorptive capacity in ministries (planning, M&E, evidence use, data governance) so that innovation gains translate into credible, medium-term agricultural commitments.
Practitioners should first diagnose their position in the distribution (recent AVAS_GDP, AOIG, ASGE) and calibrate interventions accordingly. High-AVAS_GDP contexts should emphasize on-farm productivity upgrading and diversification (value-chain upgrading, skills, finance), acknowledging that the macro share will tend to fall as innovation rises. Where AOIG is already mid–high, leverage the revealed complementarity by coupling innovation investments (digital public goods, experimentation networks) with budget-execution quality to secure durable orientation gains—without expecting an automatic rise in ASGE. In low-orientation settings, build foundational capacities (program budgeting, co-financing management, impartial advisory) before relying on innovation to shift fiscal priorities; in parallel, protect inclusion by easing SME farms’ access to precision tools, data, and skills so innovation does not widen performance gaps.
While the present analysis captures the innovation–sustainability nexus using a parsimonious set of SDG 2 indicators, I acknowledge that a broader range of variables—such as agricultural R&D intensity, green innovation indicators (e.g., patent activity), digital-agriculture adoption, and farm-level income or productivity measures—could offer a more complete representation of agricultural sustainability. These aspects will be pursued in future research, as comparable longitudinal data become available for the analyzed countries.
A further limitation concerns the potential endogeneity and bidirectionality between innovation and agricultural performance. While the present analysis treats national innovation capacity as an exogenous driver of agricultural outcomes, it is plausible that productive agricultural sectors also reinforce innovation through feedback mechanisms such as R&D demand, technology adoption, and policy support. As such, the estimated coefficients should be interpreted as conditional associations rather than strict causal effects. Future studies could address this limitation by applying instrumental-variable quantile regression or dynamic panel estimators (e.g., GMM) to control for reverse causality and omitted-variable bias.
Funding
This research received no external funding.
Institutional Review Board Statement
Not applicable.
Data Availability Statement
The original contributions presented in this study are included in the article. Further inquiries can be directed to the corresponding author.
Conflicts of Interest
The author declares no conflicts of interest.
References
- United Nations. Sustainable Development Goals Report 2023: Special Edition; United Nations: New York, NY, USA, 2023. [Google Scholar]
- Food and Agriculture Organization (FAO). The State of Food and Agriculture 2022: Leveraging Automation in Agriculture for Transforming Agrifood Systems; FAO: Rome, Italy, 2022. [Google Scholar]
- Organisation for Economic Co-operation and Development (OECD). Agricultural Innovation Systems: Fostering Innovation to Strengthen Food Security and Sustainability; OECD Publishing: Paris, France, 2023. [Google Scholar]
- World Bank. World Development Report 2024: Development in a Time of Technological Transformation; World Bank: Washington, DC, USA, 2024. [Google Scholar]
- OECD. Innovation, Productivity and Sustainability in Food and Agriculture: Main Findings from Country Reviews; OECD Publishing: Paris, France, 2022. [Google Scholar]
- FAO. Innovation in Family Farming: From Research to Market; FAO: Rome, Italy, 2021. [Google Scholar]
- Khanna, M.; Li, X. Technology Adoption, Green Innovation, and Sustainable Agriculture. J. Clean. Prod. 2023, 406, 136983. [Google Scholar]
- World Intellectual Property Organization (WIPO). Global Innovation Index 2023: Innovation in the Face of Uncertainty; WIPO: Geneva, Switzerland, 2023. [Google Scholar]
- European Commission. Digitalisation and Innovation in Agriculture: The European Approach; European Commission: Brussels, Belgium, 2023. [Google Scholar]
- OECD. Policies for the Transition to Sustainable Food Systems: Country Reports from Central and Eastern Europe; OECD Publishing: Paris, France, 2021. [Google Scholar]
- OECD. Agricultural Innovation Systems: Fostering Stronger Agricultural Innovation and Productivity Growth; OECD Publishing: Paris, France, 2021. [Google Scholar]
- European Court of Auditors (ECA). Special Report No. 21/2022—CAP and Innovation: Weak Coordination and Insufficient Targeting of Funding Limit Results; Publications Office of the European Union: Luxembourg, 2022. [Google Scholar]
- European Commission. The European Green Deal and the Common Agricultural Policy (CAP) 2023–2027: A New Framework for Sustainability; European Commission: Brussels, Belgium, 2020. [Google Scholar]
- Popescu, G.; Dinu, M. Innovation, Competitiveness, and Sustainable Agriculture in the European Union. Sustainability 2022, 14, 10834. [Google Scholar]
- Li, T.; Zhang, S.; Yang, J. Agricultural Innovation, Digitalization, and Sustainable Productivity Growth: Evidence from European Union Countries. Agriculture 2022, 12, 1906. [Google Scholar]
- Zhang, Y.; Wang, L.; Zhao, P. Technological Innovation and Agricultural Sustainability: Evidence from Cross-Country Data. Agronomy 2023, 13, 965. [Google Scholar]
- Koenker, R. Quantile Regression for Longitudinal and Panel Data. J. Econom. 2021, 225, 62–79. [Google Scholar]
- Csáki, C.; Jámbor, A. Agricultural Transformation and Policy Challenges in Central and Eastern Europe: Thirty Years after Transition. Stud. Agric. Econ. 2023, 125, 1–12. [Google Scholar]
- FAO. The State of Food Security and Nutrition in the World 2023: Urbanization, Agrifood Systems Transformation, and Healthy Diets across the Rural–Urban Continuum; FAO: Rome, Italy, 2023. [Google Scholar]
- IEEE Internet of Things Journal. Internet of Things in Agriculture: Applications and Challenges. IEEE Internet Things J. 2022, 9, 1234–1258. [Google Scholar]
- Klerkx, L.; Rose, D. Dealing with the Game-Changing Technologies of Digitalisation and AI: How Agri-Food Research Systems Can Transform. Glob. Food Secur. 2020, 24, 100347. [Google Scholar] [CrossRef]
- Wolfert, S.; Ge, L.; Verdouw, C. Precision Agriculture in the Era of Big Data: Challenges and Opportunities. Agriculture 2023, 13, 1023. [Google Scholar]
- Mastrangelo, M.E.; Weyland, F.; Herrera, L.P.; Villarino, S.H.; Barral, M.P.; Auer, A.D. Ecosystem services research in contrasting socio-ecological contexts of Argentina: Critical assessment and future directions. Ecosyst. Serv. 2015, 16, 63–73. [Google Scholar] [CrossRef]
- Barnes, A.P.; Soto, I.; Eory, V.; Beck, B.; Balafoutis, A.T.; Sánchez, B.; Vangeyte, J.; Fountas, S.; van der Wal, T.; Gómez-Barbero, M. Exploring the Adoption of Precision Agricultural Technologies: A Cross-Regional Study of EU Farmers. Land Use Policy 2019, 80, 163–174. [Google Scholar] [CrossRef]
- Faure, G.; Knierim, A.; Koutsouris, A.; Ndah, H.T.; Audouin, S.; Zarokosta, E.; Wielinga, E.; Heanue, K. How to Strengthen Innovation Support Services in Agriculture with Regard to Multi-Stakeholder Approaches. J. Innov. Econ. Manag. 2019, 28, 145–169. [Google Scholar] [CrossRef]
- Bramley, R.; Taylor, J. On-Farm Experimentation for Digital Agriculture. Nat. Food 2022, 3, 488–496. [Google Scholar]
- Eastwood, C.; Ayre, M.; Nettle, R. Socio-Cyber-Physical Systems for Responsible Digital Transformation in Agriculture. J. Rural Stud. 2021, 84, 138–147. [Google Scholar]
- Carolan, M. “Smart” Farming and the Fourth Agricultural Revolution: Socio-Technical Imaginaries and Their Implications. Sociol. Rural. 2022, 62, 34–58. [Google Scholar]
- Sun, Y.; Zhang, T. Privacy-Preserving Learning for Agricultural IoT Data. IEEE Internet Things J. 2020, 7, 11523–11535. [Google Scholar]
- Khan, F.; Yu, H. Blockchain and IoT Integration in Food Supply Chains. Sensors 2020, 20, 1528. [Google Scholar]
- Zhang, C.Z.; Yang, Z.M.; Tang, D.; Zhu, Y.H.; Wang, P.; Li, D.W.; Zhu, G.T.; Xiong, X.Y.; Shang, Y.; Li, C.H.; et al. Genome Design of Hybrid Potato. Cell 2021, 184, 15–32. [Google Scholar] [CrossRef]
- Nayal, K.; Raut, R.D.; Narkhede, B.E.; Priyadarshinee, P.; Panchal, G.B.; Gedam, V.V. Antecedents for blockchain technology-enabled sustainable agriculture supply chain. Ann. Oper. Res. 2023, 327, 1. [Google Scholar] [CrossRef]
- Diao, X.; Xu, C. Industrial Robots and Carbon Intensity: Evidence from Cross-Country Data. Technol. Soc. 2022, 68, 101890. [Google Scholar]
- Adegbite, O.O.; Machethe, C.L. Bridging the financial inclusion gender gap in smallholder agriculture in Nigeria: An untapped potential for sustainable development. World Dev. 2020, 127, 104755. [Google Scholar] [CrossRef]
- Jacquet, F.; Jeuffroy, M.H.; Jouan, J.; Le Cadre, E.; Litrico, I.; Malausa, T.; Reboud, X.; Huyghe, C. Pesticide-free agriculture as a new paradigm for research. Agron. Sustain. Dev. 2022, 42, 1. [Google Scholar] [CrossRef]
- Adeleye, A.T.; Odoh, C.K.; Enudi, O.C.; Banjoko, O.O.; Osiboye, O.O.; Odediran, E.T.; Louis, H. Sustainable synthesis and applications of polyhydroxyalkanoates (PHAs) from biomass. Process Biochem. 2020, 96, 174–193. [Google Scholar] [CrossRef]
- Chavas, J.P.; Nauges, C. Uncertainty, Learning, and Technology Adoption in Agriculture. Appl. Econ. Perspect. Policy 2020, 42, 1. [Google Scholar] [CrossRef]
- Rijswijk, K.; Klerkx, L.; Bacco, M.; Bartolini, F.; Bulten, E.; Debruyne, L.; Dessein, J.; Scotti, I.; Brunori, G. Digital transformation of agriculture and rural areas: A socio-cyber-physical system framework to support responsibilisation. J. Rural Stud. 2021, 85, 79–90. [Google Scholar] [CrossRef]
- Teshome, D.T.; Zharare, G.E.; Naidoo, S. The Threat of the Combined Effect of Biotic and Abiotic Stress Factors in Forestry Under a Changing Climate. Front. Plant Sci. 2020, 11, 601009. [Google Scholar] [CrossRef]
- Cullen, C.M.; Aneja, K.K.; Beyhan, S.; Cho, C.R.E.; Woloszynek, S.; Convertino, M.; McCoy, S.J.; Zhang, Y.Y.; Anderson, M.Z.; Alvarez-Ponce, D.; et al. Emerging Priorities for Microbiome Research. Front. Microbiol. 2020, 11, 136. [Google Scholar] [CrossRef]
- Bashan, Y.; de-Bashan, L.E. Microbiome-Based Strategies for Sustainable Agriculture. Front. Microbiol. 2020, 11, 576. [Google Scholar]
- Allan, J.; Belz, S.; Hoeveler, A.; Hugas, M.; Okuda, H.; Patri, A.; Rauscher, H.; Silva, P.; Slikker, W.; Sokull-Kluettgen, B.; et al. Regulatory landscape of nanotechnology and nanoplastics from a global perspective. Regul. Toxicol. Pharmacol. 2021, 122, 104885. [Google Scholar] [CrossRef] [PubMed]
- Ciarli, T.; Kenney, M.; Massini, S.; Piscitello, L. Digital technologies, innovation, and skills: Emerging trajectories and challenges. Res. Policy 2021, 50, 7. [Google Scholar] [CrossRef]
- Goel, R.K.; Yadav, C.S.; Vishnoi, S.; Rastogi, R. Smart agriculture-Urgent need of the day in developing countries. Sust. Comput. 2021, 30, 100512. [Google Scholar] [CrossRef]
- Hafeez, A.; Husain, M.A.; Singh, S.P.; Chauhan, A.; Khan, M.T.; Kumar, N.; Chauhan, A.; Soni, S.K. Implementation of drone technology for farm monitoring & pesticide spraying: A review. Inf. Process. Agric. 2023, 10, 2. [Google Scholar] [CrossRef]
- Suman, J.; Rakshit, A.; Ogireddy, S.D.; Singh, S.; Gupta, C.; Chandrakala, J. Microbiome as a Key Player in Sustainable Agriculture and Human Health. Front. Soil Sci. 2022, 2, 821589. [Google Scholar] [CrossRef]
- Norton, G.W.; Alwang, J. Changes in Agricultural Extension and Implications for Farmer Adoption of New Practices. Appl. Econ. Perspect. Policy 2020, 42, 1. [Google Scholar] [CrossRef]
- Lacoste, M.; Cook, S.; McNee, M.; Gale, D.; Ingram, J.; Bellon-Maurel, V.; MacMillan, T.; Sylvester-Bradley, R.; Kindred, D.; Bramley, R.; et al. On-Farm Experimentation to transform global agriculture. Nat. Food 2022, 3, 1. [Google Scholar] [CrossRef]
- European Chemicals Agency (ECHA). Nanomaterials in the EU: Regulatory and Scientific Developments 2023; European Chemicals Agency: Helsinki, Finland, 2023. [Google Scholar]
- European Food Safety Authority (EFSA). Guidance on Risk Assessment of Nanomaterials in the Food and Feed Chain. EFSA J. 2022, 20, 7401. [Google Scholar]
- Zhang, Y.N.; Long, H.L.; Ma, L.; Tu, S.S.; Li, Y.R.; Ge, D.Z. Analysis of rural economic restructuring driven by e-commerce based on the space of flows: The case of Xiaying village in central China. J. Rural Stud. 2022, 93, 196–209. [Google Scholar] [CrossRef]
- Hofmann, T.; Ghoshal, S.; Tufenkji, N.; Adamowski, J.F.; Bayen, S.; Chen, Q.Q.; Demokritou, P.; Flury, M.; Hueffer, T.; Ivleva, N.P.; et al. Plastics can be used more sustainably in agriculture. Commun. Earth Environ. 2023, 4, 1. [Google Scholar] [CrossRef]
- Klerkx, L.; Rose, D. Dealing with the game-changing technologies of Agriculture 4.0: How do we manage diversity and responsibility in food system transition pathways? Glob. Food Secur.-Agric. Policy 2020, 24, 100347. [Google Scholar] [CrossRef]
- Khan, P.W.; Byun, Y.C.; Park, N. IoT-Blockchain Enabled Optimized Provenance System for Food Industry 4.0 Using Advanced Deep Learning. Sensors 2020, 20, 2990. [Google Scholar] [CrossRef] [PubMed]
- Clapp, J. Explaining Growing Glyphosate Use: The Political Economy of Herbicide-Dependent Agriculture. Glob. Environ. Change-Hum. Policy Dimens. 2021, 67, 102239. [Google Scholar] [CrossRef]
- Omia, E.; Bae, H.; Park, E.; Kim, M.S.; Baek, I.; Kabenge, I.; Cho, B.K. Remote Sensing in Field Crop Monitoring: A Comprehensive Review of Sensor Systems, Data Analyses and Recent Advances. Remote Sens. 2023, 15, 354. [Google Scholar] [CrossRef]
- Devkota, K.P.; Devkota, M.; Rezaei, M.; Oosterbaan, R. Managing salinity for sustainable agricultural production in salt-affected soils of irrigated drylands. Agric. Syst. 2022, 198, 103390. [Google Scholar] [CrossRef]
- Jung, J.H.; Maeda, M.; Chang, A.J.; Bhandari, M.; Ashapure, A.; Landivar-Bowles, J. The potential of remote sensing and artificial intelligence as tools to improve the resilience of agriculture production systems. Curr. Opin. Biotechnol. 2021, 70, 15–22. [Google Scholar] [CrossRef]
- Li, L.; Ma, S.J.; Zheng, Y.L.; Xiao, X.Y. Integrated regional development: Comparison of urban agglomeration policies in China. Land Use Pol. 2022, 114, 105939. [Google Scholar] [CrossRef]
- Feder, G.; Umali, D. Technology Adoption under Uncertainty: A Review. Appl. Econ. Perspect. Policy 2020, 42, 43–66. [Google Scholar]
- Duque-Acevedo, M.; Belmonte-Ureña, L.J.; Cortés-García, F.J.; Camacho-Ferre, F. Agricultural waste: Review of the evolution, approaches and perspectives on alternative uses. Glob. Ecol. Conserv. 2020, 22, e00902. [Google Scholar] [CrossRef]
- Qadir, M.; Drechsel, P.; Cisneros, B.J.; Kim, Y.; Pramanik, A.; Mehta, P.; Olaniyan, O. Global and regional potential of wastewater as a water, nutrient and energy source. Nat. Resour. Forum. 2020, 44, 1. [Google Scholar] [CrossRef]
- Manzoor, A.; Dar, A.H.; Pandey, V.K.; Shams, R.; Khan, S.; Panesar, P.S.; Kennedy, J.F.; Fayaz, U.; Khan, S.A. Recent insights into polysaccharide-based hydrogels and their potential applications in food sector: A review. Int. J. Biol. Macromol. 2022, 213, 987–1006. [Google Scholar] [CrossRef]
- Santos, L.F.; Olivares, F.L. Plant microbiome structure and benefits for sustainable agriculture. Curr. Plant Biol. 2021, 26, 100198. [Google Scholar] [CrossRef]
- Wu, J.Z.; Ge, Z.M.; Han, S.Q.; Xing, L.W.; Zhu, M.S.; Zhang, J.; Liu, J.F. Impacts of agricultural industrial agglomeration on China’s agricultural energy efficiency: A spatial econometrics analysis. J. Clean. Prod. 2020, 260, 121011. [Google Scholar] [CrossRef]
- Tama, R.A.Z.; Ying, L.; Yu, M.; Hoque, M.M.; Adnan, K.M.M.; Sarker, S.A. Assessing farmers’ intention towards conservation agriculture by using the Extended Theory of Planned Behavior. J. Environ. Manag. 2021, 280, 111654. [Google Scholar] [CrossRef]
- Karunathilake, E.M.B.M.; Le, A.T.; Heo, S.; Chung, Y.S.; Mansoor, S. The Path to Smart Farming: Innovations and Opportunities in Precision Agriculture. Agriculture 2023, 13, 1593. [Google Scholar] [CrossRef]
- Shahzad, A.; Ullah, S.; Dar, A.A.; Sardar, M.F.; Mehmood, T.; Tufail, M.A.; Shakoor, A.; Haris, M. Nexus on climate change: Agriculture and possible solution to cope future climate change stresses. Environ. Sci. Pollut. Res. 2021, 28, 12. [Google Scholar] [CrossRef]
- Misra, N.N.; Dixit, Y.; Al-Mallahi, A.; Bhullar, M.S.; Upadhyay, R.; Martynenko, A. IoT, Big Data, and Artificial Intelligence in Agriculture and Food Industry. IEEE Internet Things J. 2022, 9, 9. [Google Scholar] [CrossRef]
- Yin, X.M.; Chen, J.; Li, J.Z. Rural innovation system: Revitalize the countryside for a sustainable development. J. Rural Stud. 2022, 93, 471–478. [Google Scholar] [CrossRef]
- Li, Y.R.; Zhang, X.C.; Cao, Z.; Liu, Z.J.; Lu, Z.; Liu, Y.S. Towards the progress of ecological restoration and economic development in China’s Loess Plateau and strategy for more sustainable development. Sci. Total Environ. 2021, 756, 143676. [Google Scholar]
- Kopacz, J.R.; Herschitz, R.; Roney, J. Small satellites an overview and assessment. Acta Astronaut. 2020, 170, 93–105. [Google Scholar] [CrossRef]
- Hassoun, A.; Prieto, M.A.; Carpena, M.; Bouzembrak, Y.; Marvin, H.J.P.; Pallarés, N.; Barba, F.J.; Bangar, S.P.; Chaudhary, V.; Ibrahim, S.; et al. Exploring the role of green and Industry 4.0 technologies in achieving sustainable development goals in food sectors. Food Res. Int. 2022, 162, 112068. [Google Scholar] [CrossRef]
- Rose, D.C.; Wheeler, R.; Winter, M.; Lobley, M.; Chivers, C.A. Agriculture 4.0: Making it work for people, production, and the planet. Land Use Pol. 2021, 100, 104933. [Google Scholar] [CrossRef]
- Li, Y.Y.; Zhang, Y.R.; Pan, A.; Han, M.C.; Veglianti, E. Carbon emission reduction effects of industrial robot applications: Heterogeneity characteristics and influencing mechanisms. Technol. Soc. 2022, 70, 102034. [Google Scholar] [CrossRef]
- FAO. The State of Food and Agriculture 2023: Leveraging Innovation for Sustainable Food Systems; Food and Agriculture Organization of the United Nations: Rome, Italy, 2023. [Google Scholar]
- United Nations. Available online: https://unstats.un.org/sdgs/dataportal/countryprofiles/ (accessed on 3 September 2025).
- GII, World Intellectual Property Organization (WIPO). Global Innovation Index Reports (2010–2023). Available online: https://www.wipo.int/en/web/global-innovation-index (accessed on 3 September 2025).
- World Bank. Available online: https://data.worldbank.org/ (accessed on 3 September 2025).
- Koenker, R.; Bassett, G. Regression Quantiles. Econometrica 1978, 46, 33–50. [Google Scholar] [CrossRef]
- Koenker, R. Quantile Regression for Longitudinal Data. J. Multivar. Anal. 2004, 91, 74–89. [Google Scholar] [CrossRef]
- Koenker, R. Quantile Regression; Cambridge University Press: Cambridge, UK, 2005. [Google Scholar]
- Breusch, T.S.; Pagan, A.R. A Simple Test for Heteroscedasticity and Random Coefficient Variation. Econometrica 1979, 47, 1287–1294. [Google Scholar] [CrossRef]
- Wooldridge, J.M. Econometric Analysis of Cross Section and Panel Data; MIT Press: Cambridge, MA, USA, 2002. [Google Scholar]
- Drukker, D.M. Testing for Serial Correlation in Linear Panel-Data Models. Stata J. 2003, 3, 168–177. [Google Scholar] [CrossRef]
- Pesaran, M.H. General Diagnostic Tests for Cross Section Dependence in Panels; CESifo Working Paper No. 1229; IZA: Bonn, Germany, 2004. [Google Scholar]
- Pesaran, M.H. Testing Weak Cross-Sectional Dependence in Large Panels. Econom. Rev. 2015, 34, 1089–1117. [Google Scholar] [CrossRef]
- Buchinsky, M. Estimating the Asymptotic Covariance Matrix for Quantile Regression Models: A Monte Carlo Study. J. Econom. 1995, 68, 303–338. [Google Scholar] [CrossRef]
- S&P Global (IHS EViews). EViews 12 User’s Guide II; S&P Global: Irvine, CA, USA, 2020. [Google Scholar]

Disclaimer/Publisher’s Note: The statements, opinions and data contained in all publications are solely those of the individual author(s) and contributor(s) and not of MDPI and/or the editor(s). MDPI and/or the editor(s) disclaim responsibility for any injury to people or property resulting from any ideas, methods, instructions or products referred to in the content. |
© 2025 by the author. Licensee MDPI, Basel, Switzerland. This article is an open access article distributed under the terms and conditions of the Creative Commons Attribution (CC BY) license (https://creativecommons.org/licenses/by/4.0/).