Article

Effect of Different Light–Dark Cycles on the Growth and Nutritional Quality of Celery

1
College of Horticulture, Sichuan Agricultural University, Chengdu 611130, China
2
Shannan Agricultural Technology Extension Center, Shannan 856000, China
3
School of Agricultural Engineering, Jiangsu University, Zhenjiang 212013, China
4
Institute of Urban Agriculture, Chinese Academy of Agricultural Sciences, Chengdu 611130, China
*
Authors to whom correspondence should be addressed.
These authors contributed equally to this work.
Agriculture 2025, 15(21), 2228; https://doi.org/10.3390/agriculture15212228 (registering DOI)
Submission received: 12 September 2025 / Revised: 20 October 2025 / Accepted: 22 October 2025 / Published: 25 October 2025
(This article belongs to the Section Crop Production)

Abstract

Celery (Apium graveolens L.) is a widely cultivated leafy vegetable of significant agronomic and nutritional importance. Owing to its high nutritional value, global demand for celery has steadily increased. However, under natural cultivation conditions, uncontrolled light exposure often prolongs the seedling stage and impairs celery growth quality. Improving the nutritional quality of celery through artificial regulation of the light environment has therefore become an important research focus. This work aimed to elucidate the impact of varying light–dark cycles on the growth characteristics and nutritional attributes of celery. Six light–dark cycle treatments (4 h/2 h, 8 h/4 h, 16 h/8 h, 24 h/12 h, 32 h/16 h, and 40 h/20 h) were applied, using ‘Oster Ziyu Xiangqin’ as the plant material under a constant light intensity of 400 μmol·m−2·s−1. The results revealed that the 24 h/12 h light–dark treatment significantly enhanced plant height, total fresh weight, and root vigor and showed superior performance in photosynthetic and chlorophyll fluorescence parameters. The 32 h/16 h treatment significantly enhanced the accumulation of soluble sugars, proteins, total phenolic compounds, and flavonoids, as well as the activities of antioxidant enzymes, while reducing nitrate-nitrogen levels. In conclusion, the 24 h/12 h light–dark cycle was most conducive to the growth and photosynthetic performance of celery, whereas the 32 h/16 h treatment optimally enhanced its nutritional quality and antioxidant capacity.

1. Introduction

Celery (Apium graveolens L.) is an annual or biennial species belonging to the genus Apium of the family Apiaceae [1]. It is an excellent source of dietary fiber, which supports digestive health, and is rich in various nutrients and minerals [2]. In addition, celery possesses significant medicinal value. Bioactive compounds present in celery, including apigenin and coumarin, have been shown to lower blood pressure and regulate lipid metabolism [3]. Celery petioles and seeds exhibit multiple pharmacological activities, including anti-inflammatory, hypotensive, anthelmintic, sedative, and anti-rheumatic effects [4]. Celery juice combined with carrot juice has been reported to alleviate several chronic diseases [5]. Traditionally, celery seeds have been used to relieve digestive disorders and correct metabolic dysfunctions [6].
Light functions as a pivotal environmental determinant that modulates plant growth and development [7], primarily regulating physiological and metabolic processes through photosynthesis [8]. Compared with other crops, systematic studies on light environment regulation in celery remain limited; however, existing research has begun to elucidate the effects of various light factors. Regarding photoperiod regulation, Booji and Meurs [9] reported that exposing Apium graveolens L. var. rapaceum (Mill.) DC. to continuous 24 h illumination after the formation of the primary umbel inflorescence induced flowering about 8 d earlier than under a 10 h photoperiod. Chu et al. [10] compared two celery cultivars under different photoperiods and found that both exhibited optimal growth under the 12 h/12 h regime. Moreover, photoperiodic alternation between light and darkness affects the biosynthesis and accumulation of secondary metabolites. Chen et al. [11] demonstrated that a short 6 h/6 h light–dark cycle disrupted the continuous synthesis of flavonoids, whereas continuous 24 h illumination markedly increased their accumulation. Liu et al. [12] investigated postharvest preservation and found that, under a 1:1 red–blue light ratio, a light intensity of 30 μmol·m−2·s−1 was more effective than other treatments in delaying celery senescence, as indicated by reduced dry-weight loss, smaller color differences, and a chlorophyll content 2.3-fold higher than that of the control (CK). During the growth stage, Qin et al. [13] reported that the accumulation of photosynthetic pigments and nutrients in celery was enhanced at an intensity of 200 μmol·m−2·s−1, whereas chalcone synthase (CHS) and flavonoid synthase (FNS) showed the highest enzymatic activities under this treatment. Collectively, accumulating evidence indicates that photoperiod and light intensity are critical environmental factors governing celery growth and development. However, the mechanisms by which light–dark cycles influence quality formation and physiological metabolism remain largely unclear. Systematic investigation of celery’s response to light–dark cycles is of great significance for refining the theoretical framework of light-environment regulation and enhancing cultivation efficiency.
Plant circadian rhythms are endogenous biological cycles of approximately 24 h that enable plants to respond adaptively to environmental cues such as temperature and light. This rhythmic behavior represents a fundamental feature of eukaryotic organisms. These rhythms operate at the cellular level and exert pervasive influences on metabolic processes [14]. Plant metabolic activities are subject to diel regulation, alternating between high and low activity states within approximately 24 h intervals governed by the circadian clock [15]. This complex system modulates gene expression at multiple levels through intricate transcriptional regulatory networks [16]. Photosynthesis provides the primary energy source for plant growth and development, fundamentally determining crop productivity [17]. The circadian clock regulates key physiological processes, ensuring plant adaptation to diurnal environmental fluctuations by optimizing photosynthesis, flowering, and seed germination [18]. Circadian rhythms orchestrate diverse physiological processes, including gene expression, metabolism, and development [19,20]. In addition, plant circadian rhythms regulate pathogen resistance and modulate both the synthesis and signaling pathways of phytohormones [21]. Recent studies on vegetable crops have further elucidated the critical role of circadian rhythm regulation in domestication and yield enhancement. For example, Anton-Sales et al. [22] first established a direct link between biological clock deceleration and the domestication and breeding of leafy crops, revealing that bolting-delay breeding slowed the circadian rhythm in lettuce and indicating that circadian phenotypes can predict developmental timing. Similarly, Diego et al. [23] reported that plants can adapt to unnatural circadian cycles through endogenous clock regulation, demonstrating that misalignment between the internal clock and the external circadian rhythm does not necessarily lead to poor growth. They emphasized that extended photoperiods can result in growth performance comparable to or even exceeding that of short photoperiods under identical daily light integral (DLI) conditions. In tomato research, Liu et al. [24] identified the SlPRR1 gene as a central regulator of circadian rhythms and photoperiodic flowering, whereas Yang et al. [25] revealed that the circadian-related GIGANTEA gene enhances heat tolerance. Additionally, Zhang et al. [26] demonstrated that CsWOX1 integrates leaf development with circadian regulatory factors in cucumber, highlighting the interplay between morphogenesis and rhythmic signaling. Therefore, understanding plant circadian rhythms is essential for enhancing agricultural productivity and advancing ecological sustainability and environmental conservation [27].
Two principal factors describe the light–dark cycle: the total length of the cycle and the relative proportion of its light and dark periods. When the duration of the light–dark cycle corresponds to the natural 24 h circadian rhythm, it is defined as a normal cycle; any deviation from 24 h is regarded as an abnormal light–dark cycle [28,29]. In plant factory systems, where the natural 24 h circadian rhythm is absent, artificial light sources are employed to establish controlled abnormal light–dark cycles. Intermittent lighting is considered a form of abnormal light–dark cycling. Within a 24 h period, intermittent lighting may involve two or more complete light–dark cycles. Previous studies have shown that artificially controlled abnormal light–dark cycles can stimulate the biosynthesis of secondary metabolites in plant cells [30]. The purpose of designing abnormal light–dark cycles is to enhance light energy utilization, enabling plants to achieve high yield and improved quality while reducing energy consumption. Therefore, light–dark cycles serve as critical regulatory factors governing plant growth and photosynthesis processes. Different light–dark cycles exert distinct effects on plant growth and photosynthetic performance depending on plant species and the surrounding light environment.
The light–dark cycle plays a pivotal role in regulating plant growth and photosynthetic performance. Studies have shown that intermittent lighting enhances photosynthetic efficiency in algae, increases leaf area in Arabidopsis thaliana (L.) Heynh., and improves biomass accumulation and fructose content in lettuce [31]. In addition, light quality affects the oscillation frequency of the biological clock in lettuce. Kang et al. [32] demonstrated that shortening the light–dark cycle, particularly under high-intensity photoperiods shorter than 24 h, significantly promoted lettuce growth and development in plant factory systems. Cheng et al. [33] reported that shortening the light–dark cycle from 12 h/12 h to 4 h/4 h increased the daily net CO2 exchange rate in Dendrobium officinale Kimura & Migo but inhibited it in Dendrobium polyanthum Wall. ex Lindl. Chen et al. [34] found that, under equivalent total light exposure, a shortened 8 h/4 h light–dark cycle, compared with the conventional 16 h/8 h treatment, significantly increased lettuce shoot dry weight and improved its nutritional quality. Chihiro et al. [35] observed that lettuce grown under non-24 h light–dark cycles exhibited a substantially faster growth rate than plants exposed to the standard 24 h cycle. Shao et al. [36] reported that switching to 12 h or 36 h light–dark cycles before harvest significantly enhanced lettuce growth, whereas a 48 h cycle inhibited it. Appropriate adjustment of the light–dark cycle during the later growth stages can enhance both yield and nutritional quality in lettuce. However, excessively prolonged cycles have been reported to negatively affect lettuce growth. Kurata et al. [37] applied 6 h/6 h, 12 h/12 h, 24 h/24 h, and 36 h/36 h light–dark cycles to Coffea arabica L. cell cultures and found that extending the cycle duration promoted cell proliferation. Hang et al. [38] revealed that, in contrast to shorter cycles (3 h/3 h), longer cycles (6 h/6 h) enhanced lettuce’s stomatal conductance and net photosynthetic rate. Zhou et al. [39] reported that, compared to shorter photoperiods (6 h/6 h and 3 h/3 h), a longer light–dark cycle (12 h/12 h) increased both light-response curve parameters and CO2-response curve parameters. Collectively, these results suggest that a moderate modification of the light–dark cycle, either by extending or shortening its duration, favors the enhancement of growth, with effects varying due to plant species, cycle length, and other factors.
The light–dark cycle also exerts a significant influence on plant nutritional quality. Researchers have investigated how variations in light–dark cycle duration regulate plant nutrient composition and yield. Cheng et al. [33] reported that, compared with a 12 h/12 h light–dark cycle, a shorter 2 h/2 h cycle markedly enhanced soluble polysaccharide content and yield in Dendrobium officinale Kimura & Migo under aeroponic cultivation, thereby improving both growth and quality. Chen et al. [40] demonstrated that extending the light–dark cycle increased ascorbic acid and soluble sugar contents in lettuce, reaching a maximum under a 120 h/60 h treatment and significantly enhancing nutritional quality. Tatjana et al. [41] investigated the responses of three solanaceous species to prolonged light–dark cycles. Their results indicated that, compared with the conventional 16 h/8 h light–dark cycle, treatments with 48 h/24 h, 96 h/48 h, and 120 h/60 h cycles significantly increased fruit yields in tomato and pepper. In particular, anthocyanin and flavonoid contents were significantly elevated under the 120 h/60 h treatment.
In summary, both the prolongation and reduction of the light–dark cycle can enhance plant nutritional quality, although the responses vary considerably depending on plant species, specific cycle parameters, and environmental conditions. Therefore, the present study was conducted to investigate the effects of different light–dark cycles on the growth, development, and nutritional quality of celery.

2. Materials and Methods

2.1. Experimental Materials and Environment

The experimental trial was performed over a four-month period (June–September 2024) at the plant factory of the Chengdu Academy of Agriculture and Forestry Sciences, Chengdu, Sichuan, China (103°51′ E, 30°42′ N). Uniform, healthy celery seeds (cultivar ‘Oster Ziyu Xiangqin’; obtained from Khalid Seeds Hebei Co., Ltd., characterized by vigorous growth and strong disease resistance) were selected and soaked in a 100 mg·L−1 gibberellic acid (GA3) solution in 50 mL centrifuge tubes for 24 h. After rinsing, the seeds were placed in Petri dishes and transferred to a constant-temperature incubator at 22 °C for light-induced germination (light intensity: 200 μmol·m−2·s−1; photoperiod: 12 h light/12 h dark). The seeds were rinsed once daily with distilled water. When approximately 80% of the seeds had germinated, they were transferred to hydroponic cultivation using black sponges (240 × 200 × 20 mm) with cross-shaped perforations (80 holes). When the two cotyledons of the celery seedlings were fully expanded, the seedlings were transferred to 1/3 Hoagland’s nutrient solution. The pH was maintained at 6.5 ± 0.5, and the EC at 0.9 ± 0.1 mS·cm−1. When seedlings reached the four-true-leaf stage, uniform healthy seedlings without diseases or insect damage were selected and transplanted into the hydroponic system (one seedling per hole, 18 cm spacing). The plants were maintained in full-strength Hoagland’s nutrient solution. The pH was maintained at 6.5 ± 0.5, and the EC at 2.5 ± 0.1 mS·cm−1, with solution replacement every 10 days.
Light was supplied by red-blue LED panels (Guangzhou Inled Lighting Technology Co., Ltd.; Guangzhou, China. Model: LHTHS8B512R600A7B40N-68P450; dimensions: 680 × 400 × 14 mm; power: 180 W). The photosynthetic photon flux density (PPFD) for all experimental treatments was measured using a plant light analyzer (OHSP-350P, HOPOO COLOR, Hangzhou, China).

2.2. Experimental Treatment

In this experiment (Figure 1), under red–blue mixed light (red–blue = 8:2), the photon flux density was measured as PPFD = 400 ± 10 μmol·m−2·s−1, and the 16 h/8 h light–dark cycle was used as the control (CK). Six light–dark cycle treatments were established: 4 h/2 h, 8 h/4 h, 16 h/8 h, 24 h/12 h, 32 h/16 h, and 40 h/20 h. Seedlings with four leaves were acclimated under uniform light for 5 d and then exposed to different light–dark cycles. Each treatment included 35 plants, and three plants were randomly selected for repeatability testing. During the adaptation period, the celery seedlings were maintained under the 16 h/8 h treatment. Each treatment lasted 30 d, and samples were collected at the end of the photoperiod. Leaf blades and petioles were randomly collected from five healthy plants per replicate (three replicates per treatment), immediately frozen in liquid nitrogen, and stored at −80 °C for subsequent physiological analyses.

2.3. Determination of Growth Indicators

Under 30 d processing, five plants per replicate were randomly selected for growth index determination. Plant height and root length were measured manually using a ruler. Petiole width was measured with vernier calipers. Fresh weights of the aboveground and underground parts were determined with an analytical balance, and dry weights were obtained following 3 d of oven drying at 75 °C.

2.4. Determination of Root Activity

Root activity was measured by spectrophotometry [42]. Washed roots (1 g) were put in a 200 mL conical flask with 50 mL of an equal-volume mixture of 50 µg·mL−1 α-naphthylamine solution and pH 7.0 phosphate buffer. The roots were incubated in this solution for 10 min. The content of α-naphthylamine was measured using 2 mL of the solution as the initial value. The conical flask was then sealed and placed at 25 °C for 3 h, and 2 mL of the solution was taken for the determination of α-naphthylamine content. Root activity was calculated based on the oxidation of α-naphthylamine.

2.5. Determination of Chlorophyll Fluorescence and Photosynthetic Parameters

After 30 d of treatment, five healthy leaves were randomly selected, repeated three times, and the net photosynthetic rate (Pn), intercellular CO2 concentration (Ci), transpiration rate (Tr), and stomatal conductance (Gs) were measured using a portable photosynthesis analyzer (LI-COR 6800, Lincoln, NE, USA). Measurements were conducted between 9:00 and 12:00 h. During measurements, CO2 concentration was maintained at 400 μmol·mol−1 using a CO2 cylinder, under controlled conditions of 25 °C, 50% relative humidity, and a photosynthetic photon flux density (PPFD) of 400 μmol·m−2·s−1.
The maximum photochemical efficiency (Fv/Fm), actual photosynthetic efficiency (Y(II)), photochemical quenching (qP), relative electron transport rate (ETR), and non-photochemical quenching (NPQ) were measured using a portable fluorometer (Walz PAM-2500; Effeltrich, Germany). Before measurement, celery leaves were dark-adapted for 30 min, and an illumination intensity of 669 μmol·m−2·s−1 was maintained during measurement.

2.6. Determination of Photosynthetic Pigments

A 0.5 g sample of fresh leaf blades from each treatment was weighed, immersed in 10 mL of 80% acetone solution, and incubated in darkness at room temperature for 72 h. After the leaf blades had completely turned white, absorbance was measured at wavelengths of 470, 663, and 646 nm [43]. The photosynthetic pigment content was calculated as follows:
C h l . a ( m g / g ) = ( 12.21 × O D 663 2.81 × O D 646 ) × V 1000 × W
C h l . b ( m g / g ) = ( 20.13 × O D 646 5.03 × O D 663 ) × V 1000 × W
C a r ( m g / g ) = ( ( 1000 × O D 470 3.27 × C h l . a 104 × C h l . b ) / 229 ) × V 1000 × W

2.7. Determination of Physiological Indexes

2.7.1. Determination of Antioxidant Enzymes and MDA Content

For enzyme extraction, 0.5 g of fresh tissue was homogenized with 1 mL of pre-chilled 0.05 mol·L−1 phosphate buffer (pH 7.8) on ice. The mixture was poured into a centrifuge tube until it reached a steady 5 mL volume, centrifuged at 4 °C and 4000 rpm for 20 min, and the supernatant was collected for cryopreservation.
Superoxide dismutase (SOD) activity was assessed through the reduction of nitroblue tetrazolium (NBT) [44]. The enzyme solution (0.1 mL) was added to 0.5 mL of 30 mmol·L−1 Methionine (Met), 30.5 mL 100 µmol·L−1 Ethylenediaminetetraacetic acid disodium salt (EDTA-Na2), 30.5 mL of 750 µmol·L−1 NBT, and 30.5 mL of 20 µmol·L−1 riboflavin in turn, and then placed in an artificial incubator for 30 min. Absorbance was measured at 560 nm following the process. Peroxidase (POD) activity was measured based on the guaiacol method. Following the addition of 0.1 mL of the enzyme solution, 50 mL of 0.1 mol·L−1 phosphate buffer (pH 6.0), 0.028 mL of guaiacol, and 0.019 mL of 30% (v/v) H2O2, the absorbance was measured at 470 nm. Catalase (CAT) activity was determined spectrophotometrically using the colorimetric method described by [45]. After mixing 0.1 mL of the enzyme solution with 20 mL of 0.1mol·L−1 phosphate buffer (pH 7.0) and 5.68 mL of 30% (v/v) H2O2, the absorbance was measured at 240 nm.
Malondialdehyde (MDA) content was measured by the thiobarbituric acid (TBA) reaction method [46]. Fresh tissue (0.5 g) was placed in a 10 mL test tube and mixed with 10 mL of 5% (w/v) trichloroacetic acid (TCA). The sample was ultrasonically extracted at room temperature for 10 min, followed by centrifugation at 4000 rpm for 10 min. For 10 min, the supernatant was incubated in boiling water after being added to a 0.6% (w/v) solution of thiobarbituric acid (TBA). Absorbance at 532, 600, and 450 nm was measured after the mixture had cooled and been centrifuged.
C M D A = 6.45 × O D 532 O D 600 0.56 × O D 450

2.7.2. Determination of Proline Content

Proline content was determined according to the method described by Song et al. [47]. Fresh tissue (0.5 g) was homogenized in 5 mL of 3% (w/v) sodium salicylate solution and subjected to boiling water for 20 min to extract the desired compounds. An aliquot of 0.5 mL of the extract was mixed with 1.5 mL of distilled water. Then 2.0 mL of glacial acetic acid solution and 2.0 mL of ninhydrin solution were added. The mixture was vortexed thoroughly and heated in boiling water for 30 min. After cooling, 5 mL of toluene was added to each test tube, and the mixture was fully oscillated to extract the red product. After standing in the dark for 2–3 h, the toluene layer was completely separated, and absorbance readings were taken at a wavelength of 520 nm.

2.7.3. Determination of Antioxidant Substances

Total phenol content was measured using the method of Yan [48]. A dry sample of celery (0.1 g) was added to 1 mL of acetone and was ultrasonicated at 60 °C for 30 min. After centrifugation, 1 mL of 2% Na2CO3 solution was combined with 0.05 mL of supernatant. Following 5 min of standing, 0.05 mL of 50% (v/v) Folin-Ciocalteu reagent was applied. After 30 min of incubation in the dark, absorbance was measured at 760 nm. A calibration curve was constructed using gallic acid as the standard.
Total flavonoids were quantified spectrophotometrically by the aluminum chloride colorimetric technique [10]. An aliquot (0.12 mL) of the phenolic extract was mixed with 0.36 mL of 95% (v/v) ethanol, 0.24 mL of 2% AlCl3 solution, 0.24 mL of 1 mol·L−1 potassium acetate solution, and 0.672 mL of distilled water. The mixture was vortexed and incubated in the dark at room temperature for 40 min. Absorbance was measured at 415 nm, and quercetin was used as the standard to construct the calibration curve.
Ascorbic acid (AsA) content was measured using ultraviolet (UV) spectrophotometry [49]. Fresh tissue (0.5 g) was placed in an ice bath. Then, 10 mL of 50 g·L−1 trichloroacetic acid (TCA) solution was added, shaken well, and then centrifuged for 30 min. The supernatant (1 mL) was mixed with 2 mL of 50 g·L−1 TCA solution and 1 mL of ethanol. After giving the mixture a good shake, 0.5 mL of phosphoric acid-ethanol solution, 0.5 mL of FeCl3-ethanol solution, and 1 mL of BP-ethanol solution were added sequentially. Absorbance was measured at 534 nm after the completion of the reaction.
Anthocyanin content was determined as described by Li et al. [50]. A 1 g portion of fresh tissue was subjected to extraction using 15 mL of 1% (v/v) hydrochloric acid–methanol solution, mixed thoroughly, and incubated in the dark. After centrifugation in a refrigerated centrifuge (ST16R, Thermo Scientific, MA, USA), the absorbance of the supernatant was measured at 530, 620, and 650 nm using a microplate reader (SpectraMax M2, Molecular Devices, CA, USA). The anthocyanin content in each treatment was calculated using the following equation:
O D = ( O D 530 O D 620 ) 0.1 × ( O D 650 O D 620 )
In the formula, each 0.1 absorbance unit represents 1 mg of total anthocyanin content in the sample.

2.7.4. Determination of Nutritional Quality

Soluble protein content was determined according to the method described by Tunio [51]. An amount of 0.5 g of fresh tissue was mixed with 1 mL of pre-chilled 0.05 mol·L−1 phosphate buffer (pH 7.8), and the resulting mixture was adjusted to a total volume of 5 mL in a centrifuge tube. After centrifugation, 0.1 mL of supernatant was collected. Absorbance was measured at 595 nm.
Soluble sugar content was measured based on the anthrone reagent method [52]. Weigh 0.5 g of fresh sample, then add 10 mL of distilled water and boil for 10 min. After cooling, the mixture was centrifuged at 4000 rpm for 15 min. An aliquot (1 mL) of the supernatant was mixed with 5 mL of anthrone reagent, and the absorbance at 620 nm was quantified spectrophotometrically.
Free amino acids were quantified spectrophotometrically using the ninhydrin colorimetric approach [53]. An amount of 0.5 g of fresh sample was weighed, then 5 mL of 10% (v/v) glacial acetic acid was added and shaken well. The mixture was diluted with distilled water to a final volume of 100 mL. Then, 2 mL of the supernatant was mixed with 3 mL of indophenol solution and 0.1 mL of 0.1% ascorbic acid solution. After boiling for 15 min, the mixture was rapidly cooled. Following the addition of 60% ethanol to a fixed volume of 5 mL, absorbance was quantified at 570 nm.
Nitrate-nitrogen content was determined by UV spectrophotometry [54]. Weigh 0.5 g of fresh celery, add 5 mL of distilled water, then place in a 45 °C environment and heat for 1 h. After cooling, the extract was centrifuged, and 0.2 mL of the supernatant was mixed with 0.2 mL of 5% (w/v) salicylic acid–sulfuric acid solution. After 30 min, 4.75 mL of 2 mol·L−1 NaOH solution was added, and absorbance was measured at 410 nm.
Cellulose content was determined according to the national standard GB/T 5009.10–2003 [55]. A dry celery sample (0.01 g) was weighed, and then 1.2 mL of 3% (m/v) sodium dodecyl sulfate (SDS) neutral detergent was added. Then, the mixture was boiled in a water bath for 1 h, centrifuged to discard the supernatant, rinsed repeatedly with distilled water and acetone, and, finally, 1 mL of the extract was used to measure hemicellulose content. The residue was incubated overnight at 60 °C. Then 0.2 mL of 72% H2SO4 was added and hydrolyzed at 35 °C for 1 h. One milliliter of distilled water was added, the mixture was boiled for 1 h, and then cooled to room temperature. After centrifugation, 0.1 mL of the supernatant was taken and added to 0.4 mL of distilled water and 2 mL of anthrone reagent. The reaction mixture was heated in a boiling water bath for 20 min, and absorbance was measured at 620 nm. A standard calibration curve was generated using glucose, and the cellulose content was multiplied by 0.9.
Hemicellulose content was assessed by combining 0.1 mL of hemicellulose extract with 0.4 mL of distilled water for further analysis. Then, 2 mL of lichen phenol was added and the mixture was boiled in a water bath for 20 min. Finally, absorbance was measured at 660 nm. A calibration curve was constructed using xylose as the standard, and the hemicellulose content was multiplied by 0.9 for conversion.

2.8. Data Analyses

Data were processed using Excel 2021 and SPSS 27.0.1, including statistical analysis and multiple comparisons. GraphPad Prism 9.5 was used to plot the results. The data are presented as mean ± SD. The correlation analysis and principal component analysis were performed using Origin 2024. Comprehensive evaluation value D was calculated using the membership function (Ui) of the comprehensive index and weights (Wi) [56].
U i = X i X M I N X M A X X M I N ( i = 1 ,   2 ,   ,   n )
In the formula, the i-th comprehensive index’s membership function value is represented by Ui; its value is represented by Xi; its minimum value is represented by XMIN; and its maximum value is represented by XMAX.
W i = u i i = 1 3 u i ( i = 1 ,   2 ,   ,   n )
In the formula, Wi stands for the i-th comprehensive index’s weight and ui for the principal component analysis-derived contribution rate of the i-th comprehensive index.
D = U i × W i ( i = 1 ,   2 ,   ,   n )
In the formula, D represents the comprehensive evaluation value.

3. Results

3.1. Effects of Light–Dark Cycle on Growth

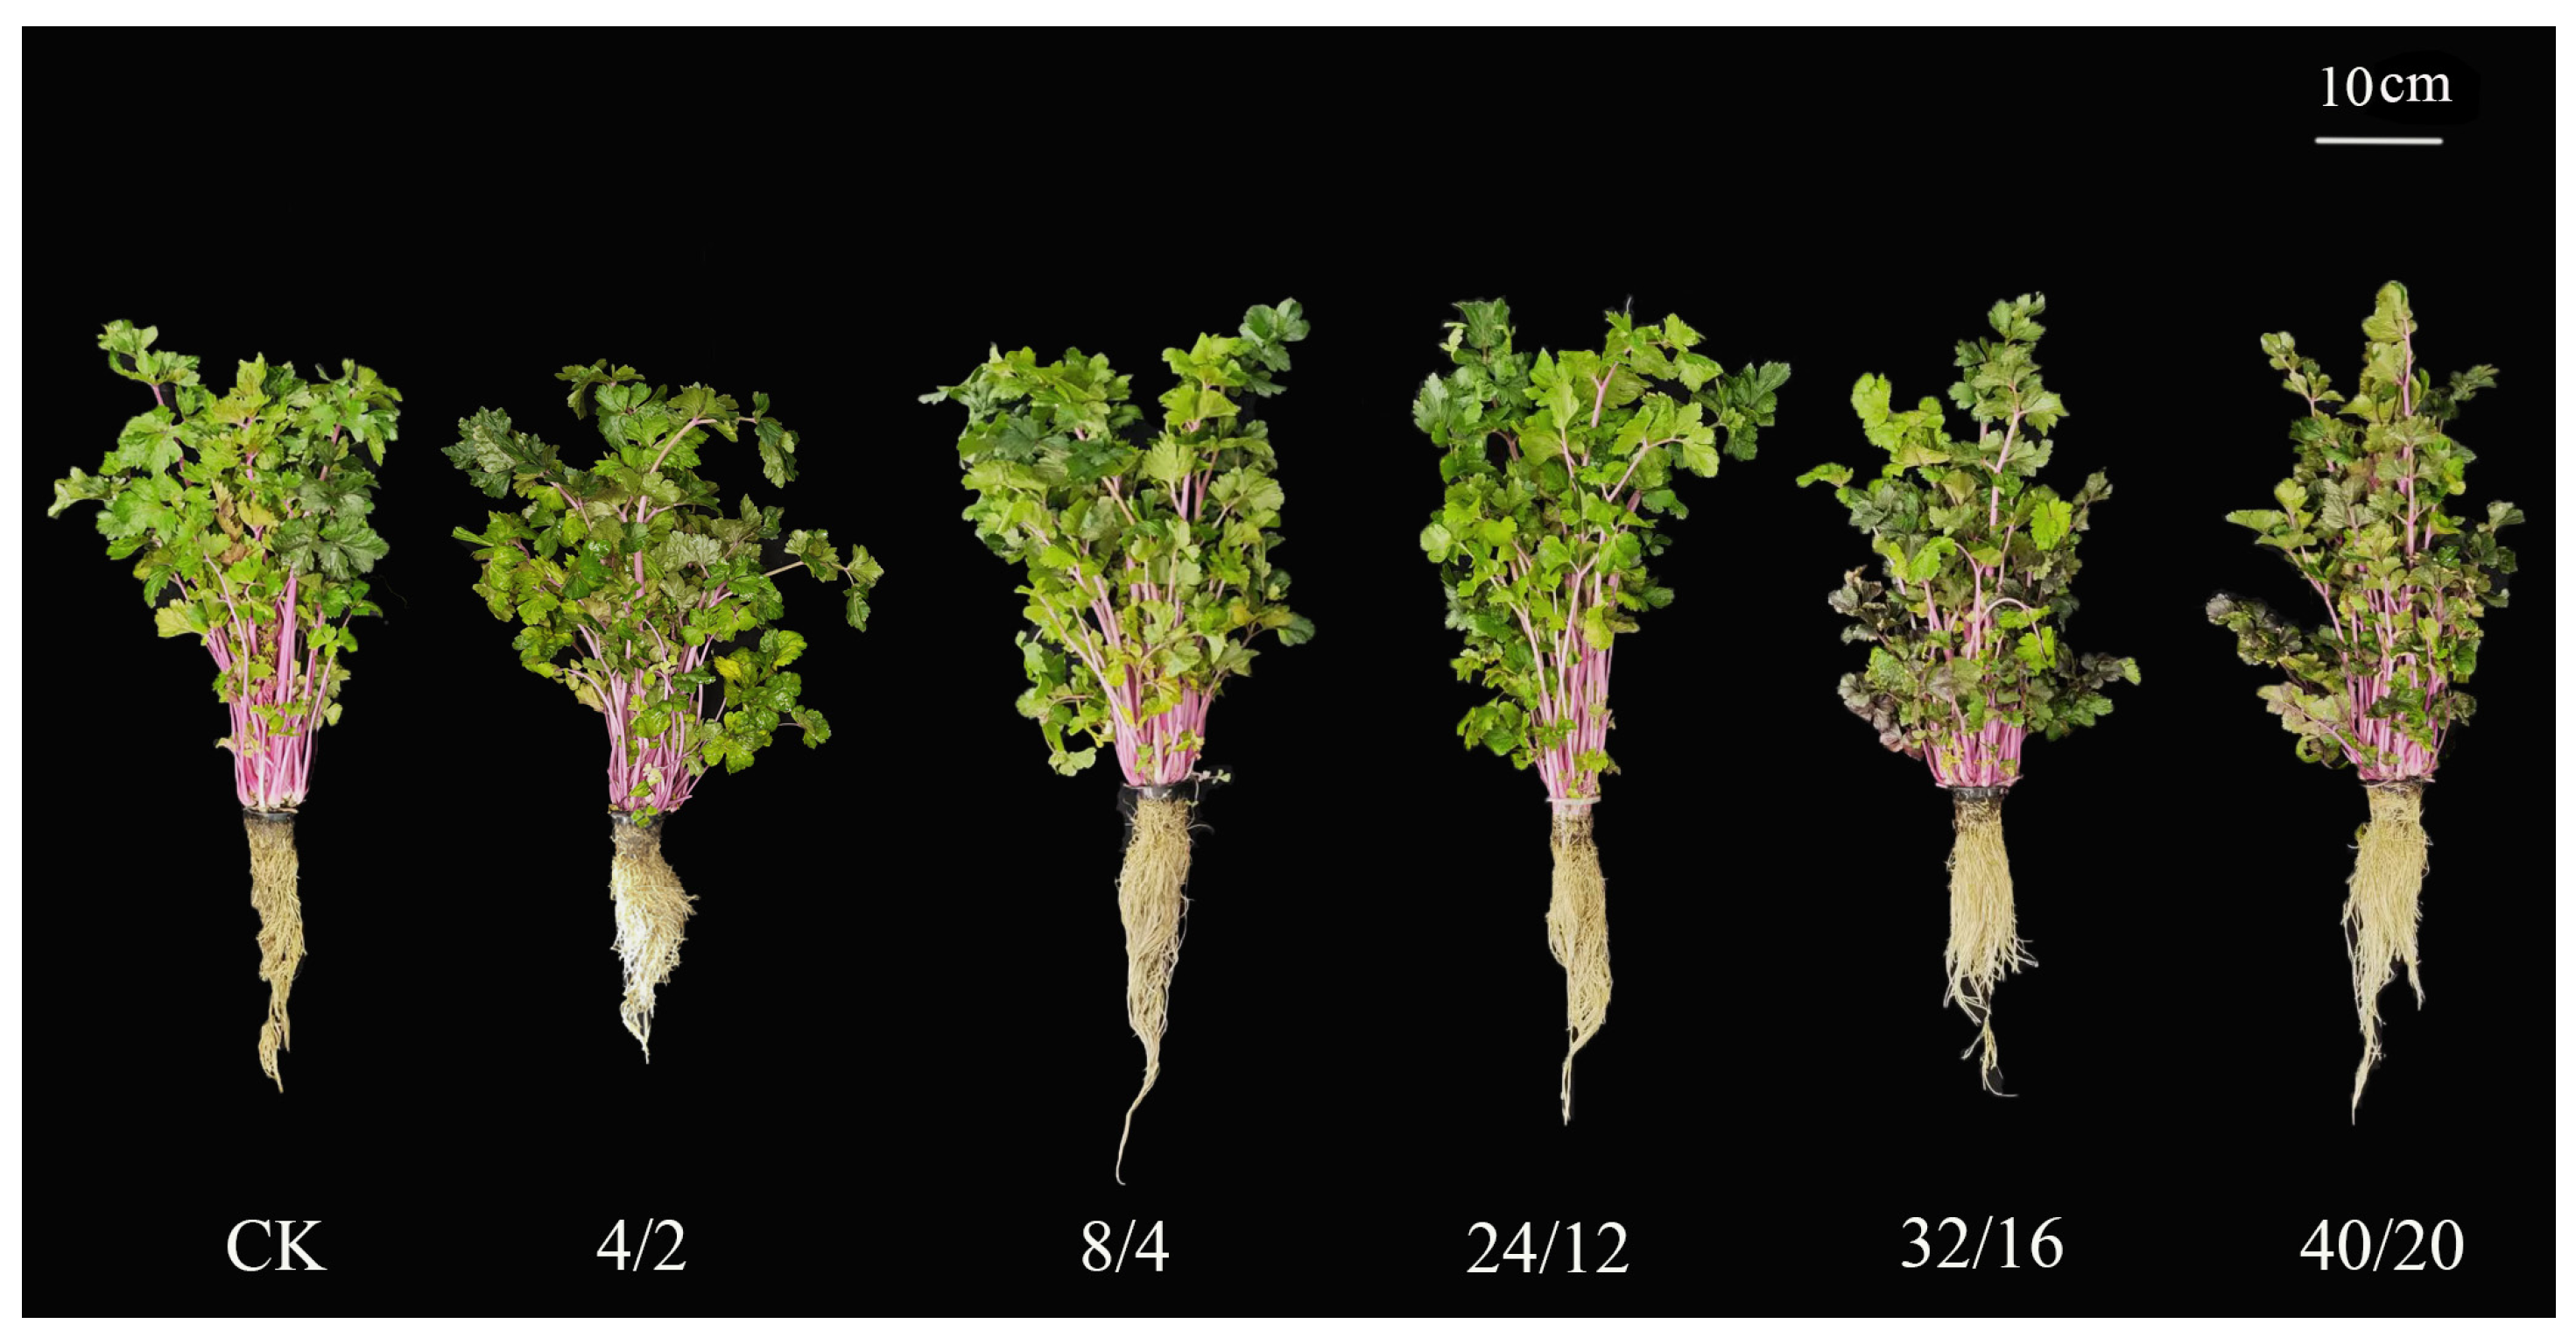
Figure 2 shows celery’s growth states in different light–dark cycles. Regarding plant height (Figure 3A), the 24 h/12 h treatment was higher than the other treatments and increased by 22.7% compared to CK. Under the 8 h/4 h treatment, root length, petiole width, and leaf number (Figure 3A,B) increased by 16.0%, 13.4%, and 35.4%, respectively, compared with CK. These results indicate that both the 8 h/4 h and the 24 h/12 h treatments effectively promoted celery growth.
As shown in Table 1, all treatments except the 4 h/2 h cycle resulted in significantly higher fresh weights than CK. In the 8 h/4 h treatment, the shoot fresh weight reached the highest level, increasing by 47.1% compared to CK. Under the 24 h/12 h treatment, both shoot and root fresh weights were significantly higher than those of the CK, with the root achieving the highest fresh weight of 73.2 g. In the dry weight, the shoot dry weight reached a maximum of 21.2 g under the 8 h/4 h treatment, which was higher than in other treatments. In terms of root dry weight, the 24 h/12 h and 40 h/20 h treatments were significantly higher than the other treatments. Compared with the CK, the increases were 28.7% and 32.4%. These results indicate that the 24 h/12 h treatment is optimal for promoting celery biomass accumulation.

3.2. Effects of Light–Dark Cycle on Root Activity

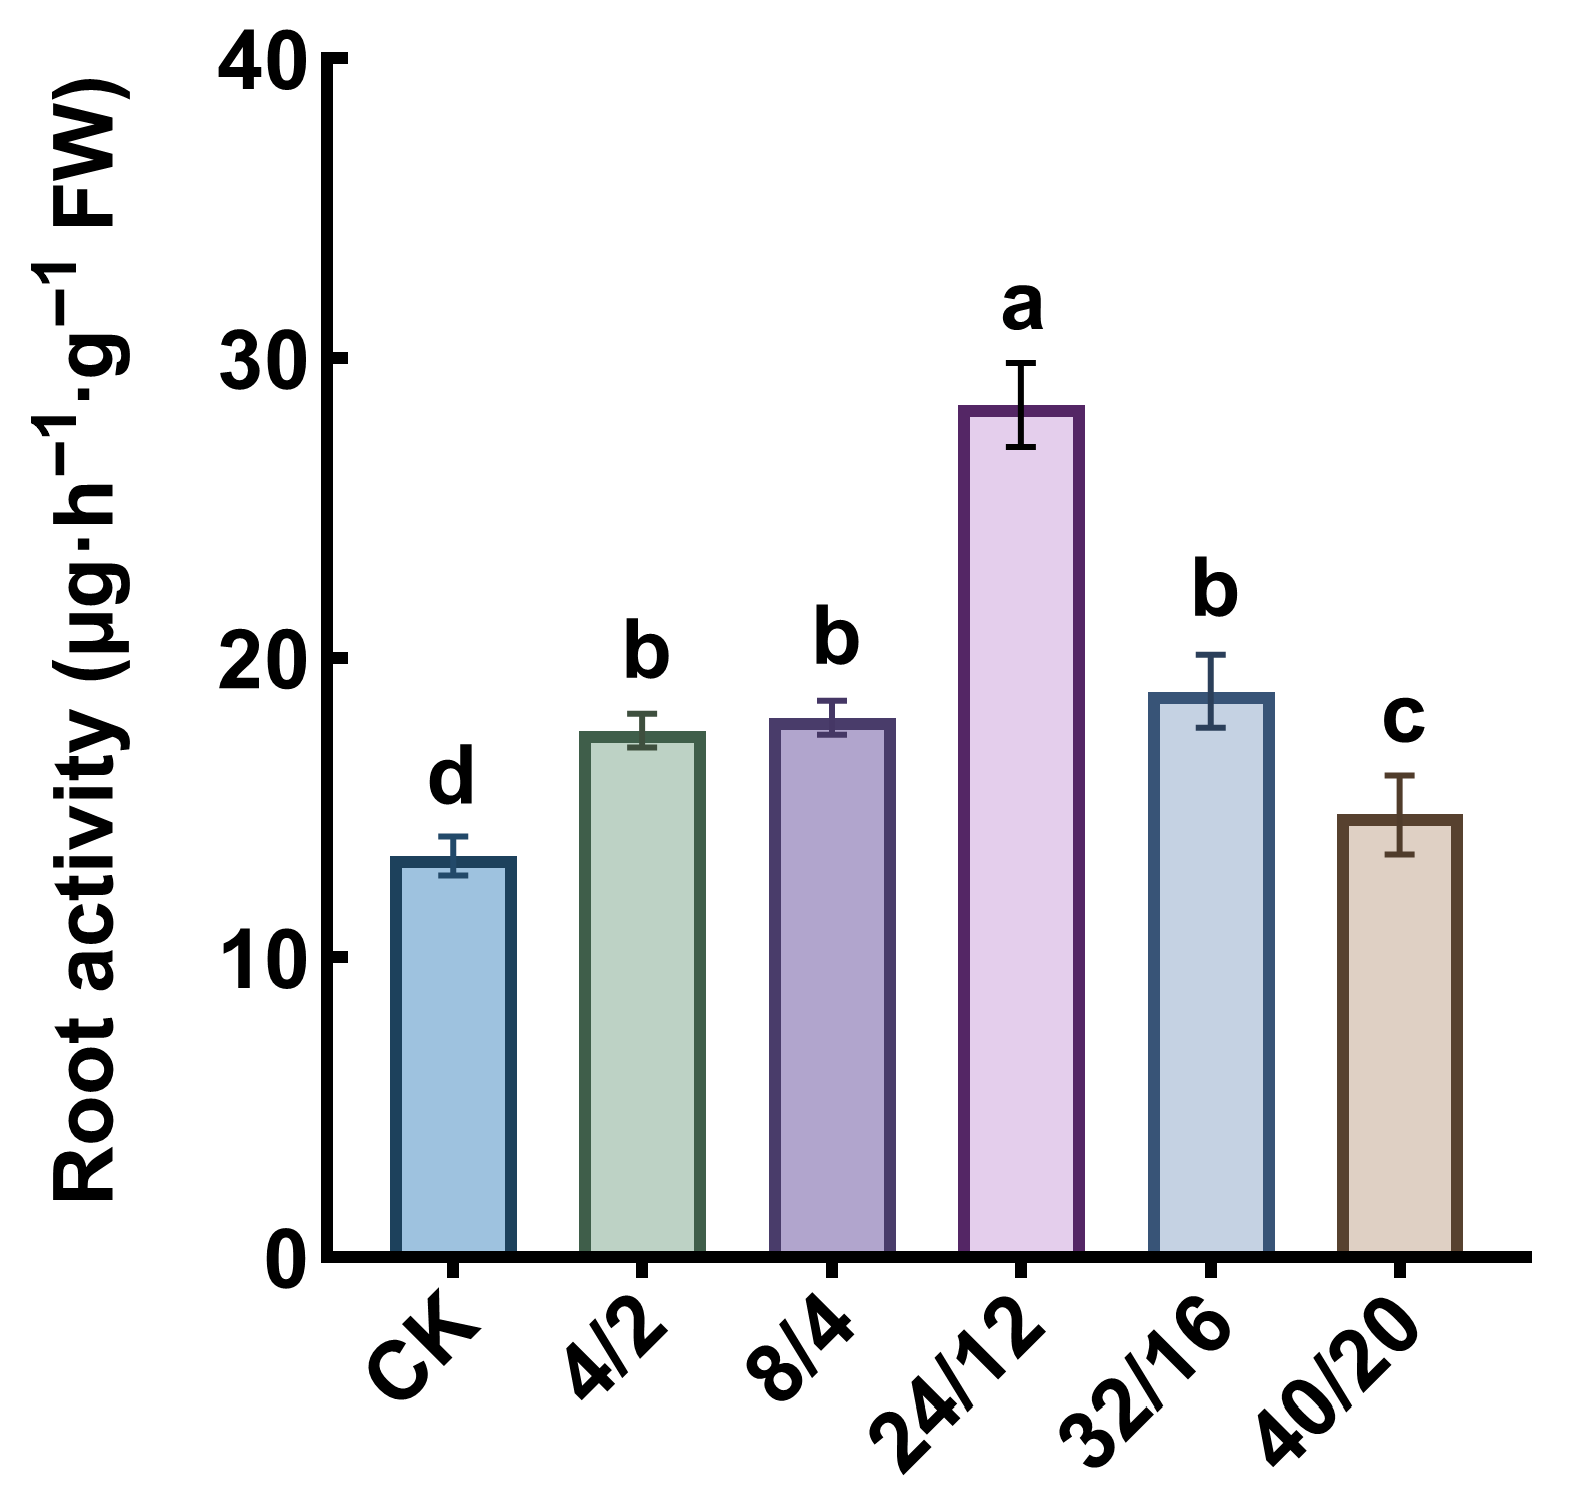
In Figure 4, with increasing light–dark cycle length, the root activity of celery first increased and then decreased, reaching a maximum of 28.4 μg·h−1·g−1 under the 24 h/12 h treatment, which was 112.4% higher than CK. No significant differences were observed among the 4 h/2 h, 8 h/4 h, and 32 h/16 h treatments. The results show that the 24 h/12 h treatment effectively improved the root activity of celery.

3.3. Effects of Light–Dark Cycle on Photosynthetic Parameters and Chlorophyll Fluorescence

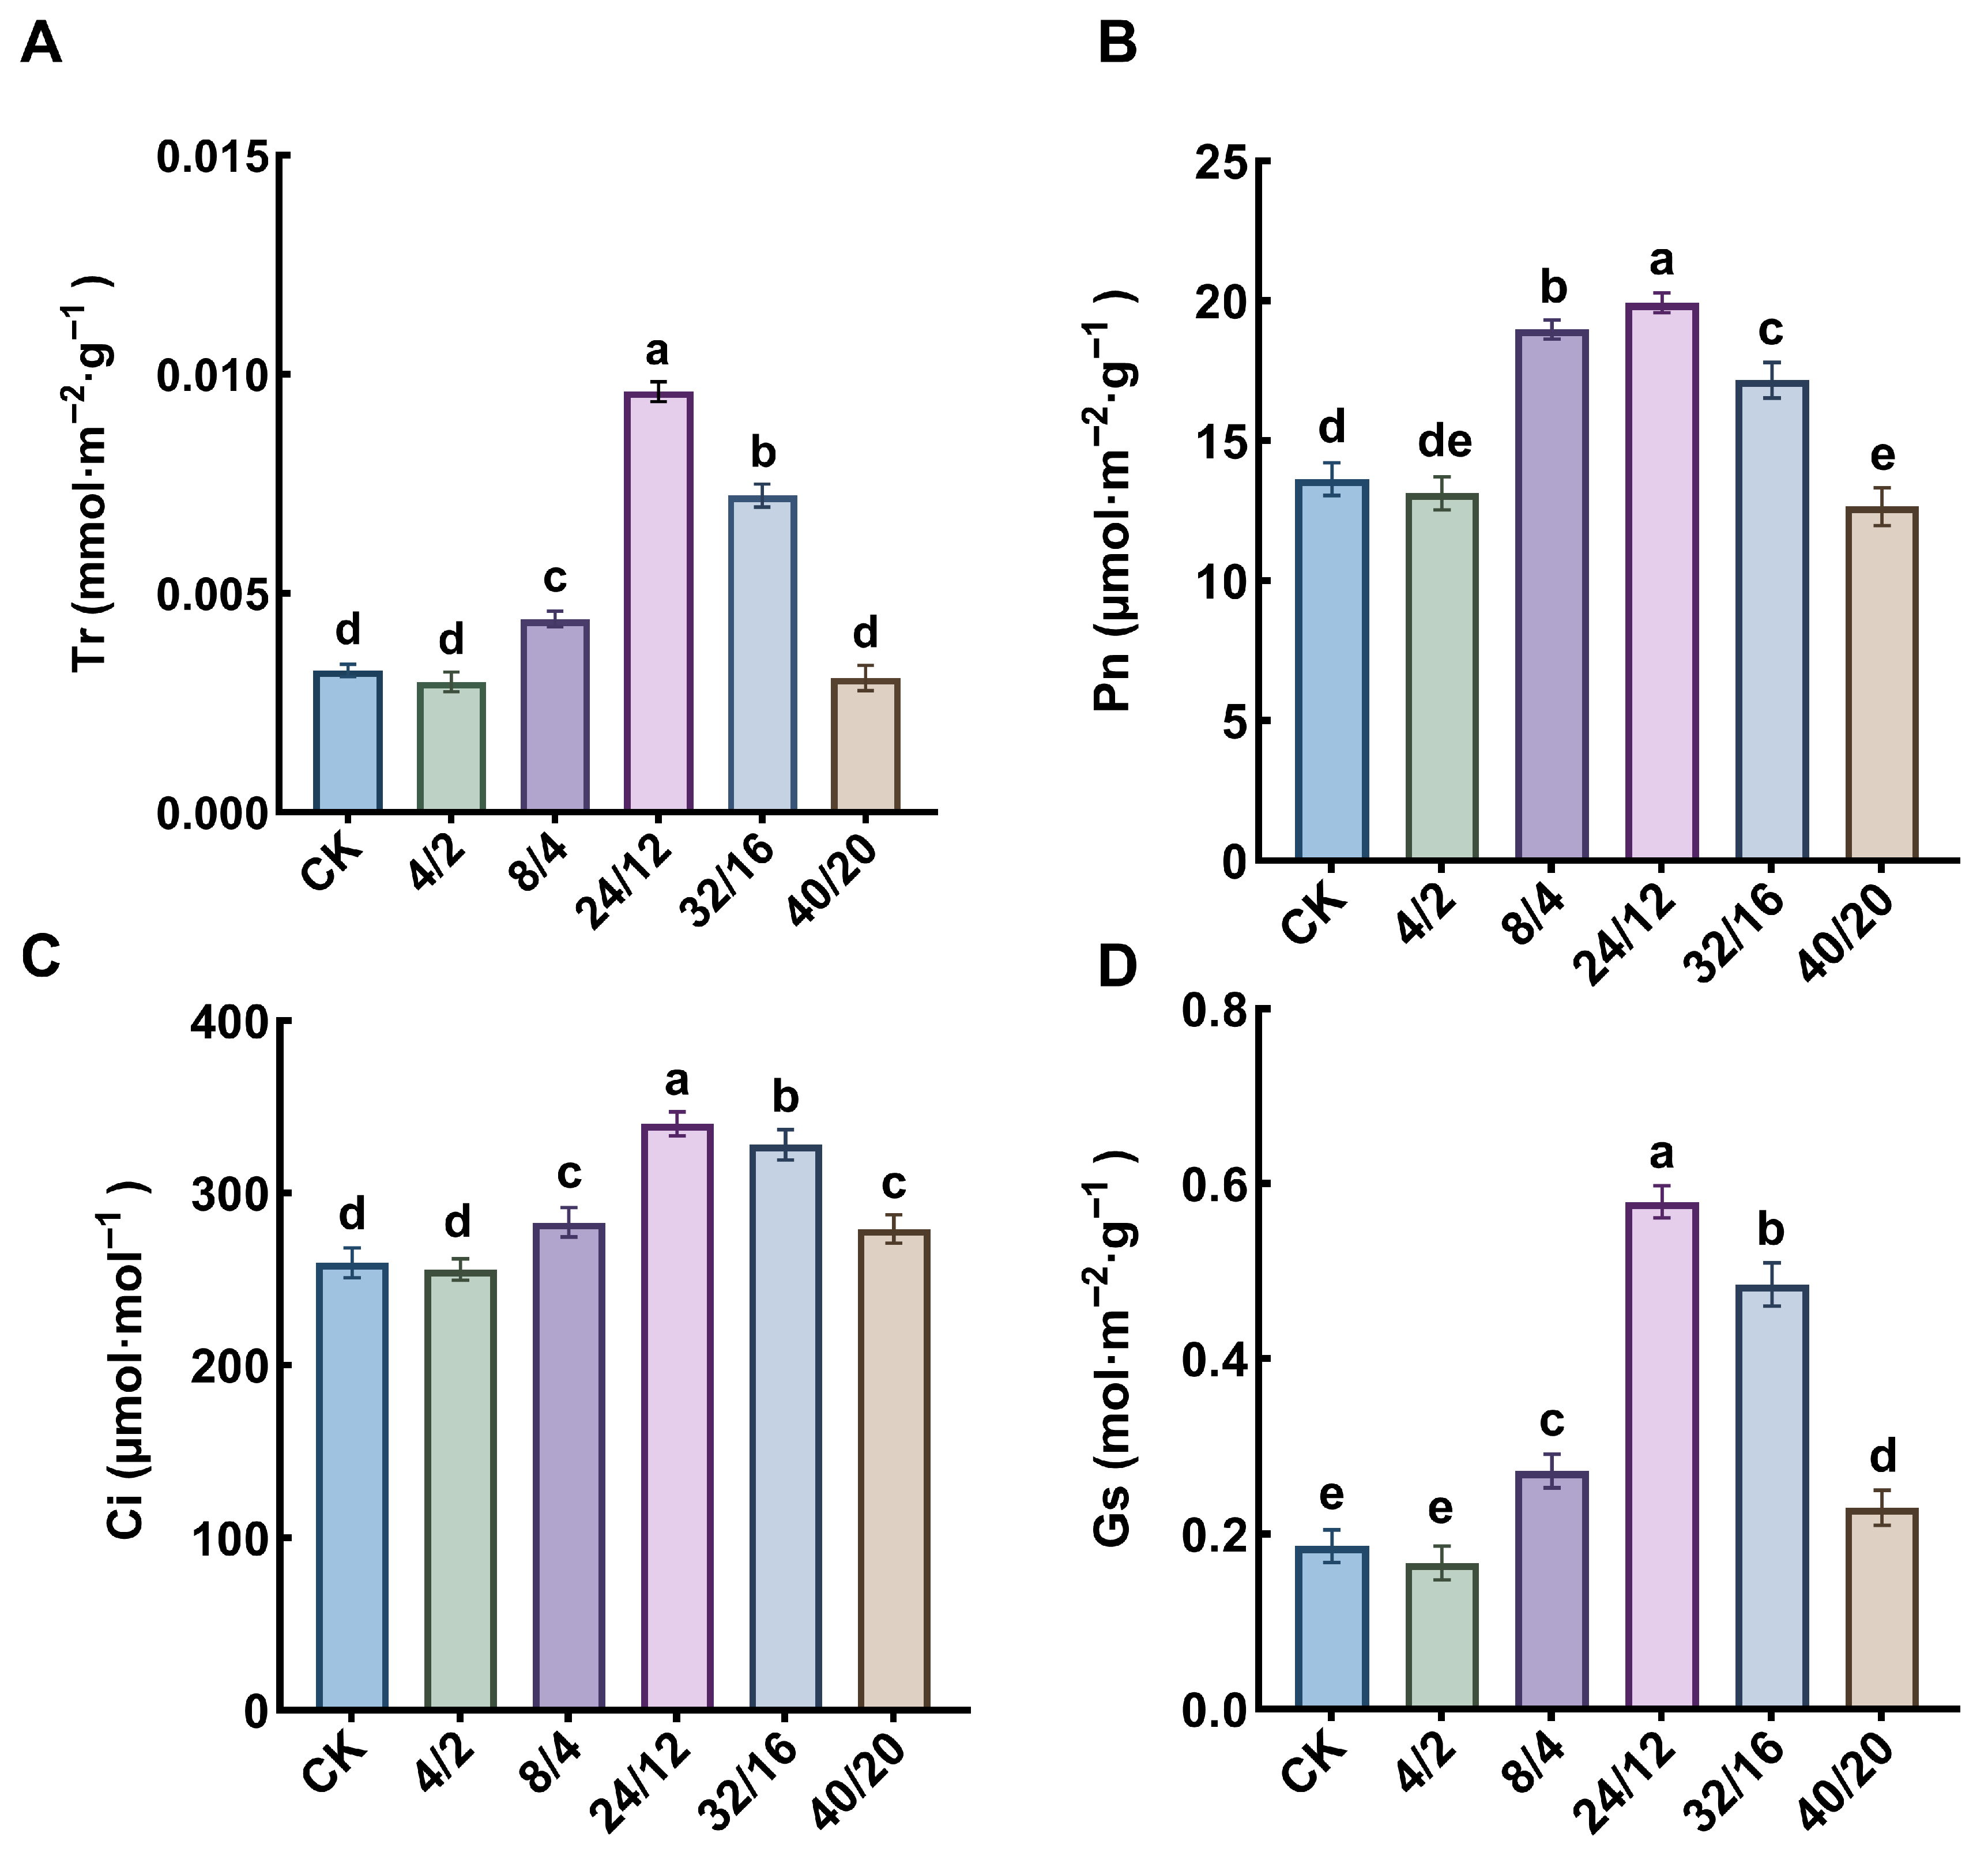
In Figure 5, Pn (Figure 5B) reached its highest value of 19.9 μmol·m−2·g−1 in the 24 h/12 h treatment, which was higher than CK by 46.1%. In contrast, Pn was lowest under the 40 h/20 h treatment, showing 7.2% lower than CK. For Gs (Figure 5D), the 8 h/4 h, 24 h/12 h, 32 h/16 h, and 40 h/20 h treatments were all significantly higher than CK, with increases of 46.3%, 211.1%, 160.6%, and 23.8%, respectively. The lowest Gs (0.17 mol·m−2·s−1) was recorded under the 4 h/2 h treatment. In terms of Ci (Figure 5C), the 24 h/12 h treatment showed the highest value at 340.1 μmol·mol−1, which was 31.1% higher than CK. Additionally, Ci values under the 8 h/4 h and 40 h/20 h treatments were also higher than CK, while the 4 h/2 h treatment showed no significant difference. For Tr (Figure 5A), there were no significant differences between the 4 h/2 h and 40 h/20 h treatments compared to the CK. The 24 h/12 h treatment group showed a 196.2% increase compared to the CK. A longer light exposure period facilitates complete photosynthesis, while moderate darkness ensures plant metabolism and energy storage, thereby enhancing photosynthetic efficiency. Overall, the 24 h/12 h treatment was most beneficial for improving photosynthetic parameters in celery.
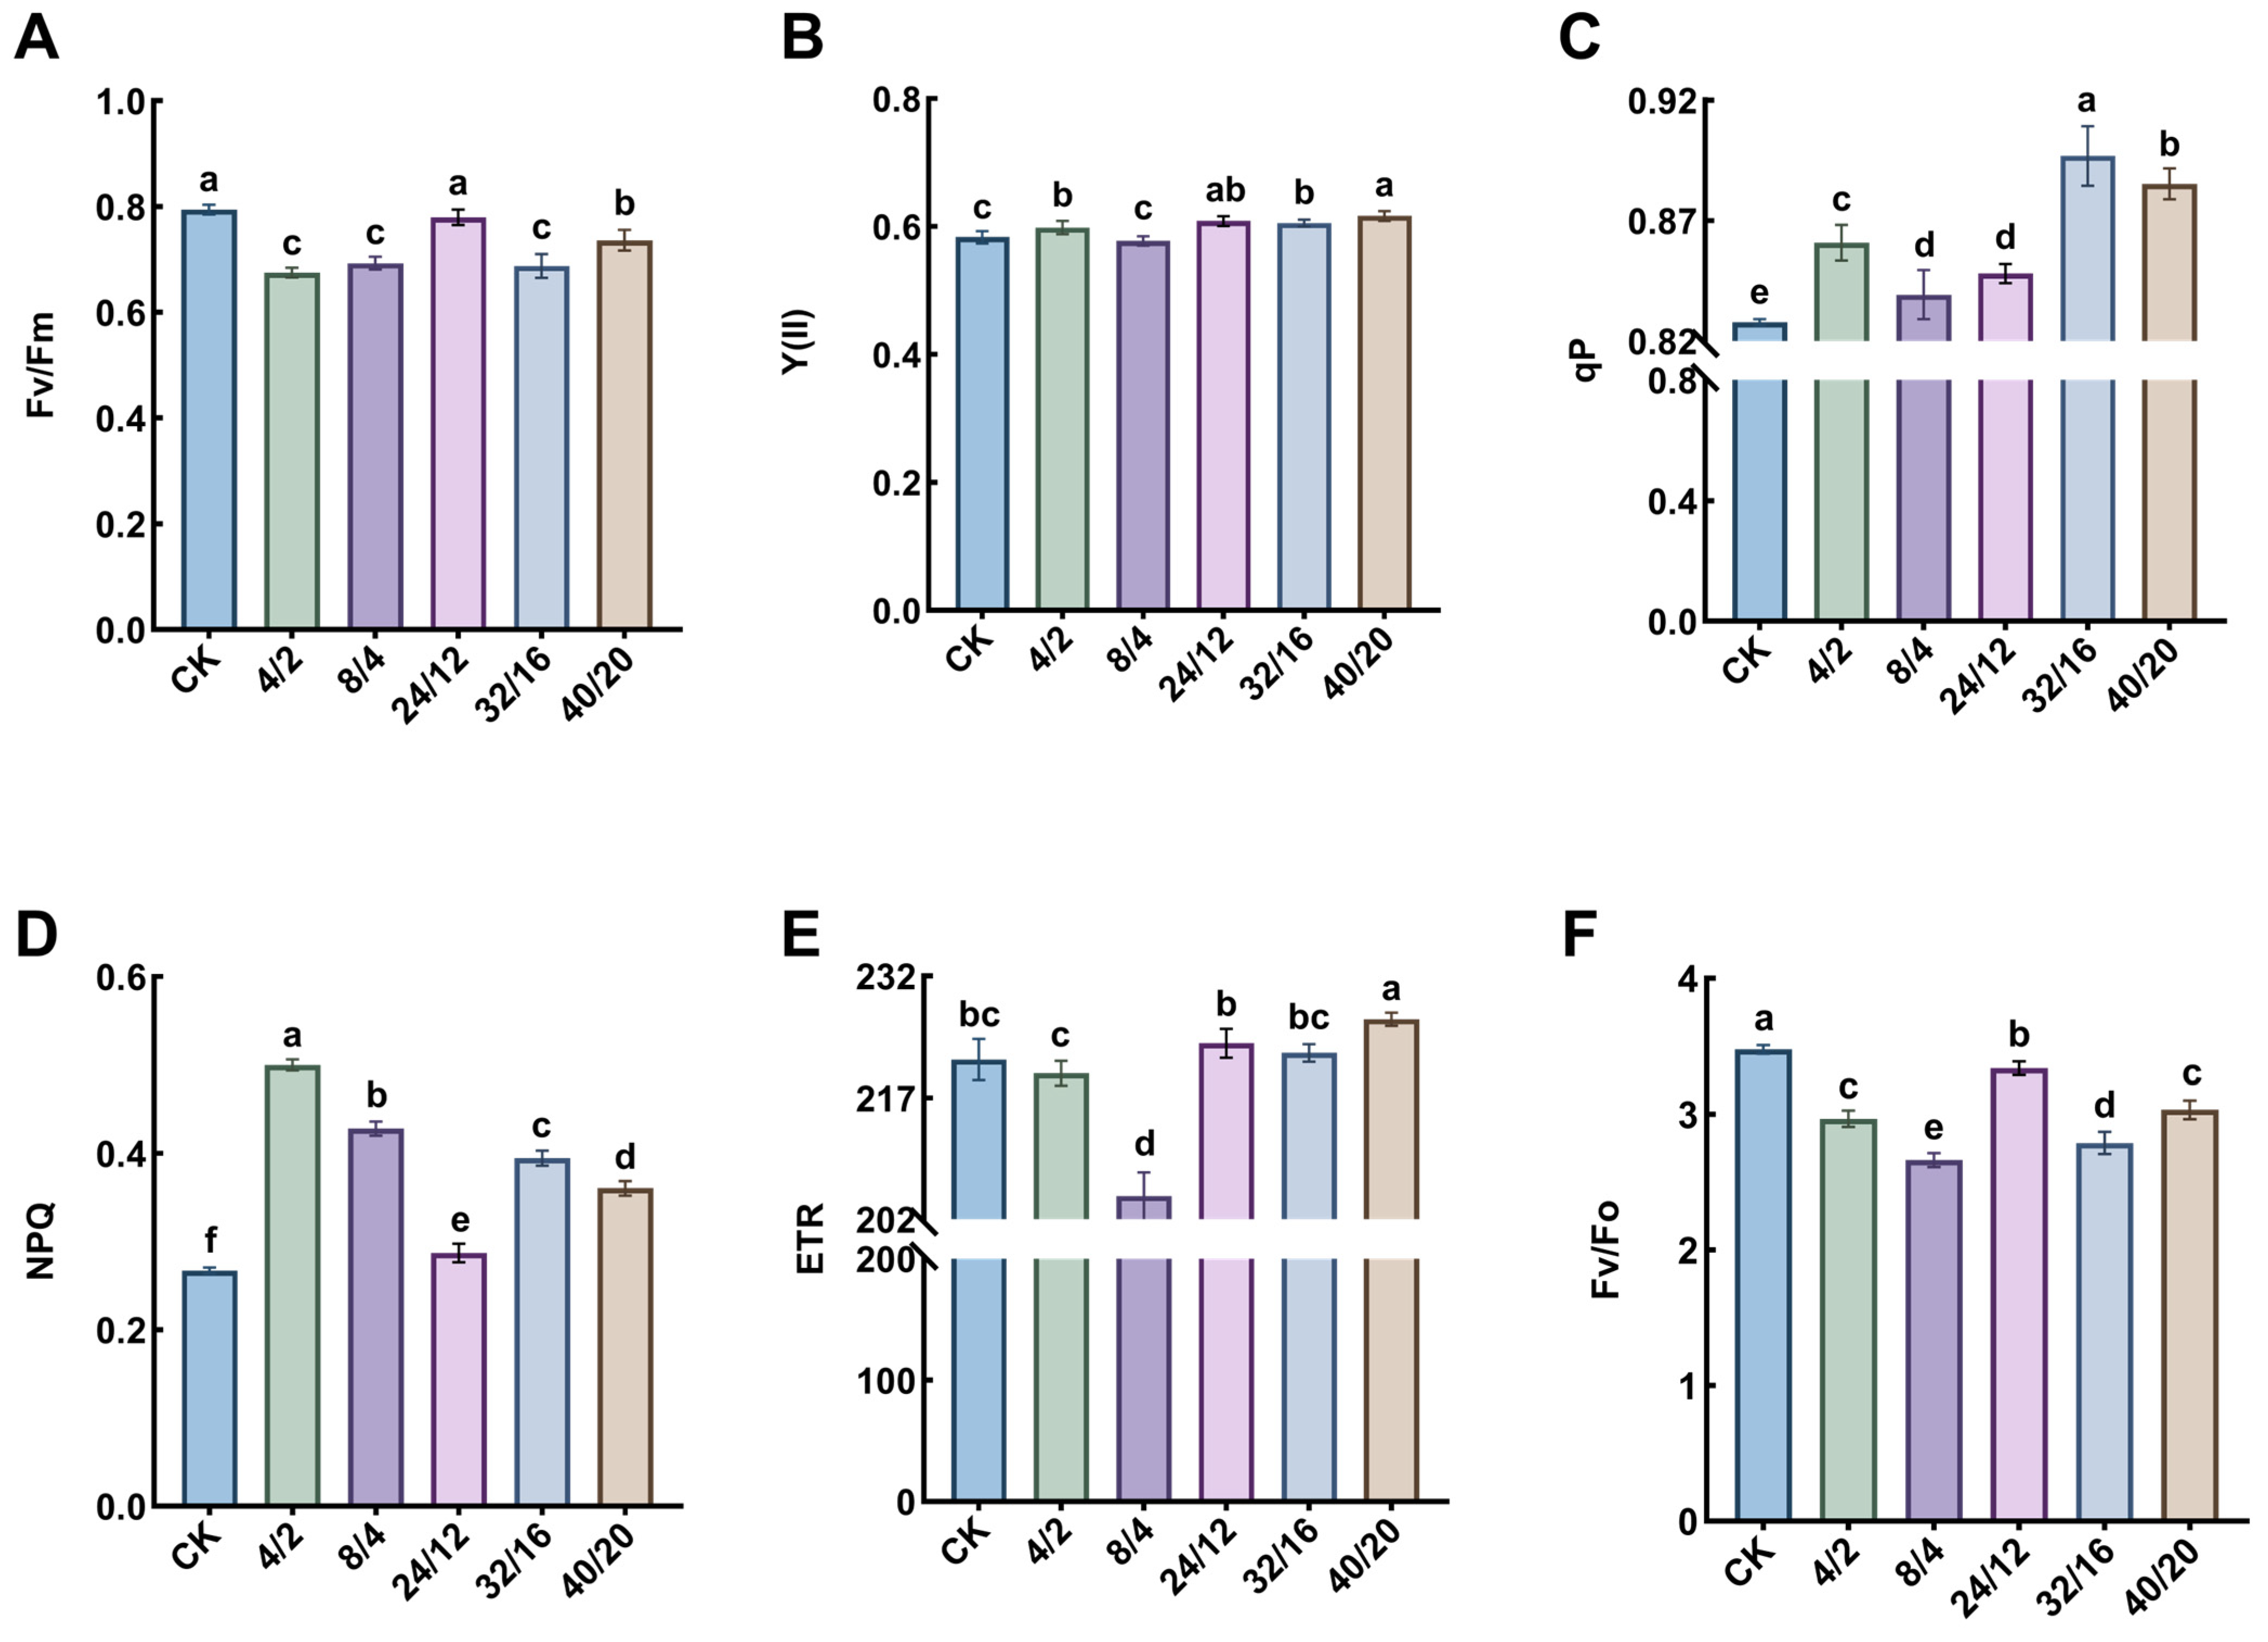
According to Figure 6, Fv/Fm (Figure 6A) and Fv/Fo (Figure 6F) were lower than CK under different light–dark cycle treatments. For Y (II) (Figure 6B) and ETR (Figure 6E), the 24 h/12 h, 32 h/16 h, and 40 h/20 h treatments progressively improved relative to CK, reaching maximum values under 40 h/20 h treatment with significant increases of 5.7% and 2.3%, respectively. In terms of qP (Figure 6C) and NPQ (Figure 6D), different light–dark cycle treatments exhibited significantly higher values than CK. The results indicate that the 24 h/12 h treatment effectively enhanced chlorophyll fluorescence efficiency in celery.

3.4. Effects of Light–Dark Cycle on Photosynthetic Pigments

Table 2 showed that the content of these photosynthetic pigments exhibits a parabolic pattern as the light–dark cycle increases, peaking under the 8 h/4 h treatment with significant increases of 41.0%, 51.6%, 44.8%, and 41.7% relative to CK. Photosynthetic pigment content was lowest under the 40 h/20 h treatment, potentially indicating that extended darkness inhibits chlorophyll synthesis. Other light–dark cycle treatments demonstrated significantly higher pigment content than CK, with considerable variation among treatments. These results indicate that the 8 h/4 h treatment was the most effective in promoting photosynthetic pigment synthesis in celery.

3.5. Effect of Light–Dark Cycle on Antioxidase and MDA

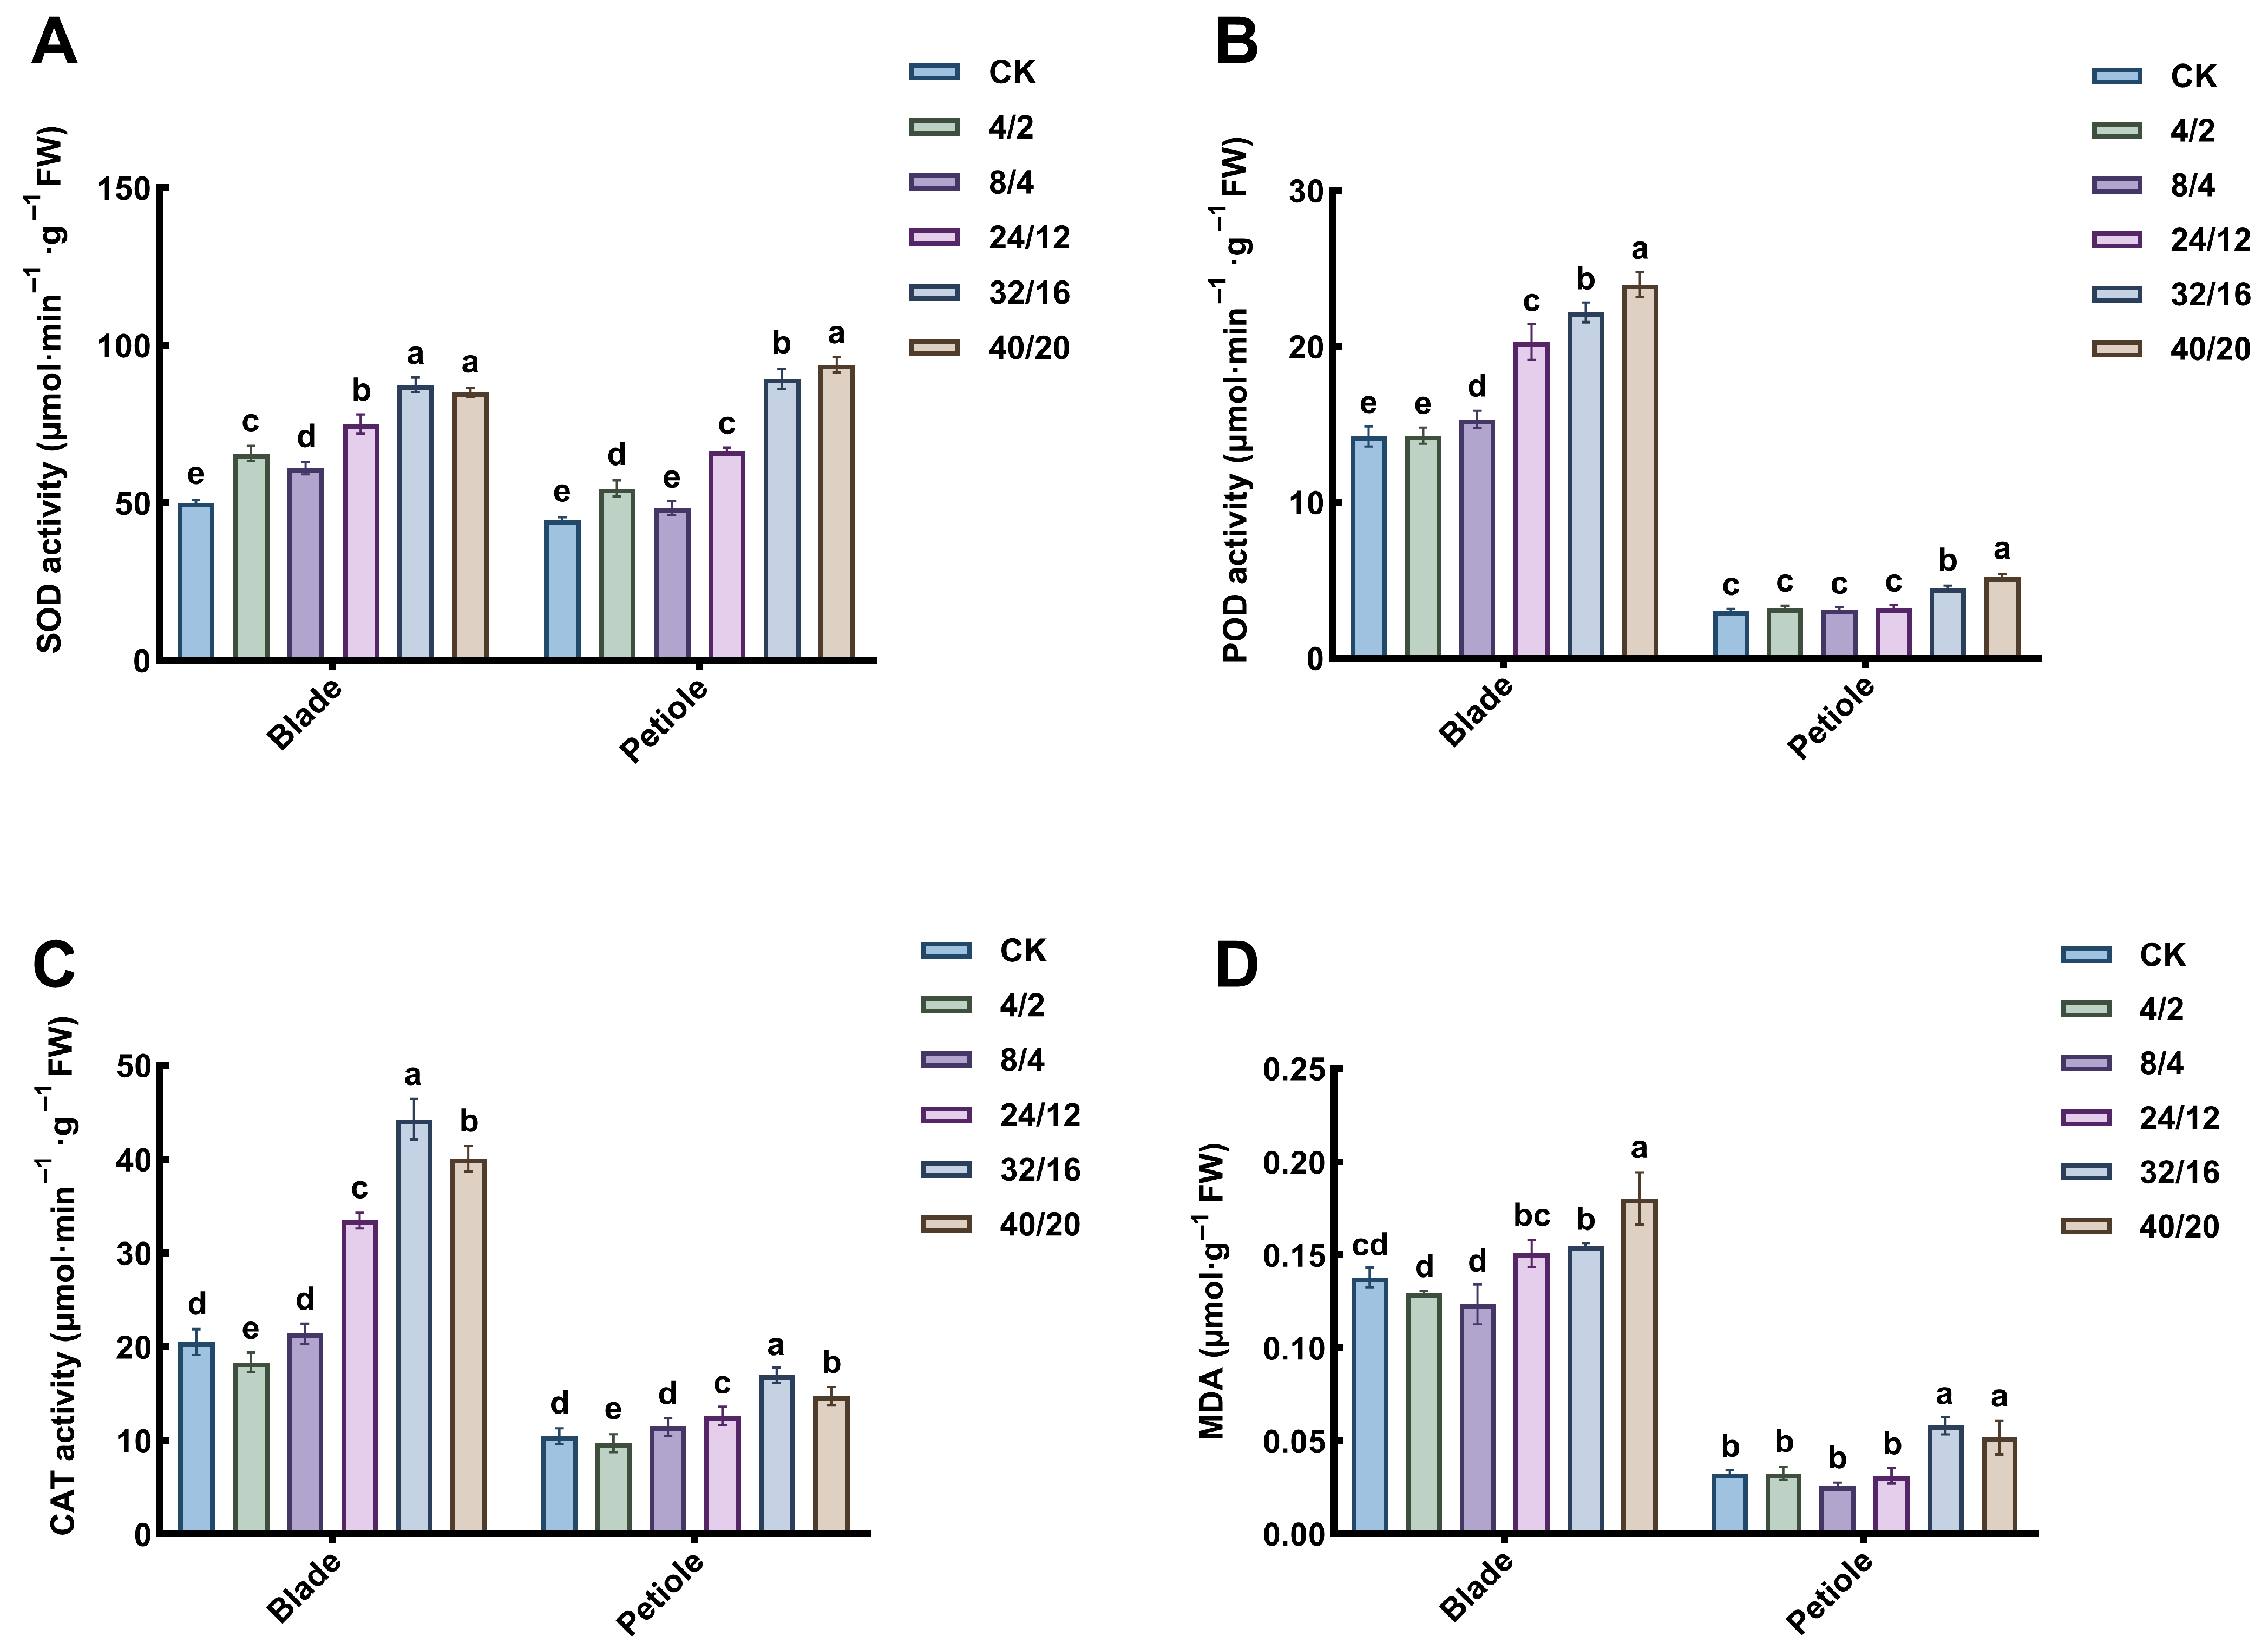
From Figure 7, for SOD (Figure 7A), SOD activity in blades exceeded that in petioles across all treatments except for the 32 h/16 h and the 40 h/20 h. In leaf blades, all treatments showed significantly higher SOD activity than CK, with the 32 h/16 h and 40 h/20 h treatments showing increases of 74.6% and 69.8%, respectively. In petioles, SOD activity was significantly higher than CK under all treatments except for the 8 h/4 h cycle. Under 40 h/20 h treatment, SOD activity reached the highest level of 93.8 μmol·min−1·g−1, significantly exceeding CK by 110.4%. In celery leaves, POD activity (Figure 7B) increased progressively with extended darkness, with all treatments except the 4 h/2 h treatment showing significantly higher values than CK. Under the 40 h/20 h treatment, POD activity peaked at 24.0 μmol·min−1·g−1, representing a 68.5% increase compared with CK. Under 40 h/20 h treatment, POD activity reached 5.2 μmol·min−1·g−1, followed by the 32 h/16 h treatment at 4.5 μmol·min−1·g−1, both significantly higher than CK. In celery blades, CAT activity (Figure 7C) peaked at 44.3 μmol·min−1·g−1 under the 32 h/16 h treatment (115.8% higher than CK), while the minimum under the 4 h/2 h treatment was 18.3 μmol·min−1·g−1 (10.6% lower than CK). In petioles, no significant differences were observed among the 4 h/2 h, 8 h/4 h, and CK treatments. For petioles, CAT activity peaked under the 32 h/16 h treatment (17.0 μmol·min−1·g−1), with the 40 h/20 h and 24 h/12 h treatments showing increases of 61.8%, 40.6%, and 20.6% relative to CK. The results indicate that both the 32 h/16 h and the 40 h/20 h treatments enhanced antioxidant enzyme activities in celery. For MDA in blades (Figure 7D), levels first decreased and then increased with longer light–dark cycles. This pattern may have resulted from prolonged light exposure, inducing membrane lipid peroxidation. Under the 40 h/20 h treatment, MDA content peaked at 0.18 μmol·g−1 (30.9% higher than CK). Both the 4 h/2 h and 8 h/4 h treatments showed lower MDA levels than CK, though not significantly. In petioles, MDA content in the 32 h/16 h and the 40 h/20 h treatments was significantly higher (79.0% and 58.9%, respectively) than CK. The 8 h/4 h and 24 h/12 h cycles showed no significant difference from CK. These findings suggest that the 32 h/16 h and 40 h/20 h treatments enhanced the antioxidant capacity of celery but also increased MDA accumulation.

3.6. Effect of Light–Dark Cycle on Proline Content

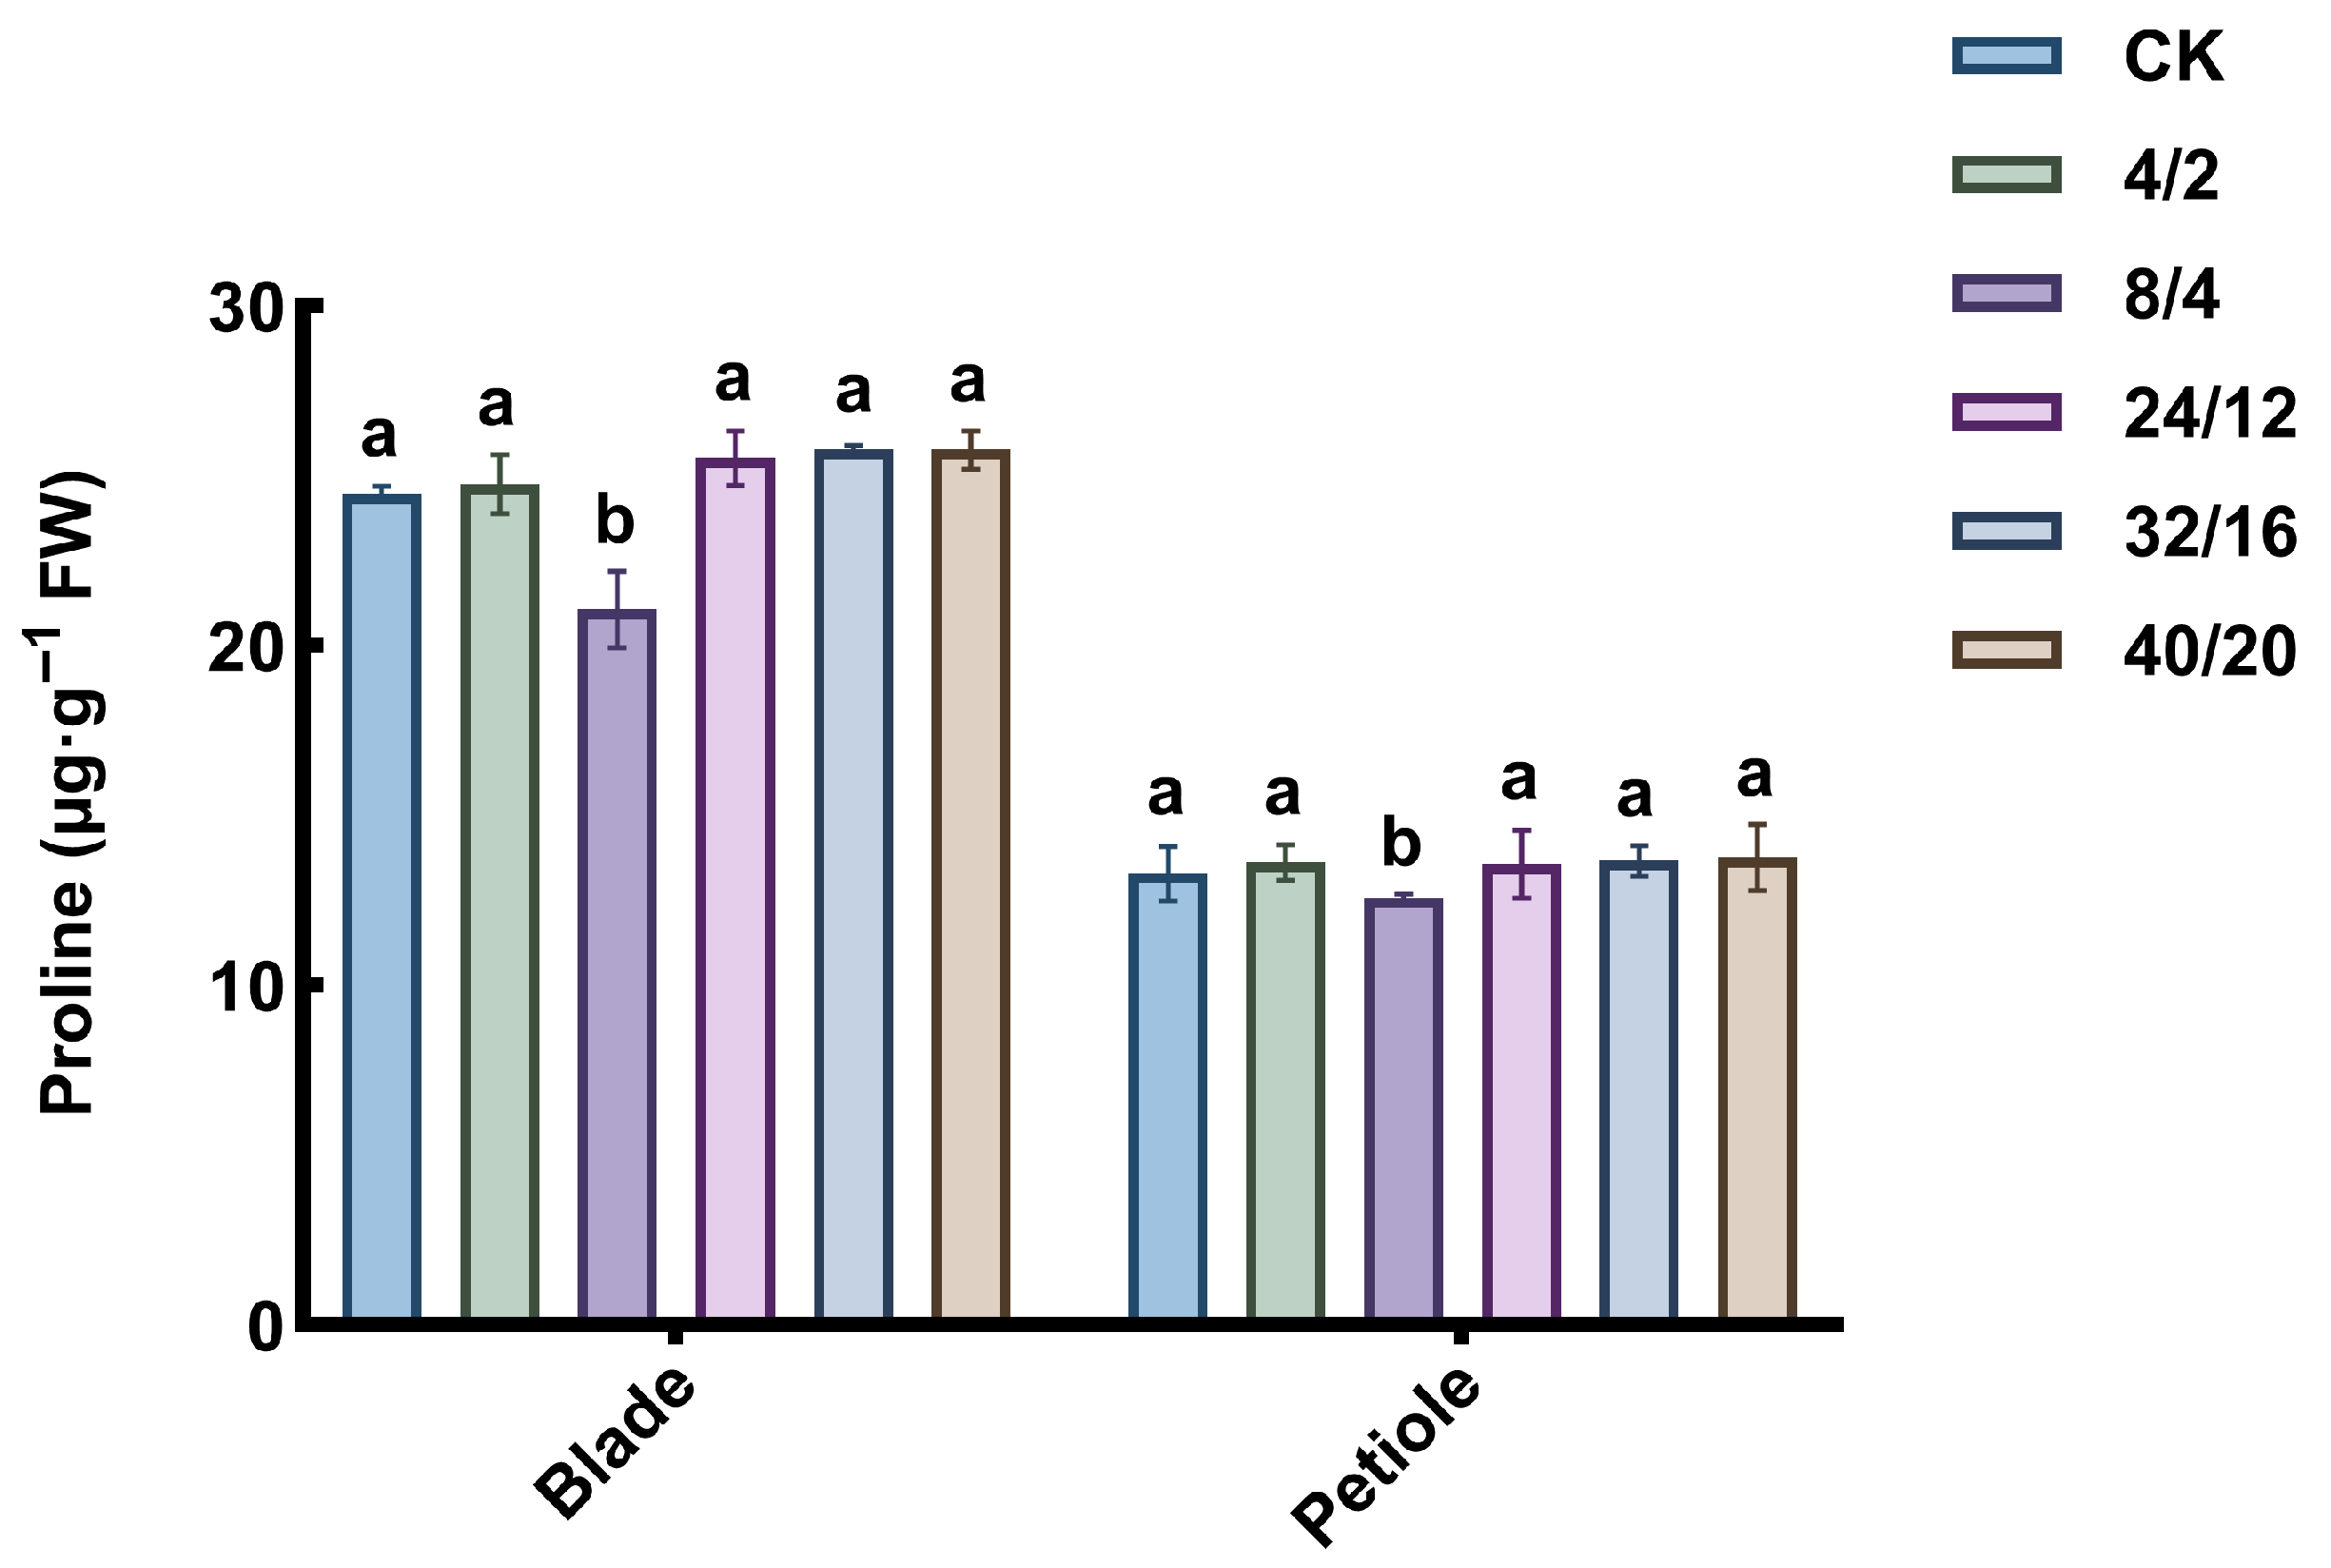
In Figure 8, proline content was lowest in both leaves and petioles under the 8 h/4 h treatment, being significantly lower than that of CK. Other treatments showed slightly higher proline levels than CK, although the differences were not statistically significant. Overall, variations in light–dark cycles had no significant effect on proline accumulation, except for the marked reduction observed under the 8 h/4 h treatment.

3.7. Effect of Light–Dark Cycle on Antioxidant Substances

As shown in Figure 9A, extended light–dark cycles (32 h/16 h and 40 h/20 h) significantly increased total phenol content in both leaf blades and petioles. Concurrently, anthocyanin content (Figure 9D) was markedly enhanced under these treatments. The petioles under the 32 h/16 h and the 40 h/20 h treatments increased by 14.0% and 21.3%, respectively, while the blades increased by 53.5% and 49.6%. Total flavonoid content (Figure 9B) and AsA (Figure 9C) content peaked under the 40 h/20 h treatment in both tissues. These results indicate that both the 32 h/16 h and 40 h/20 h light–dark cycles enhanced the accumulation of antioxidant compounds in celery.

3.8. The Effect of Light–Dark Cycle on Nutrients

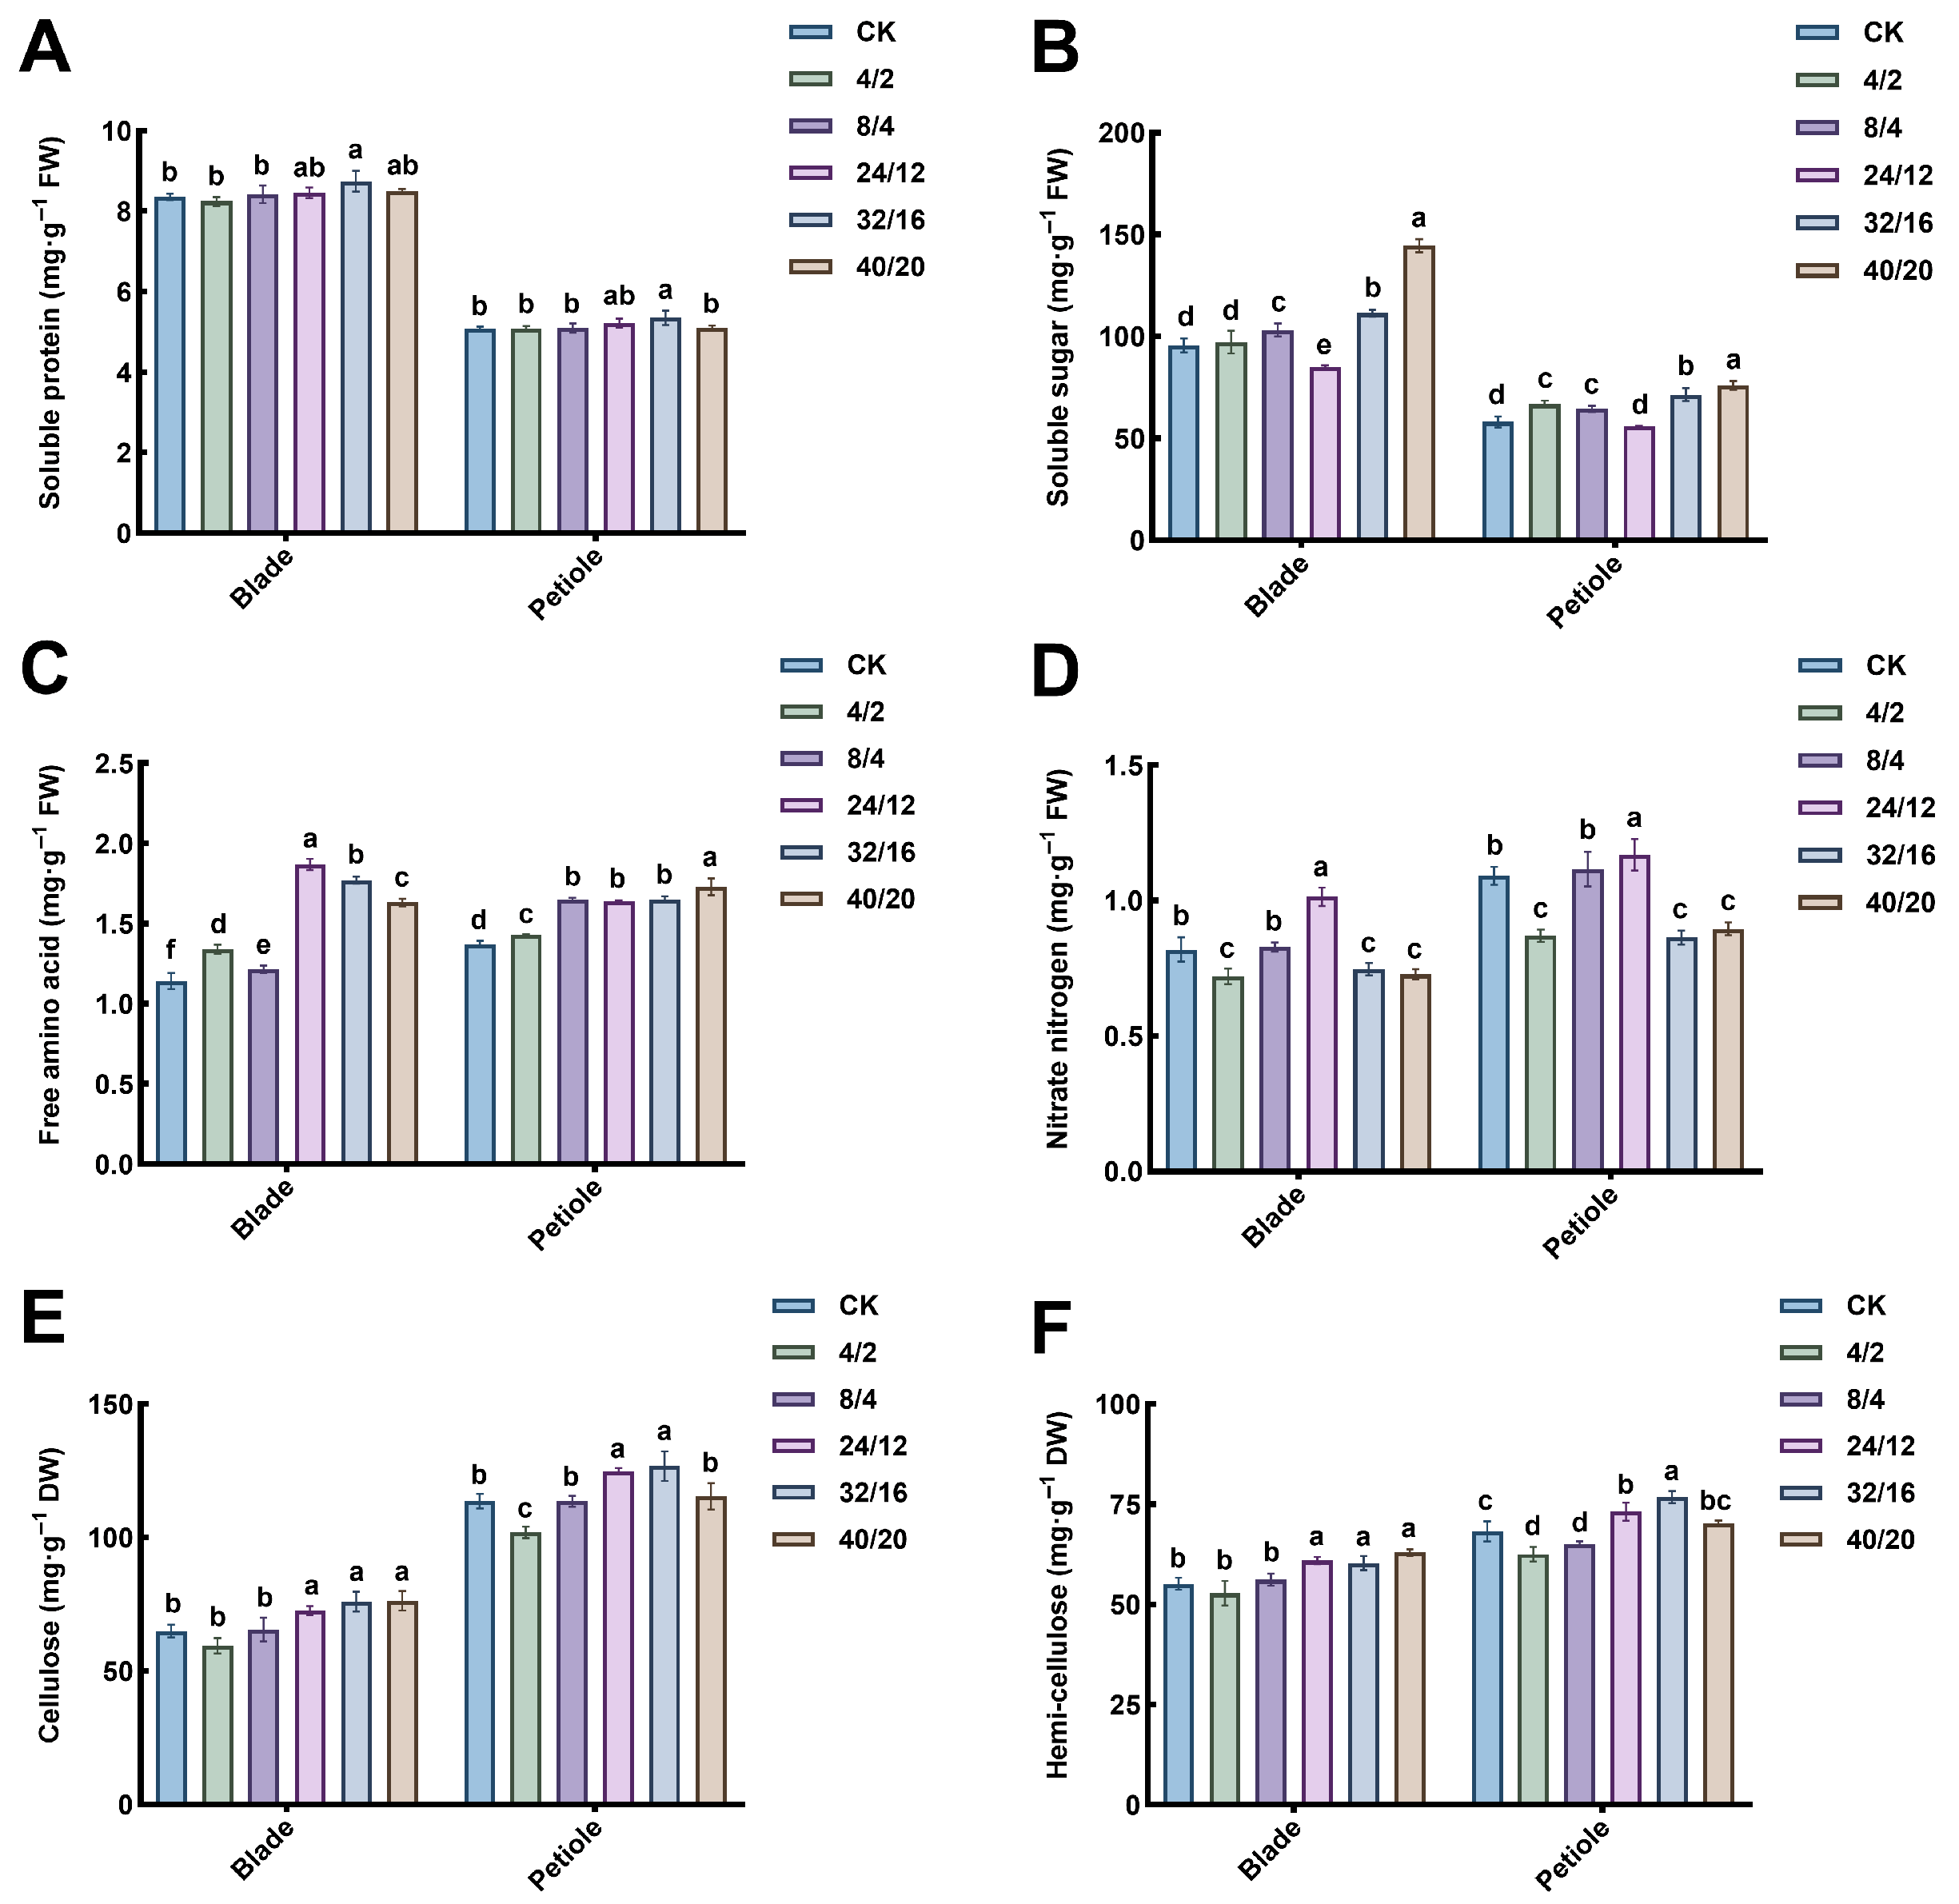
As shown in Figure 10A, under the 32 h/16 h treatment, soluble protein content peaked and was significantly higher than CK (4.7% and 5.5% increases in blades and petioles, respectively). This result may indicate balanced growth under this photoperiod, optimizing photosynthetic carbon gain while sustaining protein synthesis during the dark phase. Soluble sugar content (Figure 10B) peaked under the 40 h/20 h treatment, whereas the lowest value was recorded under the 24 h/12 h treatment. The 24 h/12 h cycle maintained the minimum level of soluble sugar accumulation. This may be attributed to elevated metabolic activity consuming photosynthates more rapidly than they were produced, despite enhanced photosynthetic efficiency. Figure 10C indicates that the content of free amino acids in celery blades and petioles increased to different degrees under different light–dark cycle treatments. The highest levels of free amino acids in both tissues were observed under the 24 h/12 h and 40 h/20 h treatments. Under the 24 h/12 h treatment, nitrate-nitrogen content (Figure 10D) peaked in blades and petioles, which was significantly higher than other treatments, and increased by 7.0% (blades) and 23.8% (petioles) over CK, possibly reflecting greater nitrogen demands during extended photoperiods for protein biosynthesis, requiring more nitrogen to be absorbed in order to synthesize more proteins and organic matter. Cellulose (Figure 10E) and hemicellulose (Figure 10F) showed parallel trends, and the content in petioles was higher than that in blades. Under the 32 h/16 h treatment, cellulose and hemicellulose content in petioles peaked at 11.5% and 12.6% above CK, respectively. These findings indicate that the 32 h/16 h light–dark cycle was optimal for enhancing nutrient synthesis and accumulation in celery.

3.9. Correlation Analysis and Principal Component Analysis

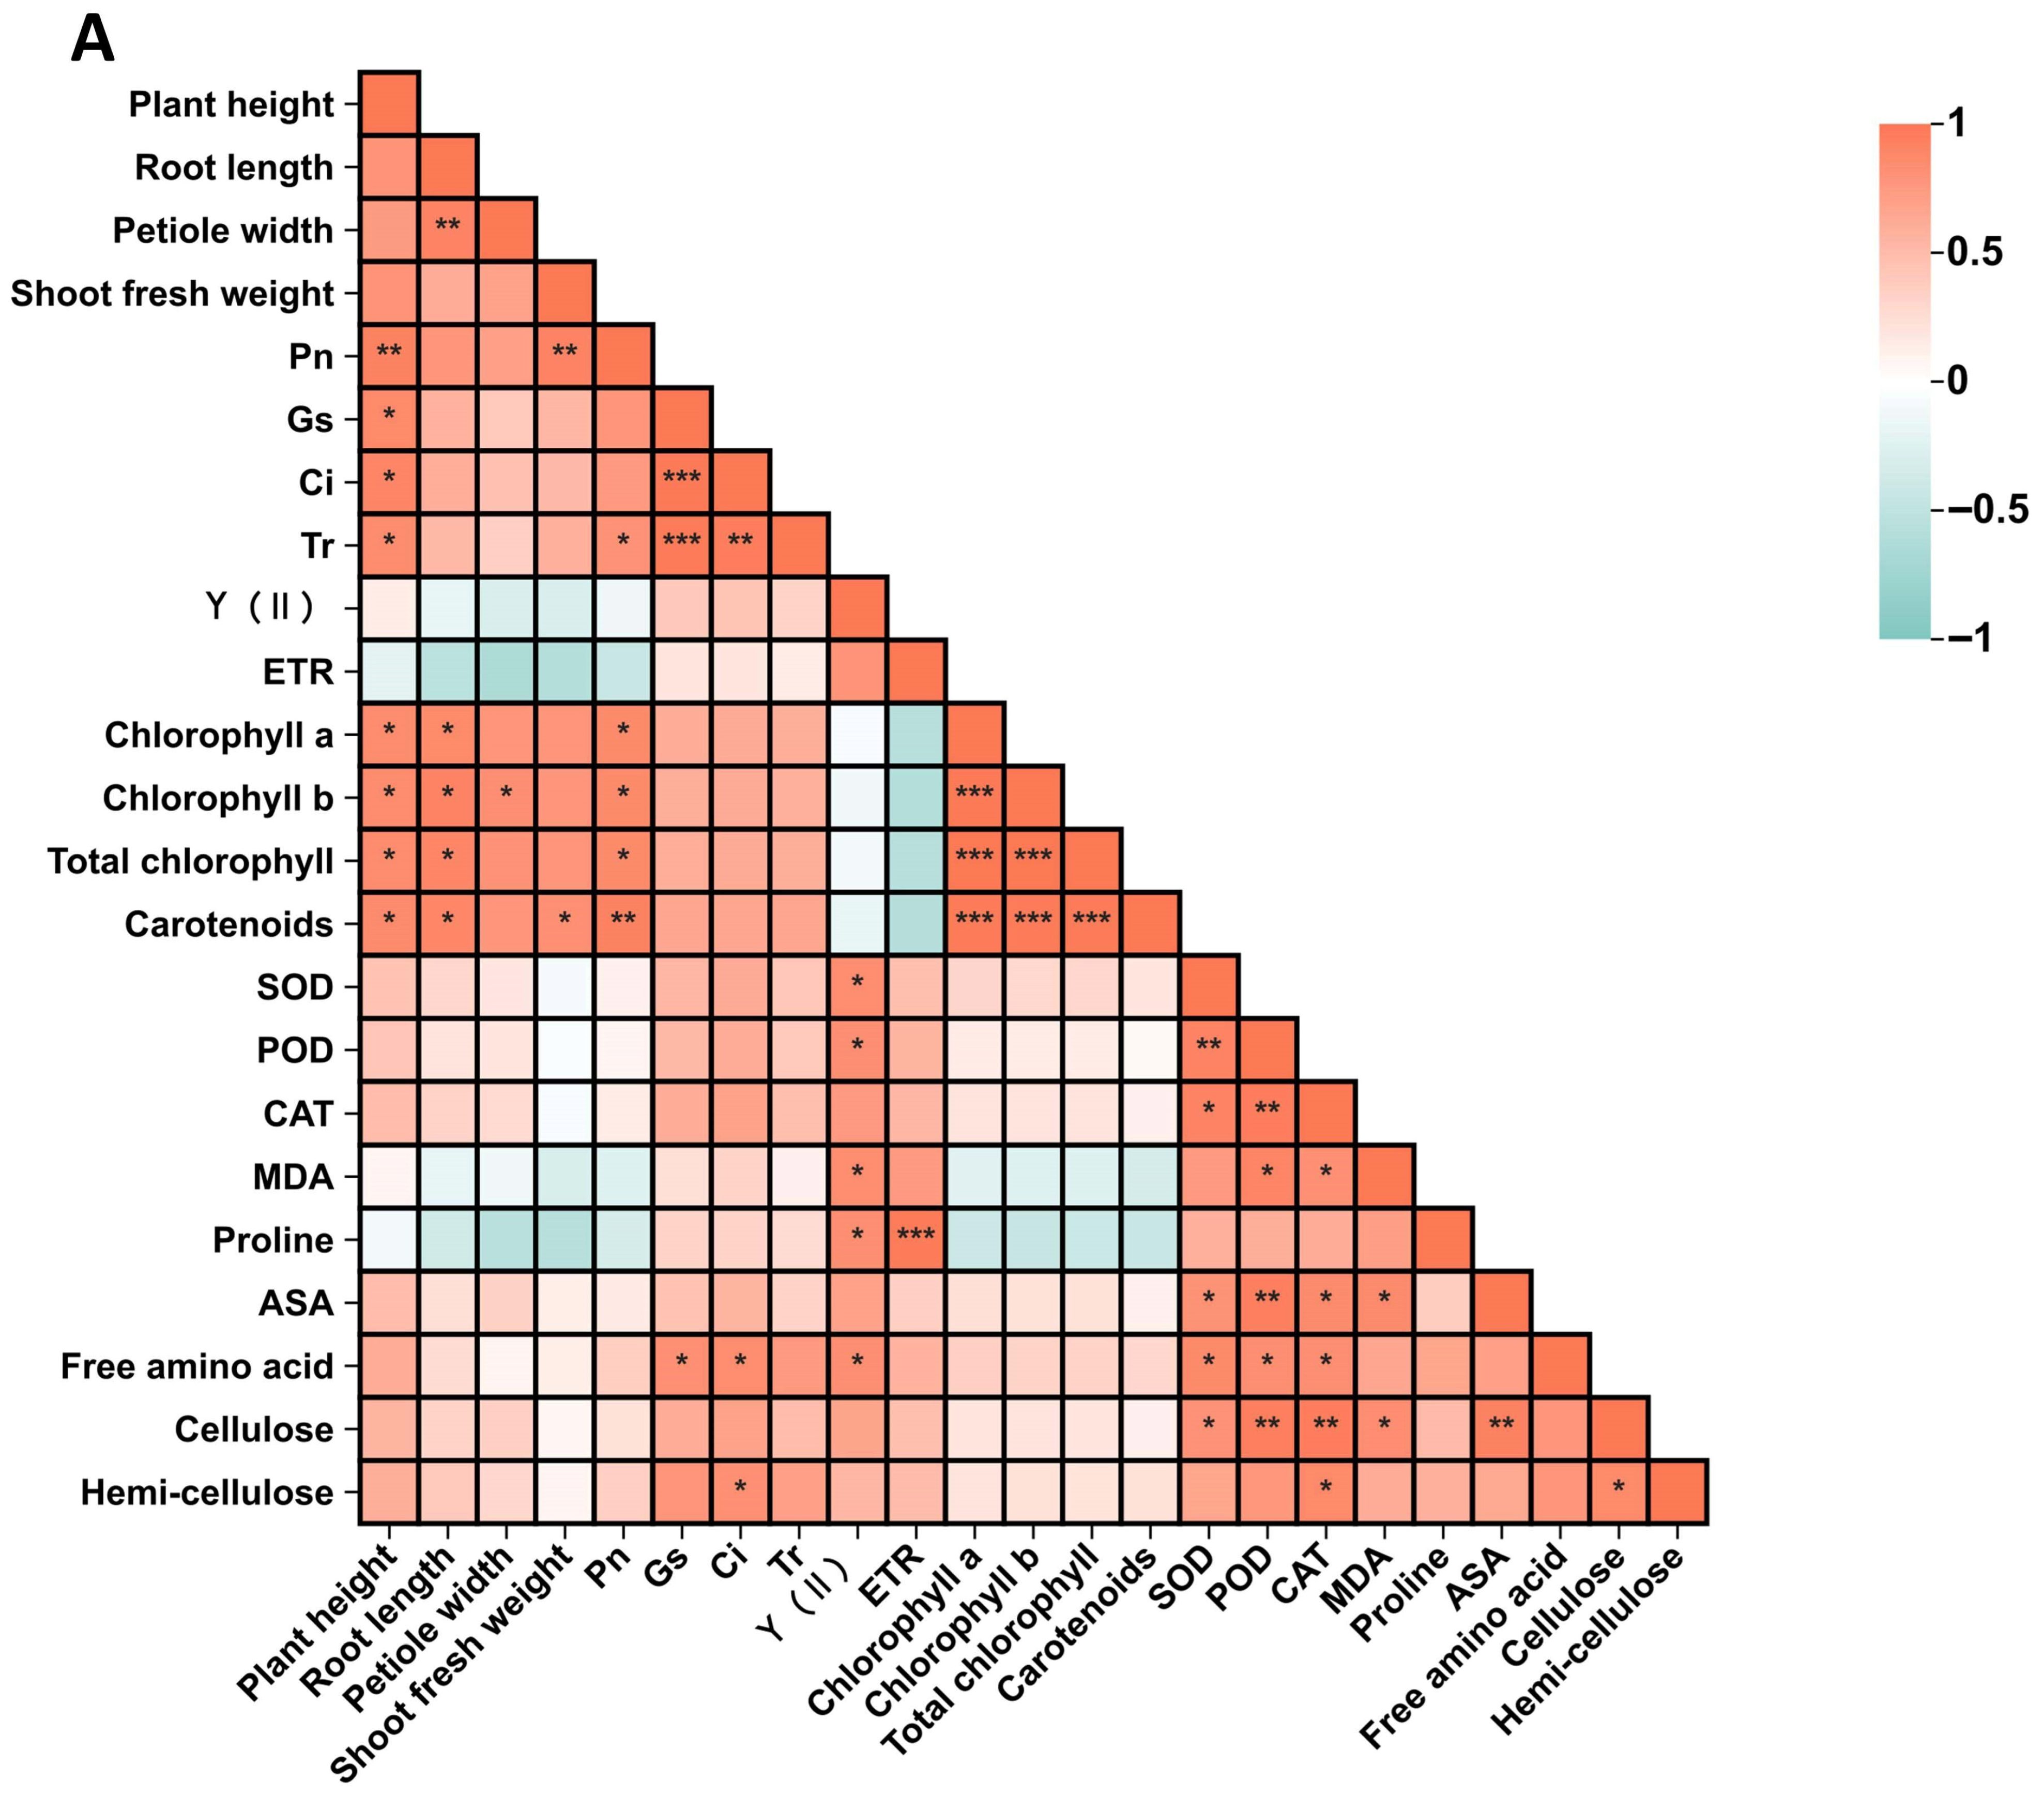
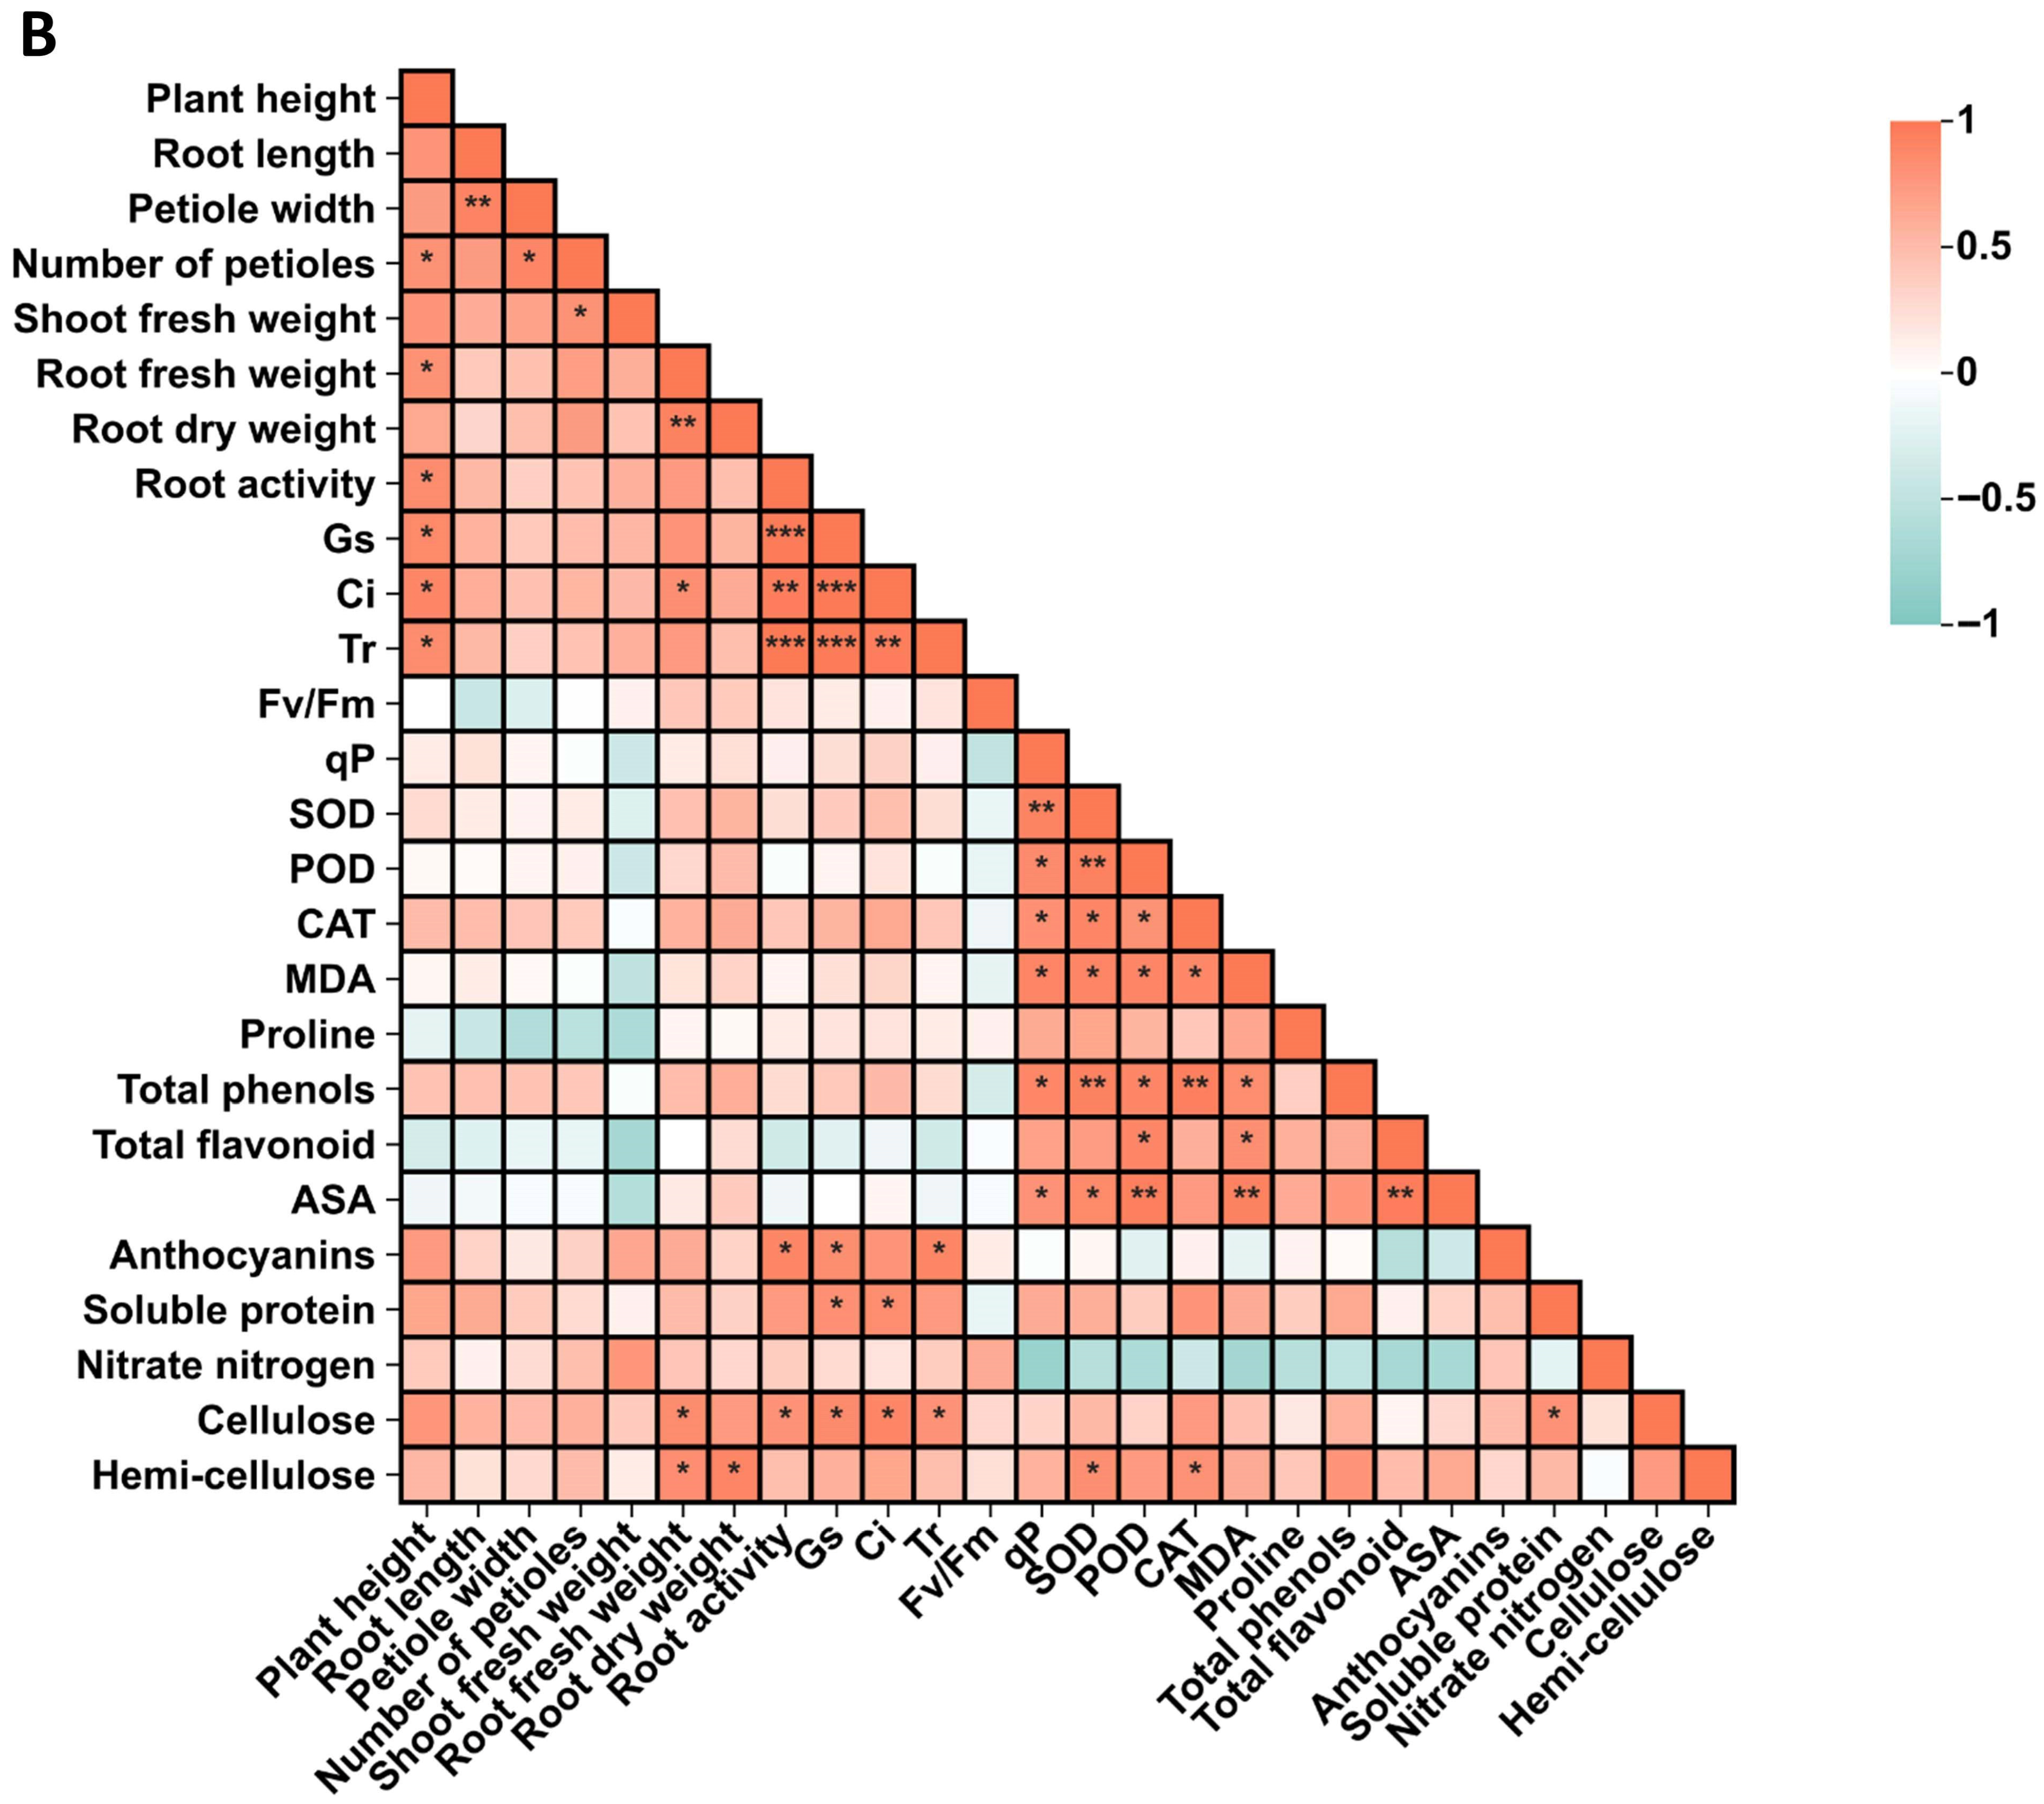
Figure 11A shows significant positive correlations between plant height and chlorophyll a, chlorophyll b, and Pn. Y(II) was positively correlated with SOD, POD, free amino acids, MDA, and proline. Carotenoid content was positively correlated with chlorophyll a, chlorophyll b, and total chlorophyll content. Gs was positively correlated with Ci, Tr, and free amino acids. Figure 11B showed that qP was significantly positively correlated with SOD, POD, CAT, AsA, and total phenols content. POD and SOD were significantly positively correlated with CAT, AsA, total phenol, and MDA. Ci was positively correlated with transpiration rate, root activity, and cellulose content.
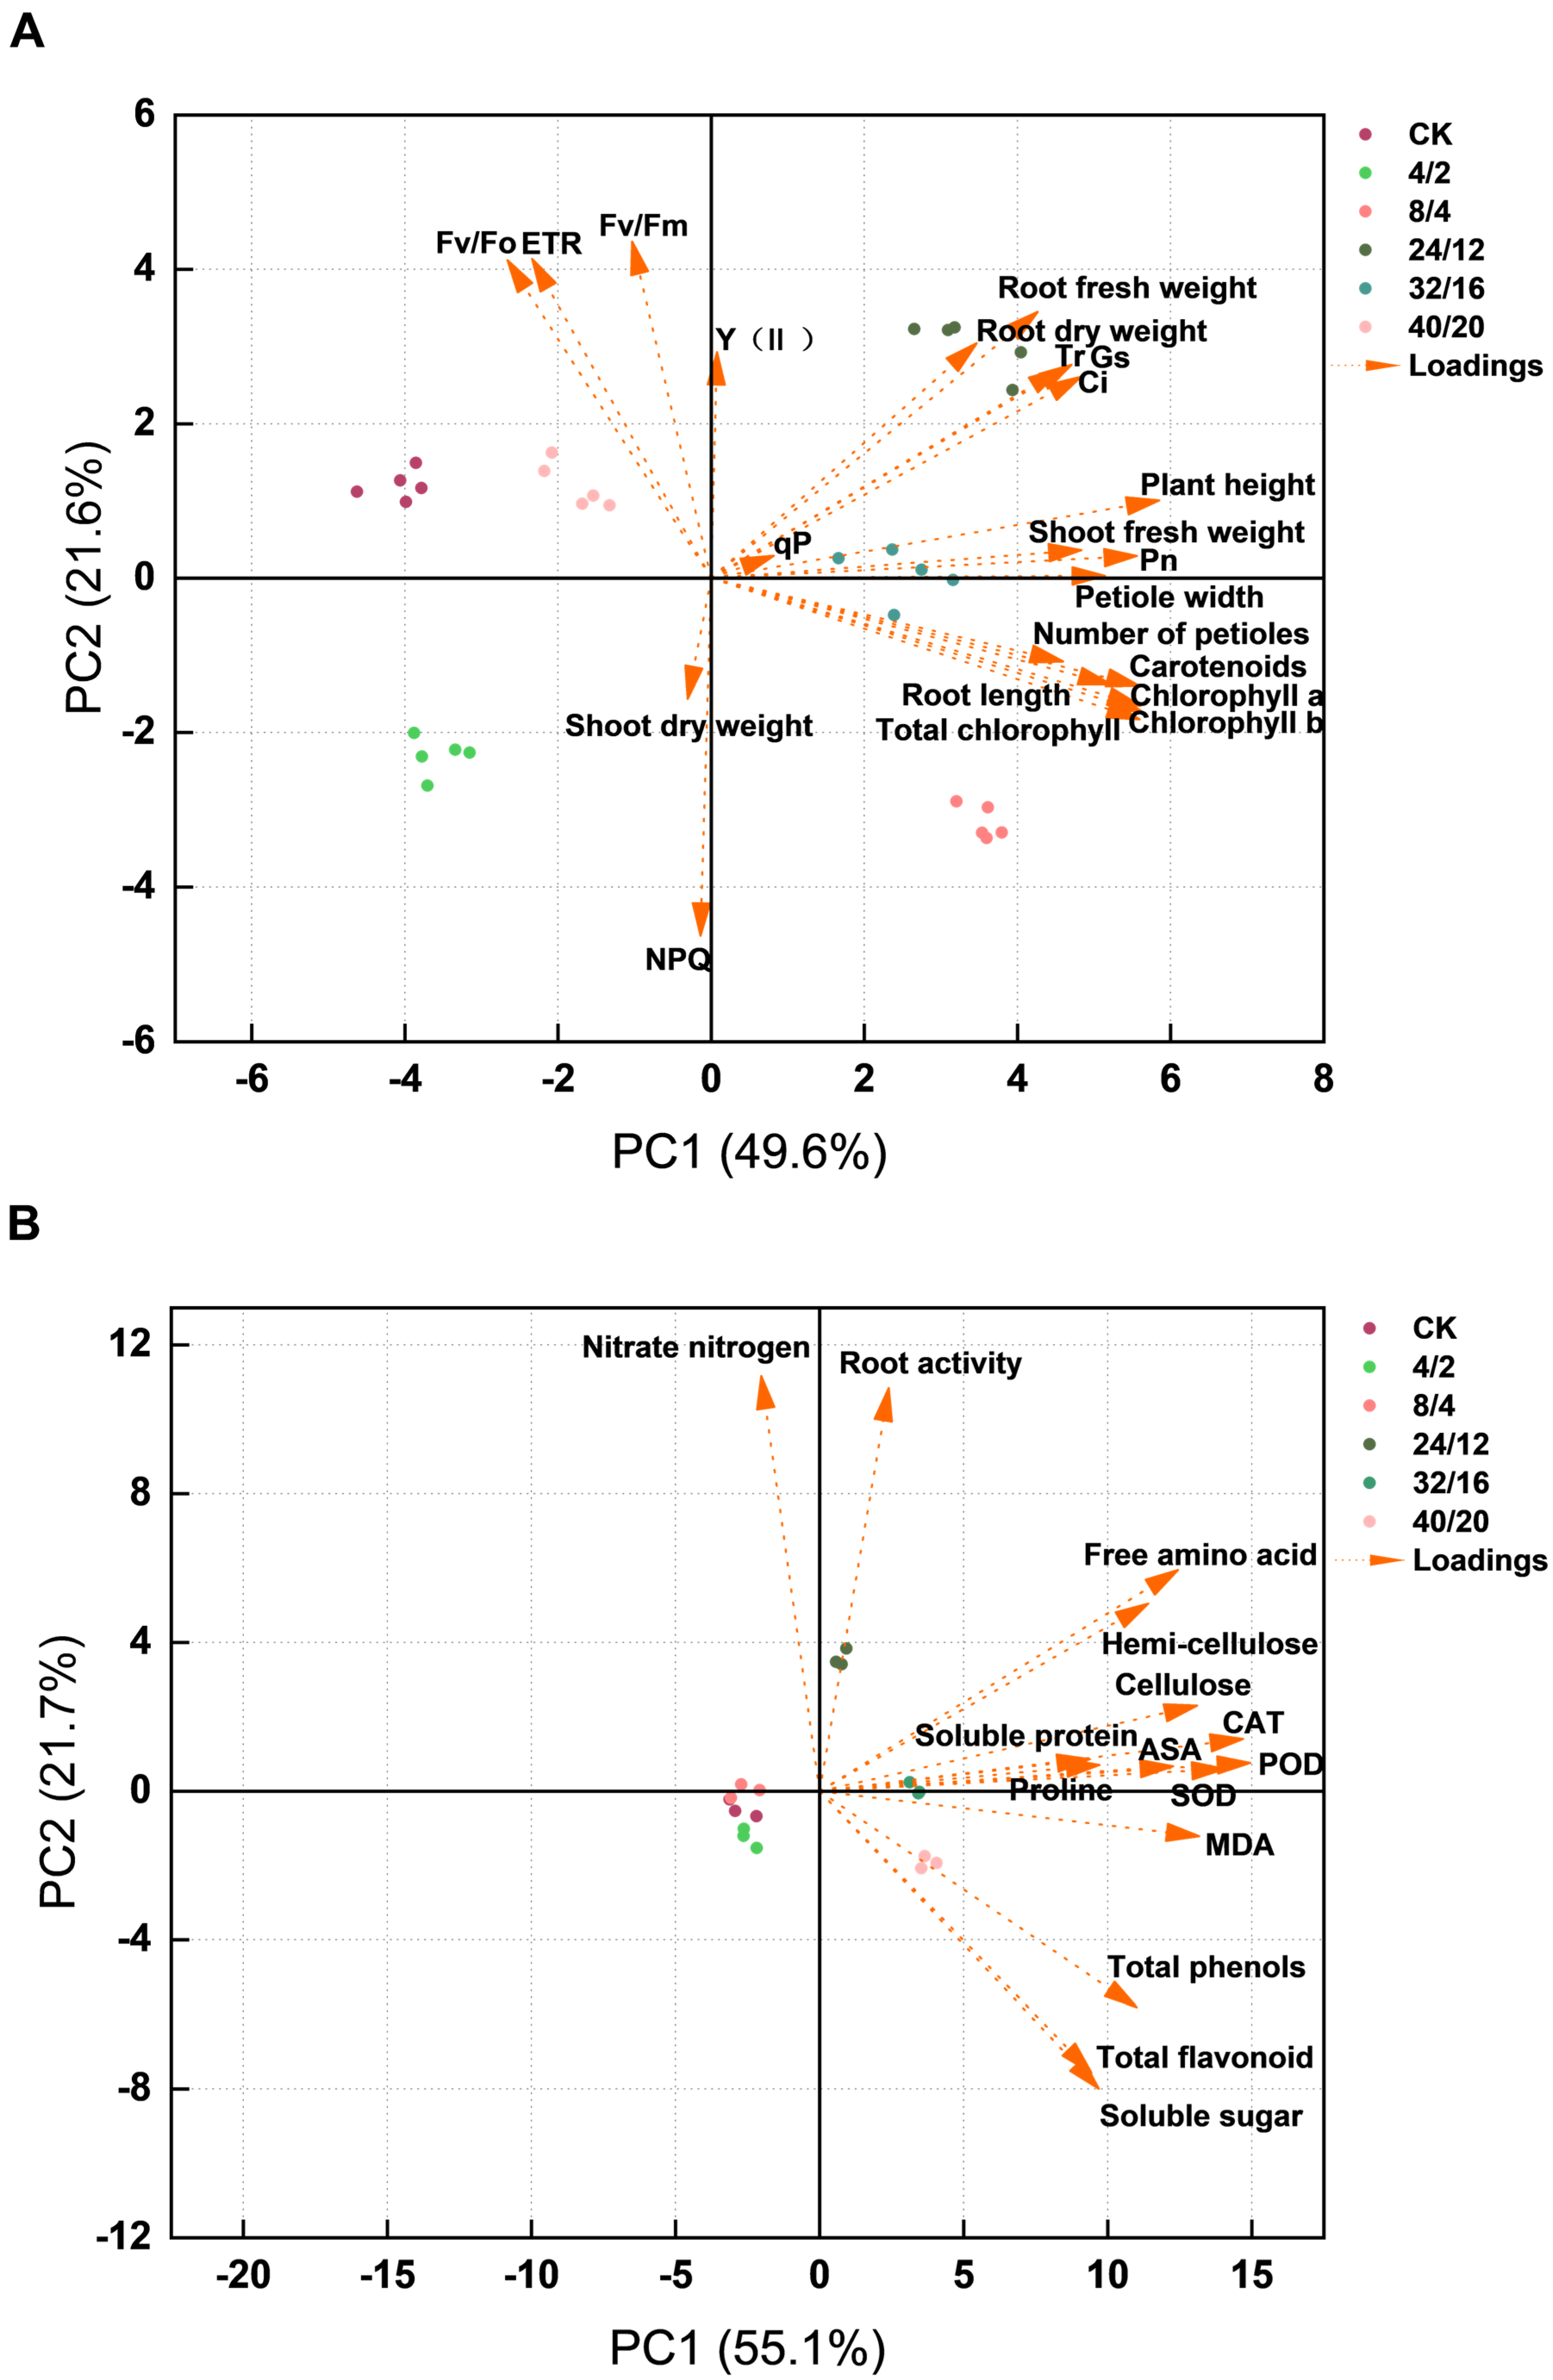
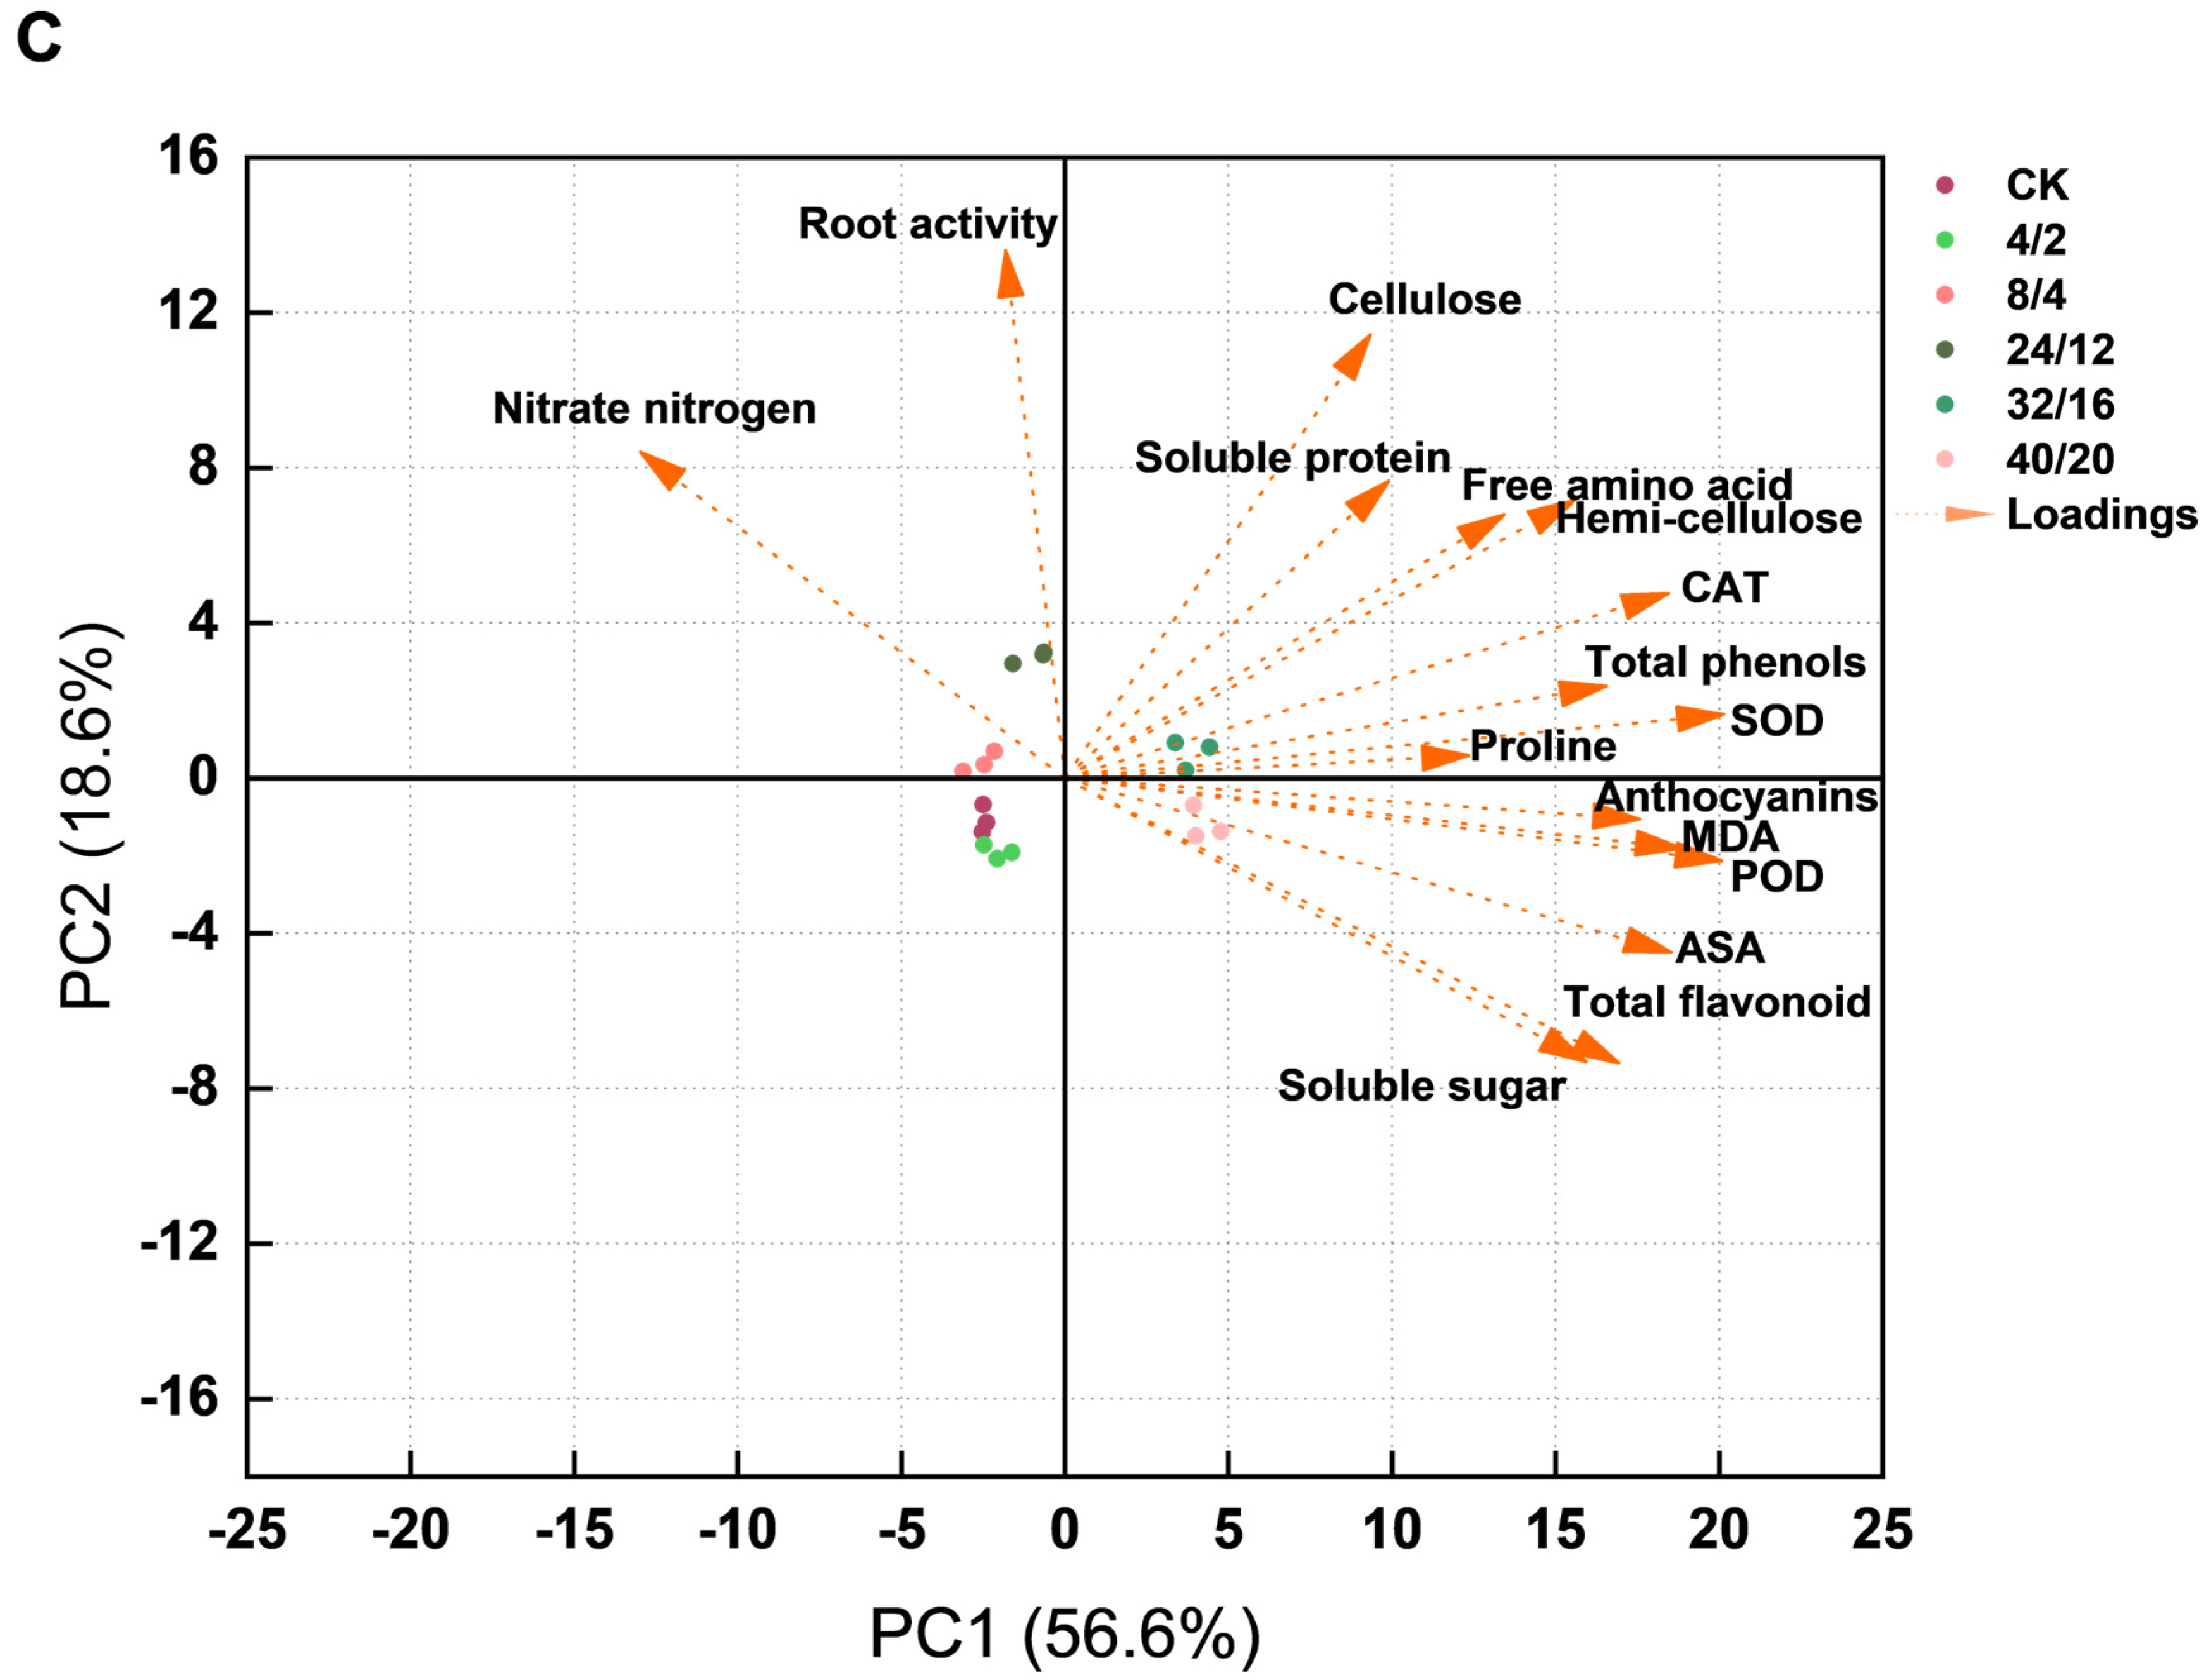
Principal component analysis of growth and photosynthetic traits (Figure 12A). The findings showed that 71.2% of the variance was explained by PC1 and PC2 (PC1: 49.6%; PC2: 21.6%). PC1 correlated positively with Gs, plant height, petiole width, and carotenoids and negatively with shoot dry weight and relative ETR. For leaf physiology (Figure 12B), PC1 (55.1%) and PC2 (21.7%) collectively explained 76.8% of the variance. PC1 showed positive loadings for cellulose, soluble protein, proline, and AsA, and a negative loading for nitrate-nitrogen. In petiole physiology (Figure 12C), 75.2% of the total variance was explained by PC1 (56.6%) and PC2 (18.6%). PC1 positively associated with POD, CAT, SOD, total phenols, proline, and anthocyanin but negatively with nitrate-nitrogen.
Principal component analysis (PCA) was conducted using a dimensionality reduction approach on the growth and photosynthetic parameters (Table 3), as well as the physiological parameters of blades and petioles (Table 4), across six light–dark cycle treatments. Three principal components were extracted based on eigenvalues greater than 1 and cumulative variance contribution exceeding 80%. In Table 3, the eigenvalue of PC1 was 10.9, with an explained variance of 49.6%, making it the most influential principal component. The eigenvalues of PC2 and PC3 were 4.76 and 3.21, explaining 21.6% and 14.6% of the total variance, respectively. Together, the three principal components accounted for 85.8% of the total variance. As shown in Table 4, the eigenvalues of PC1, PC2, and PC3 in leaf physiology were 8.27, 3.25, and 1.14, respectively, and the cumulative contribution rate was 84.4%. For petiole physiological parameters, the eigenvalues of PC1, PC2, and PC3 were 9.06, 2.98, and 1.29, respectively, with a cumulative explained variance of 83.3%.
Based on the results of principal component analysis (PCA), comprehensive scores and rankings for celery growth and photosynthetic characteristics, as well as for leaf and petiole physiological parameters, were calculated using a comprehensive evaluation model. As shown in Table 5, a higher comprehensive score indicated superior growth performance and nutritional quality of celery. According to the comprehensive ranking, the 24 h/12 h treatment achieved the highest score for growth and photosynthetic characteristics, indicating that this light–dark cycle was the most favorable for promoting celery growth and photosynthesis. In the comprehensive ranking of physiological indexes of blades and petioles, the 32 h/16 h treatment had the highest score, indicating that this light–dark cycle improved celery’s nutritional quality and antioxidant capacity. The 4 h/2 h treatment ranked last in all indicators, suggesting that a too-short light–dark cycle inhibited celery’s growth and nutritional quality.

4. Discussion

Biological rhythms (biological clocks) are endogenous rhythmic oscillators that regulate the expression of different genes by sensing changes in environmental signals, thereby influencing plant growth, development, metabolism, and physiological activities [57]. The biological clock exhibits both endogenous and inducible properties. Endogeneity refers to the ability of biological processes to operate autonomously under specific periodic rhythms even without external signals [58], while inducibility refers to the ability of the biological clock to spontaneously adapt to new environmental conditions when stable external conditions are suddenly disrupted [59]. Photoperiod, as a direct manifestation of circadian rhythms, is closely linked to plant physiological processes, such as growth and development [60]. In natural environments, for celery, the gradual extension of the photoperiod from winter to spring acts as a crucial environmental cue that induces flowering in celery [61]. Several studies have investigated the photoperiodic regulation of growth and development in Apiaceae plants, including celery [9,62], carrots [63], and fennel [64]. These studies provide valuable insights into the photoperiodic regulation of growth and development in Apiaceae species and offer guidance for future research on photoperiod management.

4.1. Effect of Different Light–Dark Cycles on Celery Growth and Photosynthetic Characteristics

Under different light–dark cycles, the 24 h/12 h cycle significantly increased plant height, total fresh weight, and underground dry weight and enhanced root activity, thereby improving the plant’s capacity for nutrient and water uptake. In contrast, the 8 h/4 h treatment showed the best performance in root length, petiole width, petiole number, total fresh weight, and total dry weight, thereby promoting overall celery growth. In comparison, the 4 h/2 h treatment inhibited growth, with dry biomass accumulating mainly in the petioles. Longer light–dark cycles significantly increased the root–shoot ratio and root weight ratio, indicating that plants tend to enhance root development with a prolonged light–dark cycle. Root activity of the 24 h/12 h treatment was the highest, indicating that the moderate dark period facilitated root metabolism and energy accumulation. In contrast, the root activity in the 4 h/2 h and 40 h/20 h treatments was lower, possibly due to the imbalance in the light–dark cycles.
Photosynthesis plays a crucial role among the various physiological processes of plants. Green plants convert light energy into chemical energy through photosynthesis, and photosynthesis contributes over 90% to plant yield [65,66]. In this study, the photosynthetic pigment content increased initially and then decreased as the duration of the light–dark cycle was extended. Pigment content peaked under the 8 h/4 h treatment, enhancing photosynthetic capacity, whereas it declined under the 40 h/20 h treatment. In terms of photosynthetic parameters, the 24 h/12 h treatment group exhibited higher Pn, Gs, Ci, and Tr values than other treatment groups, indicating strong photosynthesis. Additionally, except for the 24 h/12 h treatment, the Fv/Fm values of all other treatments were lower than CK, whereas ETR was lowest under the 8 h/4 h treatment and highest under the 40 h/20 h treatment. According to the results, the 8 h/4 h treatment led to an increased accumulation of photosynthetic pigments, while the 24 h/12 h treatment enhanced photosynthesis and light energy utilization efficiency.
Based on the results of principal component analysis (PCA), Figure 12A illustrates that the 24 h/12 h, 32 h/16 h, and 40 h/20 h treatments clustered within the positive quadrants of PC1 and PC2. This clustering pattern suggests that these light–dark cycle treatments elicited similar responses across the measured traits. The 4 h/2 h treatment was distinctly separated in the negative regions of both PC1 and PC2, indicating that this light–dark regime induced unique physiological and growth responses compared with the other treatments. The CK and 8 h/4 h treatment also exhibited distinct clustering, further demonstrating that different light conditions produced distinct biological outcomes. For growth-related traits (e.g., root dry weight, plant height, petiole width), these vectors were closely aligned with the positive axis of PC1, indicating a strong association between PC1 and plant growth performance. Accordingly, light–dark treatments clustered in the positive direction of PC1 (24 h/12 h, 32 h/16 h, and 40 h/20 h) were associated with enhanced celery growth, whereas treatments with negative PC1 scores (e.g., 4 h/2 h) were associated with growth inhibition. Vectors for photosynthesis-related traits (e.g., chlorophyll a, chlorophyll b, Pn, Ci) also trended toward the positive direction of PC1. This relationship indicates a positive correlation between growth and photosynthetic capacity under different light–dark regimes, suggesting that photoperiods favorable for growth also promoted pigment accumulation and carbon assimilation. Vectors representing chlorophyll fluorescence parameters (e.g., Fv/Fm, ETR, and Y(II)) predominantly occupied the positive axis of PC2, suggesting that PC2 was primarily driven by PSII efficiency and light-harvesting capacity. Treatments with higher PC2 scores were associated with optimized PSII function (e.g., higher Fv/Fm and Y(II) values), whereas the NPQ vector pointed negatively along PC2, indicating an inverse relationship with PSII efficiency. An elevated NPQ likely reflected either enhanced photoprotective energy dissipation or a compensatory response to increased photoinhibition.
Chen et al. [34] indicated that prolonging the light–dark cycle significantly increased the shoot dry weight of lettuce, which was beneficial for dry matter accumulation. However, this increase was accompanied by a reduction in photosynthetic pigment content, consistent with the results of the present study. This may represent an adaptive response by plants to reduce light energy capture and mitigate photoinhibition caused by prolonged light exposure. In addition, Barros et al. [67] proposed that chloroplast activity is regulated by circadian rhythm genes, and the reduction in pigment content under light–dark cycles may also be attributed to the regulatory effects of circadian rhythm genes. However, the underlying regulatory mechanisms require further elucidation. Research conducted by Cheng et al. [33] indicated that, in contrast to the 12 h/12 h light–dark cycle, the daily net CO2 exchange rate and fresh and dry weight of Dendrobium officinale Kimura & Migo plants increased significantly under 4 h/4 h and 2 h/2 h treatments. Similarly, Chen and Yang [34] investigated the effects of shortened light–dark cycles in lettuce and found that the shoot fresh and dry weights decreased significantly under the 6 h/3 h treatment. In contrast, the 2 h/1 h treatment resulted in a significant increase compared to 16 h/8 h, which is inconsistent with the results of this study, possibly due to differences in factors such as plant variety and light intensity. These findings suggest that both extending and shortening light–dark periods can enhance or reduce biomass, indicating that lettuce biomass does not change in a unidirectional manner with alterations in light–dark period duration.
Notably, interspecific differences exist in plant responses to different light–dark cycles. Certain key metabolites in plant metabolism are positively regulated by light, whereas other nutrients are synthesized in the dark. In this study, the 24 h/12 h treatment significantly enhanced photosynthesis and root growth, thereby promoting overall celery development. However, the 8 h/4 h treatment was more conducive to the accumulation of photosynthetic pigments. Photosynthetic efficiency and root activity in the 40 h/20 h and 4 h/2 h treatments were inhibited, suggesting that excessively long or short light–dark cycles are detrimental to celery growth.

4.2. Effect of Different Light Cycles on the Antioxidant Capacity of Celery

Sudden changes in the light–dark cycle, particularly its extension, can induce stress responses in plants. The activation of stress-responsive genes is a hallmark of this type of stress, increasing the production of reactive oxygen species (ROS) and the accumulation of jasmonic acid and salicylic acid [68]. Previous studies have shown that as the light–dark cycle lengthens, the intensity of the stress response gradually increases [69]. Prolonged duration can induce real stress, while the extension of shorter light–dark cycles is harmless and may induce beneficial stress [70].
This study showed that the proline content and antioxidant enzyme activity in blades and petioles treated with 8 h/4 h were the lowest, while the MDA content in 32 h/16 h and 40 h/20 h treatments were significantly higher than CK, indicating lipid peroxidation in the cell membrane. Regarding antioxidant enzyme activity, SOD activity was highest in the 32 h/16 h and 40 h/20 h treatments, POD activity was highest in the 40 h/20 h treatment, and CAT activity was highest in the 32 h/16 h treatment, indicating that the longer light–dark cycles (32 h/16 h, 40 h/20 h) caused mild photo-oxidative stress and enhanced antioxidant enzyme activity. AsA, or vitamin C, is a non-enzymatic antioxidant that participates in scavenging free radicals generated during photosynthesis, respiration, and abiotic stress in plants [71]. In this study, AsA content decreased as the light–dark cycle lengthened but reached its peak under the 40 h/20 h treatment. In contrast, AsA levels in petioles under the 8 h/4 h and 4 h/2 h treatments were lower than those in CK. Total phenols play a vital role in the antioxidant capacity of plants [72]; however, excessive intake may interfere with statin absorption and adversely affect human health [73]. In this study, total phenol content was highest in the 40 h/20 h and 32 h/16 h treatments. Celery is rich in flavonoids (mainly apigenin and luteolin), which confer high medicinal value and serve as key components of the plant antioxidant defense system under intense light stress [74]. Regarding flavonoids, their content in leaves treated with 40 h/20 h, 32 h/16 h, and 4 h/2 h was higher than that in CK, with the highest content at 40 h/20 h and the lowest at 8 h/4 h. Anthocyanins are important antioxidant pigments essential for human health [75] and had the highest content at 40 h/20 h and 32 h/16 h, while their content was lower than that of CK at 8 h/4 h. These results indicate that the 40 h/20 h and 32 h/16 h treatments enhanced the accumulation of antioxidant compounds in celery. Based on principal component analysis (PCA), Figure 12B,C showed that in both leaves and petioles, the sample distributions exhibited distinct clustering patterns among different treatment groups (4 h/2 h, 8 h/4 h, 24 h/12 h, 32 h/16 h, 40 h/20 h) and the CK. This clustering indicates significant physiological differentiation in celery under different light–dark regimes. In terms of variable contributions, antioxidant markers such as SOD, POD, AsA, and MDA all oriented toward the positive axis of PC1, reflecting their strong influence on the first principal component.
Previous studies have shown that prolonging the light–dark cycle can promote the accumulation of anthocyanins and flavonoids [75], which is consistent with the results of the present study. In this present study, prolonged light–dark cycles did not inhibit plant growth. The longer light–dark cycle treatments of 40 h/20 h and 32 h/16 h enhanced the plant’s antioxidant defense system by boosting the buildup of antioxidants to fend against the light stress reaction. However, Kang et al. [32] reported that shortening the light–dark cycle (9 h/3 h and 6 h/2 h) significantly reduced anthocyanin content in lettuce. This discrepancy with the present study may be attributed to the non-unidirectional response of antioxidant compound accumulation to changes in photoperiod length or to differences in treatment design and environmental conditions. This study suggests that a moderate extension of the light–dark cycle in celery cultivation, especially the 32 h/16 h and 40 h/20 h treatments, could effectively improve the antioxidant capacity of celery.

4.3. Effect of Different Light–Dark Cycles on the Nutritional Quality of Celery

Soluble sugars are core components of energy metabolism and biosynthetic processes [76], and their levels reflect photosynthetic efficiency and energy storage capacity. This study found that the soluble sugar content in celery blades and petioles of the 40 h/20 h treatment was higher than the CK and other treatments, indicating that longer light–dark cycles promoted sugar accumulation. The soluble sugar content reached its lowest level under the 24 h/12 h treatment, possibly because high photosynthetic efficiency coupled with vigorous metabolism resulted in rapid sugar consumption. Soluble proteins play an important role in plants as osmoregulatory substances and nutrients [77]. The soluble protein content peaked under the 32 h/16 h treatment, indicating that this treatment was beneficial to protein synthesis. In addition to basic nutrients, free amino acids are equally important for both plant and human health, playing an irreplaceable role in nitrogen metabolism [78]. In this study, the free amino acid content reached its highest levels in leaves treated with 24 h/12 h and in petioles treated with 40 h/20 h. Nitrates (NO3-N) are a common compound that typically do not pose threats to human health; however, their reaction products and metabolites (such as nitrites and nitrosamines) can pose serious health hazards [79]. In terms of nitrate-nitrogen, its content was highest under 24 h/12 h treatment, especially in petioles, indicating that strong photosynthesis and root activity promoted nitrogen absorption; however, this may pose potential health risks to humans, particularly infants, young children, and pregnant women, such as stomach cancer, esophageal cancer, and other conditions [80]. Nitrate-nitrogen content in the 4 h/2 h, 32 h/16 h, and 40 h/20 h treatments was lower, possibly due to reduced photosynthetic capacity or accelerated nitrogen utilization under extended light conditions. Cellulose and hemicellulose contribute to maintaining plant structural integrity and enhancing stress resistance. Cellulose content was higher in leaves under the 40 h/20 h and 32 h/16 h treatments, whereas hemicellulose content was higher in petioles under the 32 h/16 h and 24 h/12 h treatments. Overall, the 24 h/12 h, 32 h/16 h, and 40 h/20 h treatments increased cellulose and hemicellulose contents in celery, indicating that extended light–dark cycles promote cell wall synthesis and enhance the plant’s adaptability to light stress. According to the principal component analysis (PCA) results, Figure 12B,C show that, in terms of indicator contributions in celery blades and petioles, nutritional factors such as soluble protein, hemicellulose, and free amino acids all load positively on PC1, indicating their strong influence on this component. Meanwhile, nitrate-nitrogen and root activity also loaded positively on PC2, reflecting their contribution to the second principal component dimension.
Chen et al. [40] indicated that prolonging the light–dark cycles (48 h/24 h, 96 h/48 h, and 120 h/60 h) significantly increased soluble sugars and crude fiber contents in lettuce. As the light–dark cycle lengthened, both soluble sugar and crude fiber contents increased, peaking at 120 h/60 h. This observation aligns with the results of the present study. Longer light–dark cycles promote soluble sugar and cellulose accumulation in plants, likely due to their primary effect on plant growth through carbon metabolism [48]. Longer light–dark cycles enhance the utilization of carbon dioxide and its reduction to sugars. Mengdi et al. [81] reported that the soluble protein and soluble sugar contents in lettuce leaves under the 8 h/4 h light–dark cycle were significantly higher than those under the 12 h/6 h cycle, whereas the nitrate-nitrogen content under the 8 h/4 h cycle was considerably lower compared to the 16 h/8 h and 12 h/6 h cycles. These findings differ from those of the present study, possibly due to variations in light–dark cycle gradients or differences in plant materials. This study showed that longer light–dark cycles (40 h/20 h, 32 h/16 h) enhanced nutrient accumulation in celery, particularly soluble sugars, cellulose, and free amino acids, while shorter cycles (4 h/2 h, 8 h/4 h) limited the synthesis of these nutrients, adversely affecting nutritional quality and edible value. Therefore, appropriately extending light–dark cycles in celery cultivation can enhance nutritional quality and reduce nitrate-nitrogen content.

5. Conclusions

In light–dark cycle experiments, varying light and dark durations significantly influenced growth, photosynthetic characteristics, antioxidant systems, and nutritional quality in purple celery. The 24 h/12 h light–dark cycle was identified as optimal for celery growth, significantly promoting growth indices (such as plant height, petiole number, total fresh weight, and underground dry weight), improving root activity, and enhancing photosynthetic efficiency. The extended 32 h/16 h light–dark cycle enhanced celery’s antioxidant capacity by promoting the accumulation of antioxidant compounds and increasing antioxidant enzyme activities. It also promoted nutrient synthesis, particularly accumulating soluble sugars, cellulose, and free amino acids, thus improving celery’s nutritional quality. In summary, the 24 h/12 h treatment most effectively promoted celery growth and photosynthetic performance, whereas the 32 h/16 h treatment optimally improved antioxidant capacity and nutritional quality.
Although this study explored the light–dark cycle effects on antioxidant substances in celery, plant antioxidant mechanisms involve complex signaling and metabolic pathways. Future research should integrate transcriptomic and metabolomic approaches to elucidate the molecular basis of celery’s antioxidant responses under varying light environments, thereby providing theoretical support for optimizing light quality and photoperiod in controlled cultivation.

Author Contributions

Conceptualization, W.L. and Y.Z.; methodology, S.W. (Sen Wang), M.L.; software, X.H.; validation, S.W. (Sen Wang), T.P., K.O., Z.L., S.G., S.W. (Song Wang) and C.Q.; formal analysis, T.P., X.L., K.G. and Z.G.; investigation, K.G., Z.G. and L.L.; resources, Y.Z.; data curation, W.P. and S.G.; writing—original draft preparation, K.G. and Z.G.; writing—review and editing, W.L., C.J., T.P. and S.W. (Song Wang); visualization, T.P. and S.W. (Sen Wang); supervision, Y.Z. and M.L.; project administration, C.J.; funding acquisition, W.L. All authors have read and agreed to the published version of the manuscript.

Funding

This research was funded by the Natural Science Foundation Project of the Tibet Autonomous Region (XZ202301ZR005G); the National Foreign Experts Program (H20240506); the Sichuan Haiju High-Level Talents Introduction Project (2025HJRC0048); the National Agricultural Science and Technology Innovation System Sichuan Characteristic Vegetable Innovation Team Project (SCCXTD-2024-22); and the Key R&D Program Project of Xinjiang Province grant number 2023B02020.

Data Availability Statement

Data is contained within the article. The original contributions presented in this study are included in the article. Further inquiries can be directed to the corresponding authors.

Conflicts of Interest

The authors declare no conflicts of interest.

References

  1. Li, M.Y.; Hou, X.L.; Wang, F.; Tan, G.F.; Xu, Z.S.; Xiong, A.S. Advances in the research of celery, an important Apiaceae vegetable crop. Crit. Rev. Biotechnol. 2017, 38, 172–183. [Google Scholar] [CrossRef] [PubMed]
  2. Pilon-Smits, E.A.H. On the ecology of selenium accumulation in plants. Plants 2019, 8, 197. [Google Scholar] [CrossRef]
  3. Li, M.; Li, X.; Du, J.; Li, W.; He, R.; Lin, Y.; Zhang, Y.; Wang, Y.; He, W.; Tang, H. Effects of exogenous application of the strigolactone GR24 on quality and flavor components during postharvest storage of celery. Postharvest Biol. Technol. 2024, 212, 112900. [Google Scholar] [CrossRef]
  4. Asif, H.M.; Akram, M.; Usmanghani, K.; Akhtar, N.; Shah, P.A.; Uzair, M.; Ramzan, M.; Ali Shah, S.M.; Rehman, R. Monograph of Apium graveolens Linn. J. Med. Plant Res. 2011, 5, 1494–1496. [Google Scholar]
  5. Profir, A.; Vizireanu, C. Effect of the preservation processes on the storage stability of juice made from carrot, celery and beetroot. J. Agroaliment. Process. Technol. 2013, 19, 99–104. [Google Scholar]
  6. Kooti, W.; Ghasemi-boroon, M.; Ghafourian, M.; Asadi-Samani, M.; Harizi, M.; Sharafi-Ahvazi, N.; Afrisham, R.l. The effects of celery leave extract on male hormones in rats. J. HerbMed Pharmacol. 2015, 4, 56–60. [Google Scholar]
  7. Inada, K.; Yabumoto, Y. Effect of light quality, day length and periodic temperature variation on the growth of lettuce and radish plants. Jpn. J. Crop Sci. 1989, 58, 689–694. [Google Scholar] [CrossRef]
  8. Zhang, X.; He, D.; Niu, G.; Yan, Z.; Song, J. Effects of environment lighting on the growth, photosynthesis, and quality of hydroponic lettuce in a plant factory. Int. J. Agric. Biol. Eng. 2018, 11, 33–40. [Google Scholar] [CrossRef]
  9. Booij, R.; Meurs, E. Flowering in celeriac (Apium graveolens L. var. rapaceum (Mill.) DC.): Effects of photoperiod. Sci. Hortic. 1994, 58, 271–282. [Google Scholar] [CrossRef]
  10. Chu, Q.; Qin, Y.; Li, C.; Cheng, S.; Su, L.; He, Z.; Zhou, X.; Shao, D.; Guo, X. Effects of different photoperiods on the growth and nutritional characteristics of two celery cultivars in plant factory. Agronomy 2023, 13, 3039. [Google Scholar] [CrossRef]
  11. Chen, C.; Huang, T.; Wang, L.-X.; Xiong, J.-S.; Li, M.-Y.; Tan, G.-F.; Liu, P.-Z.; Li, Y.-P.; Hu, Z.-H.; Liu, H.; et al. High-throughput transcriptomic analysis of circadian rhythm of flavonoid metabolism under different photoperiods in celery. Veg. Res. 2025, 5, e028. [Google Scholar] [CrossRef]
  12. Liu, S.; Liu, B.; Zhao, S.; Zeng, T.; Li, Z.; Theodorakis, P.E.; Hu, H.; Wang, C. LED red and blue light source fresh preservation improved the quality of celery and broccoli during cold storage. Food Sci. Biotechnol. 2025, 34, 1879–1887. [Google Scholar] [CrossRef] [PubMed]
  13. Qin, Y.; Liu, X.; Li, C.; Chu, Q.; Cheng, S.; Su, L.; Shao, D.; Guo, X.; He, Z.; Zhou, X. Effect of light intensity on celery growth and flavonoid synthesis. Front. Plant Sci. 2023, 14, 12. [Google Scholar] [CrossRef]
  14. Ma, Y.; Cheng, L.; Gao, X.; Elsabagh, M.; Feng, Y.; Li, Z.; Khanaki, H.; Chen, H.; Liu, F. Melatonin modulates lipopolysaccharides-induced inflammatory response and maintains circadian rhythm associated with histone H3 acetylation in bovine mammary epithelial cells. J. Funct. Foods 2024, 116, 106156. [Google Scholar] [CrossRef]
  15. Mao, H.; Hang, T.; Zhang, X.; Lu, N. Both multi-segment light intensity and extended photoperiod lighting strategies, with the same daily light integral, promoted Lactuca sativa L. growth and photosynthesis. Agronomy 2019, 9, 857. [Google Scholar] [CrossRef]
  16. Roy, A.; Pandey, D.M.; Dwivedi, A. A review on modeling approaches for the transcriptional regulatory network intricacies of circadian clock genes in plants. Planta 2025, 262, 1–15. [Google Scholar] [CrossRef]
  17. Zhou, J.; Li, P.; Wang, J. Effects of light intensity and temperature on the photosynthesis characteristics and yield of lettuce. Horticulturae 2022, 8, 178. [Google Scholar] [CrossRef]
  18. Hassan, N.E. Light pollution and its effects on human health and the environment: A review. Asian J. Environ. Ecol. 2024, 23, 96–108. [Google Scholar] [CrossRef]
  19. Harmer, S.L.; Hogenesch, J.B.; Straume, M.; Chang, H.-S.; Han, B.; Zhu, T.; Wang, X.; Kreps, J.A.; Kay, S.A. Orchestrated transcription of key pathways in Arabidopsis by the circadian clock. Science 2000, 290, 2110–2113. [Google Scholar] [CrossRef] [PubMed]
  20. Michael, T.P.; Salome, P.A.; Yu, H.J.; Spencer, T.R.; Sharp, E.L.; McPeek, M.A.; Alonso, J.M.; Ecker, J.R.; McClung, C.R. Enhanced fitness conferred by naturally occurring variation in the circadian clock. Science 2003, 302, 1049–1053. [Google Scholar] [CrossRef]
  21. Matsubayashi, Y.; Sakagami, Y. Peptide hormones in plants. Annu. Rev. Plant Biol. 2006, 57, 649–674. [Google Scholar] [CrossRef] [PubMed]
  22. Anton-Sales, C.; Bergh, E.S.v.D.; Thérèse-Navarro, A.; Severing, E.; Moñino-López, D.; DiPalma, J.; Proveniers, M.; McClung, C.R.; Jeuken, M.; Bonnema, G. Breeding for delayed bolting decelerated the circadian clock in cultivated lettuce. New Phytol. 2025, 248, 1892–1902. [Google Scholar] [CrossRef]
  23. Ocaña, D.N.; Haanskorf, T.; Yang, L.; Sfondrini, E.; Reddy, A.T.; Marcelis, L.F.; Heuvelink, E. Non-natural day length does not negatively affect lettuce growth as a result of acclimated carbohydrate rhythms. Sci. Hortic. 2025, 350, 114291. [Google Scholar] [CrossRef]
  24. Liu, H.; Zhang, J.-Q.; Tao, J.-P.; Chen, C.; Su, L.-Y.; Xiong, J.-S.; Xiong, A.-S. A telomere-to-telomere gapless genome reveals SlPRR1 control of circadian rhythm and photoperiodic flowering in tomato. GigaScience 2025, 14, 8. [Google Scholar] [CrossRef] [PubMed]
  25. Yang, X.; Huang, S.; Li, W.; Li, Z.; Xu, Z.; Zhou, W.; Meng, X.; Xie, Y.; Wang, S.; Jin, L.; et al. Identification of biological rhythms related GIGANTEA genes in tomato and functional analysis under heat stress. Plant Stress 2025, 15, 100736. [Google Scholar] [CrossRef]
  26. Zhang, A.; Li, X.; Zhang, H.; Jiang, Y.; Li, Q.; Shen, J.; Li, Z. Transcriptome analysis of CsWOX1 mutant and overexpressing lines reveals downstream genes regulating cucumber leaf morphogenesis. Veg. Res. 2025, 5, 1–12. [Google Scholar] [CrossRef]
  27. Simeanu, D. Melatonin: An overview on the synthesis processes and on its multiple bioactive roles played in animals and humans. Agriculture 2025, 15, 273. [Google Scholar] [CrossRef]
  28. Bowsher, C.G.; Long, D.M.; Oaks, A.; Rothstein, S.J. Effect of light/dark cycles on expression of nitrate assimilatory genes in maize shoots and roots. Plant Physiol. 1991, 95, 281–285. [Google Scholar] [CrossRef]
  29. Cheung, C.M.; Poolman, M.G.; Fell, D.A.; Ratcliffe, R.G.; Sweetlove, L.J. A diel flux balance model captures interactions between light and dark metabolism during day-night cycles in C3 and crassulacean acid metabolism leaves. Plant Physiol. 2014, 165, 917–929. [Google Scholar] [CrossRef]
  30. Zhang, S.; Zhang, L.; Zou, H.; Qiu, L.; Zheng, Y.; Yang, D.; Wang, Y. Effects of light on secondary metabolite biosynthesis in medicinal plants. Front. Plant Sci. 2021, 12, 781236. [Google Scholar] [CrossRef] [PubMed]
  31. Higashi, T.; Kamitamari, A.; Okamura, N.; Ukai, K.; Okamura, K.; Tezuka, T.; Fukuda, H. Characterization of circadian rhythms through a bioluminescence reporter assay in Lactuca sativa L. Environ. Control. Biol. 2014, 52, 21–27. [Google Scholar] [CrossRef]
  32. Kang, J.H.; KrishnaKumar, S.; Atulba, S.L.S.; Jeong, B.R.; Hwang, S.J. Light intensity and photoperiod influence the growth and development of hydroponically grown leaf lettuce in a closed-type plant factory system. Hortic. Environ. Biotechnol. 2013, 54, 501–509. [Google Scholar] [CrossRef]
  33. Cheng, Y.; He, D.; He, J.; Niu, G.; Gao, R. Effect of light/dark cycle on photosynthetic pathway switching and CO2 absorption in two Dendrobium species. Front. Plant Sci. 2019, 10, 659. [Google Scholar] [CrossRef]
  34. Chen, X.-L.; Yang, Q.-C. Effects of intermittent light exposure with red and blue light emitting diodes on growth and carbohydrate accumulation of lettuce. Sci. Hortic. 2018, 234, 220–226. [Google Scholar] [CrossRef]
  35. Urairi, C.; Shimizu, H.; Nakashima, H.; Miyasaka, J.; Ohdoi, K. Optimization of light-dark Cycles of Lactuca sativa L. in plant factory. Environ. Control. Biol. 2017, 55, 85–91. [Google Scholar] [CrossRef]
  36. Shao, M.; Liu, W.; Zha, L.; Zhou, C.; Zhang, Y.; Li, B. Altering light–dark cycle at pre-harvest stage regulated growth, nutritional quality, and photosynthetic pigment content of hydroponic lettuce. Acta Physiol. Plant. 2021, 43, 1–9. [Google Scholar] [CrossRef]
  37. Kurata, H.; Achioku, T.; Furusaki, S. The light/dark cycle operation with an hour-scale period enhances caffeine production by Coffea arabica cells. Enzym. Microb. Technol. 1998, 23, 518–523. [Google Scholar] [CrossRef]
  38. Hang, T.; Lu, N.; Takagaki, M.; Mao, H. Leaf area model based on thermal effectiveness and photosynthetically active radiation in lettuce grown in mini-plant factories under different light cycles. Sci. Hortic. 2019, 252, 113–120. [Google Scholar] [CrossRef]
  39. Zhou, J.; Wang, J.; Hang, T.; Li, P. Photosynthetic characteristics and growth performance of lettuce (Lactuca sativa L.) under different light/dark cycles in mini plant factories. Photosynthetica 2022, 58, 740–747. [Google Scholar] [CrossRef]
  40. Chen, X.-L.; Li, Y.-L.; Wang, L.-C.; Yang, Q.-C.; Guo, W.-Z. Responses of butter leaf lettuce to mixed red and blue light with extended light/dark cycle period. Sci. Rep. 2022, 12, 6924. [Google Scholar] [CrossRef]
  41. Shibaeva, T.G.; Sherudilo, E.G.; Ikkonen, E.; Rubaeva, A.A.; Levkin, I.A.; Titov, A.F. Effects of extended light/dark cycles on solanaceae plants. Plants 2024, 13, 244. [Google Scholar] [CrossRef]
  42. Ouyang, H.; Zhou, J.; Ren, J.G.; Wang, J.L. Analysis of electrode bacteria of soil microbial fuel cell (MFC) and the effects of its operation on rice growth activities. J. Anhui Agric. Univ. 2021, 48, 115–120. [Google Scholar]
  43. Chen, C.; Chen, P.; Wu, Z.; Liu, Q.; Zhong, Y.; Liu, T.; Zheng, Y.; Yu, F. Colchicine-induced chromosome doubling in Cinnamomum camphora and its effect on morphological and terpenoid storage structures. Ind. Crop. Prod. 2025, 233, 121338. [Google Scholar] [CrossRef]
  44. Moradi, F.; Ismail, A.M. Responses of photosynthesis, chlorophyll fluorescence and ROS-scavenging systems to salt stress during seedling and reproductive stages in rice. Ann. Bot. 2007, 99, 1161–1173. [Google Scholar] [CrossRef] [PubMed]
  45. Gururani, M.A.; Ganesan, M.; Song, I.-J.; Han, Y.; Kim, J.-I.; Lee, H.-Y.; Song, P.-S. Transgenic turfgrasses expressing hyperactive Ser599Ala phytochrome A mutant exhibit abiotic stress tolerance. J. Plant Growth Regul. 2016, 35, 11–21. [Google Scholar] [CrossRef]
  46. An, R.; Luo, S.; Zhou, H.; Zhang, Y.; Zhang, L.; Hu, H.; Li, P. Effects of hydrogen-rich water combined with vacuum precooling on the senescence and antioxidant capacity of pakchoi (Brassica rapa subsp. Chinensis). Sci. Hortic. 2021, 289, 110469. [Google Scholar] [CrossRef]
  47. Song, J.; Zhang, R.; Yang, F.; Wang, J.; Cai, W.; Zhang, Y. Nocturnal LED supplemental lighting improves quality of tomato seedlings by increasing biomass accumulation in a controlled environment. Agronomy 2024, 14, 1888. [Google Scholar] [CrossRef]
  48. Yan, J.-K.; Chen, T.-T.; Chen, X.; Liu, Y.; Liu, C.; Li, L. Assessing the product quality and biological activities of barley (Hordeum vulgare L.) grasses at different harvest times. Food Biosci. 2022, 46, 101549. [Google Scholar] [CrossRef]
  49. Pan, L.; Sun, R.M. The Determination of the Content of Vitamin C in Medicine by Indirect Spectrophotometry. J. Huangshan Univ. 2011, 13, 47–49. [Google Scholar]
  50. Li, Y.-Y.; Mao, K.; Zhao, C.; Zhao, X.-Y.; Zhang, H.-L.; Shu, H.-R.; Hao, Y.-J. MdCOP1 ubiquitin E3 ligases interact with MdMYB1 to regulate light-induced anthocyanin biosynthesis and red fruit coloration in apple. Plant Physiol. 2012, 160, 1011–1022. [Google Scholar] [CrossRef]
  51. Tunio, M.H.; Gao, J.; Qureshi, W.A.; Sheikh, S.A.; Chen, J.; Chandio, F.A.; Lakhiar, I.A.; Solangi, K.A. Effects of droplet size and spray interval on root-to-shoot ratio, photosynthesis efficiency, and nutritional quality of aeroponically grown butterhead lettuce. Int. J. Agric. Biol. Eng. 2022, 15, 79–88. [Google Scholar] [CrossRef]
  52. Zhang, C.; Li, X.; Yan, H.; Ullah, I.; Zuo, Z.; Li, L.; Yu, J. Effects of irrigation quantity and biochar on soil physical properties, growth characteristics, yield and quality of greenhouse tomato. Agric. Water Manag. 2020, 241, 106263. [Google Scholar] [CrossRef]
  53. Huang, S.; Wu, Y.N.; Liu, M. Quantitative determination of total free-amino acid in Nervilia fordii(Hance) Schltr. by ninhydrin colorimetric method. Chin. J. Inf. Tradit. Chin. Med. 2010, 17, 50–52. [Google Scholar]
  54. Li, J.; Wu, T.; Huang, K.; Liu, Y.; Liu, M.; Wang, J. Effect of LED spectrum on the quality and nitrogen metabolism of lettuce under recycled hydroponics. Front. Plant Sci. 2021, 12, 197–203. [Google Scholar] [CrossRef]
  55. GB/T 5009.10-2003; Determination of Crude Fiber in Plant-Based Foods. China National Standardization Press: Beijing, China, 2018.
  56. Liu, X.; Liang, L.; Chen, P.; Peng, W.; Guo, K.; Huang, X.; Qin, C.; Luo, Z.; Ouyang, K.; Jiang, C.; et al. Effects of electrostatic field and CO2 interaction on growth and physiological metabolism in asparagus. Agriculture 2025, 15, 1416. [Google Scholar] [CrossRef]
  57. Hsu, P.Y.; Harmer, S.L. Wheels within wheels: The plant circadian system. Trends Plant Sci. 2014, 19, 240–249. [Google Scholar] [CrossRef]
  58. Wijnen, H.; Naef, F.; Boothroyd, C.; Claridge-Chang, A.; Young, M.W. Control of daily transcript oscillations in drosophila by light and the circadian clock. PLoS Genet. 2006, 2, e39. [Google Scholar] [CrossRef]
  59. Fukuda, H.; Nakamichi, N.; Hisatsune, M.; Murase, H.; Mizuno, T. Synchronization of plant circadian oscillators with a phase delay effect of the vein network. Phys. Rev. Lett. 2007, 99, 098102. [Google Scholar] [CrossRef]
  60. Ren, Y.; Gao, Y.; Zhang, Q. Morning and evening alarm of the circadian clock for flower opening times in Hemerocallis. Plant Sci. 2021, 311, 110992. [Google Scholar] [CrossRef]
  61. Li, M.; Tan, S.; Tan, G.; Luo, Y.; Sun, B.; Zhang, Y.; Chen, Q.; Wang, Y.; Zhang, F.; Zhang, Y.; et al. Transcriptome analysis reveals important transcription factor families and reproductive biological processes of flower development in celery (Apium graveolens L.). Agronomy 2020, 10, 653. [Google Scholar] [CrossRef]
  62. Booij, R.; Meurs, E. Effect of photoperiod on flower stalk elongation in celeriac (Apium graveolens L. var. rapaceum (Mill.) DC.). Sci. Hortic. 1995, 63, 143–154. [Google Scholar] [CrossRef]
  63. Liu, L.; Ou, C.; Chen, S.; Shen, Q.; Liu, B.; Li, M.; Zhao, Z.; Kong, X.; Yan, X.; Zhuang, F. The response of COL and FT homologues to photoperiodic regulation in carrot (Daucus carota L.). Sci. Rep. 2020, 10, 9984. [Google Scholar] [CrossRef]
  64. Peterson, L.E.; Clark, R.J.; Menary, R.C. Umbel initiation and stem elongation in fennel (Foeniculum vulgare) initiated by photoperiod. J. Essent. Oil Res. 1993, 5, 37–43. [Google Scholar] [CrossRef]
  65. Wang, Q.-Y.; Zhao, M.-R.; Wang, J.-Q.; Hu, B.-Y.; Chen, Q.-J.; Qin, Y.; Zhang, G.-Q. Effects of microbial inoculants on agronomic characters, physicochemical properties and nutritional qualities of lettuce and celery in hydroponic cultivation. Sci. Hortic. 2023, 320, 112202. [Google Scholar] [CrossRef]
  66. Wang, F.; Gao, Q.; Ji, G.; Wang, J.; Ding, Y.; Wang, S. Effects of light intensity and photoperiod on morphological development and photosynthetic characteristics of coriander. Horticulturae 2024, 10, 215. [Google Scholar] [CrossRef]
  67. Dantas, d.B.; Luíza, L.; Eldridge, B.M.; Dorling, J.; Dekeya, R.; Lynch, D.A.; Dodd, A.N. Circadian regulation of metabolism across photosynthetic organisms. Plant J. 2023, 116, 650–668. [Google Scholar] [CrossRef] [PubMed]
  68. Roeber, V.M.; Schmülling, T.; Cortleven, A. The photoperiod: Handling and causing stress in plants. Front. Plant Sci. 2022, 12, 781988. [Google Scholar] [CrossRef]
  69. Abuelsoud, W.; Cortleven, A.; Schmülling, T. Photoperiod stress induces an oxidative burst-like response and is associated with increased apoplastic peroxidase and decreased catalase activities. J. Plant Physiol. 2020, 253, 153252. [Google Scholar] [CrossRef] [PubMed]
  70. Krasensky-Wrzaczek, J.; Kangasjärvi, J. The role of reactive oxygen species in the integration of temperature and light signals. J. Exp. Bot. 2018, 69, 3347–3358. [Google Scholar] [CrossRef]
  71. Liu, J.-X.; Feng, K.; Wang, G.-L.; Wu, X.-J.; Duan, A.-Q.; Yin, L.; Shen, D.; Xu, Z.-S.; Xiong, A.-S. Effect of elevated CO2 on ascorbate accumulation and the expression levels of genes involved in ascorbate metabolism in celery. J. Plant Growth Regul. 2020, 39, 1046–1060. [Google Scholar] [CrossRef]
  72. Deng, M.; Qian, H.; Chen, L.; Sun, B.; Chang, J.; Miao, H.; Cai, C.; Wang, Q. Influence of pre-harvest red light irradiation on main phytochemicals and antioxidant activity of Chinese kale sprouts. Food Chem. 2025, 222, 1–5. [Google Scholar] [CrossRef]
  73. Costa, R.; Ferreira, C.; Alves, A.; Nunes, S.; Reis, F.; Malva, J.; Viana, S. Lipid-lowering statins and polyphenol-based supplementation: A scoping review on drug-food interaction potential. Front. Pharmacol. 2025, 16, 1541871. [Google Scholar] [CrossRef]
  74. Li, M.-Y.; Feng, K.; Hou, X.-L.; Jiang, Q.; Xu, Z.-S.; Wang, G.-L.; Liu, J.-X.; Wang, F.; Xiong, A.-S. The genome sequence of celery (Apium graveolens L.), an important leaf vegetable crop rich in apigenin in the Apiaceae family. Hortic. Res. 2025, 7, 9. [Google Scholar] [CrossRef]
  75. Jokioja, J.; Linderborg, K.M.; Kortesniemi, M.; Nuora, A.; Heinonen, J.; Sainio, T.; Viitanen, M.; Kallio, H.; Yang, B. Anthocyanin-rich extract from purple potatoes decreases postprandial glycemic response and affects inflammation markers in healthy men. Food Chem. 2020, 310, 125797. [Google Scholar] [CrossRef]
  76. Gurrieri, L.; Merico, M.; Trost, P.; Forlani, G.; Sparla, F. Impact of drought on soluble sugars and free proline content in selected Arabidopsis mutants. Biology 2020, 9, 367. [Google Scholar] [CrossRef]
  77. Deans, C.A.; Behmer, S.T.; Fiene, J.; Sword, G.A. Spatio-temporal, genotypic, and environmental effects on plant soluble protein and digestible carbohydrate content: Implications for insect herbivores with cotton as an exemplar. J. Chem. Ecol. 2016, 42, 1151–1163. [Google Scholar] [CrossRef]
  78. Lian, J.; Liu, W.; Meng, L.; Wu, J.; Chao, L.; Zeb, A.; Sun, Y. Foliar-applied polystyrene nanoplastics (PSNPs) reduce the growth and nutritional quality of lettuce (Lactuca sativa L.). Environ. Pollut. 2021, 280, 116978. [Google Scholar] [CrossRef] [PubMed]
  79. Zhang, L.; Wang, L.; Li, F.; Xiao, F.; Yu, H. Effect of divalent manganese (Mn2+) concentration on the growth and nitrate nitrogen content of lettuce during aeroponic intercropping with cherry radish. Hortic. Environ. Biotechnol. 2021, 62, 243–251. [Google Scholar] [CrossRef]
  80. Kiani, A.; Sharafi, K.; Omer, A.K.; Matin, B.K.; Davoodi, R.; Mansouri, B.; Sharafi, H.; Soleimani, H.; Massahi, T.; Ahmadi, E. Accumulation and human health risk assessment of nitrate in vegetables irrigated with different irrigation water sources- transfer evaluation of nitrate from soil to vegetables. Environ. Res. 2022, 205, 112527. [Google Scholar] [CrossRef] [PubMed]
  81. Dai, M.; Tan, X.; Ye, Z.; Chen, X.; Zhang, Y.; Ruan, Y.; Ma, B.; Kong, D. Analysis of lettuce transcriptome reveals the mechanism of different light/dark cycle in promoting the growth and quality. Front. Plant Sci. 2024, 15, 1394434. [Google Scholar] [CrossRef]
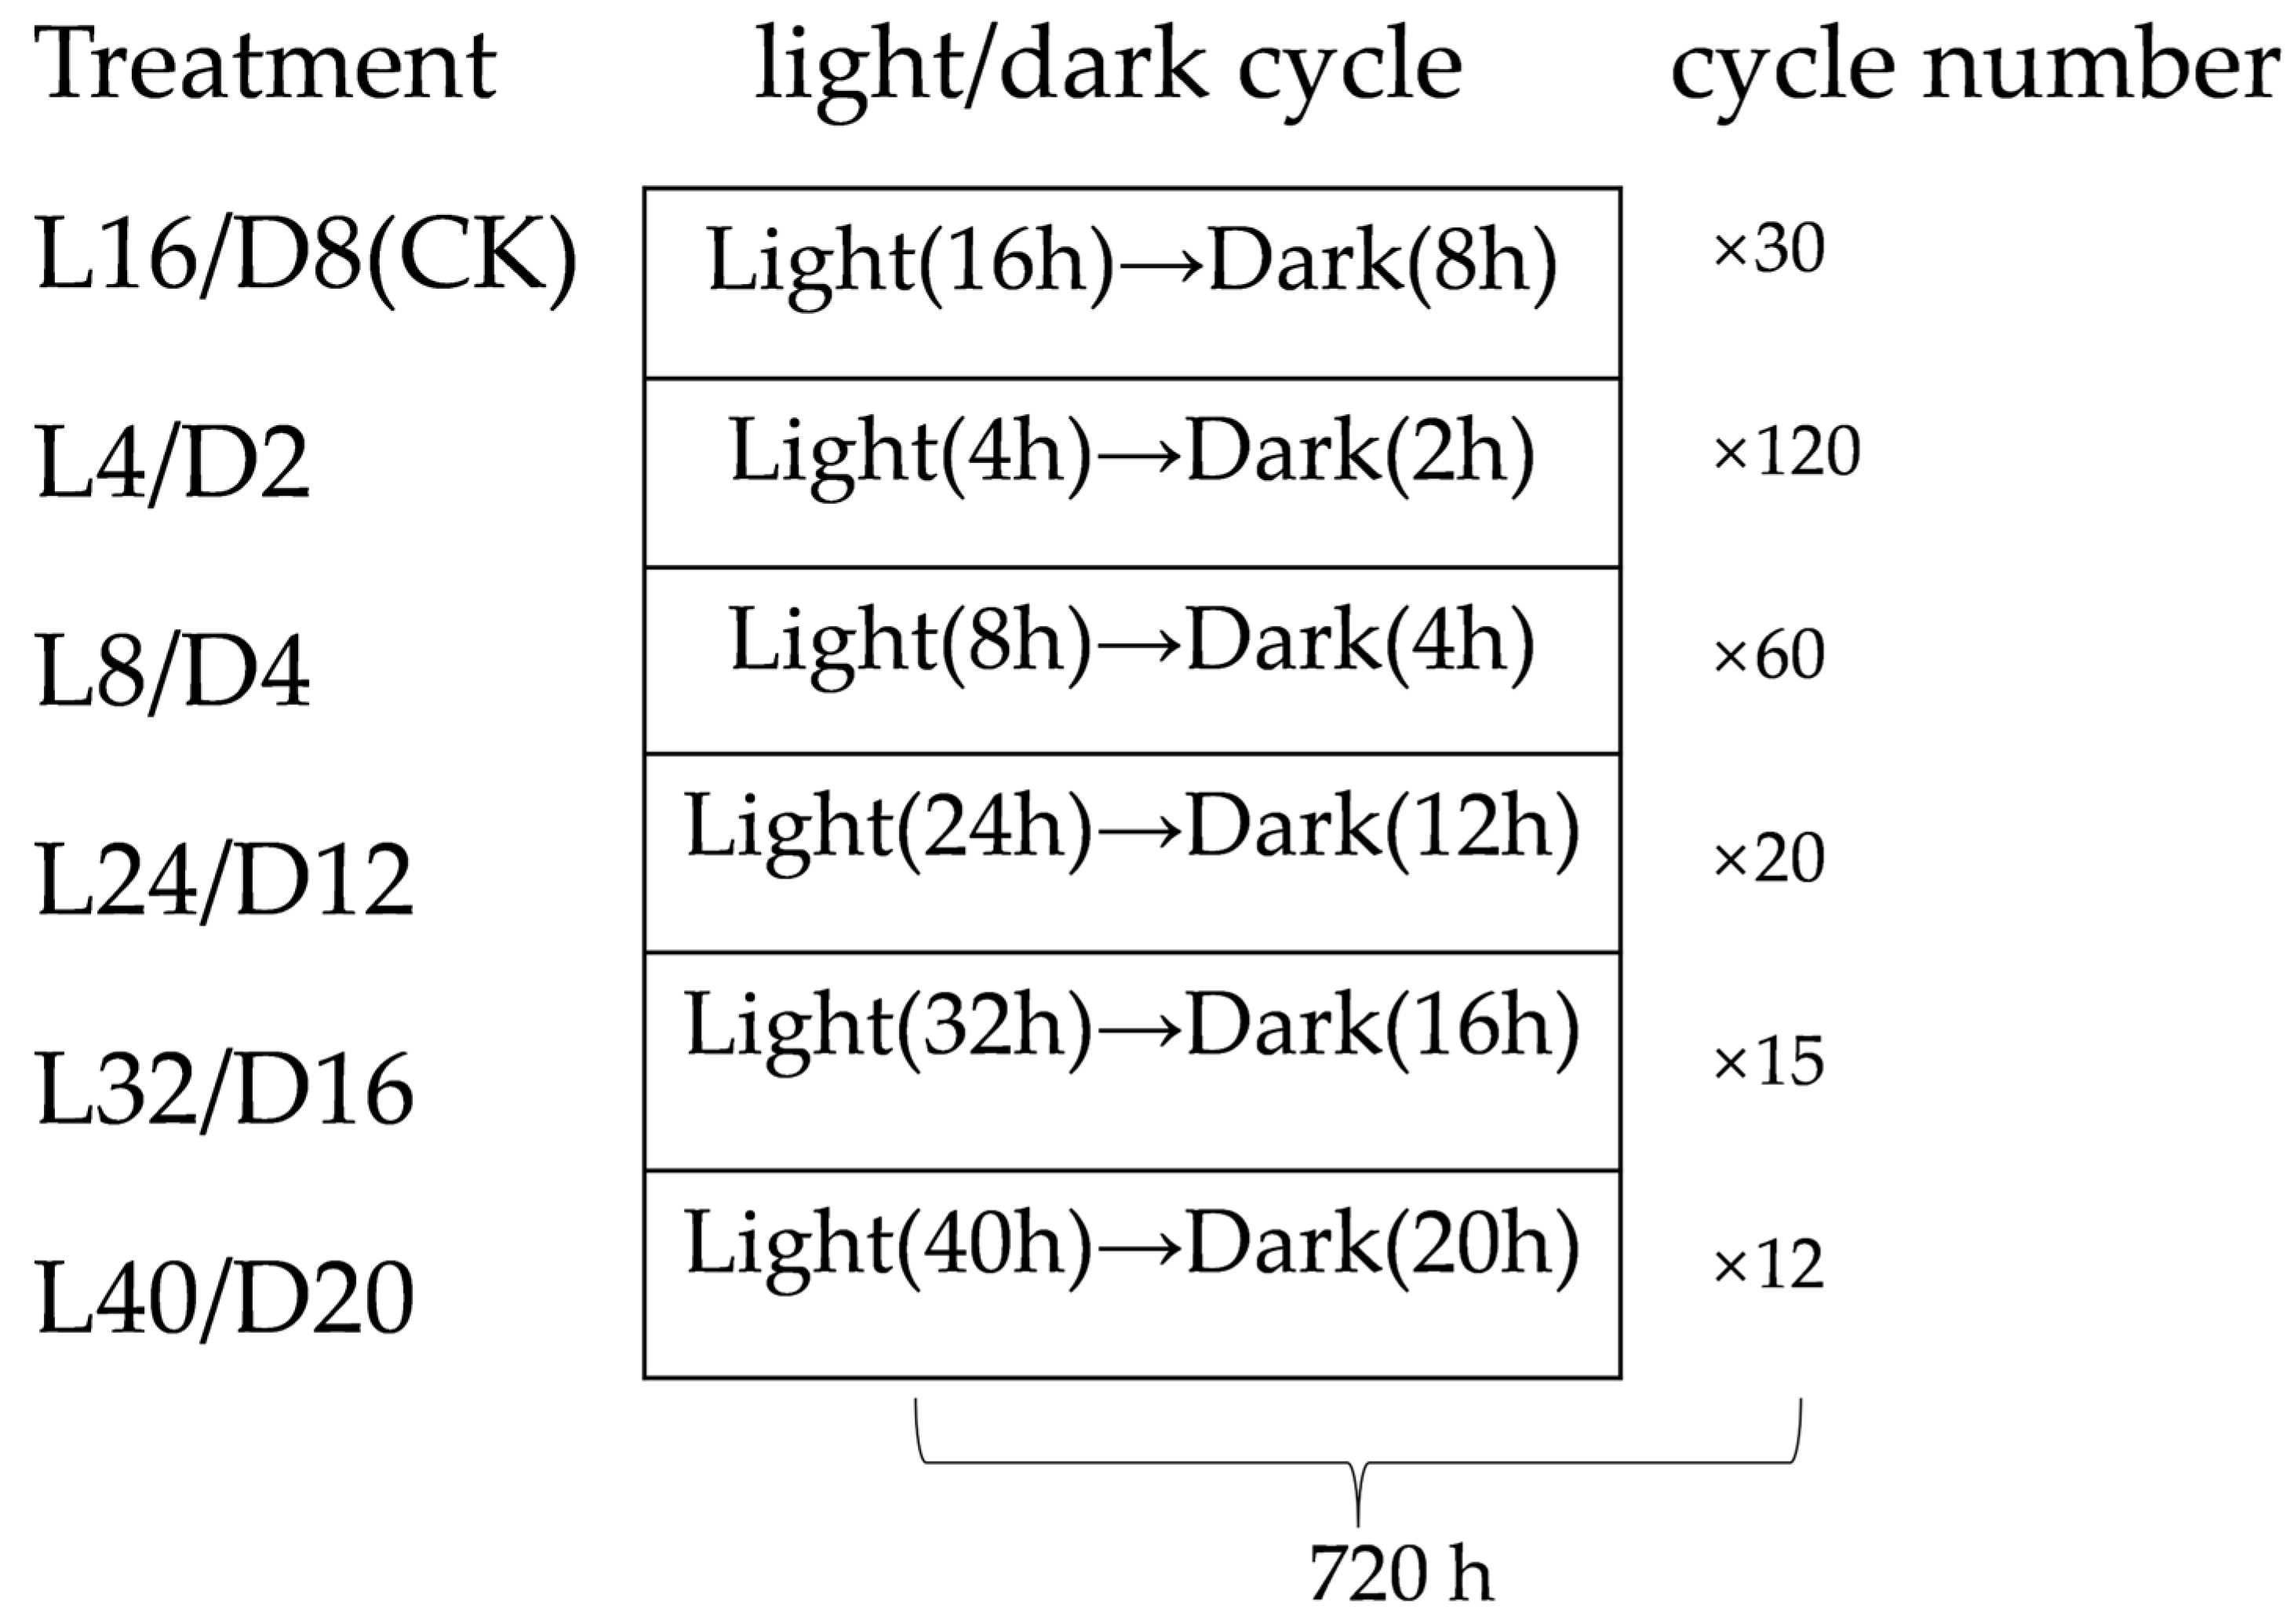
Figure 1. Irradiation patterns during a 720 h growth cycle under different treatments. L16/D8: 16 h of light/8 h of darkness (as the control group), L4/D2: 4 h of light/2 h of darkness, L8/D4: 8 h of light/42 h of darkness, L24/D12: 24 h of light/12 h of darkness, L32/D16: 32 h of light/16 h of darkness, L40/D20: 40 h of light/20 h of darkness. Each treatment group underwent 30, 120, 60, 20, 15, and 12 light–dark cycles during the growth cycle. The arrow indicates that light processing has ended and dark processing will begin.
Agriculture 15 02228 g001
Figure 2. Growth state of celery under different light–dark cycles.
Agriculture 15 02228 g002
Figure 3. Effects of different light–dark cycles on the growth indicators of celery. (A) plant height, (B) root length, (C) petiole width, (D) number of petioles. Distinct letters placed above the bars denote statistically significant differences (p < 0.05) as assessed by one-way ANOVA followed by Duncan’s multiple range test.
Agriculture 15 02228 g003
Figure 4. Effects of different light–dark cycles on the root activity of celery. Distinct letters placed above the bars denote statistically significant differences (p < 0.05) as assessed by one-way ANOVA followed by Duncan’s multiple range test.
Agriculture 15 02228 g004
Figure 5. Effects of different light–dark cycles on photosynthetic parameters of celery. (A) Tr, (B) Pn, (C) Ci, (D) Gs. Data are presented as mean ± SD (n ≥ 3). Distinct letters placed above the bars denote statistically significant differences (p < 0.05) as assessed by one-way ANOVA followed by Duncan’s multiple range test.
Agriculture 15 02228 g005
Figure 6. Effects of different light–dark cycles on chlorophyll fluorescence parameters of celery. (A) Fv/Fm, (B) Y(II), (C) qP, (D) NPQ, (E) ETR, (F) Fv/Fo. Distinct letters placed above the bars denote statistically significant differences (p < 0.05) as assessed by one-way ANOVA followed by Duncan’s multiple range test.
Agriculture 15 02228 g006
Figure 7. Effects of different light–dark cycles on antioxidant enzymes and MDA content in celery. (A) SOD, (B) POD, (C) CAT, (D) MDA. Distinct letters placed above the bars denote statistically significant differences (p < 0.05) as assessed by one-way ANOVA followed by Duncan’s multiple range test.
Agriculture 15 02228 g007
Figure 8. Effects of different light–dark cycles on proline content in celery. Distinct letters placed above the bars denote statistically significant differences (p < 0.05) as assessed by one-way ANOVA followed by Duncan’s multiple range test.
Agriculture 15 02228 g008
Figure 9. Effects of different light–dark cycles on antioxidant substances in celery. (A) Total phenols, (B) Total flavonoids, (C) Ascorbic acid, (D) Anthocyanins. Distinct letters placed above the bars denote statistically significant differences (p < 0.05) as assessed by one-way ANOVA followed by Duncan’s multiple range test.
Agriculture 15 02228 g009
Figure 10. Effects of different light–dark cycles on nutrients in celery. (A) Soluble protein, (B) Soluble sugar, (C) Free amino acid, (D) Nitrate nitrogen, (E) Cellulose, (F) Hemi–cellulose. Distinct letters placed above the bars denote statistically significant differences (p < 0.05) as assessed by one-way ANOVA followed by Duncan’s multiple range test.
Agriculture 15 02228 g010
Figure 11. Correlation analysis of celery growth and physiology under light–dark cycles. (A) Blade, (B) petiole. Statistical significance is denoted by asterisks (* p < 0.05, ** p < 0.01, *** p < 0.001). Note: Indicators without significant correlation were excluded from the correlation analysis chart.
Agriculture 15 02228 g011aAgriculture 15 02228 g011b
Figure 12. Principal component analysis of celery growth and physiological indicators under light–dark cycles. (A) Principal component analysis of growth and photosynthetic characteristics of celery. (B) Principal component analysis of blade physiological indicators. (C) Principal component analysis of petiole physiological indicators.
Agriculture 15 02228 g012aAgriculture 15 02228 g012b
Table 1. Effects of different light–dark cycles on celery biomass.
TreatmentsShoot Fresh Weight (g)Root Fresh Weight (g)Shoot Dry
Weight (g)
Root Dry
Weight (g)
CK153 ± 8 d52.6 ± 2.7 d19.5 ± 1.0 b4.04 ± 0.11 c
4/2142 ± 6 e42.3 ± 0.9 e19.0 ± 0.9 b2.91 ± 0.32 d
8/4225 ± 7 a59.2 ± 3.1 c21.2 ± 0.5 a4.60 ± 0.28 b
24/12218 ± 5 a73.2 ± 1.8 a18.5 ± 1.2 b5.20 ± 0.26 a
32/16162 ± 6 c61.8 ± 2.4 bc17.0 ± 0.9 c4.61 ± 0.24 b
40/20178 ± 4 b63.2 ± 1.7 b19.6 ± 0.4 b5.35 ± 0.26 a
Note: The letters in the table denote statistically significant differences (p < 0.05) as assessed by one-way ANOVA followed by Duncan’s multiple range test.
Table 2. Effects of different light–dark cycles on photosynthetic pigments of celery.
TreatmentsChlorophyll a
(mg·100 g−1)
Chlorophyll b
(mg·100 g−1)
Total Chlorophyll
(mg·100 g−1)
Carotenoids
(mg·100 g−1)
CK27.0 ± 0.2 f12.8 ± 0.4 e39.7 ± 0.2 e9.4 ± 0.3 f
4/231.3 ± 0.2 d14.9 ± 0.4 c46.2 ± 0.5 c10.6 ± 0.1 d
8/438.1 ± 0.2 a19.4 ± 0.3 a57.5 ± 0.5 a13.3 ± 0.1 a
24/1235.7 ± 0.2 b17.5 ± 0.4 b53.2 ± 0.4 b12.6 ± 0.1 b
32/1635.4 ± 0.2 c17.9 ± 0.3 b53.3 ± 0.2 b12.4 ± 0.1 c
40/2030.0 ± 0.2 e14.3 ± 0.4 d44.3 ± 0.4 d9.6 ± 0.1 e
Note: The letters in the table denote statistically significant differences (p < 0.05) as assessed by one-way ANOVA followed by Duncan’s multiple range test.
Table 3. Principal component coefficient matrix of growth and photosynthetic traits.
Classification of Indicators
PC1PC2PC3
Plant height0.290.080.00
Root length0.26−0.120.06
Petiole width0.260.00−0.18
Number of petioles0.23−0.09−0.06
Shoot fresh weight0.240.03−0.26
Root fresh weight0.210.29−0.05
Shoot dry weight−0.02−0.13−0.45
Root dry weight0.170.25−0.07
Pn0.280.02−0.11
Gs0.240.230.14
Ci0.240.220.16
Tr0.230.230.09
Fv/Fm−0.050.36−0.30
Y(II)0.000.240.35
qP0.040.020.48
NPQ−0.01−0.390.25
ETR−0.120.350.27
Fv/Fo−0.130.34−0.20
Chlorophyll a0.28−0.140.04
Chlorophyll b0.28−0.150.03
Total chlorophyll0.28−0.140.04
Carotenoids0.28−0.12−0.01
Eigenvalue10.914.763.21
Percentage of variance (%)49.621.614.6
Cumulative (%)49.671.285.8
Table 4. The principal component coefficient matrix of physiological traits of blades and petioles.
Blade PhysiologyPetiole Physiology
PC1PC2PC3PC1PC2PC3
AsA0.280.03−0.190.30−0.170.07
Soluble protein0.210.04−0.440.160.290.26
Soluble sugar0.22−0.37−0.120.26−0.27−0.29
Nitrate-nitrogen−0.050.520.01−0.210.32−0.10
SOD0.320.03−0.050.320.06−0.01
POD0.340.04−0.040.32−0.08−0.12
CAT0.340.07−0.060.300.18−0.06
Free amino acid0.280.280.110.220.26−0.51
MDA0.30−0.060.260.30−0.070.08
Proline0.220.030.660.200.020.63
Total phenols0.25−0.27−0.300.270.09−0.25
Total flavonoids0.22−0.350.370.27−0.280.04
Cellulose0.300.11−0.100.150.430.06
Hemi-cellulose0.260.23−0.010.250.27−0.06
Root activity0.060.500.01−0.030.510.09
Anthocyanins 0.28−0.040.28
Eigenvalue8.273.251.149.062.981.29
Percentage of variance (%)55.121.77.6356.618.68.06
Cumulative (%)55.176.884.456.675.383.3
Table 5. Principal component scores, composite scores, and rankings under different light–dark cycles.
Classification of
Indicators
TreatmentU1U2U3D ValueRank
Growth and photosynthetic
properties
CK0.000.710.000.185
4/20.070.140.730.206
8/41.000.000.020.583
24/120.981.000.330.871
32/160.860.521.000.802
40/200.300.710.580.454
Wight (Wi)0.580.250.17
Blade physiology CK0.000.260.890.155
4/20.040.121.000.066
8/40.020.350.000.104
24/120.541.000.810.613
32/160.940.360.490.701
40/201.000.000.720.652
Weight (Wi)0.650.260.09
Petiole physiologyCK0.020.171.000.145
4/20.080.000.860.146
8/40.000.460.000.104
24/120.241.000.750.463
32/160.940.510.600.811
40/201.000.140.000.712
Weight (Wi)0.680.220.10
Disclaimer/Publisher’s Note: The statements, opinions and data contained in all publications are solely those of the individual author(s) and contributor(s) and not of MDPI and/or the editor(s). MDPI and/or the editor(s) disclaim responsibility for any injury to people or property resulting from any ideas, methods, instructions or products referred to in the content.