Article

Numerical Optimization of Root Blanket-Cutting Device for Rice Blanket Seedling Cutting and Throwing Transplanter Based on DEM-MBD

1
College of Engineering, China Agricultural University, Beijing 100083, China
2
Institute of Agricultural Engineering, Jiangxi Academy of Agricultural Sciences, Nanchang 330200, China
3
School of Engineering Technology, Baoshan University, Baoshan 678000, China
*
Authors to whom correspondence should be addressed.
Agriculture 2025, 15(20), 2105; https://doi.org/10.3390/agriculture15202105
Submission received: 14 September 2025 / Revised: 4 October 2025 / Accepted: 8 October 2025 / Published: 10 October 2025

Abstract

To solve the problems of large root damage and incomplete seedling blocks (SBs) in rice machine transplanting, this study numerically optimized the root blanket-cutting device for rice blanket seedling cutting and throwing transplanters based on the discrete element method (DEM) and multi-body dynamics (MBD) coupling method. A longitudinal sliding cutter (LSC)–substrate–root interaction model was established. Based on the simulation tests of Center Composite Design and response surface analysis, the sliding angle and cutter shaft speed of the LSCs arranged at the circumferential angles (CAs) of 0°, 30°, and 60° were optimized. The simulation results indicated that the LSC arrangement CA significantly affected the cutting performance, with the optimal configuration achieved at a CA of 60°. Under the optimal parameters (sliding angle of 57°, cutter shaft speed of 65.3 r/min), the average deviation between the simulated and physical tests was less than 11%, and the reliability of the parameters was verified. A seedling needle–substrate–root interaction model was established. The Box–Behnken Design method was applied to conduct simulation tests and response surface optimization, focusing on the picking angle, needle width, and rotary gearbox speed. The simulation results showed that the picking angle was the key influencing factor. Under the optimal parameters (picking angle of 20°, seedling needle width of 15 mm, rotary gearbox speed of 209 r/min), the average deviation between the simulated and physical tests was less than 10%, which met the design requirements. This study provides a new solution for reducing root injury, improving SB integrity, and reducing energy consumption in rice transplanting, and provides theoretical and technical references for optimizing transplanting machinery structure and selecting working parameters.

1. Introduction

Rice machine transplanting is the most important mechanized planting method in China. As a mature technology, it has the advantages of high efficiency, stable yield, and high yield and plays an important role in rice production [1,2]. However, the existing rice transplanter seedling needles cause severe damage to the seedling roots and stems when tearing off the seedling blocks (SBs) from the rice blanket seedling root blanket, resulting in the presence of a greening period after seedling transplanting [3,4]. The substrate wrapped around the root system may also be pulled apart by the seedling needle, thus exposing the roots and making the SB incomplete and irregular. In addition, the excessive planting depth of these SBs hinders seedling recovery after transplanting [5]. The greening period after transplanting prolongs the rice growth period and increases the crop tension, especially in the case of bad weather. In the double-cropping rice area and rice-rapeseed rotation area in the south of China, the yield and quality of rice must be sacrificed to carry out the machine transplanting operation, and the varieties with short growth periods must be used, which contradicts the long growth period of the best-selling and high-quality varieties in the market [5,6,7].
The authors’ team developed a novel rice blanket seedling-cutting and -throwing transplanter that addresses the issue of seedling damage during rice machine transplanting. This machine features minimal transplanting injury, high SB integrity, shallow planting depth, and low energy consumption. Before throwing planting rice blanket seedlings, the root blanket must be cut into SBs first. Therefore, the root blanket-cutting device is a core component of the rice blanket seedling cutting and throwing transplanter, playing a crucial role in ensuring the SBs’ integrity and the planting process’s quality. Therefore, it is necessary to optimize the root blanket-cutting device in order to improve its operational performance. A well-designed cutting device structure is a fundamental basis and key guarantee for increasing crop yield and added value while reducing energy consumption during cutting operations [8,9,10]. The cutting method has an important effect on the cutting performance, which is mainly categorized into positive and sliding cutting according to the direction of the cutting action [11]. Sliding cutting is often preferred for cutting operations, as it requires significantly less cutting force and power consumption than positive cutting within a certain range of speed and angle [12,13]. The angle between the normal to any point on the edge curve and the velocity direction at that point is the sliding angle [14]. Large variations in the sliding angle of the cutting blade can cause fluctuations in the cutting-resistive torque, which in turn triggers the vibration of the sliding blade, exacerbating the fatigue wear of the components and increasing the cutting power consumption [11,15]. When working in the soil, a sliding shovel with an equal sliding angle operates more smoothly, causes less soil breakage, and minimizes disturbance to the soil cross-section [16,17]. To reduce substrate breakage during cutting, the edge curve of the root blanket longitudinal sliding cutter (LSC) is designed based on a logarithmic helix.
Current research on the performance of rice mechanized transplanting primarily focuses on optimizing the motion trajectory and operating parameters of the transplanter’s planting mechanism, mainly through kinematic and dynamic analyses [18,19,20]. However, these studies generally overlook the interaction between the seedling needle and the root blanket, which is critical in determining transplanting quality. The rice blanket seedling root blanket is a flexible complex of stems, roots of multiple seedlings, and substrate. There are highly complex root-to-root interactions among different seedlings, as well as stem-to-substrate, root-to-substrate, and substrate-to-substrate interactions, that are difficult to visualize accurately. The working conditions of the root blanket-cutting device are highly complex, as its interactions with the root blanket involve coupled dynamics among the LSC, substrate, and root, as well as the interactions between the seedling needle, substrate, and root. The mechanisms underlying these interactions are difficult to elucidate fully, resulting in a lack of theoretical guidance for optimizing the performance of the root blanket-cutting device. Therefore, the numerical simulation method is used to study the interaction between the cutting device and the root blanket and to optimize the root blanket-cutting device, laying a theoretical foundation for further improving the SB integrity and reducing the cutting resistance.
The finite element method (FEM) and discrete element method (DEM) are two core methods in the study of particle dynamics in engineering numerical simulation [21]. The DEM is the primary numerical simulation approach for studying the interaction between agricultural materials and operating components. It offers accurate and efficient predictions of the dynamic behavior of soil and crops during agricultural operations [22,23]. However, studies on machinery–crop–soil interactions using this methodology have mainly focused on soil tillage in dryland agriculture [2]. For instance, DEM model development has primarily focused on applications such as rotary tillage [24], deep-loosening [25], root-cutting and harvesting [17,26], deep straw burial [27], and residue management [28,29], with an emphasis on improving soil quality. The DEM can provide stress and movement data of soil and straw under different microstructural and operational conditions [30]. The effect of complex mechanism motion on particle action can be explored using DEM coupled with MBD [27]. Chen et al. [22] employed coupled EDM-MFBD simulation based on a soil–straw composite model to predict the operational quality and deformation stress distribution of a vertical straw-clearing tillage device. Lin et al. [31] employed coupled DEM-MBD simulation to investigate shovel seedbed preparation machine–straw–soil interactions, analyzing straw movement at varying soil depths, which provided a reference for optimizing straw returning machines and improving the uniformity of straw distribution in soil. Xie et al. [32] established a DEM-MBD coupling model to simulate the interactions of the flexible straw–Shajiang black soil–walking mechanism, quantified the soil stress induced by tracked vehicles, and elucidated the interaction mechanism between the walking system of agricultural machinery and soil.
The above studies offer valuable insights and technical support for developing the interaction model between the root blanket-cutting device for rice blanket seedling-cutting and -throwing transplanters and the root blanket. However, using numerical simulations to investigate the interaction mechanism between the cutting device and the root blanket remains unexplored. The objectives of this study were (1) to develop interaction models of LSC–substrate–rice root and seedling needle–substrate–root based on the coupled DEM-MBD method, (2) optimize the working parameters of three circumferential angle (CA) arrangements of LSCs using Central Composite Design and simulation tests, (3) verify the accuracy and reliability of the optimized parameters of the best LSC choice by comparing the physical and simulated test data, (4) optimize the working parameters of the seedling needles using Box–Behnken Design and simulation tests, and (5) compare the physical and simulated results for seedling needle with the optimized parameters to verify whether it effectively meet the design requirements of the cutting device.

2. Materials and Methods

2.1. Introduction of Root Blanket-Cutting Device

2.1.1. Structure and Working Principle

As shown in Figure 1, the rice blanket seedling-cutting and -throwing transplanter primarily consists of six components: the walking chassis, seedling box, root blanket-cutting device, pressing strip device, cylindrical gear planetary gear system throwing mechanism, and ridging mud ditching device. The machine operates with eight working rows, using 7-inch ordinary blanket seedlings, and the root blanket’s length, width, and height dimensions are 589 × 228 × 25 mm, respectively. The primary working process of the rice blanket seedling-cutting and -throwing transplanter is as follows: root blanket longitudinal cutting, point pressure on root blanket strips (RBSs), RBS lateral cutting, seedling needle transporting and throwing planting SB, and ridging mud ditching and standing seedlings. All parts work together to complete some processes simultaneously, which can effectively improve the quality and efficiency of rice blanket seedling-cutting and -throwing transplanter operation.
As the key device of rice blanket seedling-cutting and -throwing transplanter, the root blanket-cutting device mainly consists of LSCs and seedling needles. Among them, the seedling needle performs both lateral cutting and transporting and throwing planting SB functions. Therefore, it is not only an integral part of the root blanket-cutting device but also belongs to the cylindrical gear planetary gear system throwing mechanism. According to the number of lateral seedling feeding times of 12 times in the seedling box and the size of 7-inch ordinary blanket seedling root blanket, the number and spacing of LSCs have been normalized; that is, LSCs are installed directly below the back of the seedling box, and each working row contains 11 LSCs with a spacing of 18 mm. The cutter shafts between the working rows are connected by a coupling. Every four rows utilize a 10 N·m stepper motor to provide power for the cutter shaft. A 1:5 reducer is installed between the stepper motor and the cutter shaft to increase torque. Each working row corresponds to a set of cylindrical gear planetary gear system throwing mechanisms, which includes five identical cylindrical gears and two throwing arms (Figure 1). Two pairs of cylindrical gears and two throwing arms are symmetrically arranged on both sides of the sun gear. There is no relative motion between the throwing arm and the planetary gear because they are fixedly attached. The rotary gearbox shares the same axis as the sun gear, and the seedling needle is fixedly installed on the throwing arm. The sun gear stays stationary during the movement, while the rotary gearbox rotates counterclockwise as a power source. The two middle gears revolve around the sun gear, which causes the two planetary gears to rotate clockwise. The seedling needle on the throwing arm oscillates cyclically, following a circular trajectory. The walking chassis provides power for the rotary gearbox through the rear output shaft, gearbox, and seedling throwing transmission box.
The working principle of the root blanket-cutting device is as follows: the root blanket is placed on the bottom plate of the seedling box and moved to the LSCs under the action of the longitudinal seedling feeding belt, and the LSCs rotate once to cut it into 12 RBSs with a width of 19 mm and a cutting depth of 19 mm. The lateral seedling feeding mechanism moves precisely, the rotary gearbox rotates, and the longitudinal seedling feeding belt keeps moving the RBSs downward steadily and precisely to the seedling gate on the bottom rail of the seedling box. Then, the seedling needle cuts the RBSs laterally into 19 mm-long and 19 mm-wide SBs, which are then moved away from the seedling gate by the seedling needle at a constant speed in accordance with a specific circular trajectory to complete the next step of the throwing planting action.

2.1.2. Force Analysis

Increasing the sliding angle can effectively reduce the cutting resistance [33,34]. However, an excessive sliding angle results in a longer cutting path and higher frictional energy consumption, reducing operational efficiency and shortening the cutter’s lifespan [15]. Conversely, a sliding angle that is too small diminishes the sliding cutting effect and increases the inertial force acting on the cutter [35]. Therefore, an appropriate sliding angle has a vital influence on the cutting quality and power consumption.
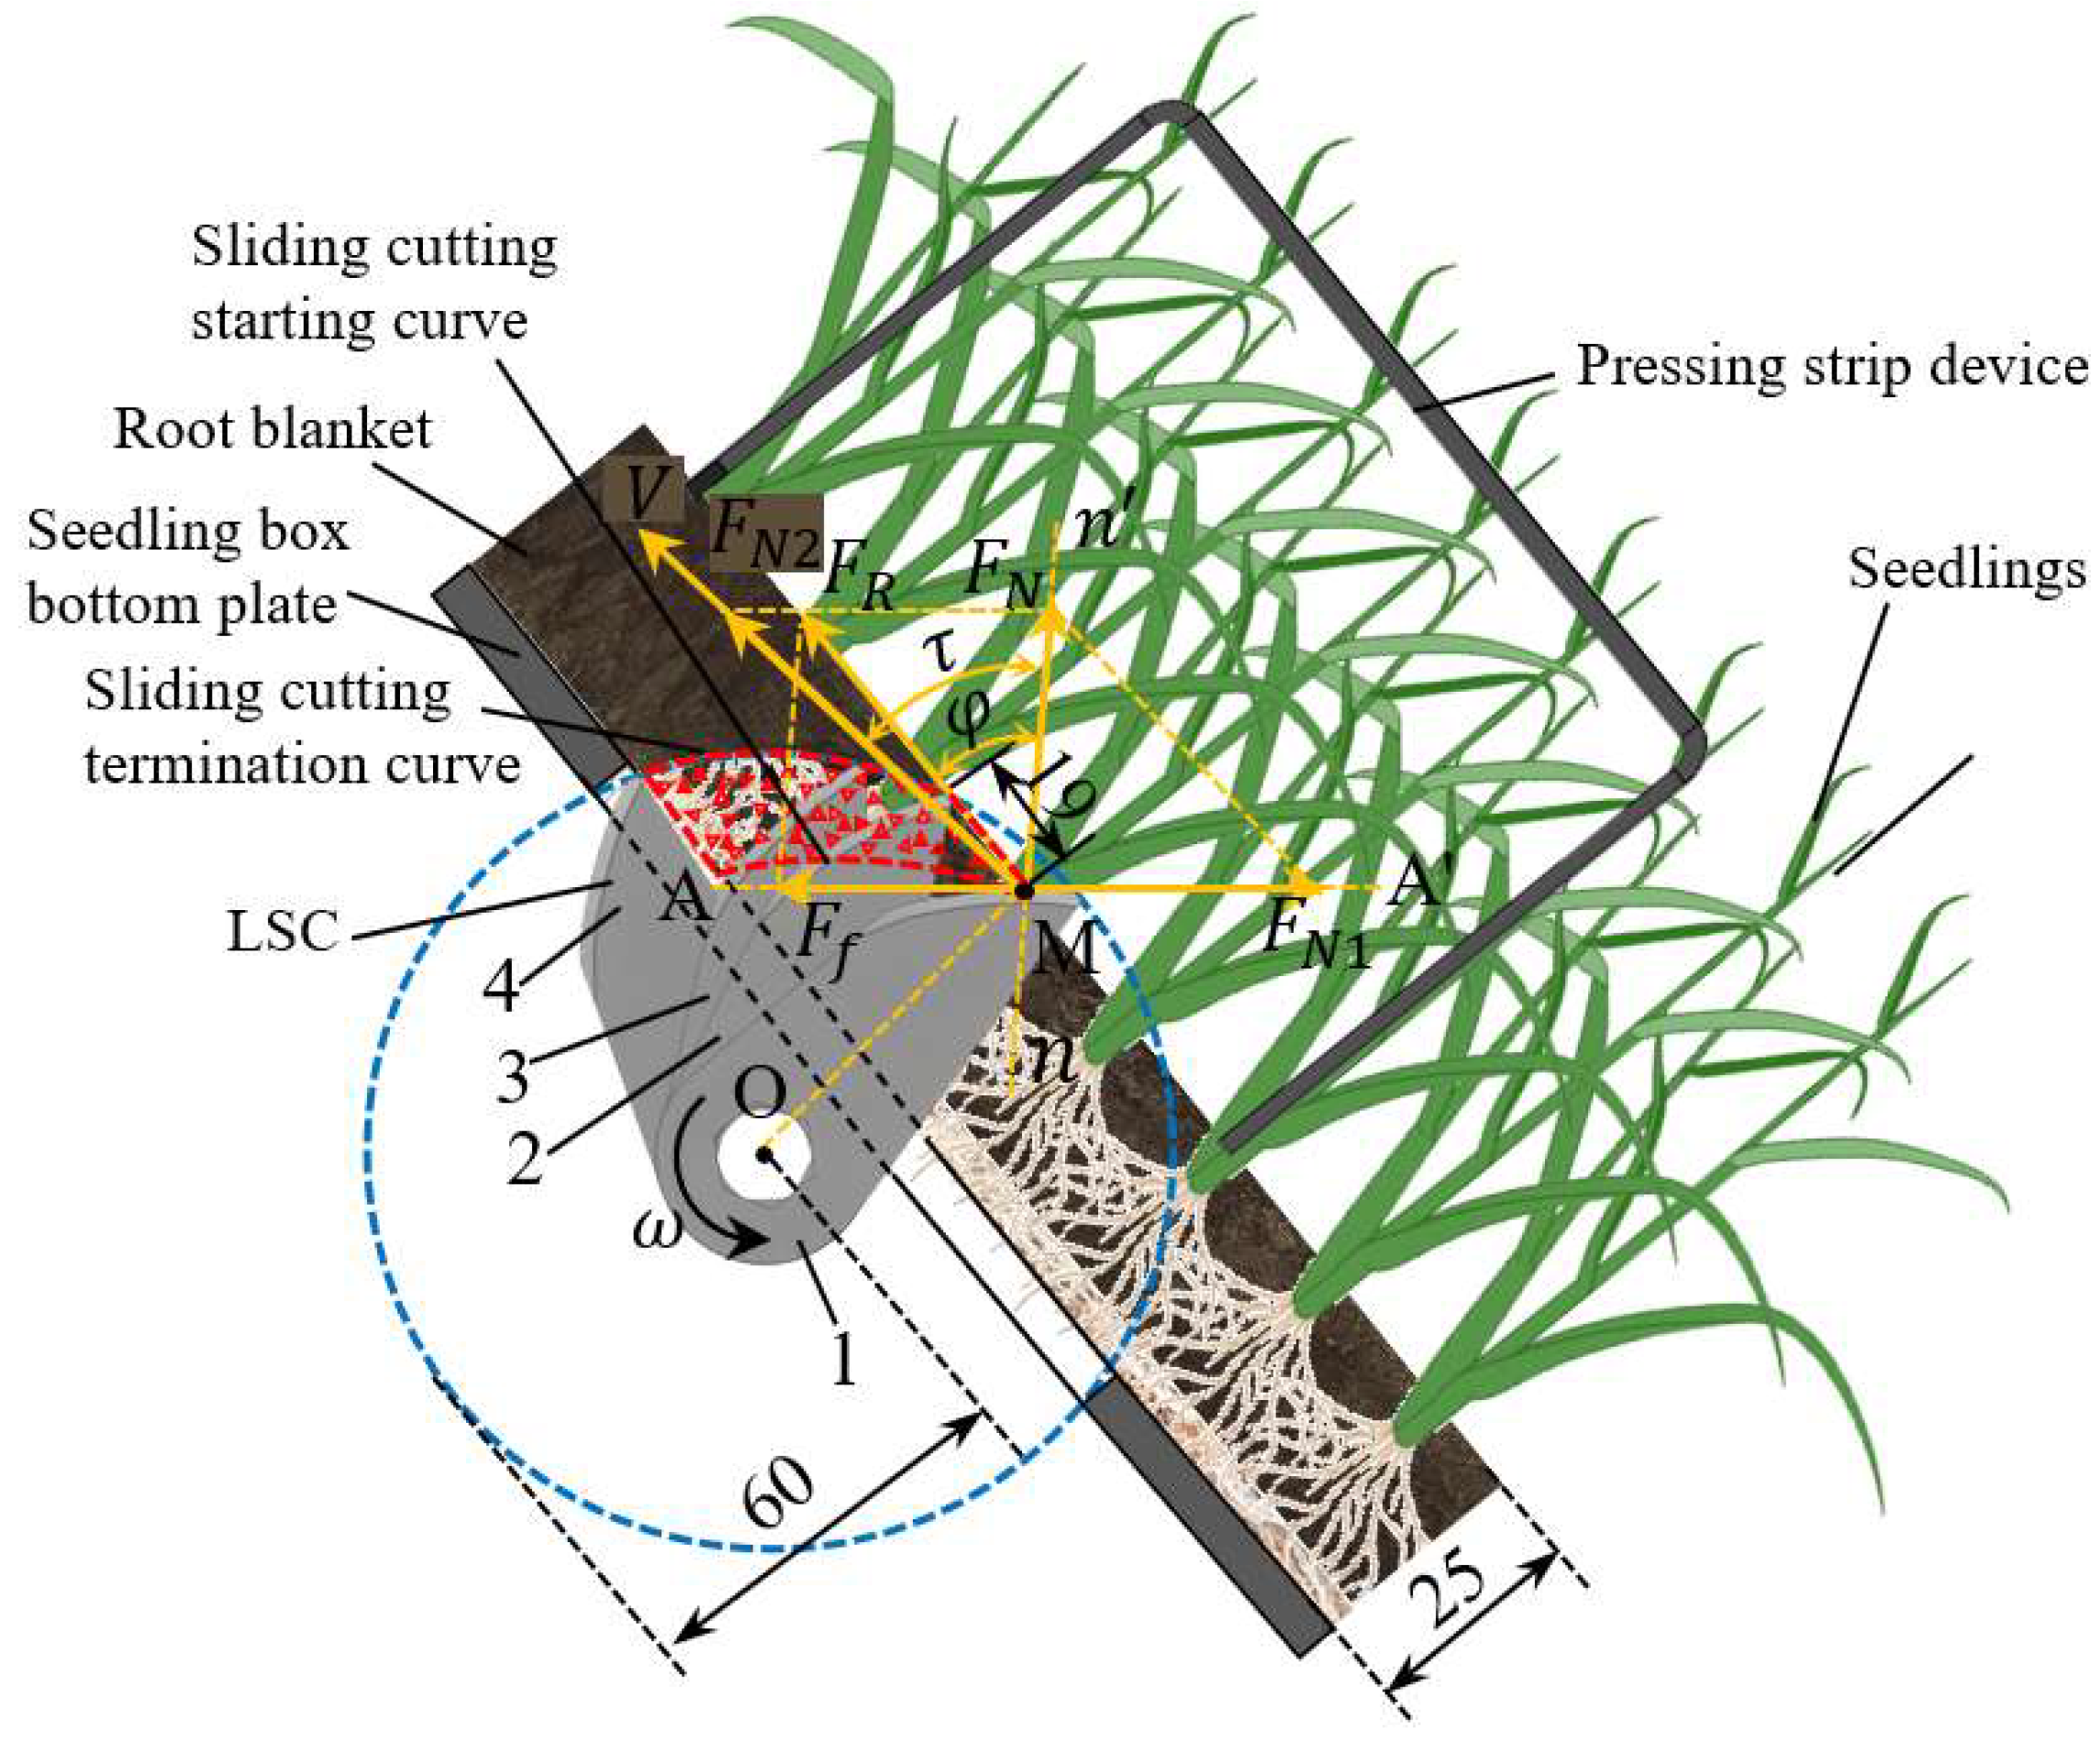
The force analysis of the longitudinal cutting process of the root blanket is carried out, and the force on the root blanket is shown in Figure 2. As both the root blanket and the cutting device are fixed to the transplanter and remain relatively stationary, there is no relative motion between them resulting from the transplanter’s forward speed. Consequently, the forward speed of the transplanter is not considered in the force analysis of the root blanket. Similarly, Zhang et al. did not consider the influence of the forward movement of the machine in the force analysis when studying the seedling separation stage [7]. Point O is defined as the center of the LSC’s rotation, and the contact point M between the edge curve and the rice blanket when the LSC begins to enter the cutting zone is used as the detachment point for analysis. A tangent line A-A′ is drawn along the edge curve at point M. The velocity at point M, denoted as V, is perpendicular to the radius OM. The angle between the V direction and the n-n′ direction normal to the M point is the sliding angle τ . FR is the combined force of the normal force FN and friction force Ff of the edge on the point M. The angle between FR and FN is the friction angle φ of the edge to the root blanket. FN is decomposed into FN1 and FN2 along the A-A ‘and V directions, respectively. It is observed that FN2 contributes only to the translational movement of the rice blanket along the direction of V and has a negligible effect on the sliding cutting action of LSC. From the geometry in Figure 2, it follows that
F N 1 = F N tan τ
F f = F N tan φ
The sliding cutting effect of the LSC only depends on FN1. Only when FN1 > Ff, does the root blanket begin to slide along the cutter’s edge curve, producing the sliding cutting effect. Therefore, the LSC produces a sliding cutting effect only when τ > φ. According to our previous research [36], the root blanket is a flexible complex consisting of the stem, root, and substrate—the friction angle between each component and steel ranges from 10.43° to 44.60°. Therefore, the sliding angle of the LSC in this study was set to range from 45° to 57°.
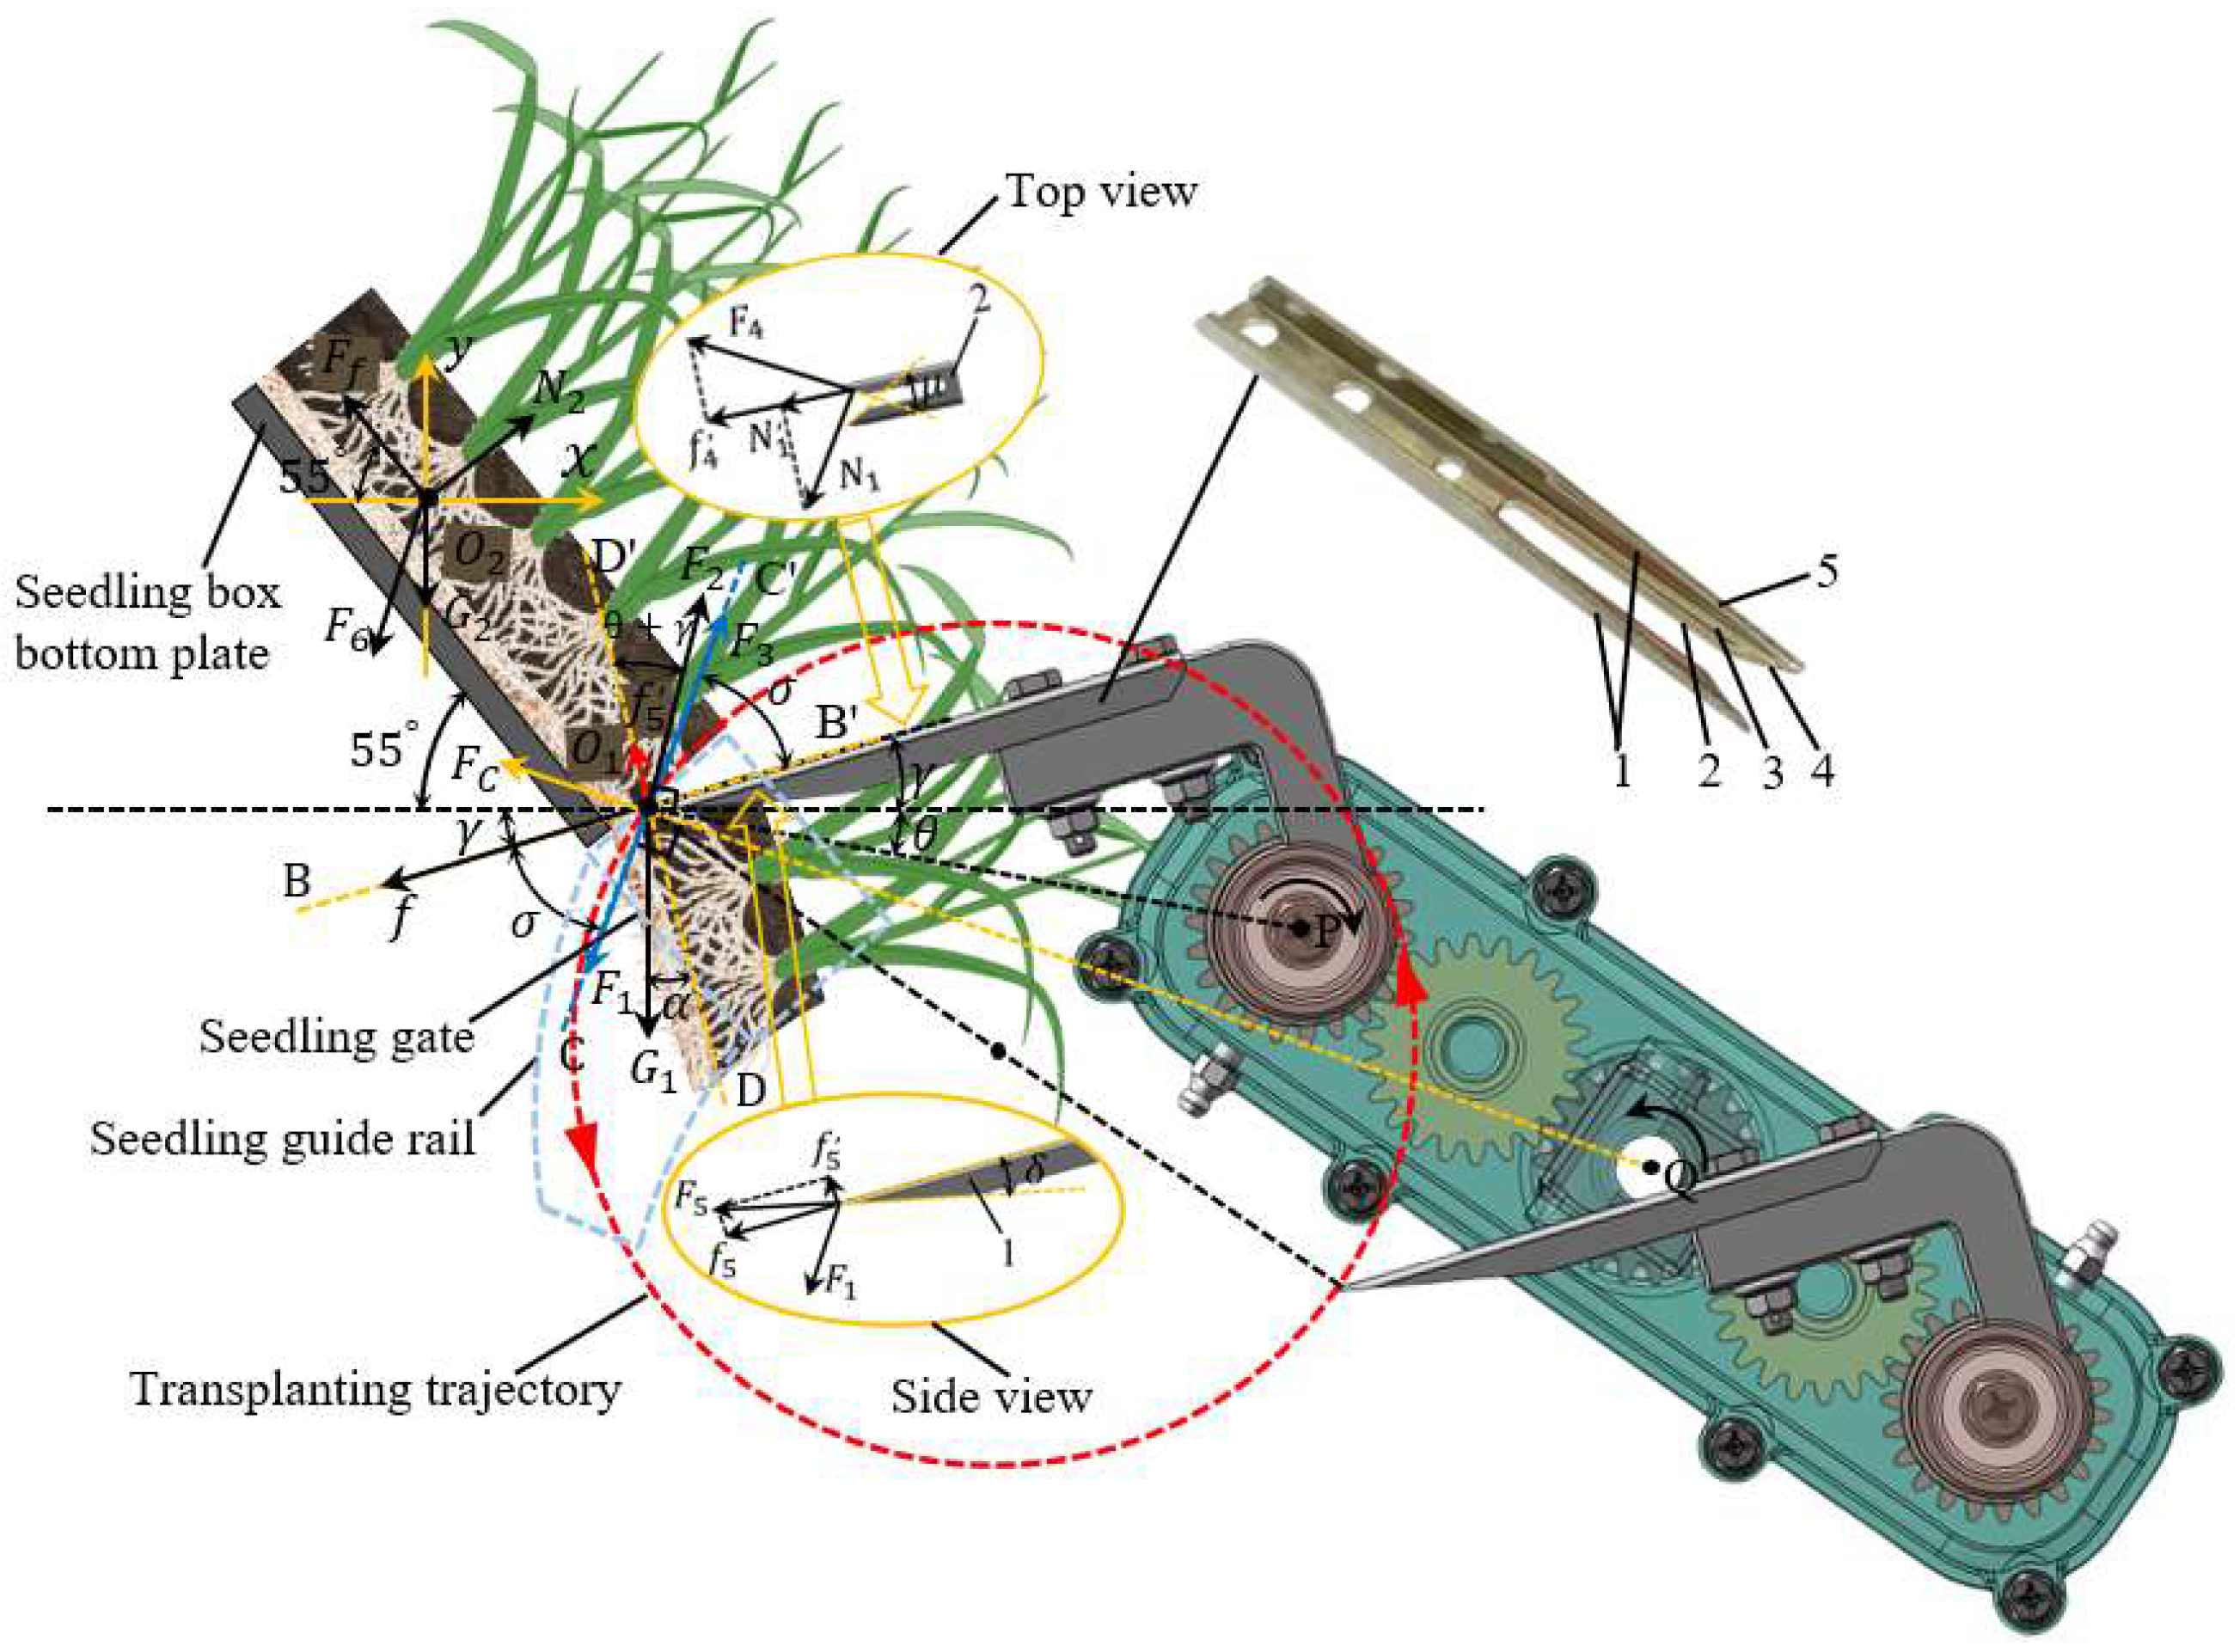
The lateral cutting process begins when the seedling needle penetrates the RBS and ends when the seedling needle detaches from the RBS. As the seedling needle passes through the RBS, a relative movement occurs between the RBS and the seedling needle. Based on the shape of the seedling needle, the edge surfaces that come into contact with the RBS can be classified into five types: side cutting-edge surface, narrow side cutting-edge surface, flat cutting-edge surface, narrow side cutting-edge inclined surface, and narrow flat cutting-edge inclined surface. Force analysis diagrams are constructed to analyze the mechanical changes during the lateral cutting process of the seedling needle, as shown in Figure 3. The research objects include the SB being cut at the seedling gate and the RBS connected to it, which is located at the seedling box bottom plate. In the analysis, the motion of the tip point of the seedling needle is considered. The seedling needle with uniform revolution around the sun gear exerts cutting and tearing forces on the RBS as it is cut into blocks. Simultaneously, the seedling needle also self-rotates uniformly around the planetary gear, providing a cushioning effect on the RBS lateral cutting. As a result, the seedling needle provides both pushing force F1 and cushioning force F2. Under the action of pushing force F1 and Coriolis force Fc, the cutting force f is generated on the root blanket by each cutting-edge surface of the seedling needle, along the direction of B-B′, with its plumb line directed along D-D’. Under the action of F1, the flat cutting-edge surface and the narrow flat cutting-edge inclined surface exert a tearing effect on the RBS along the direction of C-C′. The upper RBS generates a resistance force F1 opposite to F3 on the SB, and F2 acts as a buffer.
The cutting force f generates on the RBS at each cutting-edge surface of the seedling needle can be expressed as
f = f 1 + f 2 + f 3 + f 4 + f 5
where f1, f2, f3, f4, and f5 are the cutting forces generated by the side cutting-edge surface, narrow side cutting-edge surface, flat cutting-edge surface, narrow side cutting-edge inclined surface, and narrow flat cutting-edge inclined surface in the B-B′ direction, N, respectively, and in Equation (3), f4 and f5 are
f 4 = 2 f 4 + 2 N 1
f 5 = F 5 cos δ
F4 and F5 represent the cutting forces generated by the narrow side cutting-edge inclined surface and narrow flat cutting-edge inclined surface, respectively, with the directions parallel to the cutting-edge inclined surface, N. N1 is the extrusion force exerted by the narrow side cutting-edge inclined surface on the SB, N. f 4 and N 1 are the component forces of F4 and N1 along the B-B′ direction, f 4 = F 4 cos μ / 2   a n d   N 1 = N 1 sin μ / 2 , N; μ is the angle of the two narrow side cutting-edge inclined surfaces, ° ; and δ is the angle of the flat cutting-edge surface and narrow flat cutting-edge inclined surface,   ° .
Taking the SB being cut at the seedling gate as the object of study, the following dynamic equations need to be satisfied in the direction of cutting force B-B′ and tearing direction C-C′, respectively, in the process of lateral cutting:
f = F 1 cos σ + F c cos ( θ + γ ) f + G 1 sin α F 3 cos σ + F 2 sin θ + γ F 1 + G 1 sin σ + α F 3 + F 2 sin θ + γ + σ           + f 5 sin σ
where F1 is the pushing force generated by the uniform rotation of the planetary gear around the sun gear, N; F2 is the cushioning force generated by the uniform self-rotation of the seedling needle around the center of the planetary gear, N; F3 is the tension force on the SB from the upper RBS, N; Fc is the Coriolis force generated by the relative motion of the planetary gear [7], N; G1 is the gravity of the SB, N; f5 is the component force of F5 in the direction of D-D′, f 5 = F 5 sin δ , N; σ is the angle between B-B′ and C-C′, ° ;   α is the angle G1 between and D-D′,   ° ;   θ is the angle between O1P and the horizontal line, ° ; and γ is the picking angle, ° .
N 2 cos 35 ° = F f cos 55 ° + F 6 cos ( σ + α )                   F f sin 55 ° + N 2 sin 35 ° = G 2 + F 6 sin ( σ + α )
where N2 is the support force of the bottom plate of the seedling box to the RBS, N; Ff is the friction force between the seedling box bottom plate and the RBS, N; F6 is the tensile force of the SB on the RBS, N; and G2 is the gravity of the RBS, N.

2.1.3. Description of Three CA Arrangements of LSCs

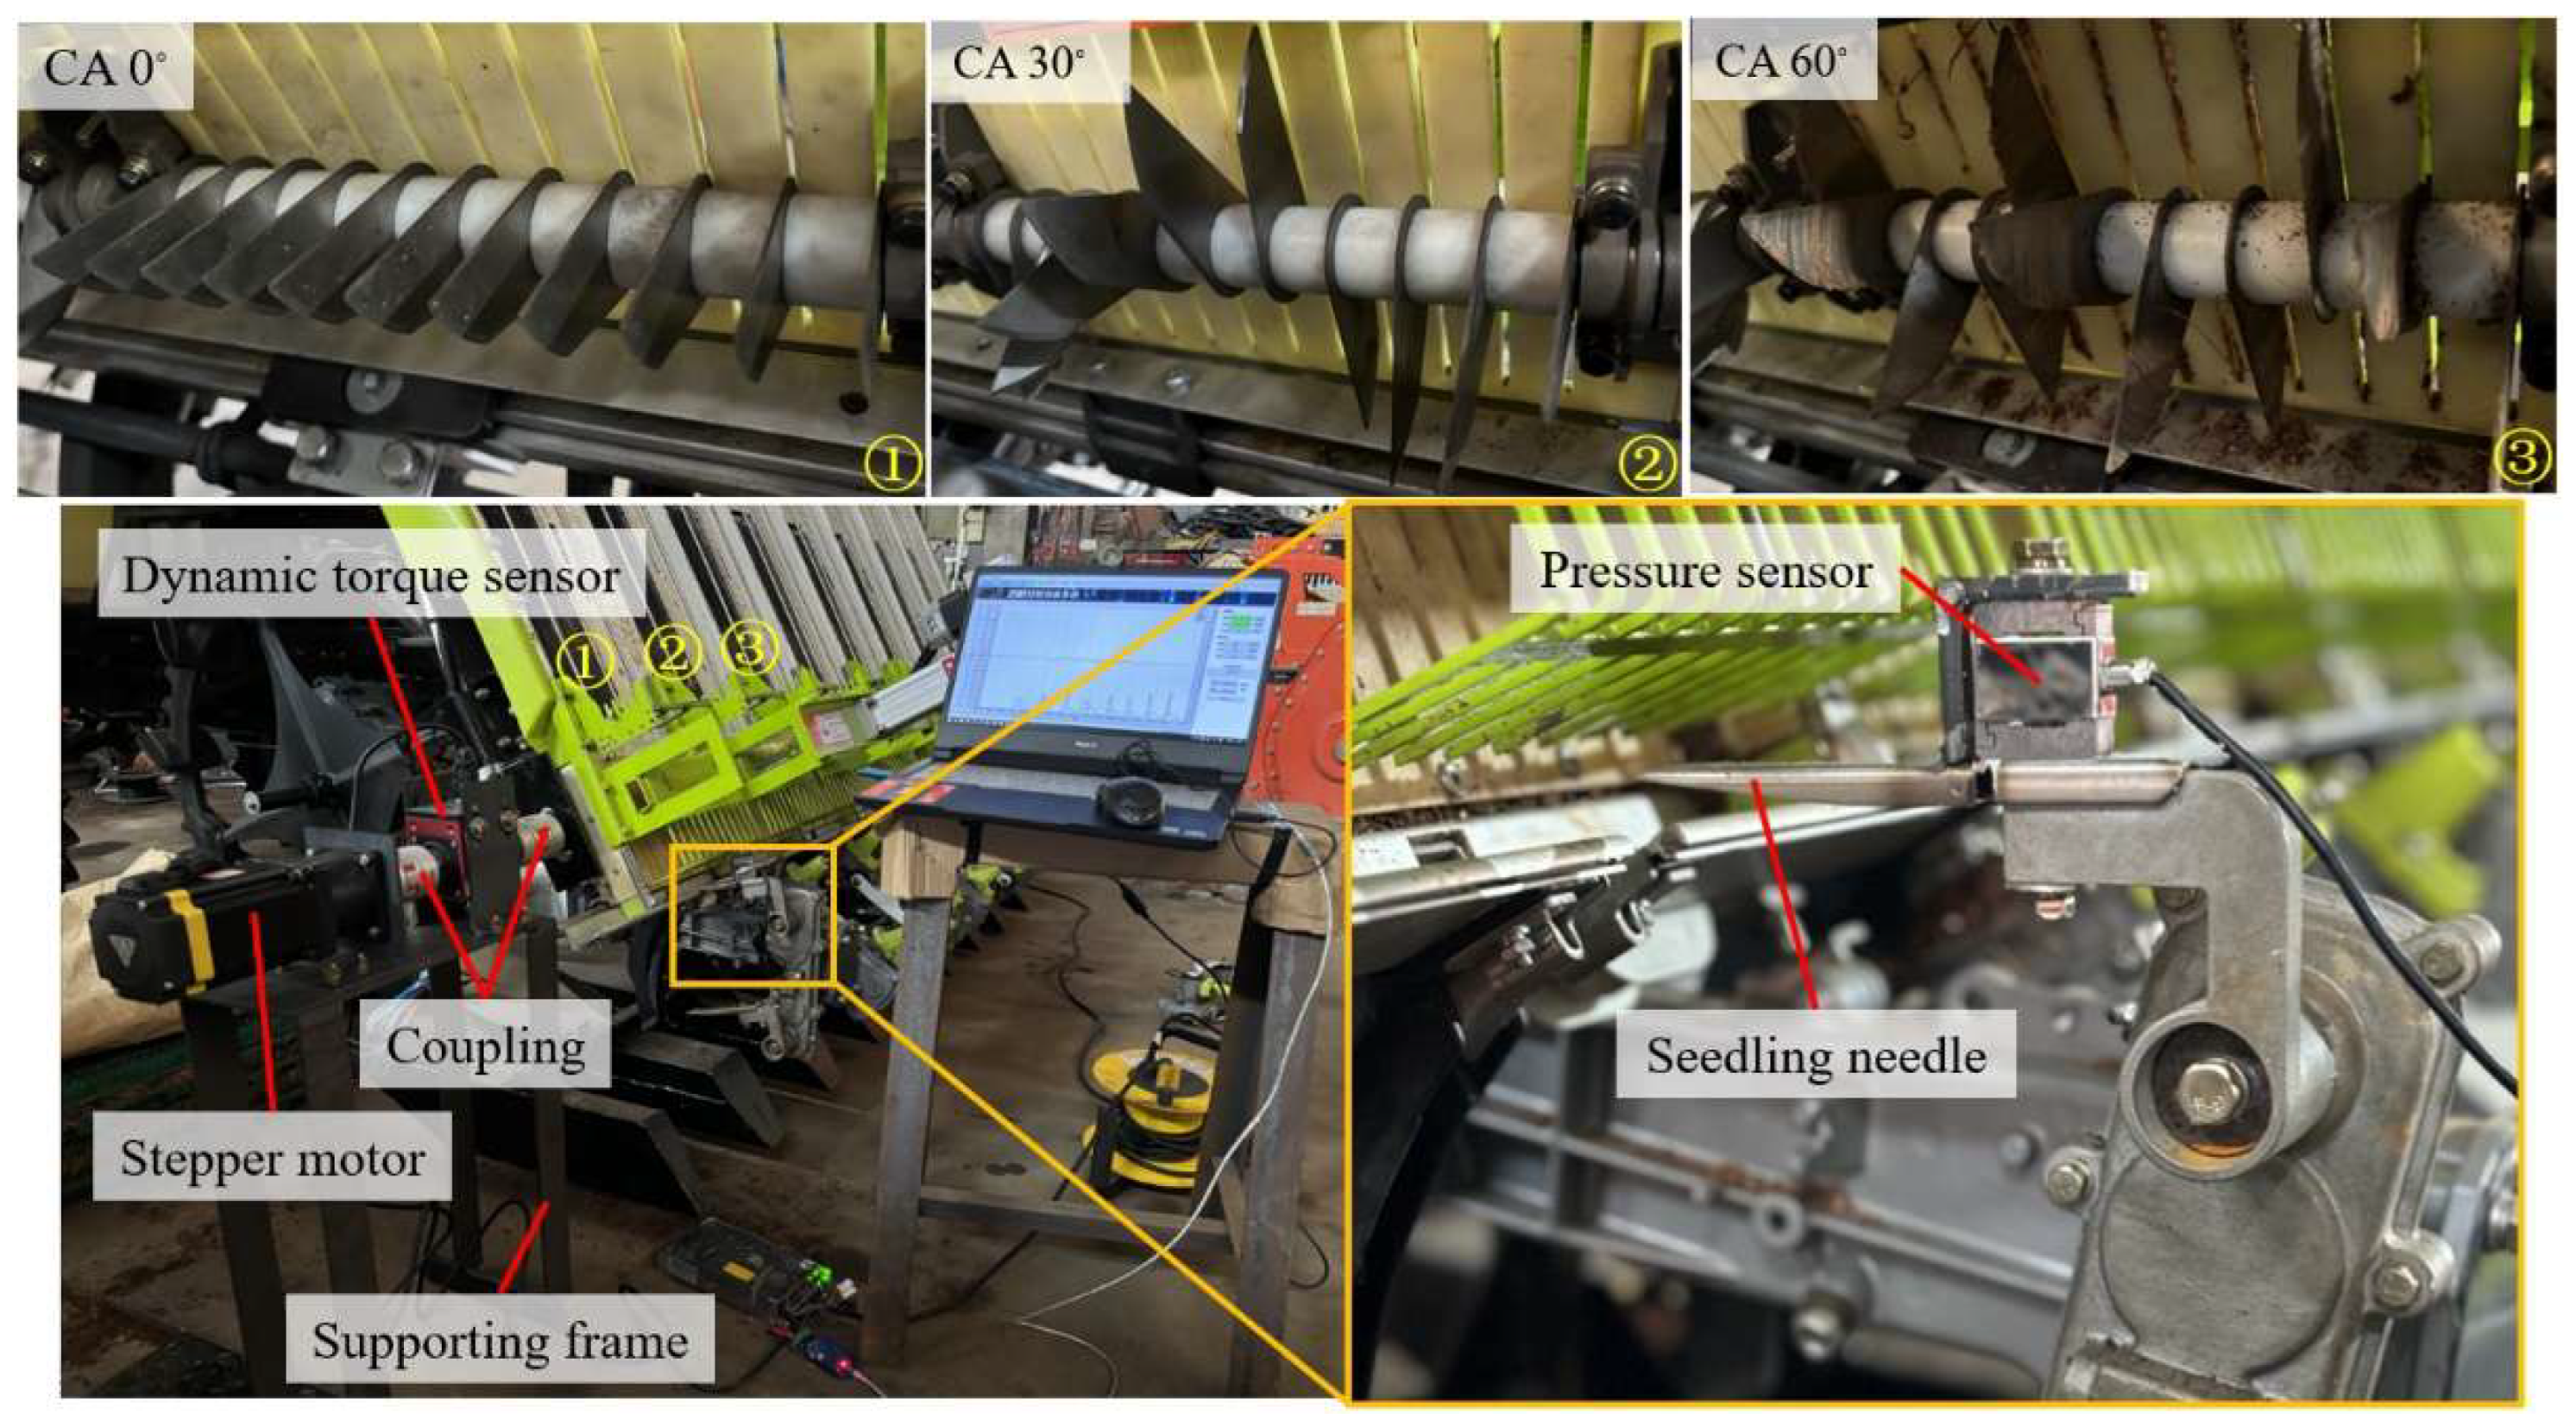
As shown in Figure 4a, the arrangement zone of the LSCs is divided into a cutter zone and a cutter-free zone, with the central cross-section of the cutter shaft serving as the boundary. The LSCs within the 180° circumferential range of the cutter zone are helically arranged at a specific CA. When LSCs are in contact with the root blanket, if the seedling box continues to feed seedlings longitudinally, the root blanket may be arched and stacked due to the excessive resistance of longitudinal seedling feeding. This study employed an intermittent cutting technique to prevent contact between the LSCs and the root blanket during longitudinal seedling feeding. During the longitudinal seedling feeding process, the central cross-section of the cutter shaft is parallel to the bottom plate of the seedling box. At this stage, the cutting zone exists beneath the seedling box’s bottom plate, ensuring no contact between the root blanket and the LSCs, representing the initial position. After the end of the longitudinal seedling feeding, the cutter shaft rotates a circle, and the LSCs in the cutting zone cut the root blanket above the bottom plate of the seedling box and return to the initial position. If the LSCs are uniformly arranged in a helical pattern within the cutter zone, the LSC number n and CA α must satisfy n = 180°/α + 1, and the circumferential 180° of the cutter shaft must be divisible by α. The angle between 0° and 30° is not considered, because there are too many LSCs engaged in cutting at the same time, so the possible CA values can only be 0°, 30°, 36°, 45°, 60°, and 90°. The reference angle is 0°, which needs to be included in the study. The number of LSCs with CA of 30°, 60°, and 90° arranged at the beginning of the contact with the root blanket is 2, 3, and 4, respectively. The more cutting phase synchronization, the greater the cutting torque, and the greater the impact force superposition; therefore, it is not recommended to choose 90°. This study selected three different CAs to arrange the LSCs, with CAs of 0°, 30°, and 60°. The core logic is also that the adjacent angle differences are completely consistent (both are 30°), which conforms to the principle of ‘arithmetic sampling’ and forms an arithmetic sequence of ‘0°→30°→60°’. The state of No.1 to 11 LSCs is consistent when the CA is 0° (Figure 4a). At a CA of 30°, No.1 to 7 LSCs are organized into a group positioned along a circumferential arc of 180°, followed by a similar arrangement for No.8 to 11 LSCs, which replicate the previous grouping (Figure 4b). When the CA is adjusted to 60°, No.1 to 4 LSCs are grouped along a circumferential arc of 180°, after which No. 5 to 8 and 9 to 11 LSCs are similarly grouped to mirror the earlier configuration (Figure 4c).
The selection of design variables is essential in the optimization process. As detailed in Section 2.1.2, which presents the force analysis of the root blanket longitudinal cutting process, the applicable range of sliding angle for the LSC in this study has been determined. Previous studies have demonstrated that the rotation speed of the cutting device significantly influences cutting resistance, torque, and energy consumption [10,37,38]. Based on extensive preliminary tests and the selected stepper motor’s rated torque, the cutter shaft speed in this study was set within the range of 60~100 r/min. Therefore, the optimal parameter combination of the sliding angle and the cutter shaft speed was sought to reduce the power consumption of the root blanket’s longitudinal cutting and improve the cutting efficiency and quality.

2.1.4. Description of Seedling Needle Working Parameters

As shown in Figure 3, the angle between the seedling needle and the horizontal line is the picking angle [39], which has an important effect on the force of the RBS lateral cutting process, as shown in Section 2.1.2. The picking angle is the principal determinant of the verticality of the SB’s upper and lower fracture surfaces. Increasing the picking angle enhances the verticality of the two fracture surfaces; however, an excessively large picking angle may result in the seedling needle puncturing and damaging the branches and leaves of the seedlings, which can adversely impact the seedlings’ capacity to reestablish and regreen following transplantation [20]. Considering the uprightness of the seedlings planted in the later stage, the picking angle was taken from 5° to 20° [18,39]. The smaller the gap between the seedling needle and the seedling gate, the more precise the seedling separation, but the higher the accuracy of the matching between the seedling needle and the seedling gate [40]. The width of the seedling gate of the rice blanket seedling cutting and throwing transplanter is 19 mm, the width of the SB is mainly determined by the seedling needle width, and the seedling needle width on the market is generally 14~16 mm. When the lateral cutting frequency of the seedling needles of the cylindrical gear planetary gear system throwing mechanism is not higher than 600 times/min, the mechanism has less vibration and the smoothest movement [40]. The rotary gearbox speed was set within a range of 200~300 r/min to enhance working efficiency. In summary, to improve the SB integrity, optimizing the RBS lateral cutting parameters should comprehensively consider the seedling needle picking angle, seedling needle width, and rotary gearbox speed to identify their optimal combination.

2.2. DEM-MDB Coupled Simulation Test

2.2.1. Establishment of DEM Flexible Model

Based on the authors’ previous research results [36], a root blanket model with flexibility and breakability was developed using EDEM (2022) (Figure 5), and the accuracy of the model was verified by experiments. Flexible models of the substrate, stem, and root were constructed, respectively, using the Hertz–Mindlin with Bonding V2 (HMB V2) contact model. According to the distribution of the seedling roots in the substrate, the root blanket could be divided vertically downward into four layers: the rootless layer (RL), the extension layer (EL), the intertwined layer (IL), and the netted layer (NL). Each layer exhibits different mechanical characteristics, reflecting the structural heterogeneity of the substrate. Therefore, following Song et al. [41] and Zhang et al. [42], substrate I (SI) of RL, substrate II (SII) of EL, and substrate III (SIII) of IL were generated using the approach of layered construction. The substrate was set as four spherical particles with particle sizes of 1, 2, 2.5, and 3 mm in EDEM, which accounted for 60%, 20%, 10%, and 10% of the particles, respectively. Based on the root system structure’s measurement and statistics, stem–root combination (SRC) and NL models were constructed, with the adjacent SRCs spaced 9.5 mm laterally and 9.5 mm longitudinally and with their crown roots staggered in the substrate. The SRC contains 476 particles and 1122 contacts, which were mainly composed of a stem with a diameter of 5 mm, first-layer crown root (FR) with a diameter of 0.8 mm, second-layer crown root (SR) with a diameter of 1 mm, and third-layer crown root (TR) with a diameter of 0.9 mm. The numbers of three crown roots are 6, 10, and 1, respectively. NL was simplified as a flexible uniform particle board with a thickness of 4 mm and a particle diameter of 0.9 mm. The Hertz–Mindlin with JKR V2 (JKR V2) contact model was used to describe the adhesion behavior between the SRC and each layer’s substrate.
The model parameters, which consist mainly of the material intrinsic parameters, the basic contact parameters, and the contact model parameters, are essential to ensure the reliability of the DEM model [43]. The simulation parameters used in this study were mainly from the authors’ previously published data. Among them, the flexible model parameters of SI, SII, SIII, SRC, and NL were mainly calibrated and determined by stacking, direct shear, and mechanical tests. The interfacial surface energy of the root blanket and the bonding parameters of SIII were calibrated by stem, half-SRC, and SRC pulling-out tests layer by layer. Due to the large number of model parameters, the detailed data is shown in Appendix A. The calibration of these model parameters was conducted with a significant level of precision, considering the influence of hair roots and the intertwining effect of the crown roots on the mechanical characteristics of the root blanket. The material properties of the LSC, seedling needle, and guide rail were set to steel, and the material property of the seedling box bottom plate was set to PVC. To improve computational efficiency, the root blanket flexible model was established with full size (228 mm) in the lateral direction and partial size (57 mm) in the longitudinal direction, with a thickness dimension of 25 mm in EDEM. The model consisted of 233,170 particles, containing 144 seedlings (lateral and longitudinal arrangement of 24 × 6).

2.2.2. Establishment of Coupled DEM-MBD Simulation Models

Multi-body dynamics software Recurdyn V9R2 was used to define the motion of the root blanket-cutting device and coupled with EDEM for simulation to explore the interaction model between the block-cutting device and the rice blanket particles (Figure 5). Firstly, the modeling and assembly of the solid model of the cutting device were completed in Solidworks (2023). The Step format was exported and imported into Recurdyn to establish the MBD model. The imported parts were merged and simplified, all parts were treated as rigid bodies, constraints were added according to the actual assembly relationship, and fixed and rotational joints were added to the LSC shaft and the rotary gearbox, respectively. The entire device advanced at zero speed. The velocity and position of the working parts were solved by combining the equations of motion in Recurdyn. Then, the information was transferred to EDEM, which received the coupled information, transformed the collision energy generated by the motion process into mass force, and fed the information back to Recurdyn, thus realizing the bidirectional real-time data transmission between EDEM–Recurdyn.
The computer configuration used for the simulation was an Intel (R) Core(TM) i9-275HX (2.70 GHz) CPU with 32.0 GB of RAM, 24 cores, and an RTX 5070 Ti independent graphics card. Approximately eight hours were required to simulate 1 s of the root blanket longitudinal cutting process, and 10 h were required to simulate 0.2 s of the root blanket strip (RBS) lateral cutting process. The EDEM and RecurDyn time steps were set to 4.5 × 10⁻⁶ s and 1 × 10⁻² s, respectively.

2.2.3. Design of Simulation Tests

Response Surface Methodology (RSM) is a test method that utilizes response surface models (e.g., second-order model) to examine the relationship of influencing factors on response indicators, and Central Composite Design (CCD) and Box–Behnken Design (BBD) are the most commonly used test design methods [44,45]. Firstly, the established root blanket DEM flexible model was used for longitudinal cutting simulation tests, and then the RBS was subjected to lateral cutting simulation tests:
(1)
In the longitudinal cutting simulation, the effects of different sliding angles and cutter shaft speeds on the performance of the three CA arrangements of the LSCs were investigated. The simulation tests were designed using the CCD method, with the levels of sliding angle (A) and cutter shaft speed (B) determined as shown in Table 1. The effects of the two factors and their interaction on the evaluation indicators of the maximum longitudinal cutting torque (TRBS), the RBS width (WRBS), the RBS breakage rate (MRBS), and the RBS root injury rate (SRBS) were analyzed.
(2)
When optimizing the working parameters of RBS lateral cutting, the picking angle (C), seedling needle width (D), and rotary gearbox speed (E) were considered, as detailed in Table 1. The simulation tests were conducted using the BBD method, employing the maximum lateral cutting resistance (FSB), the SB fracture surface contour fitting line slope (KSB), the SB breakage rate (MSB), and the SB root injury rate (SSB) as evaluation indicators. Regression models were established to determine the optimal parameter combinations.
The selected evaluation indicators should comprehensively reflect the mechanical properties of the substrate particles and roots inside the root blanket [29], and these indicators should be convenient for collecting field data and are widely used to verify the soil-tool interaction models [46].
Table 1. Levels of factors for the CCD and BBD tests.
FactorsSymbolCoded Levels
Low
(−1)
Middle
(0)
High
(+1)
CCD test
Sliding angle (°)A455157
Cutter shaft speed (r/min)B6080100
BBD test
Picking angle (°)C512.520
Seedling needle width (mm)D141516
Rotary gearbox speed (r/min)E200250300
LSCs with different sliding angles were sharpened after laser cutting according to the drawings. The cutter shaft rotation speed was obtained by controlling the stepper motor through the CM40L controller (Beijing Times Chaoqun Electrical Technology Co., Ltd., Beijing, China) and measured in real-time through the DYN-200 dynamic torque sensor (Bengbu Dayang Sensing System Engineering Co., Ltd., Bengbu, China). The rotating gearbox rotation speed was obtained by controlling the rotational speed of the walking chassis’s power output shaft and was measured using the D05020 laser rotational speed measuring instrument (SATA Tools Co., Ltd., Shanghai, China). Three kinds of seedling needles with widths of 14 mm, 15 mm, and 16 mm could be purchased on the market, which were fixed to the throwing arm with bolts and could be easily replaced. The throwing arm was connected to the planetary gear through a spline shaft, which allowed for adjustment of its inclination angle to achieve different picking angles. The angle was measured using an electronic inclinometer.

2.2.4. Measurement of Evaluation Indicators for Simulation Tests

When cutting the root blanket, it will cause disturbance to the fracture surface and nearby particles, resulting in the generation of force and torque between the substrate and root particles, which may break the “aggregation” behavior between particles, leading to the scattering of substrate particles and the fracture of root particles, which not only reduces the integrity of the RBS or SB but also causes damage to the seedling roots. The degree of disturbance of soil particles at the cutting fracture surface is an important index to evaluate the cutting performance, which can be expressed in terms of soil disturbance width [47] and soil breakage rate [31]. How to minimize root damage is an important part of rice seedling transplantation research, and root injury rate is a measurement index of the root damage degree [48].
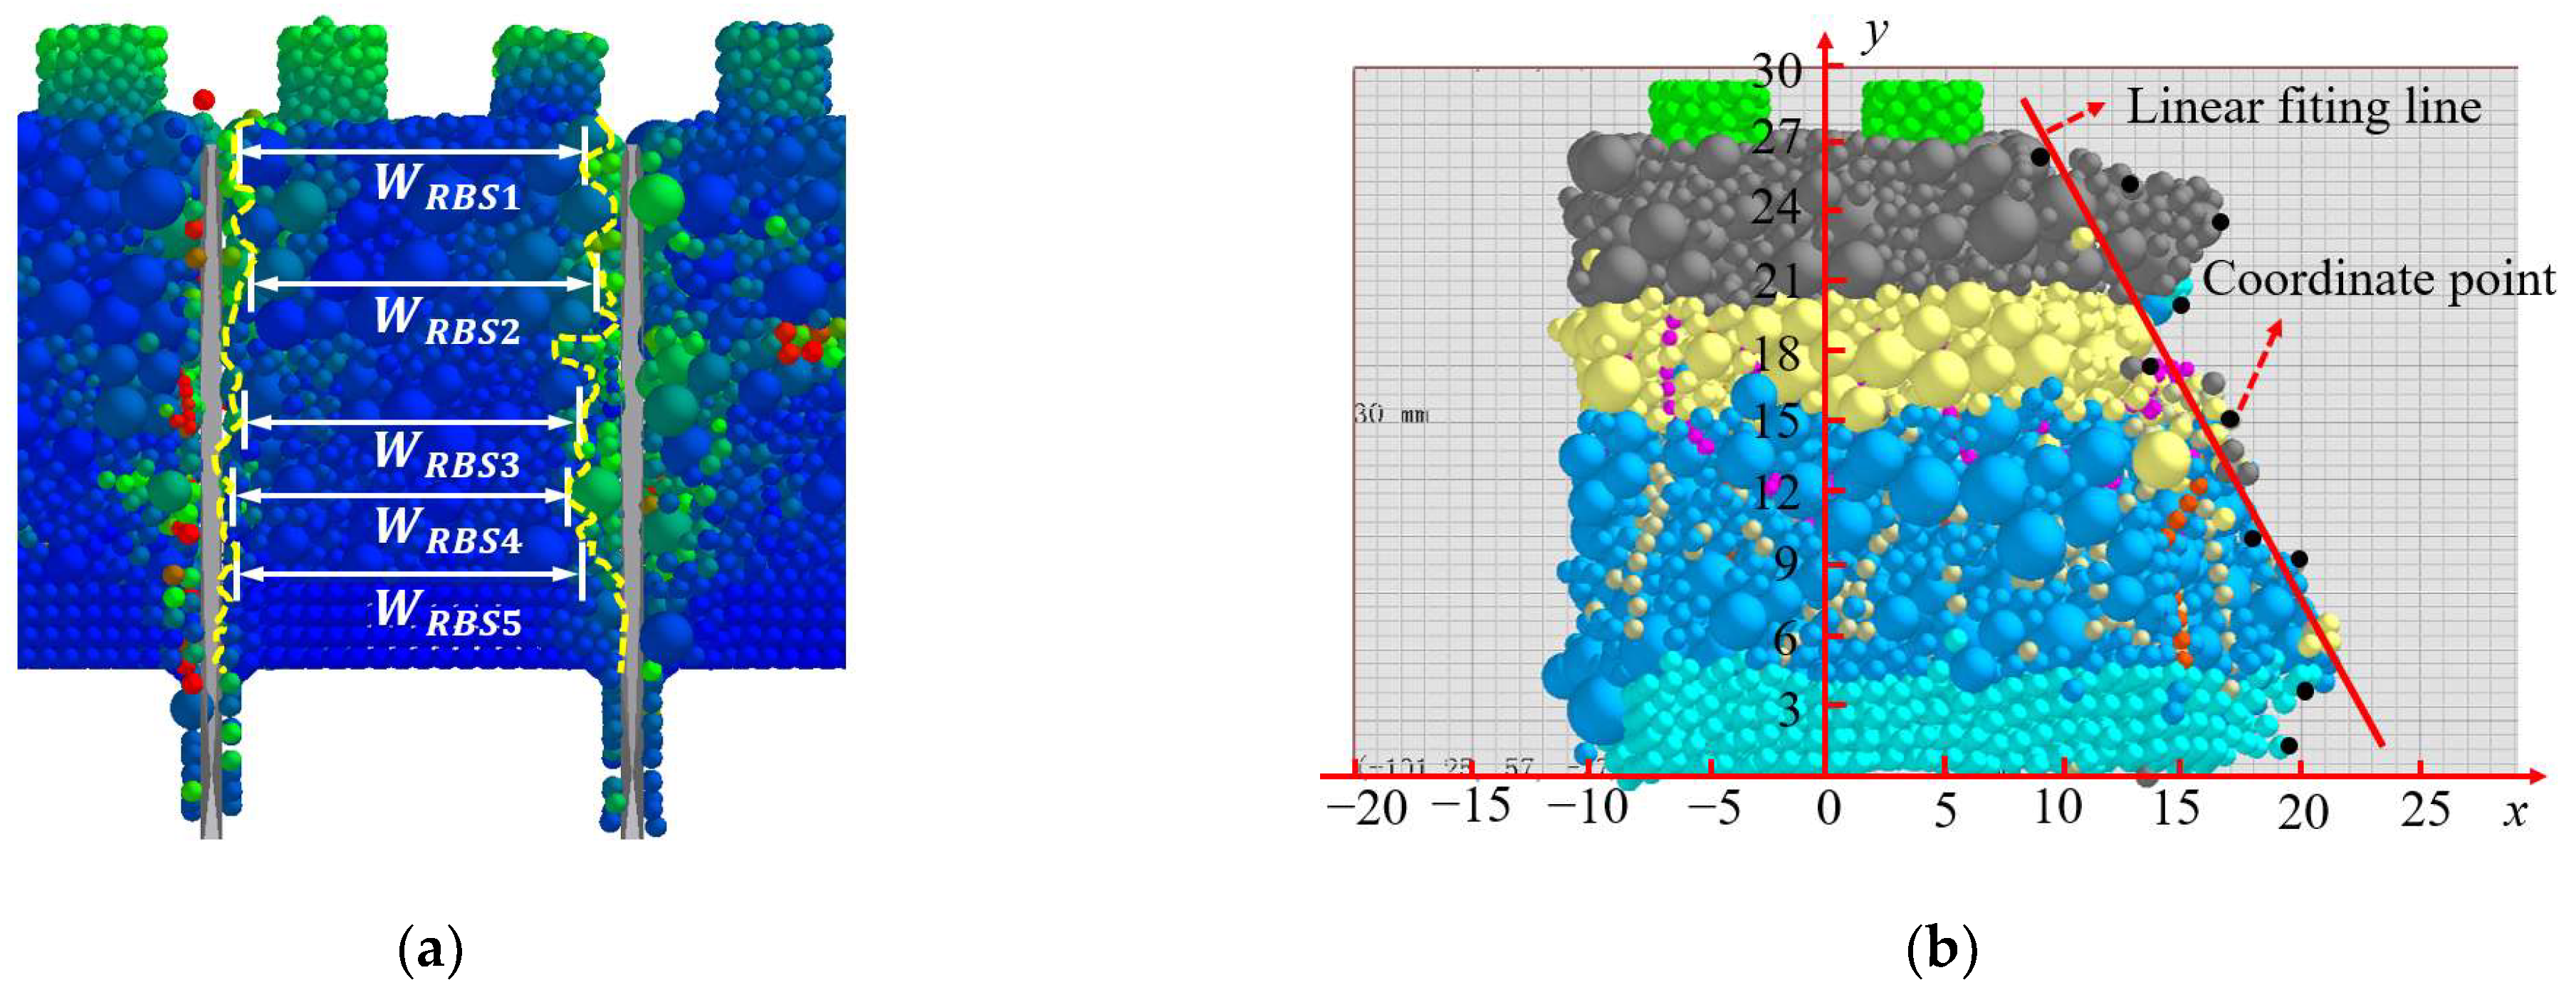
It is difficult to collect the data in the cutting gap between RBSs because it is very narrow, and the RBS is flexible and easy to deform. The vibration during cutting greatly disturbs the size of the cutting gap. Therefore, WRBS can be used instead of the disturbance width of the cutting gap as the evaluation indicator of cutting performance. As shown in Figure 6a, the contour on both sides of the RBS generated by LSCs was derived from the instantaneous particle velocity cloud image. WRBS was determined by measuring the distance between the contour particles on both sides of the RBS using the “Ruler” tool. The average value was calculated by taking five random measurements for each RBS. After the seedling needle laterally cut the RBS, ten measurement points were randomly taken on the contour of the fracture surface of the SB formed. A right-angle coordinate system was established, with the center of the SB bottom as the coordinate origin. The coordinate values of each point were measured using the “Ruler” tool, and the obtained coordinate values were fitted (Figure 6b) to obtain KSB.
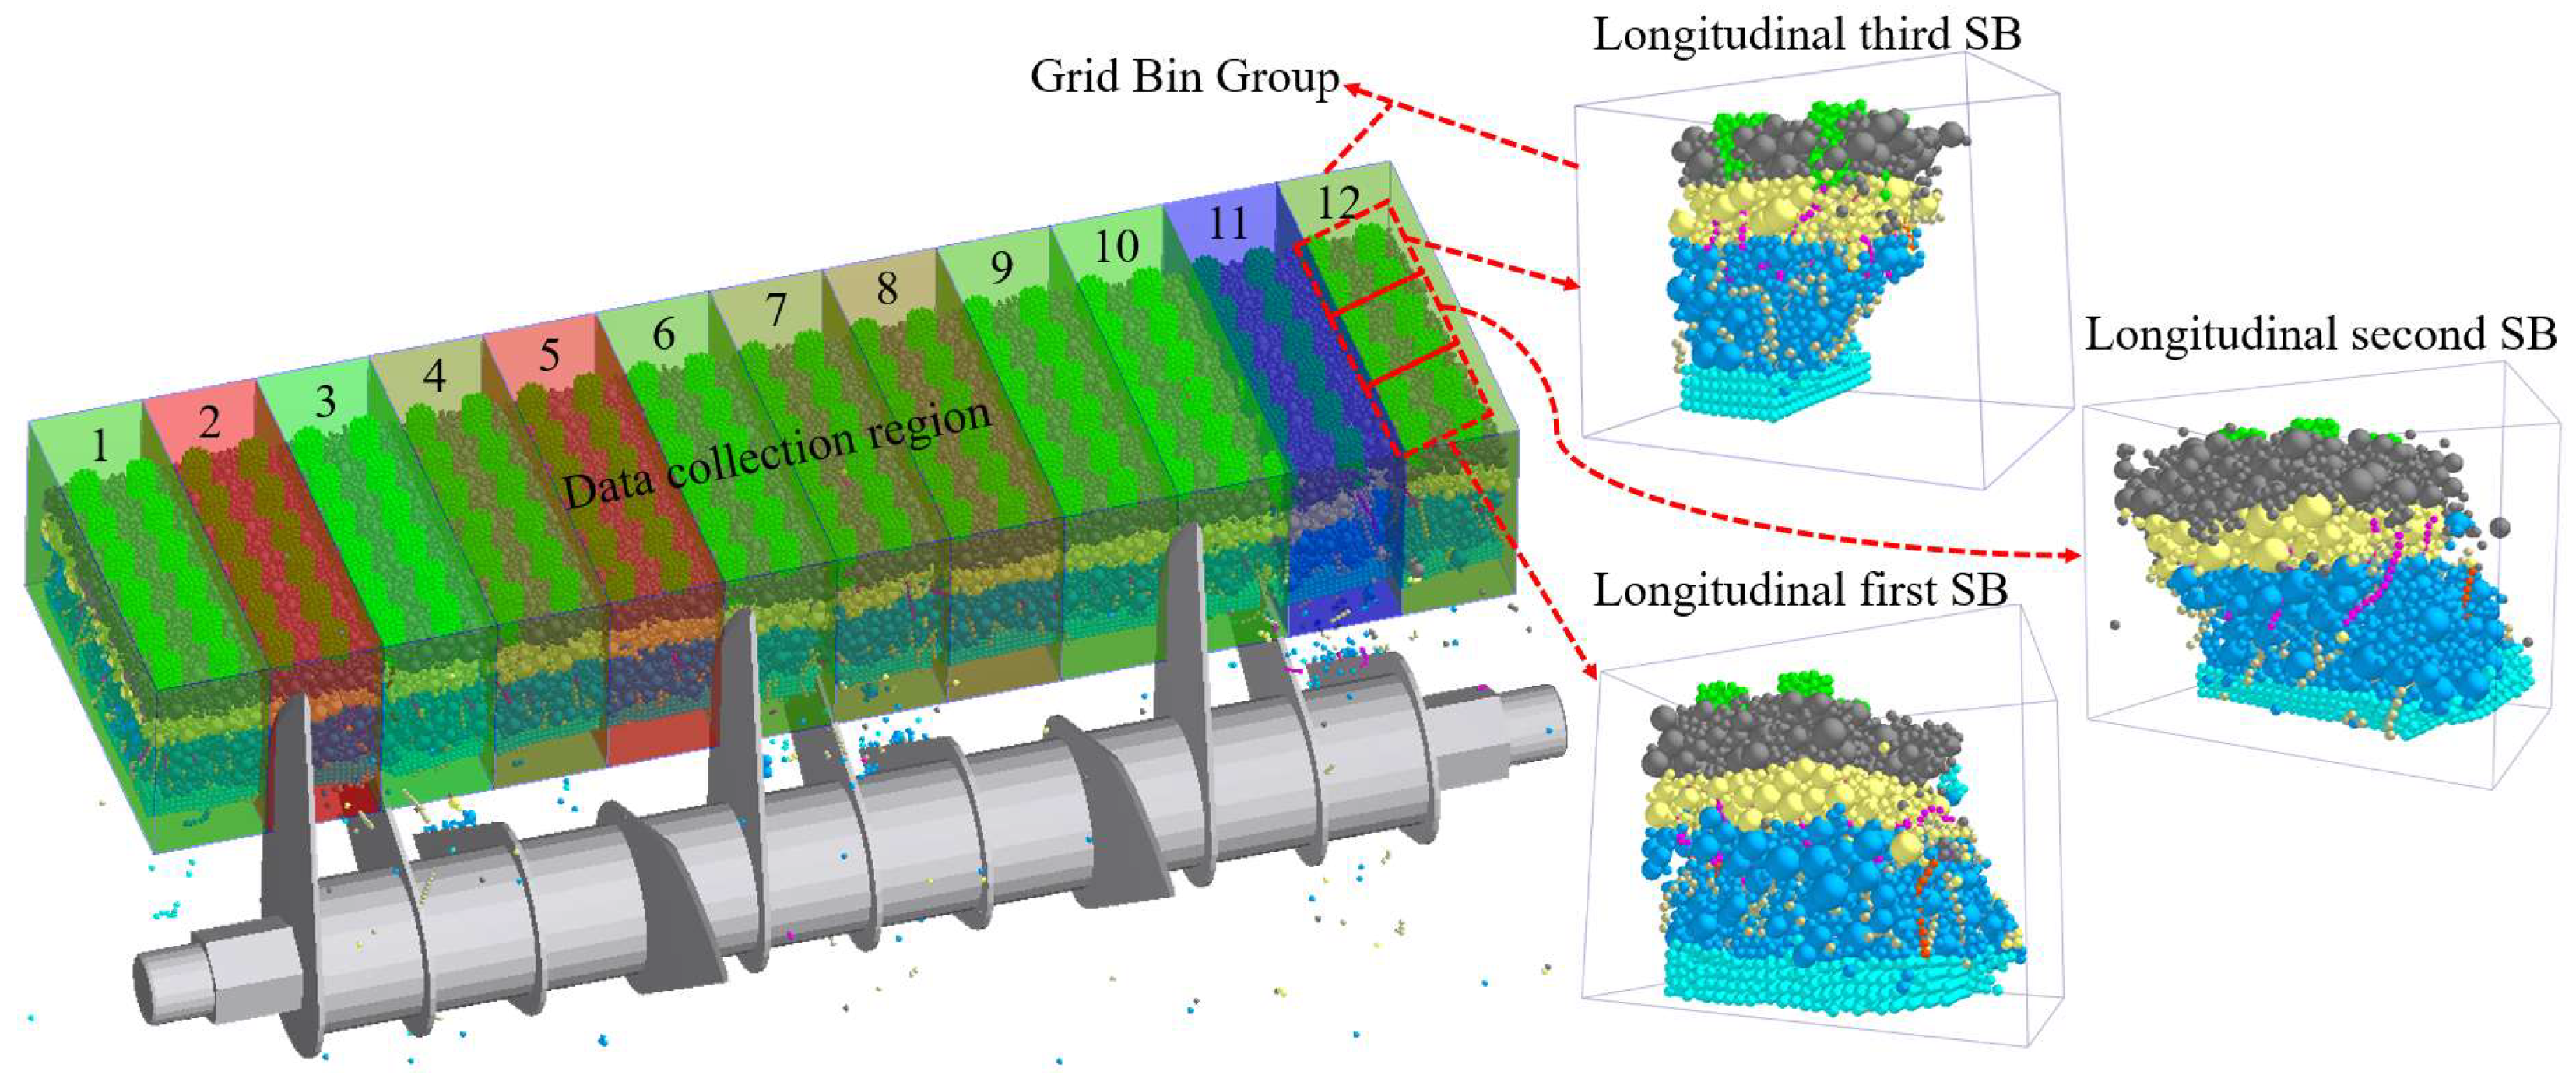
After the simulation of the seedbed, the soil breakage rate [49] and straw breakage rate [29] can be characterized by the number of breaks of the soil and straw bonds, respectively. Based on these studies, the Geometry Box function in the post-processing module of EDEM was employed. Upon stabilization of the cutting area, a designated data collection region was established to quantify the number of contacts within this region before and after the cutting process, excluding stem particles’ contacts. For longitudinal cutting, 12 measurement grids of 19 × 70 × 35 mm (width, length, and height) were set up in the root blanket region. Each measurement grid corresponded to one RBS, with the measurement grid demarcation line located in the center of the cutting gap (Figure 7). After the RBS was cut laterally into three SBs, 25 × 38 × 30 mm (width, length, height) measurement grid was set up in each SB area, respectively (Figure 7). It should be noted that in EDEM, to distinguish the Hertz–Mindlin with bonding contact model, the HMB V2 contact model is post-processed with “contact” for “bond”. MRBS and MSB obtained from the simulations were calculated using Equations (8) and (9), respectively, and SRBS and MSB were calculated using Equations (10) and (11), respectively.
M R B S = n 0 i = 1 12 n R 0 i n 0 × 100 %
M S B = n R 0 i = 1 3 n S 0 i n R 0 × 100 %
S R B S = n 1 i = 1 12 n R 1 i n 1 × 100 %
S S B = n R 1 i = 1 3 n S 1 i n R 1 × 100 %
where n0 and n1 are the number of root blanket contacts and the number of roots contacts in the root blanket before the longitudinal cutting simulation, respectively; nR0 and nR1 are the number of RBS contacts and the number of roots contacts in the RBS after the longitudinal cutting simulation, respectively; and nS0 and nS1 are the number of SB contacts and the number of roots contacts in the SB after the lateral cutting simulation, respectively.

2.3. Physical Tests

2.3.1. Root Blanket Description

The rice varieties, seedling age, leaf age, plant height, seedling raising site, and substrate type used in this study were consistent with those in the authors’ previous study [36]. The seedling tray used for the nursery was a 9-inch ordinary flat tray with the root blanket dimension as in Section 2.1.1. The seeding points were arranged 12 × 31 laterally and longitudinally; four seeds were sown in each seeding point, and the size of the SB was 19 × 19 mm. The rice stems and leaves above the root blanket had no effect on the mechanical properties of the root blanket; therefore, to improve the simulation efficiency, they were excised prior to the test, ensuring that only the root blanket remained intact.

2.3.2. Test Equipment and Data Collection

A rice blanket seedling root blanket longitudinal cutting and lateral cutting test platform was designed and manufactured, which mainly consists of a stepping motor, a DYN-200 dynamic torque sensor with a range of 200N-m (Bengbu Dayang Sensing System Engineering Co., Ltd., Bengbu, China), a JLBS-M2 pressure sensor with a range of 500 N (Bengbu Sensor System Engineering Co., Ltd., Bengbu, China), and a supporting frame (Figure 8). The data acquisition frequency of the two sensors was 1000 times/s. The LSCs arranged at three CAs were located in the three rows on the leftmost side of the seedling box, from left to right: 0°, 30°, and 60°. The dynamic torque sensor was used for real-time measurement of the stepper motor longitudinal cutting output torque, and its two ends were connected to the stepper motor and the LSC shaft through couplings, respectively. The pressure motor was mounted on the seedling needle to measure lateral cutting resistance in real time. Each torque or force result was the maximum value of the recorded data curve.
When the root blanket is disturbed by the LSC or seedling needle, the cutting fracture surface and its nearby substrate and roots will break up and scatter, thus reducing the weight of the RBS and BS substrate, so the weighing method can be used to determine the breakage rate of the RBS and BS in the physical tests. A root blanket with a lateral length of 228 mm and a longitudinal width of 57 mm was weighed, followed by longitudinal cutting, removal of broken and scattered substrate and roots from the RBS, and weighing of 12 RBSs. One RBS was randomly selected for lateral cutting, scattered broken particles were removed from the SBs, and three SBs were weighed. Thus, MRBS and MSB can be calculated by Equations (12) and (13), respectively. Each set of tests was repeated three times and averaged.
M R B S = m 0 i = 1 12 m R 0 i m 0 × 100 %
M S B = m R 0 i = 1 3 m S 0 i m R 0 × 100 %
where m0 is the weight of the root blanket before longitudinal cutting, g; mR0 is the weight of the RBS after longitudinal cutting, g; and mS0 is the weight of the SB after lateral cutting, g.
W R B S was measured by an external groove digital vernier caliper (Figure 9a). Each RBS was randomly measured five times, and finally, the average of all measured values was taken. As shown in Figure 9b, the fracture surface contour of the SB was captured with a camera, and the obtained image was digitally processed using Matlab (R2018b). Grayscale, binarization, edge detection, and linear fitting were performed, respectively, and finally, KSB was obtained. Each set of tests was repeated three times, and the average value was calculated.
Due to the destructive nature of the root damage test, the samples before and after cutting could be different, and direct measurement of the root damage rate was not operational, so a sampling method was used to obtain the 100-plant root mass of seedlings before and after cutting [48]. A sample of 100 seedlings was selected from the root blanket and cleaned, and the root systems were excised using scissors. The mass of the 100 roots was measured prior to longitudinal dissection, ensuring that no water droplets were released during the process. This measurement was conducted three times to obtain an average value. Representative seedlings of 100 plants were selected from the RBS or SB, respectively, the treatments above were used to measure the mass of the root system of 100 plants after longitudinal cutting or transversal cutting, respectively, and the average value was taken by repeating three times. SRBS and SSB can be calculated by Equations (14) and (15), respectively:
S R B S = m 1 m R 1 m 1 × 100 %
S S B = m R 1 m s 1 m R 1 × 100 %
where m1 and mR1 are the mass of 100 roots before and after longitudinal cutting, g, respectively; and mS1 is the mass of 100 roots after lateral cutting, g.

2.4. Data Analysis

Design-Expert 12.0 software was used to analyze the simulated test data. When the root blanket was cut longitudinally, the effects of test factors (sliding angle, cutter shaft speed, and their interaction) on the studied indicators (TRBS, WRBS, MRBS, and SRBS) were investigated. The effects of test factors (picking angle, seedling needle width, rotary gearbox speed, and their interactions) on the studied factors (FSB, KSB, MSB, and SSB) were investigated when RBS was cut laterally. ANOVA and response surface modeling were used to analyze the relationship between the test factors and the simulated test values.

3. Results and Discussion

3.1. Analysis of Root Blanket Being Cut into SB Process

The root blanket being cut into the SB process of longitudinal cutting (Figure 10) and lateral cutting (Figure 11) operations was simulated using the established DEM flexible model of the root blanket, with three CA arrangements of LSCs with a sliding angle of 45° and a cutter shaft speed of 60 r/min, seedling needle with a picking angle and width of 5° and 14 mm, respectively, and a rotary gearbox with a speed of 200 r/min. Simulations were conducted to analyze the dynamic properties during longitudinal cutting and lateral cutting, and the simulation results were consistent with the physical tests, indicating that the HMB V2 contact model accurately simulated the flexibility and breakability of the root blanket, and the JKR V2 contact model accurately simulated the adhesion between the roots and the substrate.
The number of cutters when the LSCs arranged at CAs of 0°, 30°, and 60° started to contact the root blanket at the beginning stage was eleven, two, and three, respectively (Figure 10a,d,g). As the cutter shaft continued to rotate, the LSCs applied pressure and generated a sliding cutting action on the root blanket, causing it to deform flexibly until the fracture occurred. As shown in Figure 10b,e,h, the maximum number of cutters engaged in cutting for the LSCs arranged at the three CAs was eleven, four, and three, respectively. The more LSCs simultaneously engaged in sliding cutting, the greater the disturbance to the root blanket, resulting in more extensive breakage of both the substrate and the roots. Due to the friction between the LSCs and the root blanket, at the end of the longitudinal cutting, some broken free substrate and root particles were brought out of the cutting gap by the LSCs (Figure 10c,f,i).
According to the RBS lateral cutting process (Figure 11), the seedling needle began to cut from the RBS located on the outermost side of the seedling box. After the first lateral cutting, the seedling box was laterally fed accurately by 19 mm to align for the second lateral cutting. This process was repeated to complete all lateral cutting along the first row, after which the seedling box was longitudinally fed by 19 mm to initiate lateral cutting of the next row. Taking the first lateral cutting of the first row as an example, the lowermost region of the RBS was to be cut overhung at the seedling gate. At the beginning of the cutting, the seedling needle tip contacted the RBS at a position midway between the longitudinal first and second SBs. Then, the seedling needle began to pass through the RBS, and the SB was cut from the RBS and taken away from the seedling gate. According to the force analysis of the RBS lateral cutting process described in Section 2.1.2, the seedling needle exerts both cutting and tearing actions on the RBS. At the end of the cutting process, it could be seen that the fracture surfaces of the SBs that had been completely cut were jagged and showed a certain inclined angle. Additionally, some roots of the seedlings in the longitudinal second SB were cut off and retained in the substrate of the longitudinal first SB that had been cut. The fracture surfaces on both sides of the longitudinal second SB were inclined planes and presented a rhomboidal shape (Figure 7). As revealed by the Bond Status analysis, the disturbance exerted by the seedling needle on the SB was substantial, leading to partial breakage of the contacts among the substrate particles within the SB.

3.2. The Results of CCD Tests

3.2.1. The Test Results of LSCs Arranged at the CA 0°

The design matrix and simulation results of the CCD tests for LSCs arranged at the CA 0° are shown in Table 2. The quadratic regression models were established to describe the relationships among the variables TRBS, WRBS, MRBS, and SRBS. To improve their predictive accuracy, non-significant terms (p > 0.05) were excluded from the models. The resulting quadratic polynomial regression equations are presented as Equations (16)–(19), corresponding to each of the four response variables.
T R B S = 9.02 1.69 B 0.39 A B + 0.43 A 2 0.72 B 2
W R B S = 16.26 0.39 B + 0.25 A B + 0.28 B 2
M R B S = 7.15 + 0.78 B + 0.73 A 2 + 0.29 B 2
S R B S = 6.49 + 0.19 B 0.04 A B + 0.08 B 2
The analysis of variance (ANOVA) was performed on each of the four regression models developed, and the results are shown in Table 3. The models were highly significant (p < 0.001) with high statistical significance [50], which indicated that the regression models effectively describe the relationship between the sliding angle, the cutter shaft speed, and the cutting performance of the LSCs arranged at the CA 0°. In addition, all models exhibited determination coefficients (R2) greater than 0.9, indicating a strong fit to the CCD test results. The lack of fit term of the WRBS regression model was not significant (p < 0.05), indicating no other major factors affecting the response values of this test. The other three regression models could not be computed for the lack-of-fit terms test because there was no variation in the repeated tests. The Adeq Precision value ≥ 13 showed that the model could reliably and accurately predict the operating performance of LSCs arranged at the CA 0° for different sliding angle and cutter shaft speed combinations. A had no significant effect on all four models, B had a highly significant effect on all four models, and interaction term AB significantly affected (p < 0.05) TRBS, WRBS, and SRBS but had no significant effect on MRBS. A2 had a significant effect on TRBS and MRBS but had no significant effect on WRBS and SRBS. B2 significantly affected the four models. Therefore, the optimal values of the sliding angle and the cutter shaft speed could be predicted based on the above four models.
The response surface plots were illustrated to analyze the relationship between the interaction term and each evaluation indicator based on Equations (16)–(19) (Figure 12). The steepness of the response surface indicates the magnitude of the interaction effect on the response variable; a steeper surface suggests a more pronounced influence of the interaction term [44]. As shown in Figure 12a, when factor A was fixed, TRBS decreased significantly with the increasing values of factor B, although the decrease rate gradually diminished; when B was fixed, TRBS initially decreased first and then increased as A increased, reaching its minimum around A = 51. When A was 45°, the increase in B resulted in a continuous decrease of WRBS (Figure 12b), although the rate of decrease gradually slowed. As shown in Figure 12c,d, the effect of B on MRBS and SRBS followed a similar trend: when A was held constant, increasing B led to a rapid rise in these two evaluation indicators. The faster the LSC operation speed, the greater the impact energy per unit time on the root blanket, and the dynamic load is more likely to break the ‘aggregation’ behavior between particles, resulting in the increase of MRBS and SRBS. Similar findings were obtained by Liu et al. [33] when using a static sliding cut angle constant cutting machine to cut oil sunflower. The instantaneous response of A to the changes in the four evaluation indicators was more stable than that of B; that is, the influence of A on the response values was smaller than that of B, which was consistent with the results that the effect was not significant when A was the main effect in ANOVA. Although A was not a significant individual factor, the interaction between A and B played a key role in influencing T R B S , W R B S , and S R B S .
When the LSCs are arranged at a CA of 0°, 11 cutters are participating in the operation at the same time. The synchronized cutting phases of all LSCs result in the superposition of the cutting forces of each LSC; not only is a greater driving torque required, but the superposition of the impact force and the fluctuation of the working resistance will also significantly enhance the cutting vibration [12,51]. The vibration can diminish the influence of other factors, such as the sliding angle, on cutting performance [52], which explains why A had no significant effect on any of the four regression models. Wang et al. [47] found that the vibration could disturb the soil to a greater extent when simulating the interaction between the soil and the vibrating subsoiler, thereby achieving a better soil breakage rate. Similarly, Zou et al. [17] found that the vibration sliding cutting caused more damage to the bonds of the soil around the roots when cutting the spinach root–soil complex, which was better than the non-vibration sliding cutting to break the soil. Excessive vibration increases the breakage rate of the RBS fracture surface, which is also the main reason for the decrease of WRBS and the increase of MRBS and SRBS. Therefore, the LSC layout should be reasonably designed, and the cutting angles of the LSCs should be staggered so that the cutting phases of the LSCs can be staggered. One is that the peak value of the cutting force can be dispersed, and the other is that the impact force is dispersed to reduce vibration.

3.2.2. The Test Results of LSCs Arranged at the CA 30°

Based on the analysis of the CCD simulation test results (Table 2), the quadratic regression models were established for the four performance indicators of LSCs arranged at the CA of 30°. The regression equations are presented below after removing terms that have no insignificant effect.
T R B S = 6.01 0.40 A 0.68 B 0.13 A B + 0.42 A 2
W R B S = 16.60 + 0.40 A + 0.17 A B + 0.25 A 2 + 0.21 B 2
M R B S = 6.74 0.54 A + 0.90 B 0.58 A 2 0.73 B 2
S R B S = 5.18 0.15 A + 0.23 B 0.11 A 2
Table 3 presents the ANOVA results and p-values for the four regression models. The p-values of all models were less than 0.0001, the determination coefficients (R2) and correction determination coefficients ( R A d j 2 ) were close to 1, and the Adeq Precision values exceeded 12. In addition, the lack-of-fit item of the WRBS regression model was not significant. Thus, the relationship between the four models and the fitted regression equations was highly significant, and the models had good reliability and accuracy. Therefore, it was shown that the proposed model could be used to predict the cutting performance of the LSCs arranged at the CA 30° with different sliding angles and cutter shaft speeds. A had a highly significant effect on the four models, B had a highly significant effect on the other three models except for WRBS, the interaction term AB did not have a significant effect on MRBS and SRBS, A2 had a significant effect on the four models, and B2 had no significant effect on TRBS and SRBS.
Figure 13 shows the response surface plots between sliding angle, cutter shaft speed, and evaluation indicators of the LSCs arranged at the CA 30°. As shown in Figure 13a, when B was fixed, TRBS exhibited a noticeable decreasing trend with the increasing A, although the change magnitude was relatively small—for example, when B = 60, TRBS only decreased by 0.44; the response surface displayed an obvious concave shape along the A-axis, while TRBS decreased nearly linearly with the increasing B, showing no obvious curvature; this suggested that the quadratic effect of A2 was more significant than that of B2, which was consistent with the ANOVA results. The previous study has also demonstrated that the increased cutting speed reduced the cutting force [33]. As shown in Figure 13b, when B was fixed, WRBS increased with the increase in A, with a more pronounced rise observed when B = 100; B had no significant effect on WRBS. As shown in Figure 13c, when B was fixed, MRBS decreased as A increased, although the decrease rate is reduced when B = 100; conversely, when A was held constant, MRBS increased with the increase in B, with the weakest effect observed when A = 57. The changing trend of SRBS was basically consistent with that of MRBS (Figure 13d). This is because the roots of the root blanket staggered and intertwined, and there was adhesion between the roots and the substrate [36]. Therefore, when the substrate was broken, the roots were generally broken.
In general, compared with the LSCs arranged at the CA 0°, the LSCs arranged at the CA 30° staggered the cutting angle into the root blanket. The maximum number of LSCs participating in cutting simultaneously was 4, and the disturbance to the root blanket was more minor. The four evaluation indicators showed that the cutting performance had improved.

3.2.3. The Test Results of LSCs Arranged at the CA 60°

Table 2 presents the design matrix and results of the CCD tests for the LSCs arranged at the CA 60°. After eliminating the items with insignificant effects, the test results were subjected to multiple regression fitting. The quadratic regression models of each evaluation indicator were as follows:
T R B S = 3.75 0.15 A 0.47 B + 0.05 A B 0.06 A 2 + 0.10 B 2
W R B S = 18.01 + 0.22 A 0.14 A B 0.13 A 2 0.18 B 2
M R B S = 4.28 + 0.27 A + 0.44 B 0.34 A 2 0.41 B 2
S R B S = 4.47 0.35 A + 0.19 A B + 0.23 A 2 + 0.32 B 2
The significance of the four regression models and their corresponding factors was assessed using ANOVA (Table 3). All four models had p-values less than 0.001, indicating that they accurately described the relationships between the sliding angle and cutter shaft speed of the LSCs arranged at the CA 60° and the response variables TRBS, WRBS, MRBS, and SRBS. In addition, each model yielded R2 > 0.84 and Adeq Precision ≥ 11, and the lack-of-fit term of the WRBS model had a p > 0.05, further confirming the models’ high fitting accuracy and applicability in predicting the LSCs arranged at the CA 60° with different sliding angles and cutter shaft speeds.
It could be seen from Section 3.3.1 and Section 3.3.2 that the cutting performance of LSCs arranged at the CA 0° was mainly affected by the cutter shaft speed, and the cutting performance of LSCs arranged at the CA 30° was significantly affected by both the sliding angle and the cutter shaft speed. The ANOVA results (Table 3) showed that A had a highly significant effect on the four models, whereas B had a non-significant effect on two models of WRBS and SRBS. The cutter shaft speed does not significantly affect the root injury rate, indicating that higher operational efficiency does not increase the root injury rate. Therefore, the cutting performance of the LSCs arranged at the CA 60° was mainly affected by the sliding angle. The interaction term AB had no significant effect on MRBS, while A2 and B2 significantly affected the four models.
The response surface (Figure 14a) showed a slight decrease in TRBS with small fluctuations in change when A increased; TRBS decreased significantly with the increase in B. As shown in Figure 14b, WRBS increased with the increase in A, but the trend was affected by the level of B, which was not significant as the main effect because the interaction term AB was highly significant; e.g., when B = 60, WRBS changed significantly, while when B = 100, WRBS only changed slightly. MRBS increased significantly with the increase in A and B, respectively (Figure 14c). SRBS decreased significantly with the increase in A (Figure 14d); B did not affect SRBS significantly but fluctuated locally with the increase in B. The center point of the response surface was concave, and the effects of A2 and B2 were significant, which was consistent with the ANOVA results.
The LSCs arranged at the CA 60° cut into the root blanket in a staggered, batch-wise manner, with no more than three LSCs engaged simultaneously. This configuration helped distribute the cutting resistance more evenly and mitigated the torque superposition effect that typically occurred when multiple LSCs cut simultaneously. When the sliding cutting angle was 45° and the cutter shaft speed was 60 r/min, the maximum longitudinal cutting torque of LSCs arranged at a CA of 0°, CA of 30°, and CA of 60° were 10.52 N·m, 7.35 N·m, and 4.45 N·m, respectively. The standard deviations under three repeated tests were 1.31, 0.72, and 0.34, respectively. The standard deviation can reflect the amplitude of torque fluctuations, and the smaller the value, the weaker the vibration. It could be seen that the maximum longitudinal cutting torque of the LSCs arranged at a CA of 60° was 6.07 N·m and 2.90 N·m lower than that of the LSCs arranged at a CA of 0°and the LSCs arranged at a CA of 30°, respectively. The circumferential staggered arrangement and sliding cutting of the LSCs reduced the pulling force exerted on the root blanket, avoiding the overall displacement or tear of the root blanket caused by the synchronous cutting of the LSCs, and the cutting process was more continuous, the root blanket was evenly stressed, the impact vibration was reduced, the disturbance to the root blanket was minimized, and the risk of particle breakage or fragmentation near the root blanket cutting fracture surface was reduced, thereby increasing the RBS width and reducing the RBS breakage rate and RBS root injury rate. By comparing the right-endpoint values of the value ranges of each evaluation indicator of the CCD simulation test results, the LSCs arranged at a CA of 60, compared with the LSCs with the other two CA arrangements, exhibited an increase in RBS width of 1.03 mm and 0.72 mm, a decrease in RBS breakage rate of 4.60% and 2.61%, and a decrease in RBS root injury rate of 1.42% and 0.18%, respectively. In summary, this study observed that the difference in the CA arrangements of the LSCs significantly affected the cutting performance.

3.2.4. Determination of the Optimal Value of the Longitudinal Cutting Parameters

The crown roots of different seedlings stagger and intertwine with each other, the crown roots and hair roots intertwine to consolidate the substrate, and the root blanket strength is improved by their tension, friction, and adhesion [36]. When the working components disturb the soil, it is beneficial for soil fragmentation and root–soil separation [17,29]. According to the analysis of the longitudinal cutting process in Section 3.1, when the LSC causes excessive disturbance to the particles near the fracture surface, it leads to the scattering of substrate particles and the fracture of root particles. When cutting laterally, the compression of the seedling needle will cause the substrate in the loose area to “collapse” from the cutting gap, and the breakage rate of the cutting edge will increase. If there is too much root injury during the longitudinal cutting process, the RBS will lose its “skeleton” support. When cutting laterally, the root system at the cutting gap cannot provide tension resistance and is prone to detachment with the substrate, increasing the root injury rate. In summary, the longitudinal cutting quality has a significant impact on the lateral cutting quality. Based on the requirements of minimal plant injury, high SB integrity, and low energy consumption when the authors’ team developed the rice blanket seedling-cutting and -throwing transplanter, the longitudinal cutting performance should meet the requirements of low maximum longitudinal cutting torque, high RBS width, low RBS breakage rate, and low RBS root injury rate, to improve the lateral cutting quality.
The comparative analysis of the CCD test results showed that the LSCs arranged at a CA of 60° had the best cutting performance, followed by LSCs arranged at the other two CAs. Therefore, the LSCs arranged at a CA of 60° were recommended for the longitudinal cutting of the cutting device. Therefore, based on the regression models corresponding to each indicator, the optimal sliding angle and cutter shaft speed for LSCs arranged at a CA 60° were determined as follows: a sliding angle of 57° and a cutter shaft speed of 65.3 r/min.

3.2.5. CCD Optimal Parameter Verification Test

Simulation and physical tests were conducted on the LSCs arranged at the CA 60° under an optimized combination of sliding angle and cutter shaft speed. Data on longitudinal cutting torque, RBS width, RBS breakage rate, and RBS root injury rate were collected and analyzed in these tests.
It can be observed from Figure 15a that the simulation data of the longitudinal cutting torque curve changing with the working time were basically consistent with the trend of the physical test data. The curves had four peak values because the number of LSCs participating in cutting the root blanket at the same time and in the same position was three, three, three, and two. There were three LSCs cutting into the root blanket simultaneously in the first to third peak values, and the fourth peak value was the longitudinal cutting torque of two LSCs cutting into the root blanket simultaneously. The fourth peak was the longitudinal cutting torque of two LSCs simultaneously cutting into the root blanket. The average value of the first to third peak values was the maximum longitudinal cutting torque.
The simulated results of the peak value of the longitudinal cutting torque were consistently lower than the physical values because the contact between the particles in the root blanket was rigid, the particles were all spherical, and there were gaps between the particles in the modeling, which may cause a large displacement of the particles under the longitudinal cutting action of the LSCs, thus reducing the actual contact area with the LSCs, and this kind of simulation error was widespread in the simulation of soil tillage [29,36]. Although reducing particle size can eliminate the simulation errors [53], an excessive number of particles may significantly increase computation time. In contrast, most of the particles in the physical test are irregularly in shape, and the contact between the particles is much more intensive [36]. Non-spherical particles can be used to improve the accuracy of the model in future modeling work. DEM can be used to model irregularly shaped particles and develop non-spherical particulate systems, thereby achieving higher modeling accuracy compared to spherical particles [54]. However, unlike spherical particles, it is necessary to determine the direction of non-spherical particles in order to accurately detect contact, taking into account their full degree of freedom/orientations [55]. Non-spherical particle DEM requires high-performance computing resources and is still a very challenging task [55]. The longitudinal cutting torque curves indicated good agreement between the simulated and measured results, with four peak values showing deviations of 8.22%, 9.46%, 5.17%, and 5.86%, respectively—all below 10%. These results confirmed the reliability and accuracy of the model in predicting the cutting performance of the LSCs.
The RBS width of the LSCs arranged at a CA of 60° is shown in Figure 15b. The substrate particles and SRCs were described using the JKR V2 contact model to describe the adhesion behavior between them, the interfacial surface energy exerted an adhesion force between the substrate particles and the roots, and when the LSCs disturbed the particles on the cutting fracture surface, the adhesion force restricted the ability of the disturbed particles to return to their original position. Therefore, the simulated values of RBS width were always lower than the physical values, which was consistent with the discrete element simulation results of soil–tool interactions by Zeng et al. [56] and Zhang et al. [29]. The deviation between the simulated and physical values of RBS width was only 4.03%, which indicated that the model could be used to simulate the particle disturbance degree on the cutting fracture surface by the LSCs.
The RBS breakage rate and root injury rate are shown in Figure 15b. The simulated values for both were higher than the physical values, likely because the individual particles of the root blanket in the physical test were irregularly shaped, with much denser particle contact [57]. As a result, when the LSCs disturbed the root blanket, each particle’s displacement was small, reducing the risk of particle breakage or fragmentation near the cutting fracture surface of the root blanket. The deviations between the simulated and physical values of the RBS breakage rate and RBS root injury rate were 12.91% and 13.25%, respectively, indicating that the HMB V2 contact model could accurately simulate the RBS breakage rate and RBS root injury rate. In addition, it was effective and feasible to use the broken contact ratio in the simulation test and the weighing method in the physical test to express the breakage and root injury rates.
Based on the above research results, the optimized sliding angle and cutter shaft speed were accurate and reliable, which ensured that the RBS cut by the LSCs arranged at a CA of 60° could be used to optimize the working parameters of the seedling needle.

3.3. The Results of BBD Tests

3.3.1. Quadratic Regression Model

The optimal working parameter combination of LSCs arranged at a CA of 60°, as determined by Section 3.3.4, was used to cut the root blanket longitudinally. Then, the lateral cutting simulation tests were carried out. The design matrix and results of the BBD tests are shown in Table 4. Variance analysis was performed on the established regression models of FSB, KSB, MSB, and SSB, and the results are shown in Table 5. The p-values of all four models were less than 0.001, while the p-values of the lack-of-fit terms were greater than 0.05, confirming that the four models were significant within the 95% confidence interval, which indicated that the regression models were highly reliable. Therefore, the models’ determination coefficients (R2) and correction determination coefficients ( R A d j 2 ) were close to 1, and the Adeq Precision was greater than 18, which indicated that the model was well matched with the simulation data. The difference between R A d j 2 and the predicted determination coefficient ( R P r e d 2 ) for each model was less than 0.2, indicating a high correlation between the actual and predicted values. Therefore, the optimal values of picking angle, seedling needle width, and rotary gearbox speed could be predicted based on the four models described above.
Based on the BBD simulation test and ANOVA results, the quadratic regression models for the four evaluation indicators of the seedling needle were derived, and the regression equations were shown in Equations (28)–(31), excluding the items with insignificant effects.
F S B = 9.15 2.78 C 0.38 E + 0.49 C E 0.33 C 2 + 0.81 D 2 0.75 E 2
K S B = 2 0.61 C + 0.14 E + 0.14 C E 0.19 D E 0.25 C 2 + 0.23 E 2
M S B = 14.91 2.74 C 0.86 D + 1.19 E + 0.17 C E 0.42 C 2 0.15 D 2 + 0.24 E 2
S S B = 11.62 2.16 C 0.72 D 0.59 E + 0.24 C D 0.22 C 2 0.28 D 2 + 0.17 E 2

3.3.2. Factor Significance Analysis

The significance of the factors was analyzed as follows: (1) From Table 5, it could be seen that C, E, CE, D2, and E2 had highly significant effects on FSB, while the other terms did not have significant effects on FSB. The greater the F-value, the greater the influence of the factor on the indicator. From the F-value values, the three main factors affecting FSB in descending order were C, E, and D. (2) C, DE, C2, and E2 significantly affected KSB, and E and CE had significant effects on KSB. The order of significance of the linear term on K S B could be judged by the F-value as follows: C > E > D. (3) C, D, E, C2, and E2 had highly significant effects on MSB, and CE and D2 had significant effects on MSB. The order of significance of the linear term on M S B can be judged by the F-value as follows: C > E > D. (4) C, D, and E had highly significant effects on SSB, and CD, C2, and D2 had significant effects on SSB. The order of significance of the linear term on S S B can be judged by the F-value as follows: C > D > E.
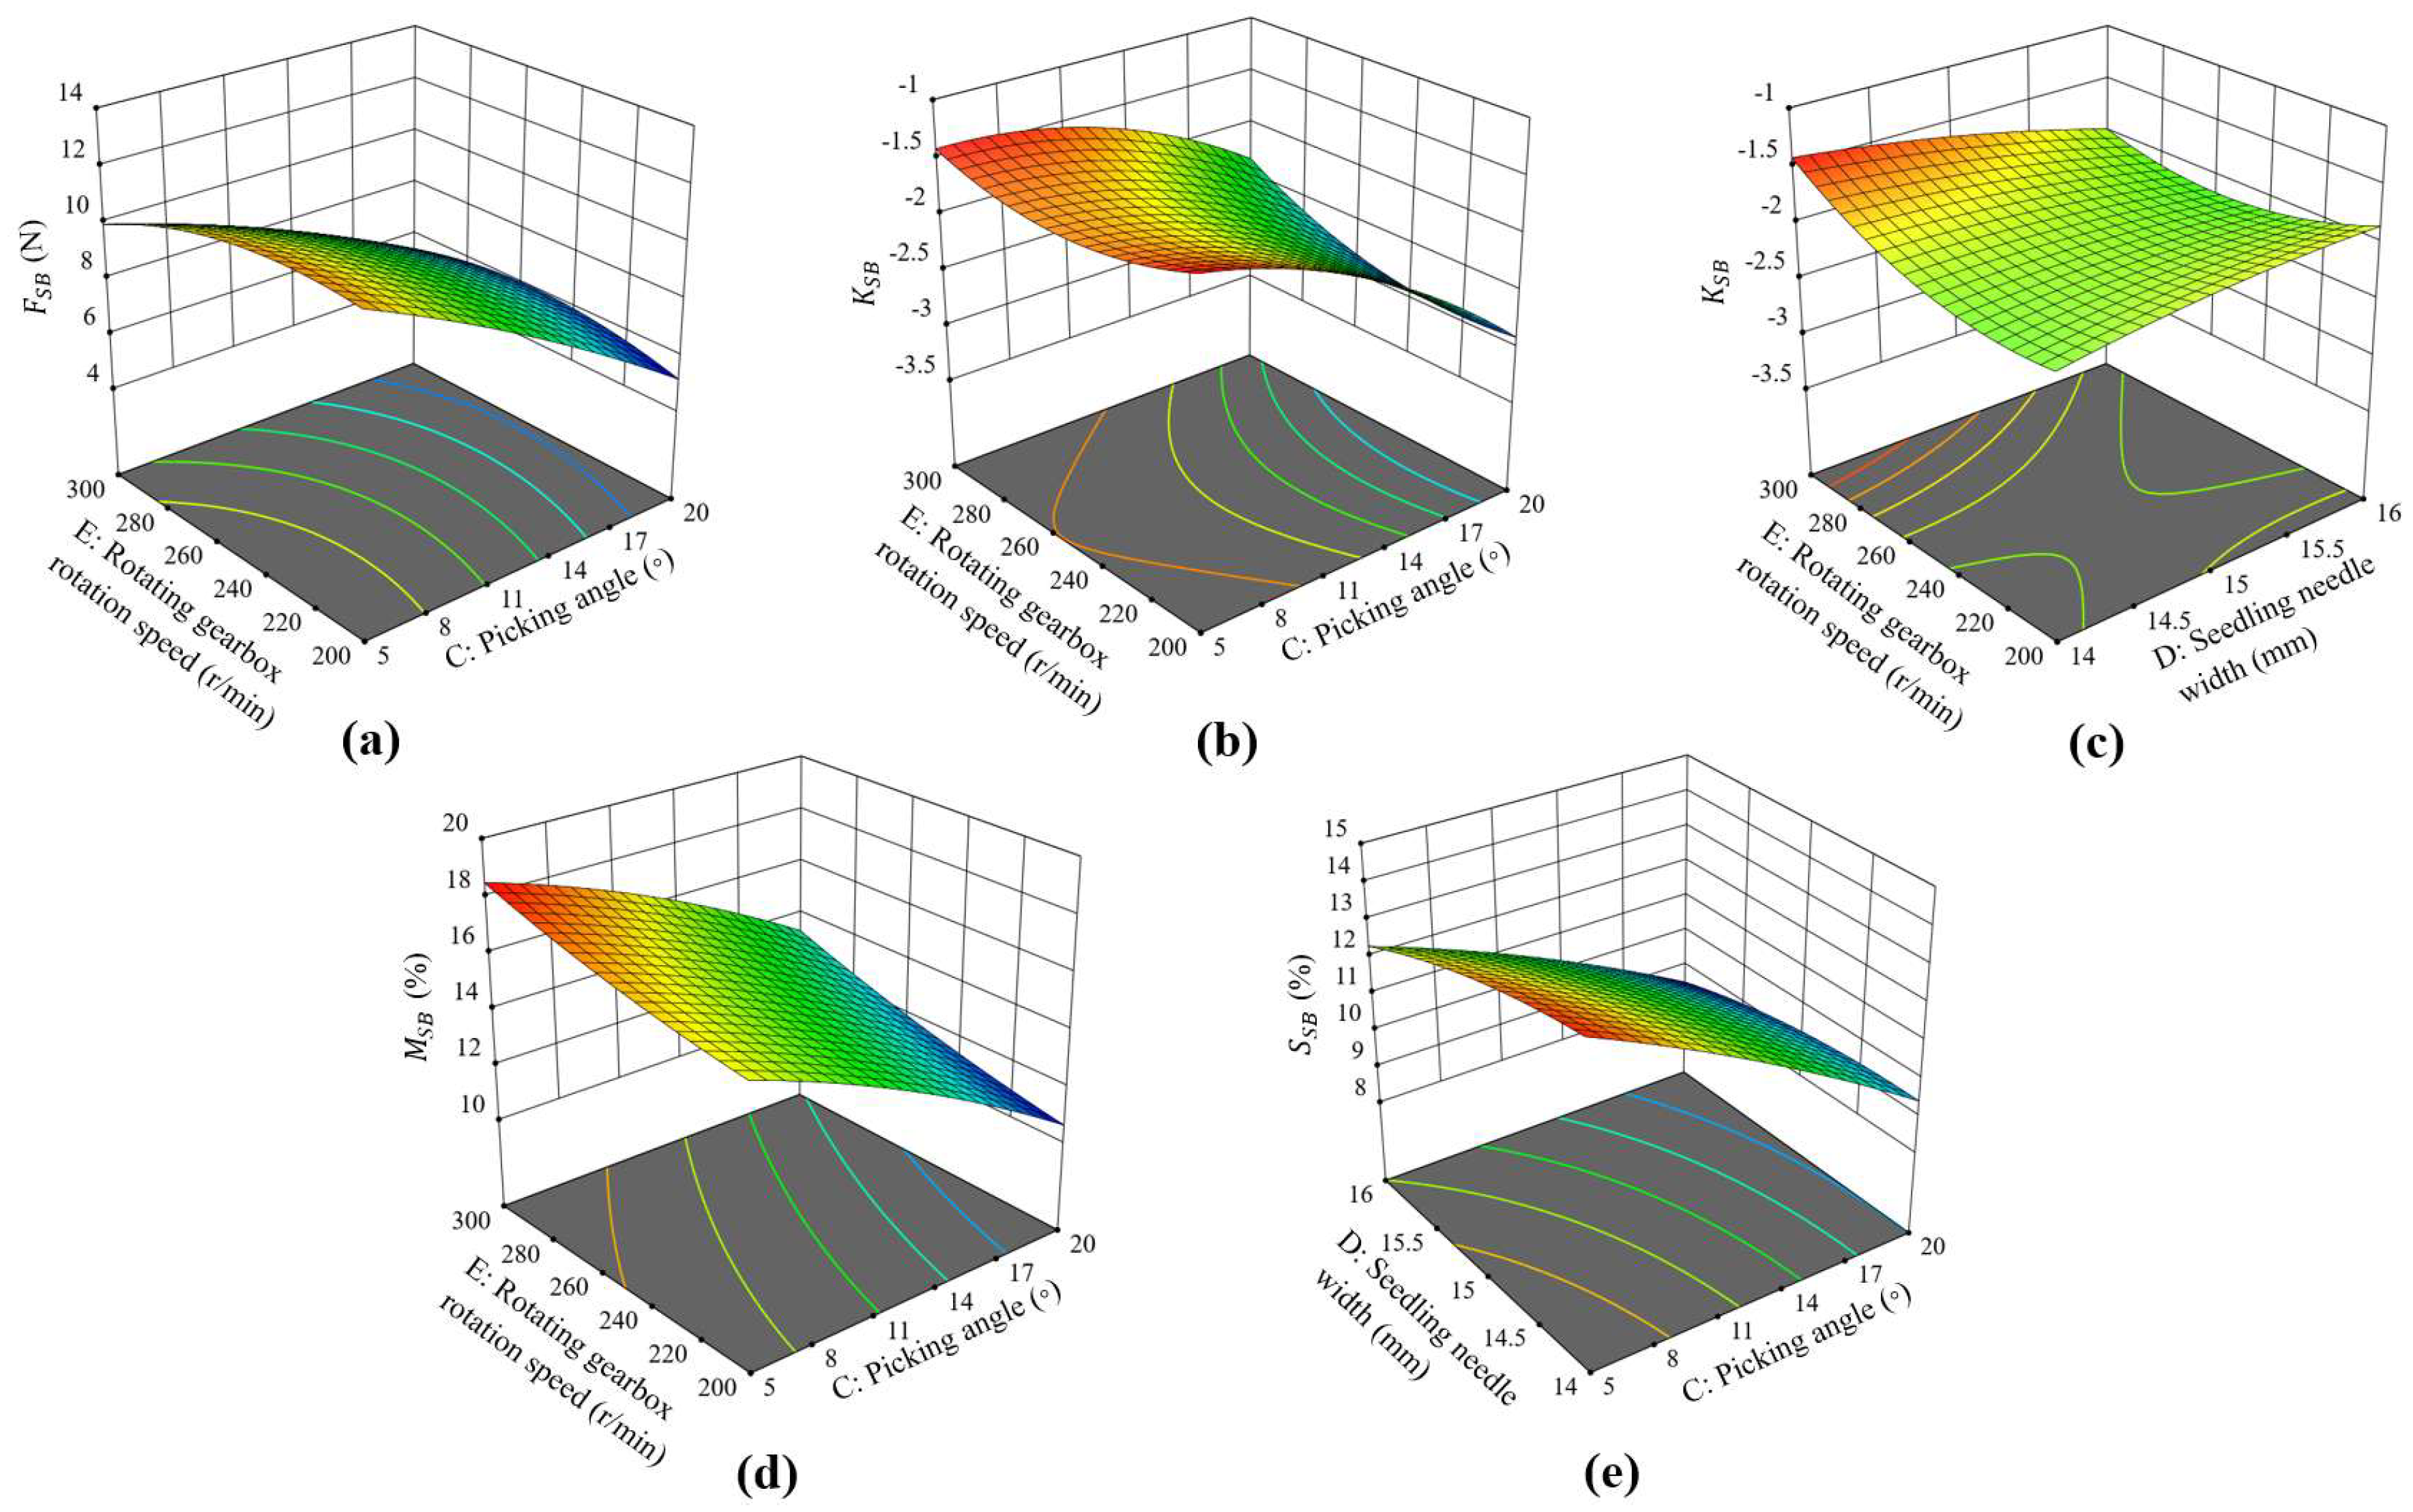
The response surface plots of the regression models for different interaction terms that have significant impact on the evaluation indicators were plotted based on Equations (28)–(31) (Figure 16). The response surface analysis of FSB interaction term CE is shown in Figure 16a. It could be observed that FSB decreased with increasing values of both C and E, with the rate of decrease accelerating; FSB decreased sharply when C > 15 and E > 250, while the change of FSB was slower when C < 10 or E < 200. The interaction of CE was highly significant, indicating that the simultaneous increase in C and E would significantly reduce FSB.
Figure 16b,c show the response surfaces of the KSB interaction terms CE and DE, respectively. When C was minor, with the increase in E, KSB raised abruptly; when C was relatively large, KSB increased gently with the increase in E, and the magnitude of the increase was small, so it could be concluded that the larger the C was, the weaker the positive effect of E on KSB was (CE negative interaction). The response surface had a saddle-shaped feature, which was caused by the antagonistic effects of C and E leading to the surface distortion. When D = 14, KSB increased with the increase in E, and the positive effect of E was obvious; when D = 20, the increase in E made KSB decrease, and this turning point occurred near D = 15, where DE had a cross-type interaction. With fixed E, KSB decreased slightly with the increasing of D, and the effect was not significant.
Figure 16d is the response surface of the MSB interaction term CE. When E was fixed, the increase in C led to the decrease of MSB, but when E became larger, the negative effect of C was slightly weakened (CE interaction); when C was fixed, MSB increased with the increase in E, but the positive effect of E was stronger at high C level (CE positive interaction).
The response surface of the SSB interaction term CD is shown in Figure 16e. SSB decreased with the increase in C, but the negative effect of C was slightly mitigated by approximately 17% when D takes a larger value (e.g., D = 16). Similarly to the main effect of C, SSB decreased with the increase in D; when C is relatively large (e.g., C = 20), the negative effect of D was weakened by 52%. According to the response surface analysis, CD had a negative interaction.
Factor significance analysis indicated that the picking angle was the most critical parameter affecting the lateral cutting quality. When the picking angle was relatively small, the tip of the seedling needle was obliquely inserted into the root blanket, which increased the maximum lateral cutting resistance and resulted in an inclined fracture surface. Moreover, the seedling needle was positioned closer to the seedlings, resulting in a large number of FRs and SRs being cut off and torn off and the disturbance to the substate being greater. Consequently, both the SB breakage rate and root injury rate were significantly higher than those observed in the longitudinal cutting. Therefore, when optimizing the working parameters of the RBS lateral cutting, the picking angle should be increased as much as possible to increase the verticality of the upper and lower lateral cutting fracture surfaces of the SB.

3.3.3. Determination of the Optimal Value of the Lateral Cutting Parameters

In order to obtain the best lateral cutting quality, based on the range of each factor value and the working requirements of the seedling needle, the minimum values of the maximum lateral cutting resistance (FSB), SB fracture surface contour fitting line slope (KSB), SB breakage rate (MSB), and SB root injury rate (SSB) were taken as the optimization objectives. The picking angle (C), seedling needle width, and rotary gearbox speed (E) were taken as optimization objects to solve the regression model. Equation (32) gave the optimization search functions for each second-order response model.
m i n F S B ,   K S B ,   M S B ,   S S B s . t . 5 C 20 14 D 16 200 E 300
The solution from Design-Expert 12.0 software suggested the minimum values of 5.48 N, −2.92, 10.88%, and 9.69% for FSB, KSB, MBS, and SSB, respectively. These values were obtained when C, D, and E were 20°, 15.18 mm, and 208.64 r/min, respectively. Considering the cost and practical feasibility of the optimal combination of working parameters, the above values were rounded to the nearest integers; the values were 20°, 15 mm, and 209 r/min, respectively.

3.3.4. BBD Optimal Parameter Verification Test

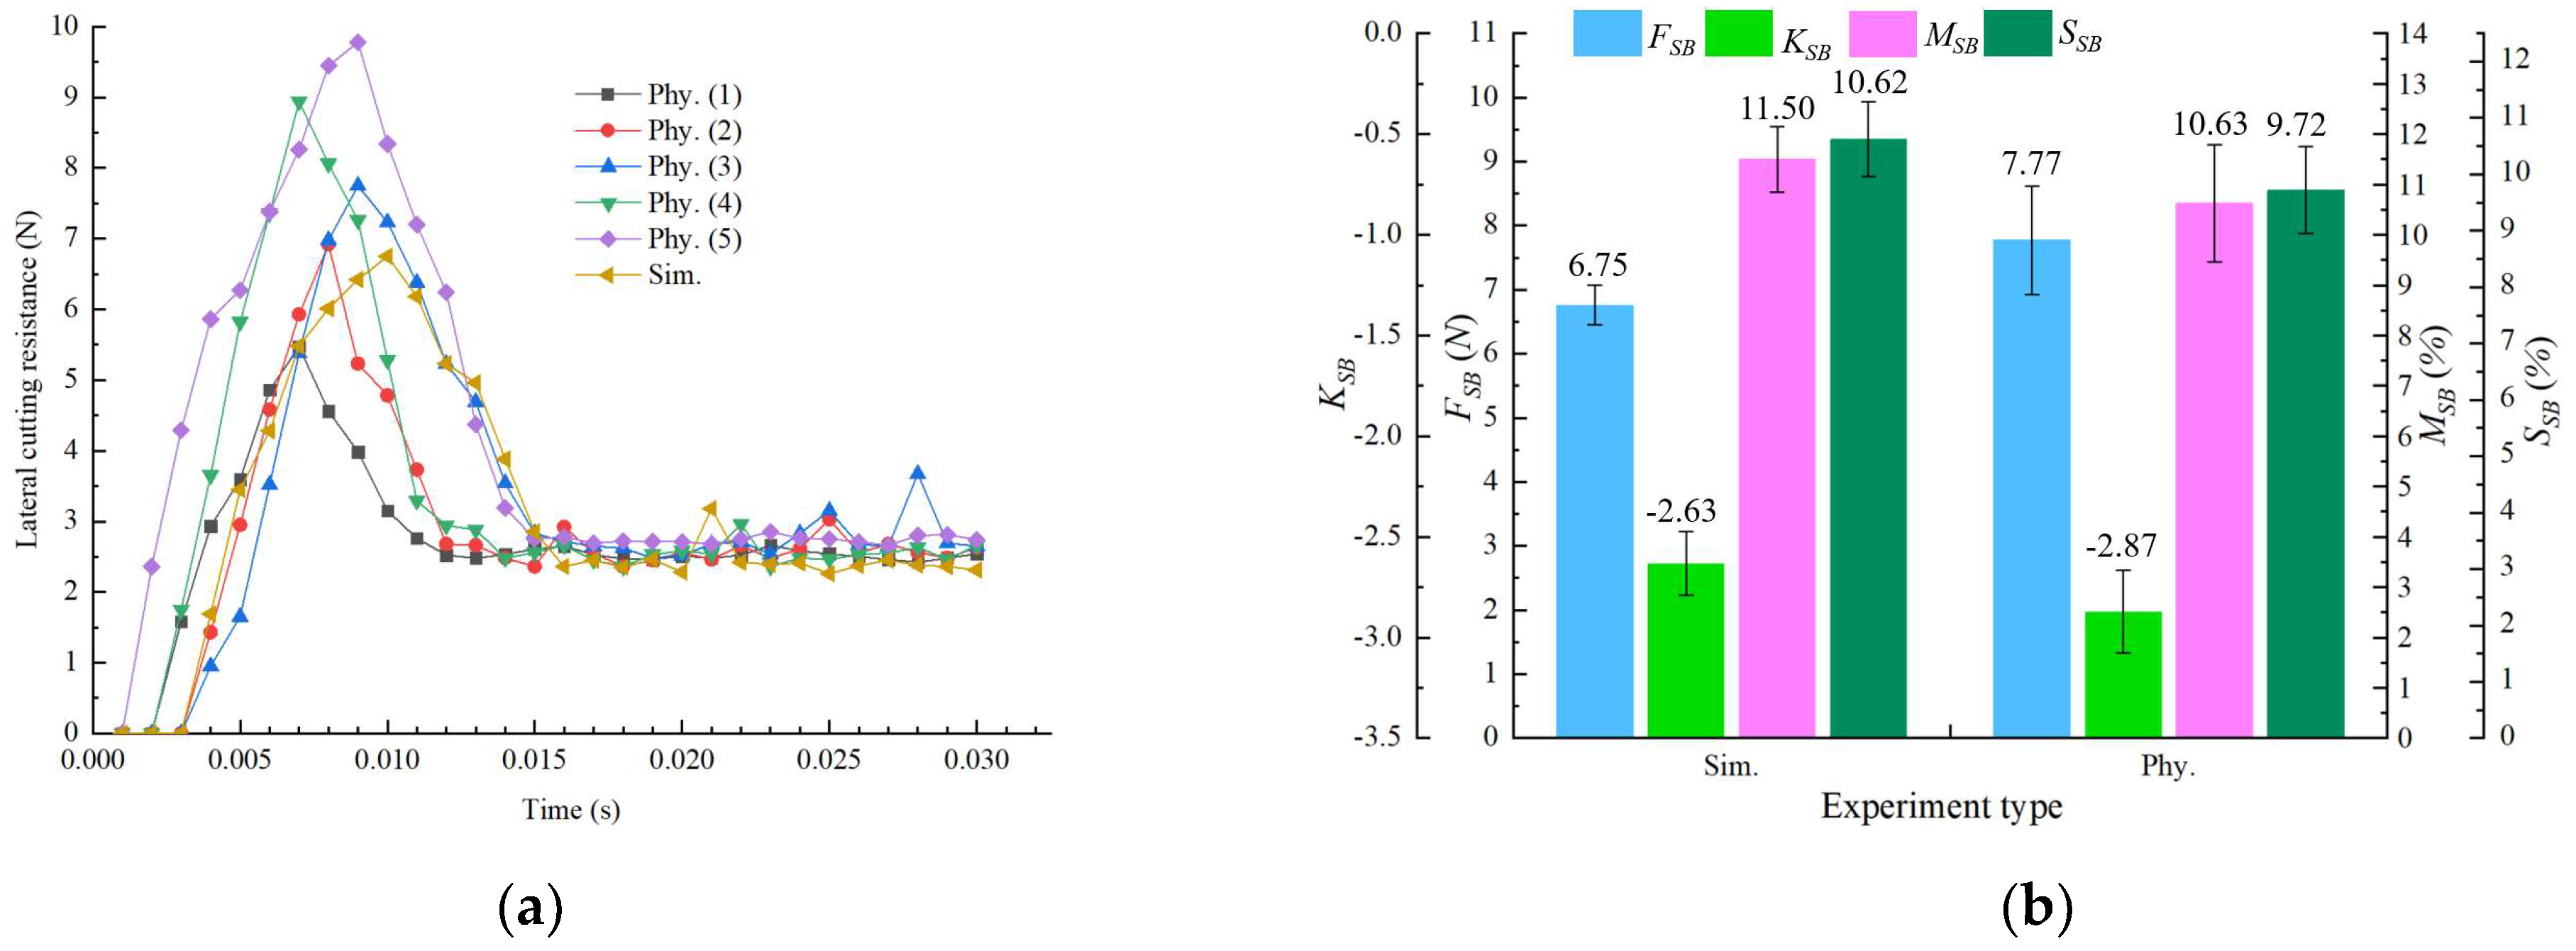
To verify the accuracy and applicability of the optimal parameter combination of picking angle, seedling needle width, and rotary gearbox speed, the lateral cutting simulated and physical tests of the RBS were conducted. In these tests, the data of lateral cutting resistance, SB fracture surface contour fitting line slope, SB breaking rate, and SB root injury rate was collected and analyzed.
The root–substrate separation resistance of seedlings mainly acts on the seedling needle in the form of root–substrate contact force [2]. The lateral cutting resistance curves of the seedling needle obtained from the simulated and physical tests during lateral cutting of the RBS are shown in Figure 17a. By comparing the simulated and physical test data, the variation laws of the lateral cutting resistance curves with time were highly consistent. From the beginning of contact with the RBS, the seedling needle experienced a large resistance in the short term. The peak value was the maximum lateral cutting resistance, mainly because there were many hair roots in the substrate, the crown roots were staggered and intertwined, and the root blanket had a greater ability to resist separation and destruction [4]. The maximum lateral cutting resistance fluctuated between 5.47 and 9.78 N by analyzing and comparing the results of five physical tests. This numerical error was mainly due to the different growth and development environments of rice seedlings, so the root morphology and hierarchical structure of the root blanket were different. This finding is consistent with the experimental results reported by Xue et al. [20] in studying the load of rice seedling separation, which is also the reason why the error range of physical test data is larger than that of simulation data (Figure 17b). As shown in Figure 17a, the fluctuations in the lateral cutting resistance curves of the seedling needle observed in the physical tests were primarily caused by the uneven bonding strength between the seedling root and the substrate, while the fluctuations in the resistance curve of the lateral cutting of the seedling needle in the simulated test were caused by the rotation and limited range displacement when the substrate particles and the root particles interacted [42]. Taking the average value of the results of five physical tests, the deviation between the physical value and the simulated value of the maximum lateral cutting resistance was 13.13%. In summary, the above conclusions verified that the coupling model could be used to analyze the lateral cutting process of the seedling needle.
As shown in Figure 17b, the simulated values of the SB fracture surface contour fitting line slope were consistently higher than those of the physical test, which was consistent with the reason why the simulated value of the RBS width was always lower than the physical values. The simulated values of SB breakage rate and SB root injury rate were higher than the measured values, which is similar to the reason why the simulated values of RBS breakage rate and RBS root injury rate were higher than the measured values. The deviations between the simulated and physical data of these three evaluation indicators were 9.93%, 8.18%, and 9.26%, respectively, none of which exceeded 10%, which verified the reliability and accuracy of the model in predicting the lateral cutting performance of the seedling needle. The optimized seedling needle’s working parameters effectively met the design requirements of the cutting device.

4. Conclusions

(1)
Based on the DEM-MBD coupling method, the LSC–substrate–root interaction model was established to simulate the longitudinal cutting processes of the root blanket by the LSCs arranged at a CA of 0°, CA of 30°, and CA of 60°. The number of LSCs involved in cutting simultaneously was twelve, four and three, respectively. Based on the simulation tests of the CCD method and response surface analysis, the effects of the sliding cutting and cutter shaft speed on the maximum longitudinal cutting torque, RBS width, RBS breakage rate, and RBS root injury rate were studied. The quadratic regression models of the four performance evaluation indicators of the LSCs arranged at the three CAs were all significant, confirming the models’ high fitting accuracy and applicability in predicting slip cutting angle and cutter shaft speed. The cutting performance of the LSCs arranged at a CA of 0°, CA of 30°, and CA of 60° was significantly affected by the cutter shaft speed, the sliding angle and cutter shaft speed, and the sliding angle, respectively.
(2)
The LSCs’ CA arrangement significantly affected cutting performance. The cutting angles of the LSCs should be staggered to disperse the peak cutting force and reduce vibration. Among the tested configurations, LSCs arranged at a CA of 60° had the best cutting performance, which was recommended for root blanket longitudinal cutting. Based on multi-objective optimization, the optimal operating parameters were determined to be a sliding angle of 57° and a cutter shaft speed of 65.3 r/min. Under the optimal parameters, comparing the simulated data with the physical test data, the variation trend in the longitudinal cutting torque curves with the working time was basically the same, and the average deviation of the four peak values was less than 8%. The deviations of the RBS width, RBS breakage rate, and RBS root injury rate were 3.65%, 12.82%, and 13.19%, respectively, confirming the accuracy and reliability of the optimized parameters. These optimized parameters also provided a valuable reference for the subsequent parameter optimization of the cutting process of the seedling needle.
(3)
The coupled DEM–MBD method was used to establish a simulation model of the interaction between the seedling needle, substrate, and root, enabling the simulation of the lateral cutting process of the seedling needle. The SB fracture surface was uneven and showed a certain inclination angle. The simulation tests of the CCD method and response surface analysis were conducted to investigate the effects of picking angle, seedling needle width, and rotary gearbox speed on the four evaluation indicators: the maximum lateral cutting resistance, SB fracture surface contour fitting line slope, SB breakage rate, and SB root injury rate. All four second-order regression models were statistically significant, confirming that the optimal values of picking angle, seedling needle width, and rotary gearbox speed could be predicted. The picking angle had the highest F-value among the three factors, making it the most influential factor affecting the lateral cutting quality.
(4)
The optimal working parameters of the seedling needle were determined as follows: a picking angle of 20°, a seedling needle width of 15 mm, and a rotary gearbox speed of 209 r/min. Under these optimal parameters, the maximum physical lateral cutting resistance fluctuated between 5.47 N and 9.78 N. A comparison between simulated and physical test data showed that the variation laws of the lateral cutting resistance curves over time were highly consistent. The deviations of the maximum lateral cutting resistance, SB fracture surface contour fitting line slope, SB breakage rate, and SB root injury rate were 13.22%, 9.82%, 8.19%, and 9.33%, respectively. These results verified the reliability and accuracy of the model in predicting the lateral cutting performance of the seedling needle and confirmed that the optimized parameters effectively met the design requirements of the cutting device.
However, the EDEM model simplification may lead to deviations between the simulation results of the root blanket force and cutting process and the actual working conditions. In addition, the analysis of wear, friction, and soil–root variability is not included, and the influence of component loss on cutting performance in long-term operation cannot be evaluated, making the simulation analysis detached from the actual field environment and weakening the practical significance of the conclusions. For this reason, in our future work, we will establish a refined root blanket EDEM model, introduce three-dimensional root morphology to improve optimization accuracy, and couple discrete element and finite element methods to establish a root blanket-component friction and wear prediction model, providing a basis for component material selection and durability design. We will also establish a soil–root variability parameter library to make the research more suitable for field practice. Finally, a more accurate, comprehensive, and practical optimization system for root blanket cutting devices will be constructed, providing scientific support for the performance upgrade and efficient application of rice blanket seedling-cutting and -throwing transplanters.

Author Contributions

Conceptualization, X.J. and C.L.; methodology, X.J., S.H., J.S. and L.C.; software, X.J. and C.Z.; validation, X.J., J.S. and L.C.; formal analysis, J.X.; investigation, X.J., J.S. and X.Z.; resources, C.L. and J.L.; data curation, X.J. and J.X.; writing—original draft preparation, X.J.; writing—review and editing, S.H.; visualization, X.Z.; supervision, C.L. and J.L.; project administration, X.J. and C.L.; funding acquisition, C.L. and J.L. All authors have read and agreed to the published version of the manuscript.

Funding

This research was funded by the National Natural Science Foundation of China, grant number 52175261; the Scientific Research Fund Project of Yunnan Provincial Department of Education, grant number 2023J1132 and 2024J1027; and the Science and Technology Specialists Sent by Yunnan Province to Enterprises, grant number 530000241100003308702.

Institutional Review Board Statement

Not applicable.

Data Availability Statement

The data presented in this study is available on request from the corresponding author.

Conflicts of Interest

The authors declare no conflicts of interest.

Appendix A

The simulation parameters used in the establishment of the root blanket DEM flexible model in Section 2.2.1 are shown in Table A1 below.
Table A1. Simulation parameters of DEM model.
ItemMaterialValueData Source
Intrinsic parameters
Density (kg·m−3)Substrate (SI, SII, SIII)552 [36]
Steel7830EDEM, 2022
PVC1400[58]
Stem789[36]
Root858[36]
Poisson’s ratio Substrate0.30[59]
Steel0.35EDEM, 2022
PVC0.38[58]
Stem0.43[60]
Root0.20[61]
Shear modulus (Pa)Substrate1.44 × 106[59]
Steel7.90 × 1010EDEM, 2022
PVC8.66 × 108[58]
Stem2.44 × 106[36]
RootFR2.08 × 106[36]
SR4.20 × 106[36]
TR2.45 × 106[36]
NL4.76 × 105[36]
Basic contact parameters
Restitution coefficient Substrate–substrate0.45[59]
Substrate–steel0.40[59]
Root–root0.10[62]
Root–SII (SIII)0.20[61]
Root–steel0.145[10]
Root–PVC0.12[58]
Stem–stem0.30[63]
Stem–SI0.21[64]
Static friction coefficientSI-SI0.726[36]
SII-SII1.088[36]
SIII-SIII1.088[36]
SI–steel0.794[36]
SII (SIII)–steel0.986[39]
Root–root0.588[39]
Root–SII (SIII)0.650[36]
Root–steel0.484[36]
Root–PVC0.20[58]
Stem–stem0.371[36]
Stem–SI0.413[36]
Rolling friction coefficientSI-SI0.229[36]
SII-SII0.275[36]
SIII-SIII0.275[36]
SI–steel0.139[36]
SII (SIII)–steel0.069[36]
Root–root0.140[36]
Root–SII (SIII)0.161[39]
Root–steel0.196[39]
Root–PVC0.02[56]
Stem–stem0.019[36]
Stem–SI0.034[36]
Contact model parameters
Normal stiffness per unit area (N·m−3)Substrate 3.0   ×   107[36]
Stem 2.49   ×   106[36]
FR 1.61   ×   106[36]
SR 3.65   ×   106[36]
TR 2.13   ×   106[36]
NL 3.67   ×   106[36]
Shear stiffness per unit area (N·m−3)Substrate 7.5 × 10⁷[36]
Stem 1.66   ×   106[36]
FR 1.07   ×   106[36]
SR 2.43   ×   106[36]
TR 1.42   ×   106[36]
NL 2.45   ×   106[36]
Normal strength (Pa)SI38,468[36]
SII47,323[36]
SIII 4.55   ×   105[36]
Stem 5.94   ×   105[36]
FR 5.23   ×   105[36]
SR 4.05   ×   105[36]
TR 3.30   ×   105[36]
NL 6.52   ×   105[36]
Shear strength (Pa)SI83,653[36]
SII88,216[36]
SIII 6.31   ×   105[36]
Stem 4.47   ×   105[36]
FR 7.93   ×   105[36]
SR 6.66 ×   105[36]
TR 6.25 ×   105[36]
NL 9.06   ×   104[36]
bonded disk scaleSubstrate 1.375[36]
Stem1.2[62]
FR1.2[62]
SR1.2[62]
TR1.2[62]
NL1.2[62]
Interfacial surface   energy   ( J · m 2 )Stem–SI0.95[36]
Root–SII2.12[36]
Root–SIII3.69[36]

References

  1. Jia, X.; Li, Y.; Song, J.; Liu, C.; Cao, X.; Chen, L.; Wan, L.; Ma, X. Effects of Different Machine Transplanting Methods on the Physiological and Yield Characteristics of Late Rice in China. Int. J. Agric. Biol. Eng. 2023, 16, 37–47. [Google Scholar] [CrossRef]
  2. Xue, K.; Gao, K.; Kuang, F.; Zhang, S.; Liao, J.; Zhu, D. Machinery-Plant-Paddy Soil Coupling Model Based Numerical Simulation Method of Mechanical Transplanting Process of Big Rice Seedling. Comput. Electron. Agric. 2022, 198, 107053. [Google Scholar] [CrossRef]
  3. Deng, F.; He, L.; Chen, D.; Zhang, C.; Tian, Q.; Wu, Z.; Li, Q.; Zeng, Y.; Zhong, X.; Chen, H.; et al. Growth Characteristics and Grain Yield of Machine-Transplanted Medium Indica Hybrid Rice with High Daily Yield. J. Integr. Agric. 2022, 21, 2547–2558. [Google Scholar] [CrossRef]
  4. Jia, X.; Yang, Q.; Wen, X.; Wang, J.; Chen, Y.; Wu, A.; Song, J. Research and Application of Mechanized Seedling Raising and Transplanting Technology of Large-Bowl Blanket Seeding of Rice. China Rice 2022, 28, 18–22. [Google Scholar]
  5. Ye, C.; Li, Y.; Cao, Z.; Huang, J.; Sun, B.; Shu, S.; Wu, L. Effects of Different Seedling Raising Trays on Plant Type and Grain Yield of Machine-Transplanted Double Cropping Rice. Chin. J. Rice Sci. 2020, 34, 435–442. [Google Scholar]
  6. Jia, X.; Song, J.; Wang, J.; Cao, X.; Liu, C.; Wan, L.; Zheng, H.; Xu, Z. Effects of Seedling Age and Substrate Soil Ratio on the Population Quality and Yield of Late Rice of Machine-Transplanted Large-Pot Carpet Seedlings. Trans. Chin. Soc. Agric. Eng. 2022, 38, 1–11. [Google Scholar] [CrossRef]
  7. Wang, T.; Shi, M.; Xi, D.; Sun, D.; Kuang, F.; Xiong, W.; Zhang, S.; Zhu, D. Injury Mechanisms in High-Speed Transplanting of over Aged Rice Seedlings. Biosyst. Eng. 2024, 248, 142–155. [Google Scholar] [CrossRef]
  8. Chu, J.; Zhang, T.; Li, J.; Yin, Q.; Zhang, L.; Zhang, W. Design and Experiment of Automatic Planting Device for Root-Cut Grafted Seedlings. Trans. Chin. Soc. Agric. Mach. 2016, 47, 28–34. [Google Scholar]
  9. Cui, G.; Wei, Y.; Wen, S.; Zheng, X.; Wang, J.; Cui, Y. Experiment and Parameter Optimization of Root-Cutting for Trimming Postharvest Cabbage. Inmateh Agric. Eng. 2021, 63, 405–412. [Google Scholar] [CrossRef]
  10. Zhang, J.; Wang, J.; Du, D.; Long, S.; Wang, Y.; Han, C.; Xu, Y. Optimization and Validation of Root-Cutting Device for Chinese Cabbage Harvester Based on Discrete Element Method. Comput. Electron. Agric. 2023, 214, 108314. [Google Scholar] [CrossRef]
  11. Wu, K.; Song, Y. Research Progress Analysis of Crop Stalk Cutting Theory and Method. Trans. Chin. Soc. Agric. Mach. 2022, 53, 1–20. [Google Scholar]
  12. Hou, S.; Chen, H.; Zou, Z.; Shi, N. Design and Test of Side-Direction Straw-Cleaning Blade for Seedbed Treatment of Original Stubble Planter. Trans. Chin. Soc. Agric. Mach. 2019, 50, 41–51+217. [Google Scholar]
  13. Mathanker, S.K.; Grift, T.E.; Hansen, A.C. Effect of Blade Oblique Angle and Cutting Speed on Cutting Energy for Energycane Stems. Biosyst. Eng. 2015, 133, 64–70. [Google Scholar] [CrossRef]
  14. Yan, L. Discussion on Sliding Cutting Angle of Working Parts of Agricultural Machinery. Acta Agric. Univ. Jiangxiensis 1991, 13, 64–68. [Google Scholar] [CrossRef]
  15. Guo, Q.; Zhang, X.; Xu, Y.; Li, P.; Chen, C.; Wu, S. Design and Experiment of Cutting Blade for Cane Straw. Trans. Chin. Soc. Agric. Eng. 2014, 30, 47–53. [Google Scholar]
  16. He, C.; You, Y.; Wang, D.; Wang, G.; Lu, D.; Morris Togo Kaji, J. The Effect of Tine Geometry During Vertical Movement on Soil Penetration Resistance Using Finite Element Analysis. Comput. Electron. Agric. 2016, 130, 97–108. [Google Scholar] [CrossRef]
  17. Zou, L.; Yan, D.; Niu, Z.; Yuan, J.; Cheng, H.; Zheng, H. Parametric Analysis and Numerical Optimisation of Spinach Root Vibration Shovel Cutting Using Discrete Element Method. Comput. Electron. Agric. 2023, 212, 108138. [Google Scholar] [CrossRef]
  18. Sun, L.; Jiang, K.; Zhou, B.; Yu, G.; Cui, R.; Xue, X. Design and Experiment of Regenerated Rice on Space Trajectory Transplantation Mechanism with Zero Lateral Offset. Trans. Chin. Soc. Agric. Mach. 2024, 55, 101–108. [Google Scholar]
  19. Xu, C.; Shan, Y.; Xin, L.; Xie, J.; Li, Z.; Zhao, Y. Design and Experiment of High-speed Rice Transplanter with Extensible Mulch Cutting Mechanism in Mulching Cultivation System. Trans. Chin. Soc. Agric. Mach. 2020, 51, 79–87. [Google Scholar]
  20. Xu, Y.; Zhu, Y.; Xue, X.; Wang, L.; Sun, L.; Yu, G. Optimal Design and Experiment on Gear Train Wide and Narrow Row Transplanting Mechanism of Spatial Direct Extraction and Large Offset of Ratooning Rice. Trans. Chin. Soc. Agric. Mach. 2022, 53, 83–90. [Google Scholar]
  21. Pradhan, N.C.; Sahoo, P.K.; Kushwaha, D.K.; Makwana, Y.; Mani, I.; Kumar, M.; Aruna, T.N.; Soumya, K.V. A Finite Element Modeling-Based Approach to Predict Vibrations Transmitted Through Different Body Segments of the Operator Within the Workspace of a Small Tractor. J. Field Robot. 2023, 40, 1543–1561. [Google Scholar] [CrossRef]
  22. Chen, G.; Wang, Q.; Li, H.; He, J.; Wang, X.; Zhang, X.; He, D. Experimental Research on Vertical Straw Cleaning and Soil Tillage Device Based on Soil-Straw Composite Model. Comput. Electron. Agric. 2024, 216, 108510. [Google Scholar] [CrossRef]
  23. Wang, Y.; Jin, Y.; Liang, X.; Liu, X.; Tan, B.; He, S.; Zheng, J.; Hou, G.; Zhang, Y. Fragmentation of Soil-Root Complexes in Sloping Landscapes During Tillage and Soil Translocation. Biosyst. Eng. 2022, 223, 116–128. [Google Scholar] [CrossRef]
  24. Zhu, D.; Shi, M.; Yu, C.; Yu, Z.; Kuang, F.; Xiong, W.; Xue, K. Tool-Straw-Paddy Soil Coupling Model of Mechanical Rotary-Tillage Process Based on DEM-FEM. Comput. Electron. Agric. 2023, 215, 108410. [Google Scholar] [CrossRef]
  25. Zhang, L.; Zhai, Y.; Wu, C.; Huang, S.; Zhang, Z. Modeling the Interaction between a New Four-Bar Subsoiling Mechanism and Red Soil Using the Improved Differential Evolution Algorithm and DEM. Comput. Electron. Agric. 2023, 208, 107783. [Google Scholar] [CrossRef]
  26. Qian, J.; Ma, S.; Xu, Y.; Li, W.; Wang, C.; Yang, S.; Wang, F. Experimental Study on the Sugarcane Stubble Base-Cutting Mechanism. Biosyst. Eng. 2024, 245, 122–134. [Google Scholar] [CrossRef]
  27. Wang, J.; Xu, Y.; Wang, C.; Xiang, Y.; Tang, H. Design and Simulation of a Trenching Device for Rice Straw Burial and Trenching Based on MBD-DEM. Comput. Electron. Agric. 2023, 207, 107722. [Google Scholar] [CrossRef]
  28. Liu, L.; Wang, X.; Zhang, X.; Zhong, X.; Wei, Z.; Geng, Y.; Cheng, X.; Zhao, K.; Bai, M. Determination and Verification of Parameters for the Discrete Element Modelling of Single Disc Covering of Flexible Straw with Soil. Biosyst. Eng. 2023, 233, 151–167. [Google Scholar] [CrossRef]
  29. Zhang, S.; Jia, X.; Dong, J.; Wang, X.; Zhao, H.; Chen, X.; Zhang, Z.; Huang, Y.; Shi, J. Optimization of Operating Angles of Disc Coulters for Maize Residue Management Using Discrete Element Method. Comput. Electron. Agric. 2024, 218, 108691. [Google Scholar] [CrossRef]
  30. Liu, L.; Wang, X.; Zhang, X.; Cheng, X.; Wei, Z.; Zhou, H.; Zhao, K. The Impact of ‘T’-Shaped Furrow Opener of No-Tillage Seeder on Straw and Soil Based on Discrete Element Method. Comput. Electron. Agric. 2023, 213, 108278. [Google Scholar] [CrossRef]
  31. Lin, J.; Liao, Q.; Wang, X.; Kang, Y.; Du, W.; Zhang, Q. Exploring Straw Movement Through the Simulation of Shovel-Type Seedbed Preparation Machine-Straw-Soil Interaction Using the DEM-MBD Coupling Method. Comput. Electron. Agric. 2024, 226, 109465. [Google Scholar] [CrossRef]
  32. Xie, D.; He, J.; Liu, T.; Liu, C.; Zhao, G.; Chen, L. Establishment and Validation the DEM-MBD Coupling Model of Flexible Straw-Shajiang Black Soil-Walking Mechanism Interactions. Comput. Electron. Agric. 2024, 224, 109203. [Google Scholar] [CrossRef]
  33. Liu, Y.; Huang, X.; Ma, L.; Zong, W.; Zhan, G.; Lin, Z. Design and test of static sliding Cut angle constant cut-ting machine for chain oil sunflower harvester header. Trans. Chin. Soc. Agric. Mach. 2021, 52, 99–108. [Google Scholar]
  34. Zhang, C.; Chen, L.; Xia, J.; Zhang, J. Effects of Blade Sliding Cutting Angle and Stem Level on Cutting Energy of Rice Stems. Int. J. Agric. Biol. Eng. 2019, 12, 75–81. [Google Scholar] [CrossRef]
  35. Zheng, K.; He, J.; Li, H.; Diao, P.; Wang, Q.; Zhao, H. Research on Polyline Soil-Breaking Blade Subsoiler Based on Subsoiling Soil Model Using Discrete Element Method. Trans. Chin. Soc. Agric. Mach. 2016, 47, 62–72. [Google Scholar] [CrossRef]
  36. Jia, X.; Zheng, X.; Chen, L.; Liu, C.; Song, J.; Zhu, C.; Xu, J.; Hao, S. Discrete Element Flexible Modeling and Experimental Verification of Rice Blanket Seedling Root Blanket. Comput. Electron. Agric. 2025, 233, 110155. [Google Scholar] [CrossRef]
  37. Ahmadi, I. A Torque Calculator for Rotary Tiller Using the Laws of Classical Mechanics. Soil. Tillage Res. 2017, 165, 137–143. [Google Scholar] [CrossRef]
  38. Vu, V.-D.; Ngo, Q.-H.; Nguyen, T.-T.; Nguyen, H.-C.; Nguyen, Q.-T.; Nguyen, V.-D. Multi-Objective Optimisation of Cutting Force and Cutting Power in Chopping Agricultural Residues. Biosyst. Eng. 2020, 191, 107–115. [Google Scholar] [CrossRef]
  39. Wu, G.; Yu, G.; Ye, B.; Yu, Y. Forward-Reverse Design Method for Rice Potted-Seedling Transplanting with Compound Planetary Gear Train. Trans. Chin. Soc. Agric. Mach. 2020, 51, 85–93+102. [Google Scholar] [CrossRef]
  40. Chen, Z.; Hua, G.; Li, S.; Ding, X.; Fang, X. Agricultural Machinery Design Handbook (First Volume); China Agricultural Science and Technology Press: Beijing, China, 2007. [Google Scholar]
  41. Song, X.; Dai, F.; Zhang, X.; Chen, H.; Zhang, F.; Zhao, W. Numerical Analyses Ridge-Forming for Whole Film-Mulching and Double Ridge-Furrow, a Discrete Element Method. Comput. Electron. Agric. 2023, 215, 108364. [Google Scholar] [CrossRef]
  42. Zhang, S.; Zhao, H.; Wang, X.; Dong, J.; Zhao, P.; Yang, F.; Chen, X.; Liu, F.; Huang, Y. Discrete Element Modeling and Shear Properties of the Maize Stubble-Soil Complex. Comput. Electron. Agric. 2023, 204, 107519. [Google Scholar] [CrossRef]
  43. Coetzee, C.J. Particle Upscaling: Calibration and Validation of the Discrete Element Method. Powder Technol. 2019, 344, 487–503. [Google Scholar] [CrossRef]
  44. Zhang, S.; Zhang, R.; Cao, Q.; Zhang, Y.; Fu, J.; Wen, X.; Yuan, H. A Calibration Method for Contact Parameters of Agricultural Particle Mixtures Inspired by the Brazil Nut Effect (BNE): The Case of Tiger Nut Tuber-Stem-Soil Mixture. Comput. Electron. Agric. 2023, 212, 108112. [Google Scholar] [CrossRef]
  45. Pradhan, N.C.; Sahoo, P.K.; Kushwaha, D.K.; Mani, I.; Srivastava, A.; Sagar, A.; Kumari, N.; Sarkar, S.K.; Makwana, Y. A Novel Approach for Development and Evaluation of LiDAR Navigated Electronic Maize Seeding System Using Check Row Quality Index. Sensors 2021, 21, 5934. [Google Scholar] [CrossRef] [PubMed]
  46. Zeng, Z.; Thoms, D.; Chen, Y.; Ma, X. Comparison of Soil and Corn Residue Cutting Performance of Different Discs Used for Vertical Tillage. Sci. Rep. 2021, 11, 2537. [Google Scholar] [CrossRef] [PubMed]
  47. Wang, Y.; Zhang, D.; Yang, L.; Cui, T.; Jing, H.; Zhong, X. Modeling the Interaction of Soil and a Vibrating Subsoiler Using the Discrete Element Method. Comput. Electron. Agric. 2020, 174, 105518. [Google Scholar] [CrossRef]
  48. Li, Z.; Ma, X.; Chen, L.; Li, H.; Huang, Y.; Li, J.; Luo, G.; Yao, J. Effects of Coupling of Nursing Seedling Densities and Seedling Fetching Area on Transplanting Quality and Yield of Hybrid Rice. Trans. Chin. Soc. Agric. Eng. 2019, 35, 20–30. [Google Scholar] [CrossRef]
  49. Wang, X.; Zhang, S.; Pan, H.; Zheng, Z.; Huang, Y.; Zhu, R. Effect of Soil Particle Size on Soil-Subsoiler Interactions Using the Discrete Element Method Simulations. Biosyst. Eng. 2019, 182, 138–150. [Google Scholar] [CrossRef]
  50. Bono, F.M.; Cinquemani, S.; Radicioni, L.; Conese, C.; Tarabini, M. An Approach for Fault Detection Based on Multibody Simulations and Feature Selection Algorithm. In Proceedings of the NDE 4.0, Predictive Maintenance, and Communication and Energy Systems in a Globally Networked World, Long Beach, CA, USA, 6 March–11 April 2022; p. 6. [Google Scholar]
  51. Zheng, Z.; He, J.; Li, H.; Diao, P.; Wang, Q.; Zhang, X. Design and Experiment of Straw-Chopping Device with Chopping and Fixed Knife Supported Slide Cutting. Trans. Chin. Soc. Agric. Mach. 2016, 47, 108–116. [Google Scholar]
  52. Liu, X. Research on the Interaction Mechanism Between the Blade and the Maize Root-Soil Composite and Optimization of the Wing-Shaped Stubble-Breaking Device. Ph.D. Thesis, Jilin University, Hangzhou, China, 2025. [Google Scholar]
  53. Wang, X.; Gao, P.; Yue, B.; Shen, H.; Fu, Z.; Zheng, Z.; Zhu, R.; Huang, Y. Optimisation of Installation Parameters of Subsoiler’ Wing Using the Discrete Element Method. Comput. Electron. Agric. 2019, 162, 523–530. [Google Scholar] [CrossRef]
  54. Maraveas, C.; Tsigkas, N.; Bartzanas, T. Agricultural Processes Simulation Using Discrete Element Method: A Review. Comput. Electron. Agric. 2025, 237, 110733. [Google Scholar] [CrossRef]
  55. Zhong, W.; Yu, A.; Liu, X.; Tong, Z.; Zhang, H. DEM/CFD-DEM Modelling of Non-Spherical Particulate Systems: Theoretical Developments and Applications. Powder Technol. 2016, 302, 108–152. [Google Scholar] [CrossRef]
  56. Zeng, Z.; Ma, X.; Chen, Y.; Qi, L. Modelling Residue Incorporation of Selected Chisel Ploughing Tools Using the Discrete Element Method (DEM). Soil. Tillage Res. 2020, 197, 104505. [Google Scholar] [CrossRef]
  57. Zhao, W.; Chen, M.; Xie, J.; Cao, S.; Wu, A.; Wang, Z. Discrete Element Modeling and Physical Experiment Research on the Biomechanical Properties of Cotton Stalk. Comput. Electron. Agric. 2023, 204, 107502. [Google Scholar] [CrossRef]
  58. Cui, Y.; Zhu, Y.; Ma, L.; Ding, X.; Cao, D.; He, Z. Design and Experiment of Air-Suction Substrates Removal Device for Plug Lack of Seedlings Trays. Trans. Chin. Soc. Agric. Mach. 2022, 53, 140–151. [Google Scholar] [CrossRef]
  59. Wang, G.; Xue, Z.; Song, G.; Wang, Q.; Guo, C. Study on Spiral Stirring Process Simulation and Mixing Mechanism of Coconut Bran Substrate Based on Discrete Element Method. 2021. Available online: https://dost.hainan.gov.cn/kjcg/cggg/cggg2022/10/202204/t20220424_3180350.html (accessed on 20 February 2025).
  60. Xue, K.; Gao, K.; Wang, T.; Zhang, X.; Zhang, S.; Kuang, F.; Zhu, D. Biomechanical Modeling of Rice Seedling Stalk Based on Multi-Scale Structure and Heterogeneous Materials. Comput. Electron. Agric. 2023, 210, 107904. [Google Scholar] [CrossRef]
  61. Ma, G. Study on Enhancement Mechanism of Low Loss Seedling Picking in Biochar and Air Ejection-Package Clamping Pick-up Device. Ph.D. Thesis, Jiangsu University, Zhengjiang, China, 2021. [Google Scholar]
  62. Zhou, J.; Sun, W.; Liang, Z. Research on the Construction of Discrete Element Flexible Model for Jerusalem Artichoke Root-Tuber at Harvest Stage. Trans. Chin. Soc. Agric. Mach. 2023, 54, 124–132. [Google Scholar] [CrossRef]
  63. Hou, J.; Xie, F.; Wang, X.; Liu, D.; Chen, Z. Measurement of Contact Physical Parameters of Flexible Rice Straw and Discrete Element Simula Tion Calibration. Acta Agric. Univ. Jiangxiensis 2022, 44, 747–758. [Google Scholar]
  64. Liu, W.; Zhang, G.; Zhou, Y.; Liu, H.; Tang, N.; Kang, Q.; Zhao, Z. Establishment of Discrete Element Flexible Model of the Tiller Taro Plant and Clamping and Pulling Experiment. Front. Plant Sci. 2022, 13, 1019017. [Google Scholar] [CrossRef]
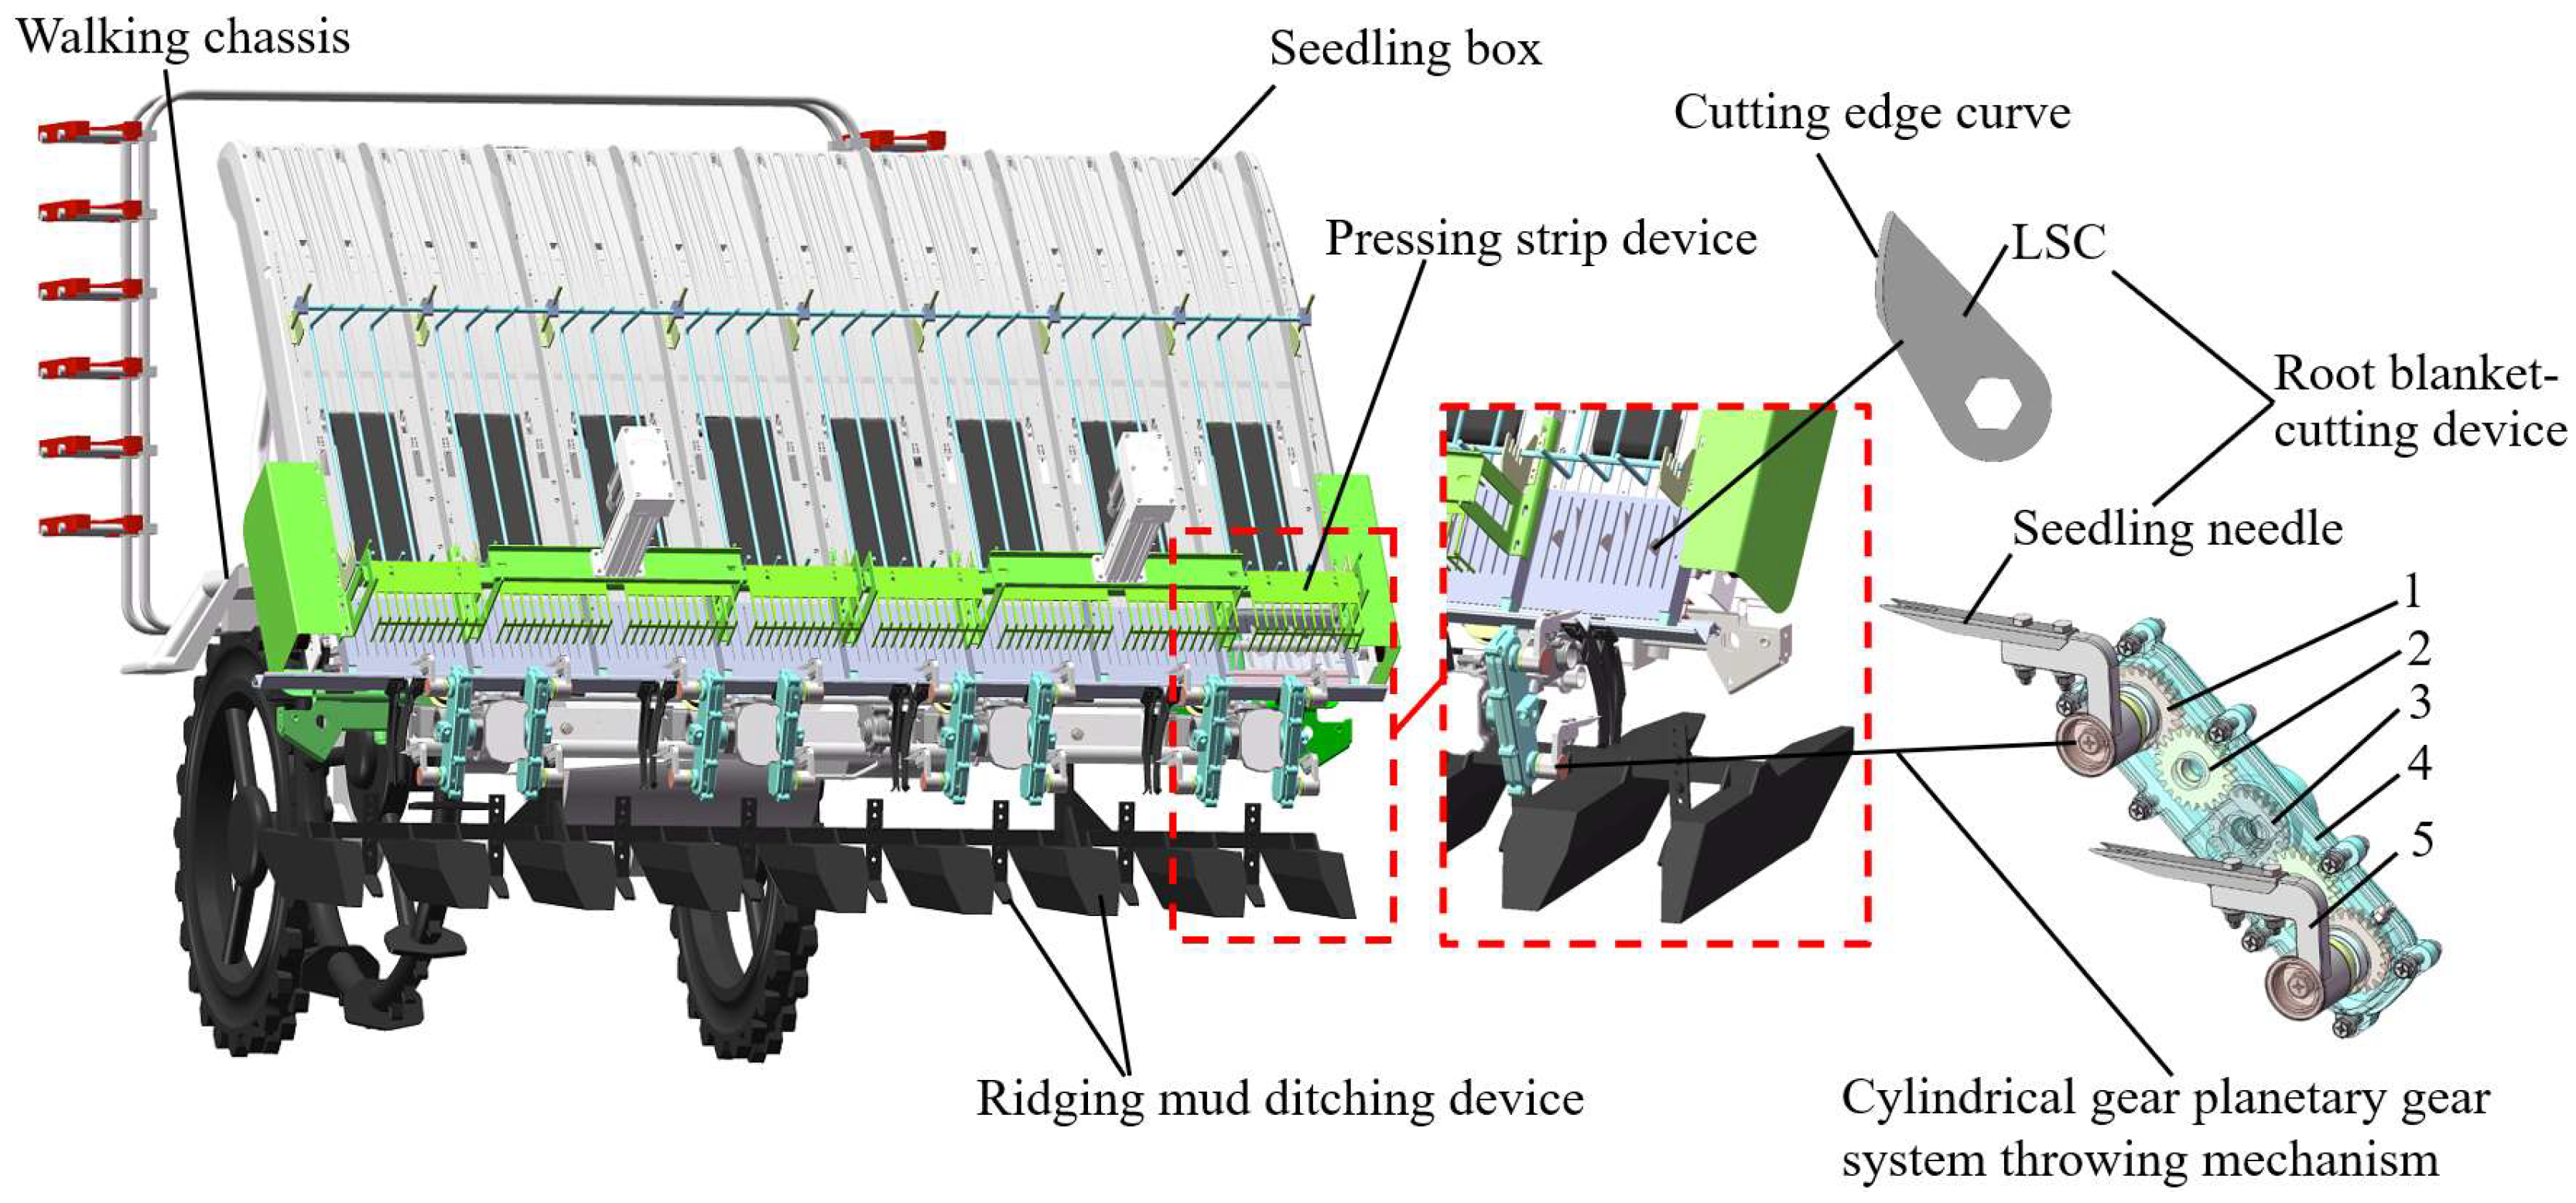
Figure 1. Schematic diagram of root blanket-cutting device: structure and installation position diagram of root blanket-cutting device. Note: 1. planetary gear; 2. middle gear; 4. sun gear; 3. rotary gearbox; and 5. transplanting arm.
Agriculture 15 02105 g001
Figure 2. Force analysis diagram of root blanket cutting into strips longitudinally process. Note: 1. The LSC begins to enter the root blanket cutting zone. 2 and 3. The LSC is located in the cutting zone. 4. The LSC leaves the root blanket cutting zone.
Agriculture 15 02105 g002
Figure 3. Force analysis diagram of RBS cutting into SB laterally process. Note: 1. side cutting-edge surface; 2. narrow side cutting-edge surface; 3. flat cutting-edge surface; 4. narrow side cutting-edge inclined surface; and 5. narrow flat cutting-edge inclined surface.
Agriculture 15 02105 g003
Figure 4. The structure diagram of LSCs arranged at three CAs: (a) CA 0°, (b) CA 30°, and (c) CA 60°.
Agriculture 15 02105 g004
Figure 5. Establishment of DEM flexible model and coupled DEM-MBD simulation models. Note: The Bond Status displays values of 0, 1, and 2. Here, 0 indicates that the bonds have not been created yet; 1 indicates the presence of active bonds between components; and 2 indicates that the bonds have been disconnected.
Agriculture 15 02105 g005
Figure 6. Data collection of (a) the RBS width and (b) the SB fracture surface contour linear fitting line in simulation.
Agriculture 15 02105 g006
Figure 7. Data collection of the breakage rate and the root injury rate of RBS and SB in simulation.
Agriculture 15 02105 g007
Figure 8. Test platform for rice blanket seedling root blanket longitudinal cutting and lateral cutting.
Agriculture 15 02105 g008
Figure 9. Measurement of (a) W R B S and (b) K S B in the physical tests.
Agriculture 15 02105 g009
Figure 10. The simulation of root blanket being longitudinally cut into strips process: the LSCs arranged at the CA 0° worked at (a) the beginning stage, (b) the intermediate stage, and (c) the end stage; the LSCs arranged at the CA 30° worked at (d) the beginning stage, (e) the intermediate stage, and (f) the end stage; and the LSCs arranged at the CA 60° worked at (g) the beginning stage, (h) the intermediate stage, and (i) the end stage.
Agriculture 15 02105 g010
Figure 11. The process simulation of RBS being laterally cut into SB by seedling needle.
Agriculture 15 02105 g011
Figure 12. Response surfaces of (a) T R B S , (b) W R B S , (c) M R B S , and (d) S R B S of LSCs arranged at the CA 0° with different sliding angles and cutter shaft speeds.
Agriculture 15 02105 g012
Figure 13. Response surfaces of (a) T R B S , (b) W R B S , (c) M R B S , and (d) S R B S of LSCs arranged at the CA 30° with different sliding angles and cutter shaft speeds.
Agriculture 15 02105 g013
Figure 14. Response surfaces of the (a) T R B S , (b) W R B S , (c) M R B S , and (d) S R B S of LSCs arranged at the CA 60° with different cutter shaft speed and sliding angle.
Agriculture 15 02105 g014
Figure 15. The (a) longitudinal cutting torque curves and (b) RBS width, RBS breakage rate, and RBS root injury rate of LSCs arranged at a CA of 60°.
Agriculture 15 02105 g015
Figure 16. Response surfaces for the effect of interaction terms on (a) F S B , (b) K S B (interaction term CE), (c) K S B (interaction term DE), (d) M S B , and (e) S S B .
Agriculture 15 02105 g016
Figure 17. The (a) lateral cutting resistance curves, and (b) SB fracture surface contour fitting line slope, SB breakage rate, and SB root injury rate of seedling needle.
Agriculture 15 02105 g017
Table 2. Design matrix and results of the CCD tests for LSCs arranged at three CAs.
OrderFactorSimulation Data
CA 0°CA 30°CA 60°
A
(°)
B
(r/min)
T R B S (N·m) W R B S (mm) M R B S (%) S R B S (mm) T R B S (N·m) W R B S (mm) M R B S (%) S R B S (mm) T R B S (N·m) W R B S (mm) M R B S (%) S R B S (mm)
1456010.5216.967.286.337.3516.955.284.984.4517.432.895.36
2576010.4916.727.246.416.9117.413.924.764.0418.093.454.33
3451007.6315.838.946.786.1216.286.955.543.4517.563.785.18
4571006.0416.588.826.725.1517.436.075.173.2417.684.284.89
545809.5516.318.156.426.9316.556.435.153.8117.623.525.24
657809.5716.288.056.525.9517.325.424.853.5218.154.084.48
751609.8017.126.956.386.5216.844.984.914.3317.783.274.82
8511007.0316.058.366.735.4316.956.585.343.3217.894.185.07
951808.9716.157.076.496.0116.516.845.213.7617.944.344.41
1051808.9716.277.076.496.0116.516.845.213.7617.974.344.41
1151808.9716.387.076.496.0116.526.845.213.7618.014.344.41
1251808.9716.267.076.496.0116.646.845.213.7618.054.344.41
1351808.9716.197.076.496.0116.666.845.213.7618.084.344.41
Table 3. ANVOA results related to test indicators for LSCs arranged at three CAs.
SourceCA 0°CA 30°CA 60°
T R B S W R B S M R B S S R B S T R B S W R B S M R B S S R B S T R B S W R B S M R B S S R B S
Model<0.001<0.001<0.001<0.001<0.001<0.001<0.001<0.001<0.001<0.001<0.001<0.001
A 0.0570.1920.6090.0625<0.01<0.01<0.01<0.01<0.01<0.01<0.01<0.01
B <0.01<0.01<0.01<0.01<0.010.146<0.01<0.01<0.010.393<0.010.120
A × B 0.030<0.010.846<0.010.0430.0380.3280.7240.016<0.010.8250.038
A 2 0.0420.935<0.010.570<0.010.018<0.010.0200.0130.023<0.010.034
B 2 <0.010.0110.047<0.010.4990.037<0.010.793<0.01<0.01<0.01<0.01
Lack of Fit/0.099///0.059///0.170/
C.V.%3.2300.8292.6000.3401.7300.8023.7201.2300.8450.4273.3303.070
R 2 0.9710.9180.9570.9850.9820.9250.9670.9480.9950.9360.9600.916
R A d j 2 0.9510.8600.9260.9750.9690.8720.9430.9100.9860.8900.9310.855
Adeq Precision21.27613.81817.40429.25429.65212.42119.67817.79257.39014.06316.88511.047
p-values less than 0.05 indicate that model terms are statistically significant, while values less than 0.01 indicate highly significant model terms.
Table 4. Design matrix and results of the BBD test.
NO.Factor F S B
(N)
K S B M S B
(%)
S S B
(%)
C
(°)
D
(mm)
E
(r/min)
151425012.36−1.6217.8614.25
220142506.41−2.8712.379.35
351625012.88−1.6516.2412.41
420162506.87−3.0510.898.47
551520011.45−1.4716.5314.39
620152005.32−2.9110.6310.05
75153009.83−1.4118.4912.98
820153005.67−2.1313.288.85
912.5142009.52−1.9714.7212.86
1012.5162009.78−1.8212.8111.23
1112.5143008.64−1.4517.1511.67
1212.5163008.91−2.0615.3110.29
1312.5152509.22−2.0414.9311.62
1412.5152508.95−1.9514.8711.35
1512.5152509.06−1.8815.0211.91
1612.5152509.15−2.0914.7911.48
1712.5152509.35−2.0314.9511.73
Table 5. ANOVA of the quadratic polynomial model.
Source F S B K S B M S B S S B
F-Valuep-ValueF-Valuep-ValueF-Valuep-ValueF-Valuep-Value
Model109.260<0.0137.640<0.001583.610<0.001143.650<0.001
C 873.970<0.01261.220<0.011022.490<0.011069.670<0.01
D 4.0300.0854.8600.063391.750<0.01117.210<0.01
E 16.100<0.0111.2700.012759.840<0.0180.210<0.01
C × D (AB)0.0130.9130.48760.5080.327300.58526.5800.037
C × E (AC)13.700<0.018.3300.0237.9500.02580.3150.592
D × E (BC)0.0000.98612.520<0.010.0820.78310.4460.525
C 2 6.5000.03820.980<0.0149.250<0.015.9000.045
D 2 39.450<0.011.3000.2916.6300.03689.1900.019
E 2 33.270<0.0119.770<0.0116.060<0.013.5200.103
Lack of Fit5.780.0622.5800.1913.3100.1390.3990.762
C.V.%2.9505.2900.8291.630
R 2 0.9930.9800.9980.995
R A d j 2 0.9840.9540.9970.988
R P r e d 2 0.9060.7760.9840.974
Adeq Precision36.47418.16483.88841.084
Disclaimer/Publisher’s Note: The statements, opinions and data contained in all publications are solely those of the individual author(s) and contributor(s) and not of MDPI and/or the editor(s). MDPI and/or the editor(s) disclaim responsibility for any injury to people or property resulting from any ideas, methods, instructions or products referred to in the content.